
Abstract
This article addresses a telling issue in academic science: the clarity of criteria for tenure and promotion reported by women and men faculty in scientific fields. Data from faculty surveyed in nine US research universities point to ways that formal and informal organizational indicators predict the clarity of evaluation reported by women and men. Unexpected patterns occur by gender. Among men, both formal and informal organizational indicators, as well as field, predict their reported clarity of evaluation. Among women, however, only informal organizational indicators, namely, frequency of speaking with faculty about research and departmental climate, are significant predictors. Further, overall, informal indicators are stronger predictors of clarity than are formal indicators, and some field differences occur. These findings have implications for national and regional science policies and for the practices and policies of universities.
Introduction
Gender relations in academic science both reveal distinctive dimensions of inequality and shape critical social outcomes. First, scientific fields are powerful and often define what is taken for granted by literally billions of people (Cozzens and Woodhouse 1995), although some scientific claims can be hotly contested by the public (Hackett 2008; Shapin 2008). To be in control of scientific research is to direct the future, and this is consequential and valued (Wajcman 1991). Second, science connects with key social institutions, including higher education, and has molded the modern university through research directions and through the specialization and autonomy of faculty (Montgomery 1994). Third, science is an institution with immense inequalities in status and in material and symbolic rewards (Hermanowicz 1998, 2009; Long and Fox 1995; Stephan 2012; Zuckerman 1988). Gender inequality persists in academic science; and in comparison to men, women have lower ranks, less prestigious affiliations, and less recognition (Bailyn 2003; Fox 2001; Lincoln et al. 2012; Long 2001; Long and Fox 1995; Sonnert and Holton 1995; Xie and Shauman 2003). Thus, because science is powerful and hierarchical, and because gender divisions continue in these fields, women’s status and condition in scientific fields not only reflect gender hierarchies in society but also legitimate and support the hierarchies of women and men (Fox 2001). Consequently, science is a strategic site for the study of gender.
This article addresses a telling dimension of gender and academic science: 1 the clarity of criteria for tenure and promotion, as reported by women and by men scientists who hold tenured and tenure-track positions in nine research universities. The central questions are: (1) What predicts the clarity of criteria for tenure and promotion reported by women and men in academic science? (2) How do formal organizational indicators of academic rank and experience and informal indicators of social integration in home departments and departmental climates, as well as broad field, operate as predictors of the clarity? (3) Why do the predicted patterns of clarity among women and men matter for understanding academic science and science policy?
In academic science, and higher education in general, the ways and means of evaluating faculty are fundamental organizational processes (Braskamp and Ory 1994; Seldin 1984; Whitman and Weis 1982), reflecting priorities of departments and institutions (Wilson and Beaton 1993). The evaluation of faculty and the clarity of criteria for tenure and promotion are sensitive issues, provoking potential consternation, frustration, and alienation (Braskamp and Ory 1994; Johnson and Harvey 2002; Seldin 1984; Whitman and Weiss 1982). The issue of “how much of what kind of work is enough” (Huber 2002, 78) is salient for women who are more likely than men to say that they do not understand the criteria for evaluation in their positions in science units (Roth and Sonnert 2011). The issue is especially notable for promotion to rank of full professor because the criteria are murkier than they are for promotion from assistant to associate professor and there is no established time line (Britton 2010; Fox and Colatrella 2006; Misra et al. 2011). 2
Accordingly, clarity in criteria of evaluation draws attention in various reports and initiatives to support participation and performance in academic science (and other fields in higher education). The report of the American Association for Higher Education (Rice, Sorcinelli, and Austin 2000) concludes that faculty members’ “lack of clarity” about criteria for tenure represents one of the three “core, consistent, and interwoven concerns” across fields and institutions in academia. An analysis of US medical colleges (Bunton and Corrice 2011) cites perceived/reported clarity of expectations for promotion as “one of the lowest areas of satisfaction among academic medicine faculty members” with implications for turnover. The Collaborative on Higher Education (COACHE 2006) points to a significantly lower clarity about criteria and standards of evaluation among women compared to men faculty as a focal issue for higher education. The National Science Foundation (NSF) ADVANCE Institutional Transformation program includes clarity of evaluation as a factor that supports the advancement of women in academic science and engineering (Bilimoria and Liang 2012).
In this article, clarity of criteria for tenure and promotion is assessed by faculty responses to the survey question, “to what extent do you think that the criteria for tenure and promotion are clear in your home school/unit?” The form of this question leans toward perceptions of clarity. Perceptions of faculty are important because they reflect reported experiences with, and understandings about, evaluation (Nathan 1998). 3 However, perceptions are not the same as administrative indicators of clarity such as the written guidelines that studies have found to benefit women (Baron et al. 2007; Cook and Waters 1998; McGuire 2002; Reskin 2000; Roth and Sonnert 2011). These studies argue that bureaucratic forms—with rules and “rational procedures” (Weber 1946)—support gender equity by increasing the use of relatively objective criteria for performance (Baron et al. 2007), open channels of information (McGuire 2002; Roth and Sonnert 2011), and accountable personnel practices (Elvira and Graham 2002; Reskin 2000). When criteria and processes of evaluation are loosely defined and a matter of “judgment,” on the other hand, studies have found that bias in assessment is more likely to result, and persons with “majority group characteristics” (gender, race, and ethnicity) are more likely to be regarded as the superior candidates (see Blalock 1991; Evetts 1996; Long and Fox 1995; McIlwee and Robinson 1992; Reskin 2003; Tierney and Bensimon 1996). Others, however, have regarded bureaucracy as a cover and disguise for “objectivity” within organizations (Acker 1990; Morley 2001).
In this study, the focal independent variables reflect academic seniority and rank, social integration, departmental climate, and field. Seniority, years in the institution, and position/rank are the more formal organizational indicators. Seniority is expected to positively predict perceived clarity through duration of potential exposure to, and observation of, departmental criteria for evaluation. Rank reflects organizational position, and higher rank is expected to positively predict clarity through actual involvement in processes of evaluation. Social integration—represented by frequency of speaking with faculty in the home unit—is a less formal indicator of organizational location. Frequency of speaking is expected to predict reported clarity through social contacts that transmit and exchange norms and expectations of a unit. Departmental climates, depicted as collegial, stimulating, or relaxed work environments, are also relatively informal organizational features that may predict clarity through the ways that standards of evaluation get communicated and understood. Finally, broad field of science, represented by computer science, engineering, and science departments, is a control variable.
I expected that the formal organizational indicators, seniority and rank, would be stronger predictors of clarity of evaluation for women than for men. This is because women depend more frequently upon formal mechanisms for information (Cook and Waters 1998; Elvira and Graham 2002; Evetts 1996; McIlwee and Robinson 1992), including, potentially, those about evaluative processes. Correspondingly, I expected that the informal institutional indicator, speaking with faculty, would be a weaker predictor of clarity for women than for men. Location in collegial departmental climates, in particular, was expected to predict clarity for both women and men. This is because collegial climate is a construct represented by dimensions of helpful, fair, and inclusive, associated with hospitable environments for faculty (Bilimoria and Liang 2012; Callister 2006; Jordan and Bilimoria 2007), and in turn, potentially open communication of standards of evaluation (Blau 1994; Kopelman, Brief, and Guzzo 1990).
The findings, however, run counter to these expectations and point to these unexpected patterns. Among men, both formal and informal organizational indicators, as well as field, significantly predict reported clarity of evaluation. However, among women, informal organizational indicators are the significant predictors of clarity. Analyzing predicted probabilities from a joint model provides additional conclusions about predictors for women compared to men scientists.
Method
Data
The data come from mail surveys of tenured and tenure-track faculty members in computer science, engineering, and six fields of science (biology/life sciences, chemistry, earth/atmospheric, mathematics, psychology, and physics) in nine research universities. One baseline university was surveyed in 2002/2003 and eight peer institutions in 2003/2004. The first institution indicated the eight as peers in high national stature, particularly within scientific and technological fields.
Each of these (nine) institutions was listed among the Research I and Doctoral Research Extensive categories of the Carnegie classification in use at the time of the survey. The (nine) institutions are private and public universities that vary in size and regional locations within the United States (the distributions on these characteristics of the institutions are provided in Appendix A). These institutions represent those with doctoral-granting departments, strong standing in science/engineering fields, and high levels of nationally awarded research grants. This is an important grouping for the training of graduate students and for research activity and impact, especially in scientific fields that depend upon human and material resources. These universities are an influential category, but they do not represent the universe of types of higher education institutions in the United States.
This study specifies the population of male and female tenured and tenure-track faculty, by field (represented by department) in each of these nine institutions (the baseline institution and the eight “peer institutions”). To do this, we obtained the roster of faculty members for the first institution and canvassed completely the websites of the other eight institutions in order to produce a complete enumeration of tenured and tenure-track faculty in computer science, engineering, and the six fields of sciences, by gender and institution.
In the first institution, the group surveyed was the full population of women (n = 68) and a stratified random sample of men by field (n = 146). In the other eight institutions, we surveyed the full population of women, except for sampling in life sciences and psychology (n = 437), and a stratified random sample of men by field (n = 528). Thus, this study is distinguished by its inclusion of the complete population of women faculty, except in the two fields sampled in the eight institutions, and a stratified random sample of men from known and specified populations.
Of the 1,154 questionnaires distributed in 2002-2004, twenty-five went to faculty who turned out to be ineligible because they had left the department, retired, or were deceased. Removing ineligibles from the base, the total number of respondents was 765, and the overall response rate to the survey was 66 percent. The response rate for faculty in engineering (67.4 percent) was slightly higher than for those in computing (64.5 percent) and sciences (65.5 percent). Women’s response rate (67.8 percent) was slightly higher than men’s (65.2 percent).
Variables
Dependent Variable
The dependent variable, clarity of evaluation, is measured with the survey question, “To what extent do you think that the criteria for tenure and promotion are clear in your home unit?” The response categories are a four-point scale of “not at all clear,” “slightly clear,” “moderately clear,” and “very clear.” For the analyses described subsequently, we code clarity as dichotomous categories of “very clear,” compared to less than very clear (that is, “not at all,” “slightly,” or “moderately”). We use these categories because, conceptually, the interest is in “very clear” clarity compared to that less clear; and because of the way in which the responses distributed. Specifically, for the cases complete (N = 692) on the dependent and independent variables considered in the analyses, 42.2 percent reported “very clear” criteria of evaluation, compared to 43.5 percent “moderately,” 10.7 percent “slightly,” and 3.6 percent “not at all clear.” 4
Independent Variables
Formal experience, measured by seniority, is the number of years employed at current institution, transformed into log (years in the institution + 1). The log transformation minimizes the effects of outliers in number of years at the institution (that is, skewness in the distribution of the variable) and the addition of the value of one accommodates the seniority of a person who has just joined the institution (Branskamp, Muffo, and Langston 1978; Dokko, Wilk, and Rothbard 2009). The transformation makes sense because the expected effect for clarity of an additional year after twenty-five years, for example, should be much less than the expected effect of an additional year after one year (that is, additional years should provide smaller increments in clarity).
Formal position in the university, measured by academic rank, is coded as full professor and as associate professor, each compared with assistant professor as the reference category in the analyses.
Social integration is measured by frequency of speaking with faculty in the home unit about research projects and research interests. Frequency of speaking is coded as two variables, speaking “weekly” and speaking “daily,” with the comparison category of speaking less than weekly (that is, “once or twice a month,” “once or twice a semester,” or “almost never”). 5
Departmental climate refers to respondents’ perceptions of values, orientations, and practices—or atmosphere—of the unit (Peterson and Spencer 1990; Reichers and Schneider 1990). For most persons familiar with universities, departmental climate has face validity and is a reasonable way to conceptualize the atmosphere of a unit (Peterson and Spence 1990, 8) or “the way things are around here” (Reichers and Schneider 1990, 22). In this study, the measures of climate are based on respondents’ reports of the atmosphere of their departments in answers to questions asking them to rank their home unit along eight, five-point scales of formal–informal, boring–exciting, unhelpful–helpful, uncreative–creative, unfair–fair, competitive–noncompetitive, stressful–unstressful, and noninclusive–inclusive.
Assuming that the data are at least ordinal (Agresti 1990), we use factor analysis to identify relationships among these (eight) items. 6 The factor analysis identified three constructs. The first construct is a “collegial climate” with items that characterize the department as helpful, fair, and inclusive. The second construct is a “stimulating climate” with items that characterize the department as informal, exciting, and creative. The third is a “relaxed climate” with items characterizing the department as noncompetitive and unstressful. Table 1 presents the correlations among the items and the factor loadings.
Dimensions of Departmental Climate: Correlation Matrix and Factor Loadings for Underlying Constructs.

Note: N = 692. α Reliability measured by Cronbach’s alpha. The boldface values are the loadings for those variables used.
*Correlation is significant at the .05 level (two-tailed).
**Correlation is significant at the .01 level ( two-tailed).
On the bases of the underlying items in these constructs, unweighted scales were created, representing the mean values of the responses to the corresponding variables. Cronbach’s alpha assesses the internal consistency of the scales, that is, the extent to which respondents’ scores cohere in measuring a construct (Crocker and Algina 2006). The resulting Cronbach’s alpha measures of reliability are .747 for the collegial climate scale, .679 for the stimulating climate scale, and .697 for the relaxed climate scale (Table 1). These reliability levels are sufficiently high for inclusion of the scales in the analyses.
Field is coded as engineering (across engineering fields) and as science (biological/life sciences, chemistry, earth/atmospheric, mathematics, psychology, and physics) with computer science as the comparison category in the analyses.
Method of Analysis
The method employs two types of analysis: (1) logistic regression models for each gender and (2) predicted probabilities from a joint model (which also includes gender and gender-interaction terms). The second approach provides additional conclusions about predictors for one gender compared to the other.
First, in order to predict clarity of evaluation in academic science, logistic regression models were estimated by gender. The logistic regression models express the relationship between the dependent variable, clarity of evaluation (very clear, compared to less clear), and the independent variables. The models were estimated separately for men and women, and so any sampling imbalances need not be offset by weighting (Winship and Radbill 1994).
The logistic regression models present the predictive value (or log odds) that an independent variable has for the dichotomous variable of very clear criteria of evaluation for tenure and promotion, compared to less clear criteria. One can interpret the coefficient from a logistic regression as the change in log odds of a response per unit of change in a predictor variable. The models do not posit a particular causal ordering among independent variables; rather, the focus is on the form of the relationships between reported clarity of criteria and the independent variables of interest.
With separate models by gender, the particular values of coefficients are not assessed directly for one group (men) compared to another (women) (Menard 2002). Thus, a second, alternative method uses predicted probabilities to compare the groups (Long 2009). 7 These predicted probabilities are unaffected by differences in the residual variation between groups, and allow comparisons. This approach requires multiple tests because group differences may vary with the levels of the variables in the models. The approach also involves deciding which comparisons are most interesting and which regions of the data are substantively reasonable for assessment (Long 2009). The approach results in potentially “complex conclusions on how groups differ in the effect of a variable” (Long 2009, 1).
Using the joint model, that is, a model with gender, independent variables, and interactions among gender and independent variables, we can evaluate the predicted probability for a particular variable with the other variables at specific levels (for categorical variables) or a specific value (for continuous variables) (Long 2009). The joint model contains four categorical variables (gender, academic rank, frequency of speaking, and field) and four continuous variables (transformed years at institution and three climate variables) along with the interactions.
Findings
Descriptive Profile of Clarity, by Gender
The level of reported clarity about criteria for tenure and promotion varies by gender. The distributions show where the variations in clarity exist (Appendix B). 8 Men are more likely (48.7 percent) than women (34.1 percent) to report that the criteria for tenure and promotion are “very clear”; this is the category of clarity with broadest gender gap, a 15 percent difference between men and women faculty. Women, on the other hand, are more likely (49 percent) than men (39.1 percent) to report that criteria are “moderately clear”; and somewhat more likely to report that criteria are “slightly clear” (13 percent compared to 8.9 percent). Only a small percentage of women and men (3.9 percent and 3.4 percent, respectively) report that criteria are “not all clear.”
Models of Clarity of Evaluation, by Gender
Table 2 shows the independent variables used to predict clarity of evaluation for men and for women. This table presents the log odds for each independent variable on the dichotomous dependent variable (“very clear” compared to “less than very clear” criteria of evaluation), by gender, when the other independent variables are controlle.d.
Binary Logistic Regressions for Dependent Variable: Clarity of Evaluation, by Gender.
***p < .001. **p < .01. *p < .05. †p < .10.
Men
Among men, formal experience, informal social integration and departmental climate, and field are significant (or marginally significant) predictors of having very clear perceptions of clarity. First, years at the institution 9 marginally increase the likelihood of perceiving criteria very clearly (log odds = .308 and p = .080), as does being a full professor (log odds = .770 and p = .098), while being an associate professor does not. Thus, among men, the duration of potential exposure to departmental criteria of evaluation (including, perhaps, observing who is, or is not, tenured/promoted) marginally increases the probability of perceiving criteria very clearly.
Second, among men, an indicator of social integration—speaking daily about research prospects and interests with faculty in the home unit—is one of the strongest predictors (log odds = .781 and p = .009) of clarity. Speaking weekly with faculty in the home unit, however, has no influence. Speaking weekly may be too weak a level of social integration to predict clarity; and speaking daily, on the other hand, may be key in actually transmitting and exchanging norms and expectations about evaluation, addressed further in the conclusions.
Third, as expected, the collegial departmental climate (helpful, fair, and inclusive) predicts clarity (log odds = .306 and p = .047). Being in a department perceived to be stimulating or one perceived as relaxed does not predict clarity for men. Importantly, being in a collegial department, as well as speaking daily, may be the cause, effect, or both cause/effect of clarity, addressed in the conclusions.
Finally, being in the sciences increases men’s likelihood (log odds = 1.24 and p = .006) of reporting very clear criteria for tenure and promotion, with other variables held constant. It may be that science fields (biology/life sciences, chemistry, earth/atmospheric, mathematics, psychology, and physics) have a higher consensus about standards for research than do the more applied computing fields (the comparison category). Being in engineering increases the likelihood of very clear criteria as well, but it is not as strong a predictor (log odds = .887 and p = .050) as being in science.
Women
Fewer variables are significant predictors of clarity among women. First, contrary to expectation, neither indicator of formal organizational position—seniority nor academic rank—predicts women’s clarity. That is, years in the institution do not increase the probability of very clear evaluation; and neither does being a full or associate professor compared to assistant professor.
Second, for both women and men, the same informal indicators—speaking daily and collegial departmental climate—predict clarity. For women, speaking about research prospects and interests daily significantly increases the probability of very clear perceptions about criteria (log odds = 1.018 and p = .007). Being in a department perceived to be collegial stands out as the strongest (log odds = .947 and p < .001) of all predictors among women. Again, noted is that location in such a departmental climate, as well as speaking, may be cause, effect, or both cause/effect of perceived/reported clarity. Third, field does not increase the probability of very clear perception about the criteria for tenure and promotion among women.
Gender Group Comparisons Using Predicted Probabilities
To compare gender groups, we use an approach with multiple tests because group differences may vary with the levels of the variables in the models. This involves planning which comparisons are most interesting and which regions of the data are substantively reasonable for assessment (Long 2009). The key results from the joint model (Table 3) appear in Figures 1 –6, with formal indicators presented in Figures 1 –3 and informal indicators in Figures 4 –6.
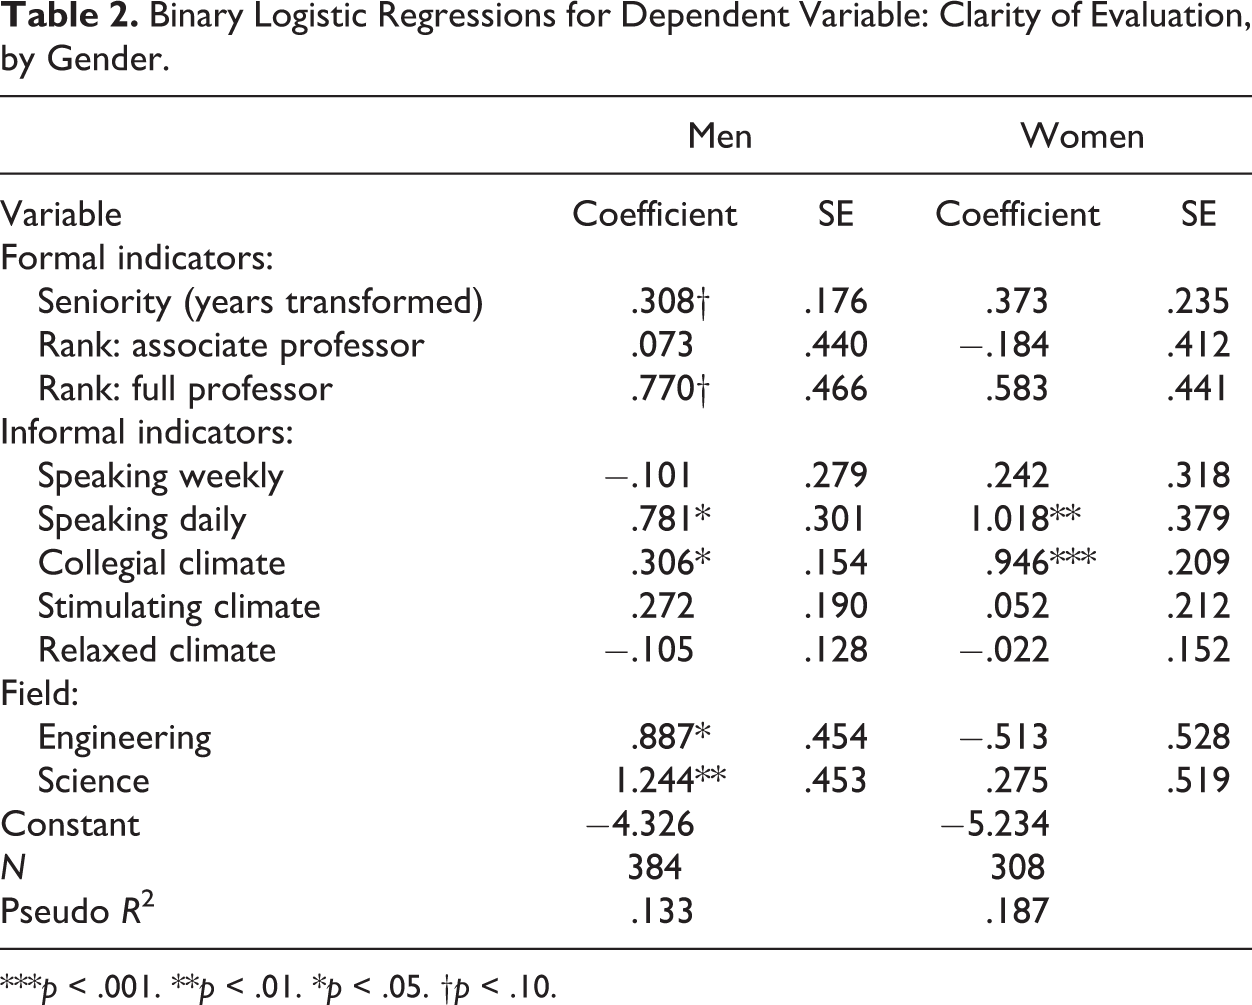
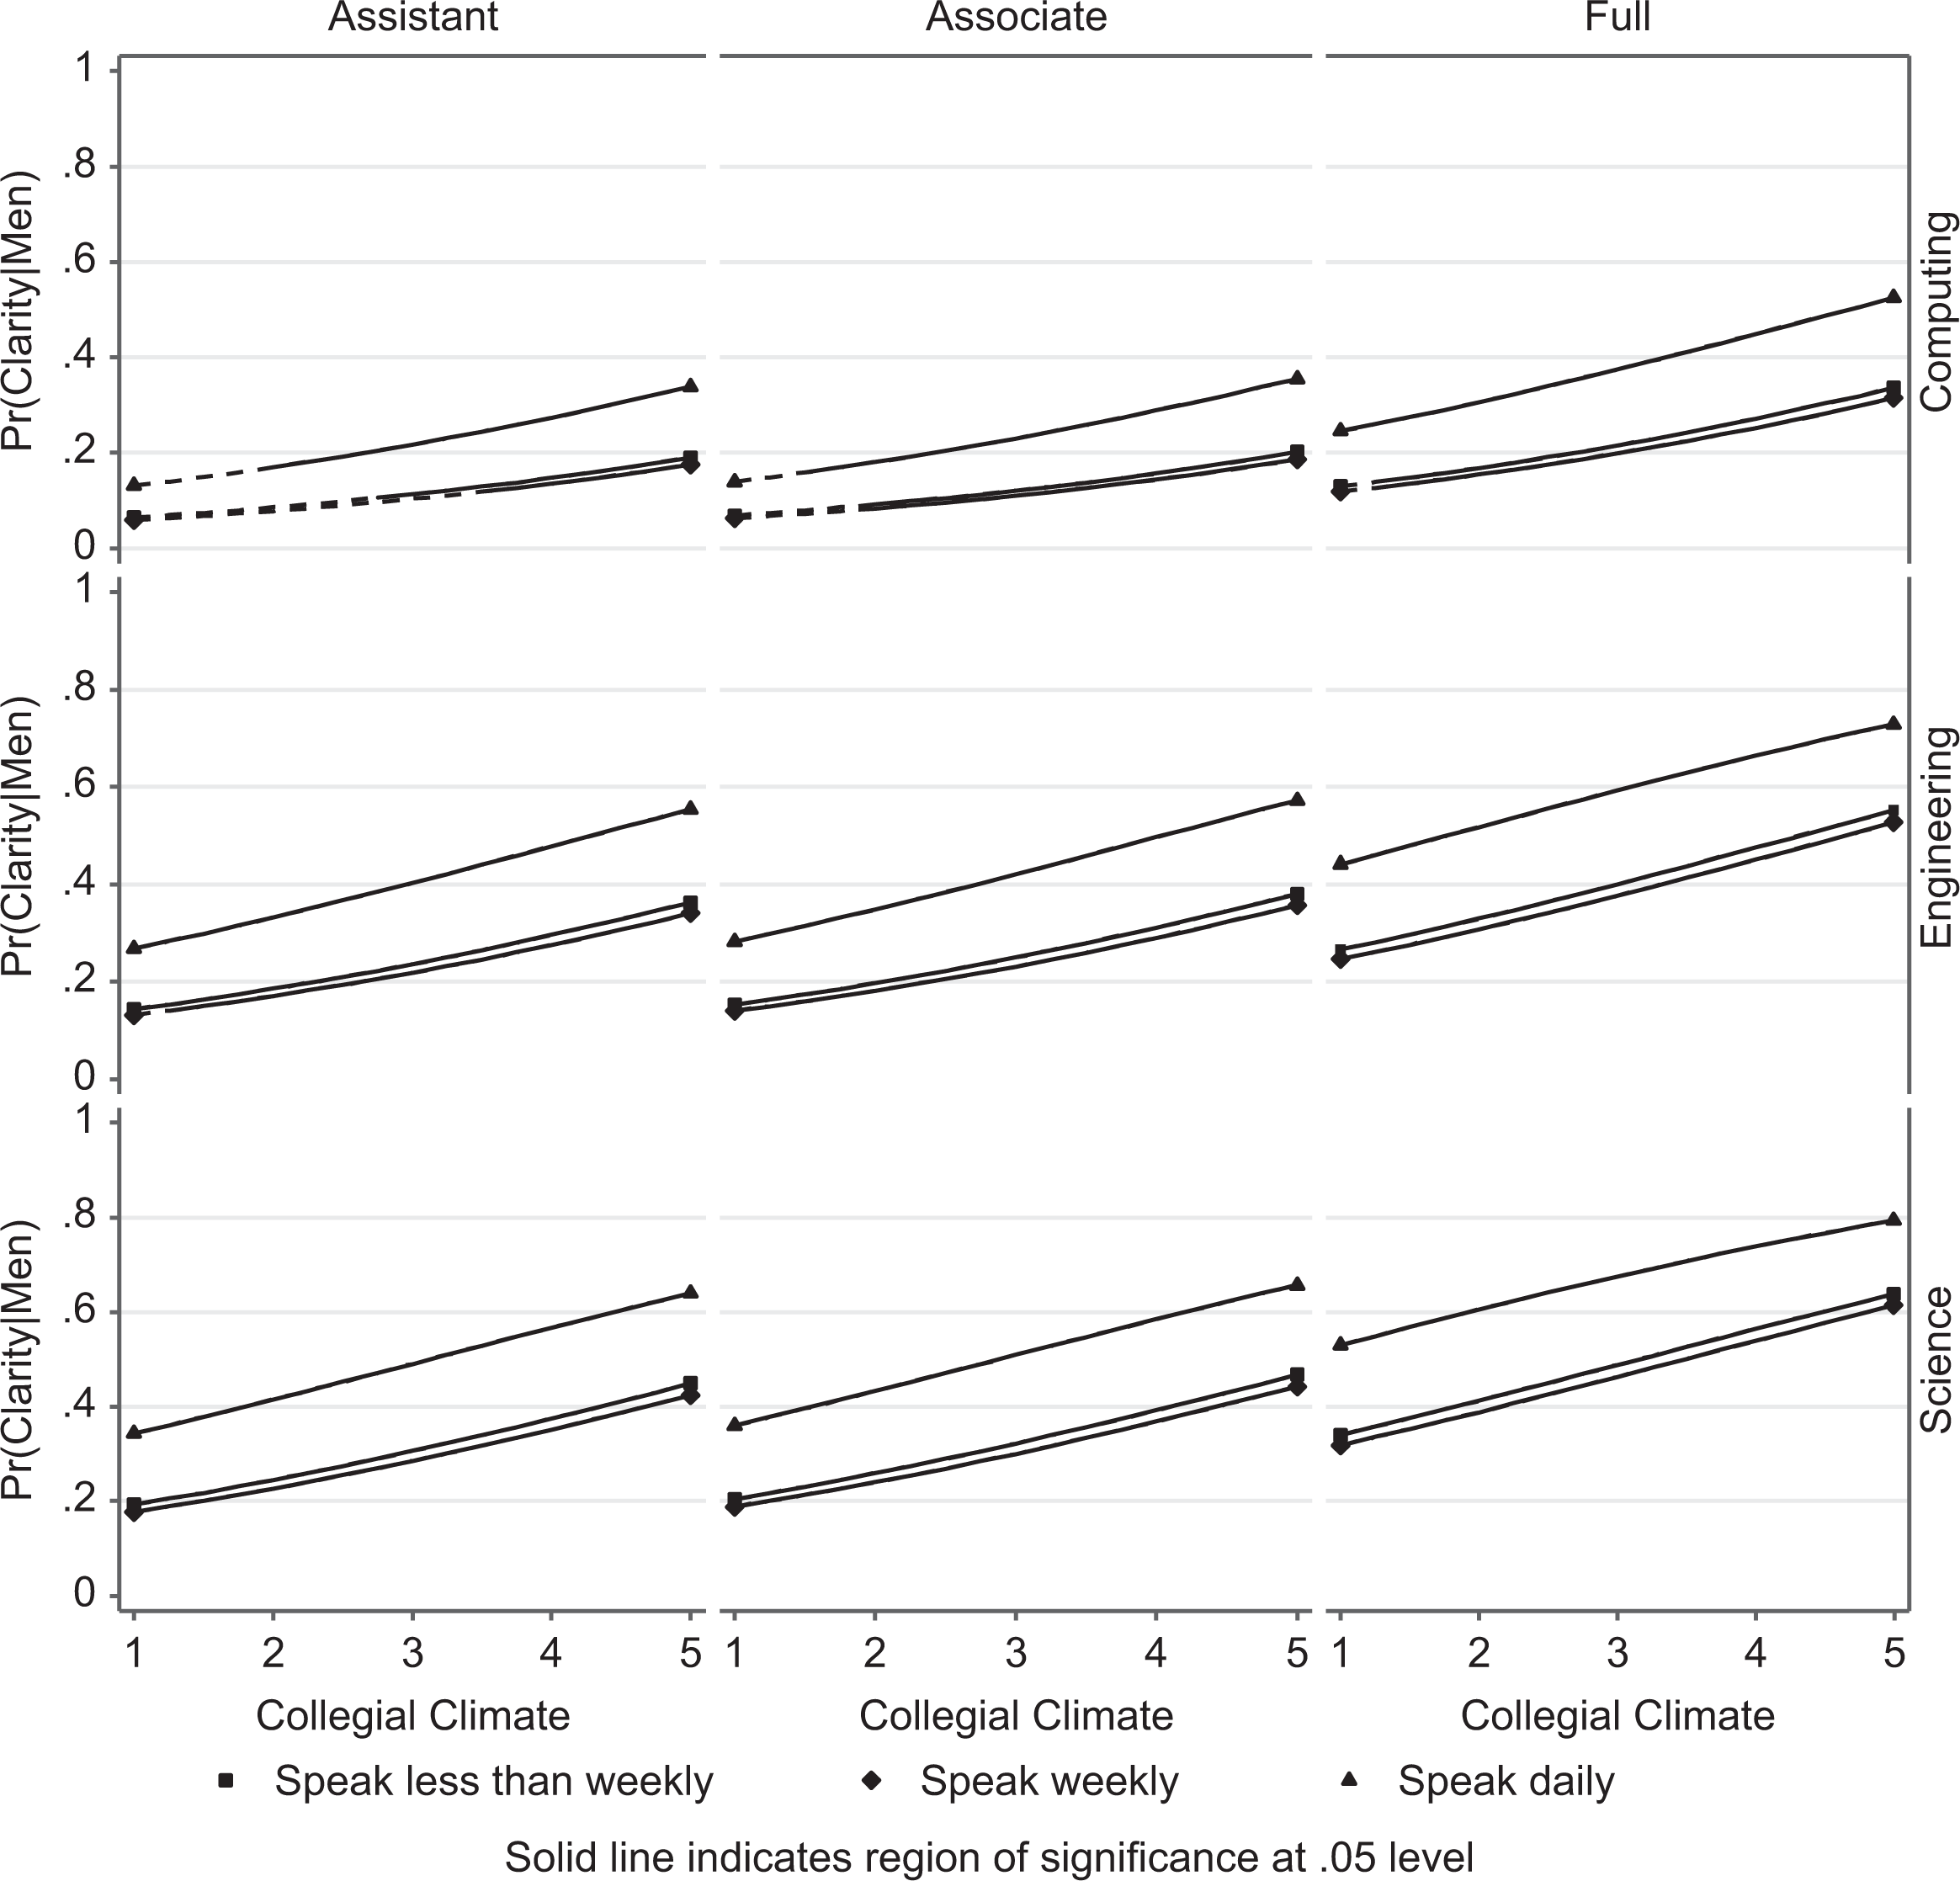
Probability of clarity for men by years at institution and frequency of speaking for each field and rank.
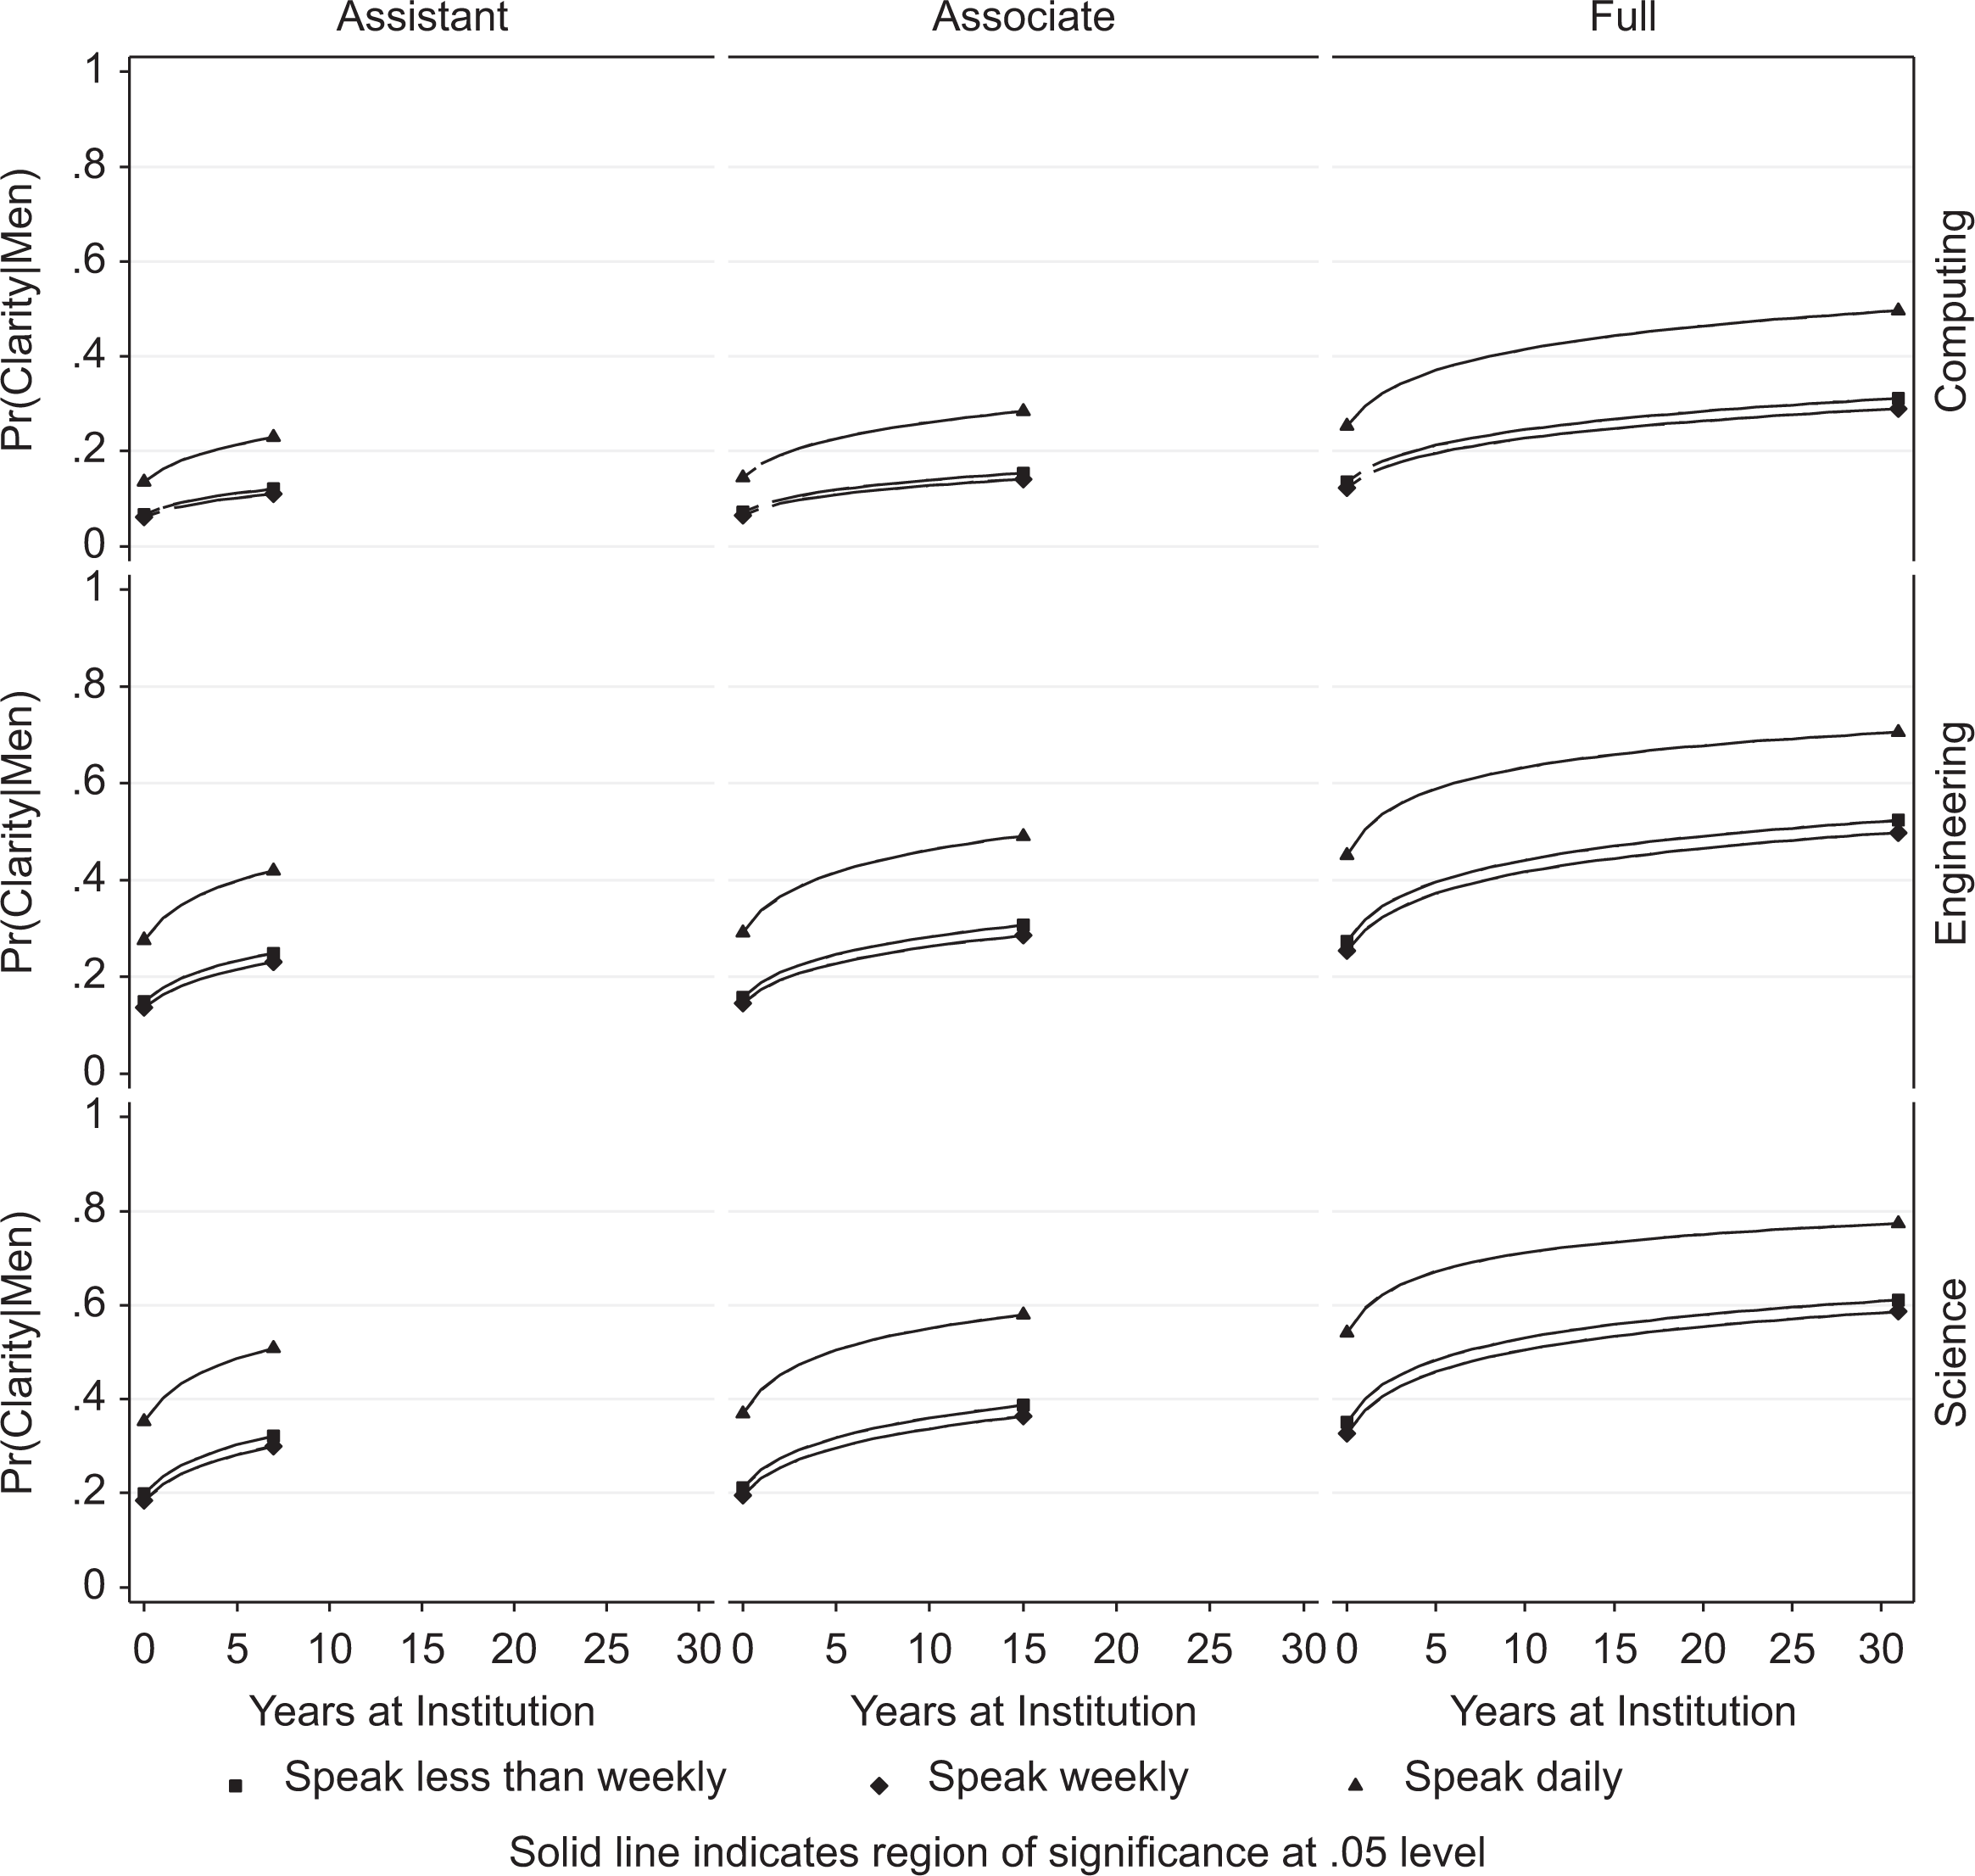
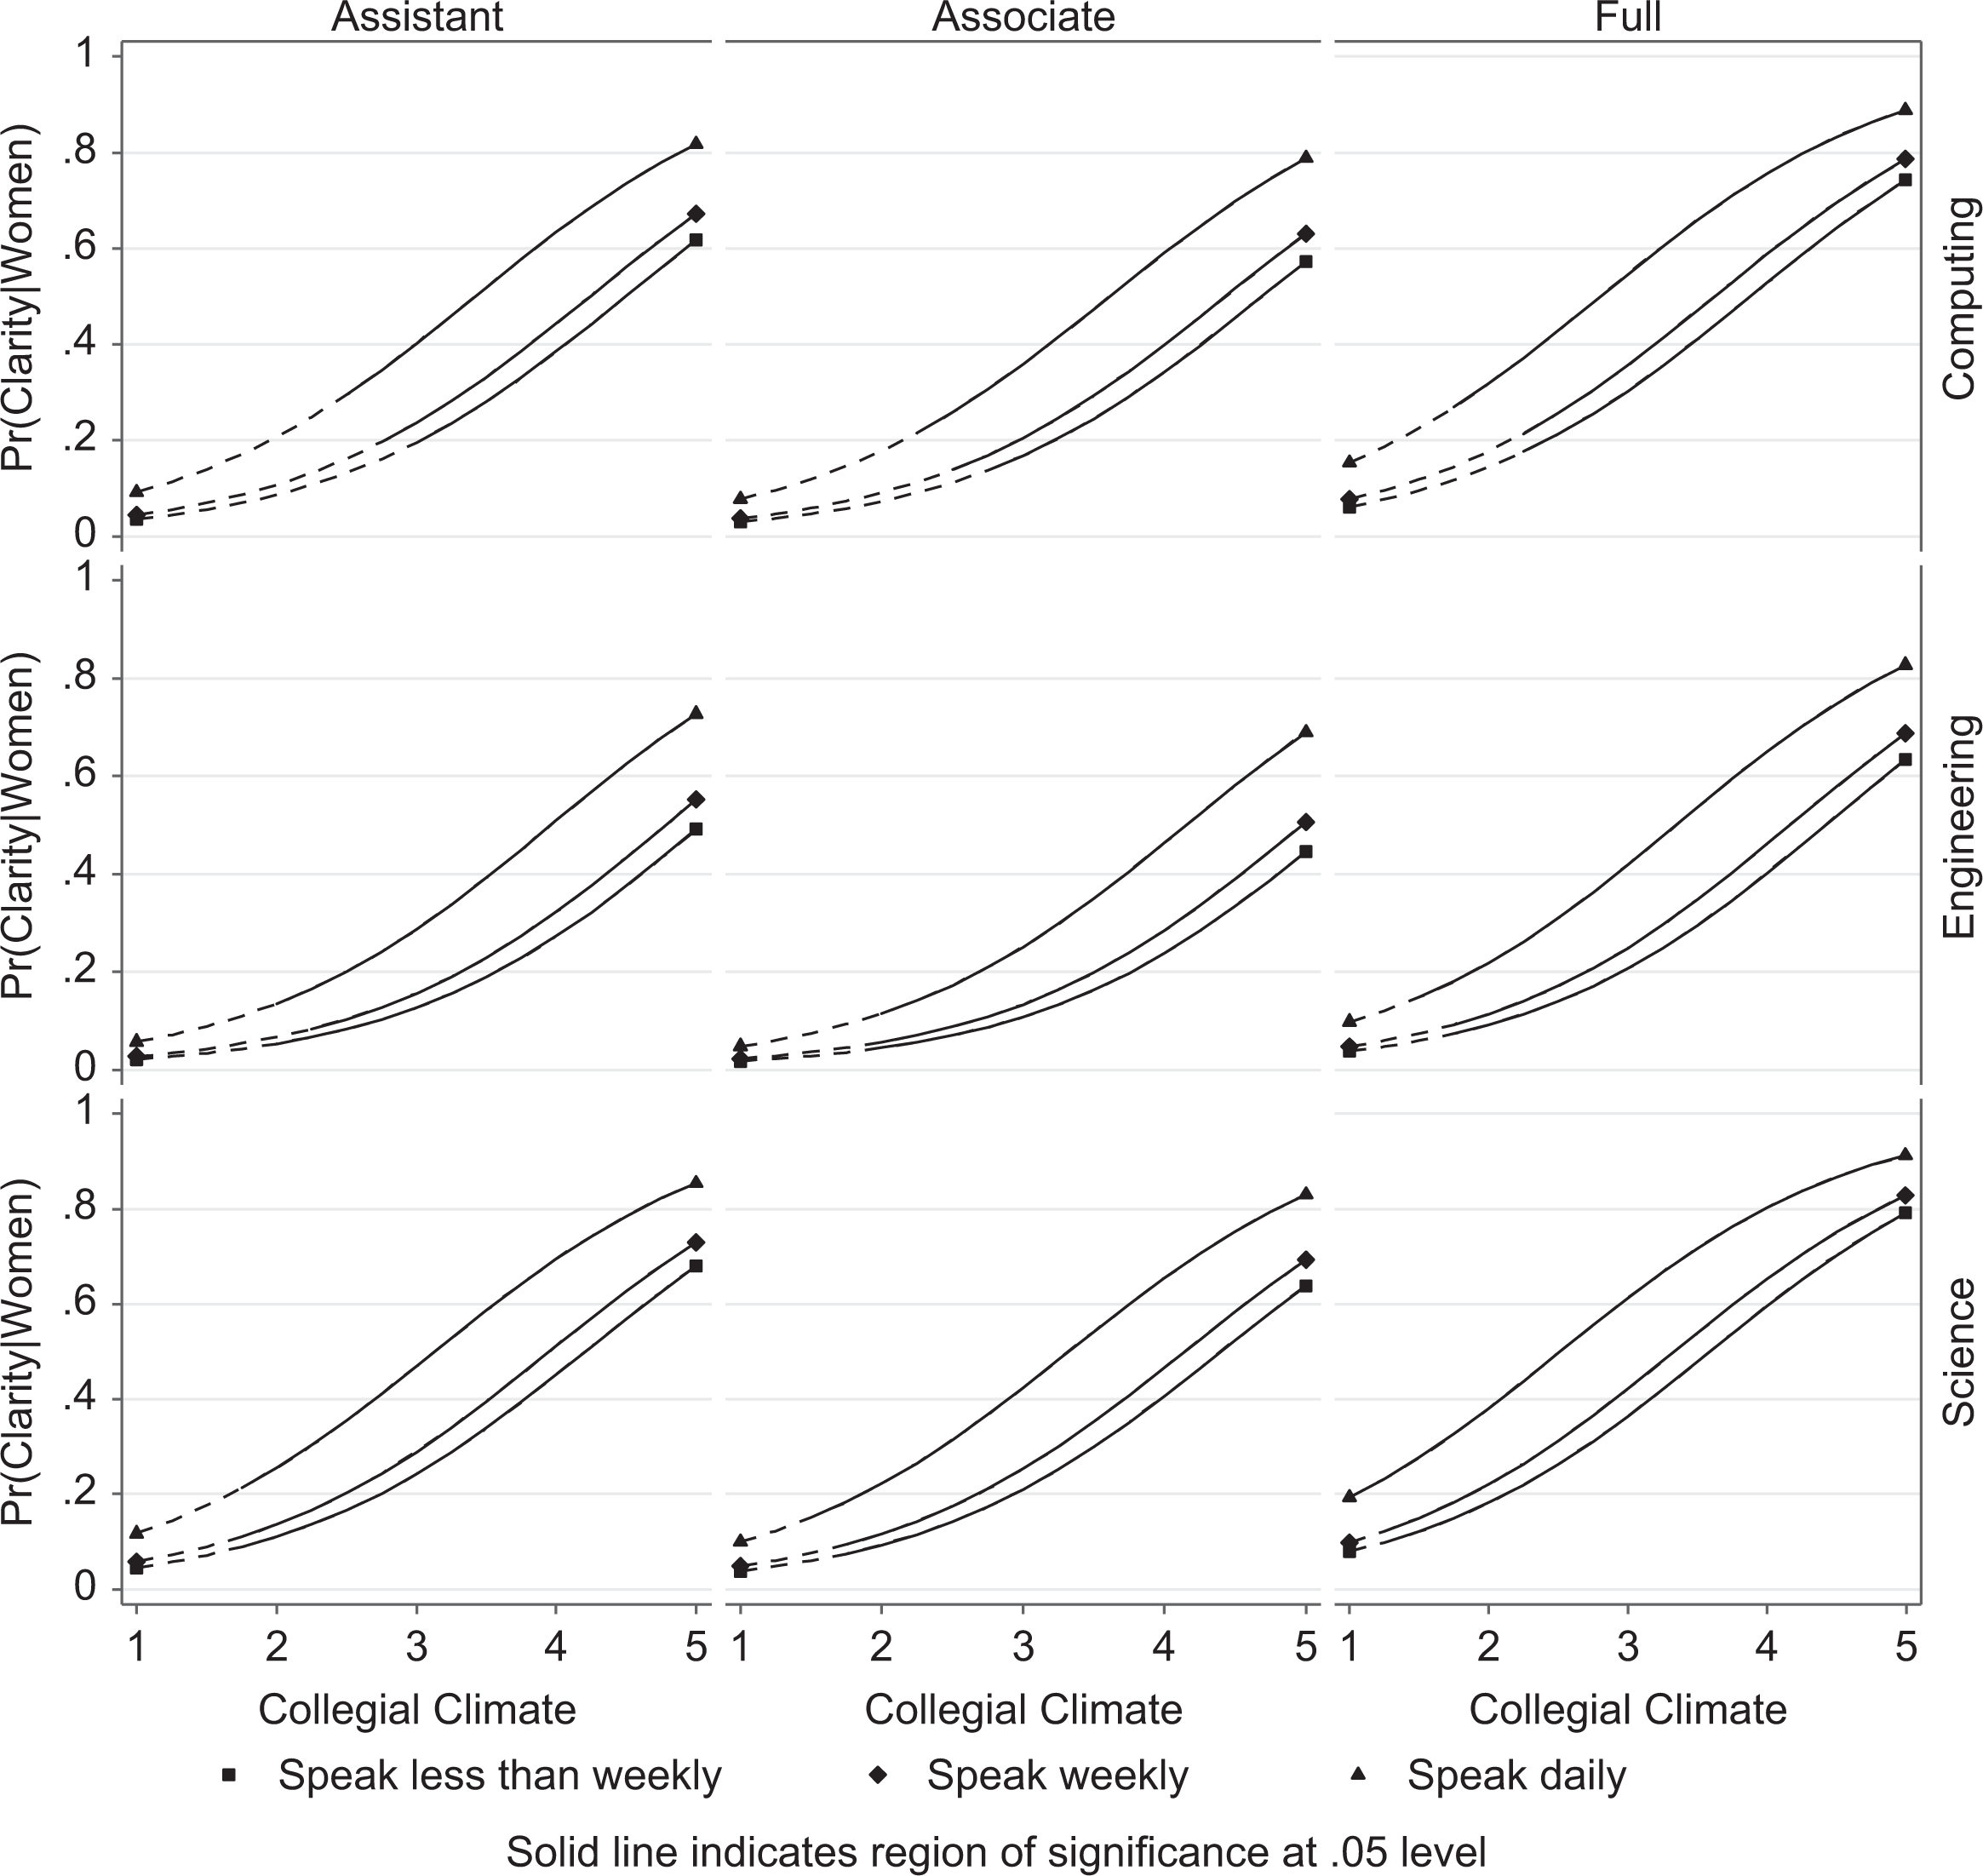
Probability of clarity for women by years at institution and frequency of speaking for each field and rank.
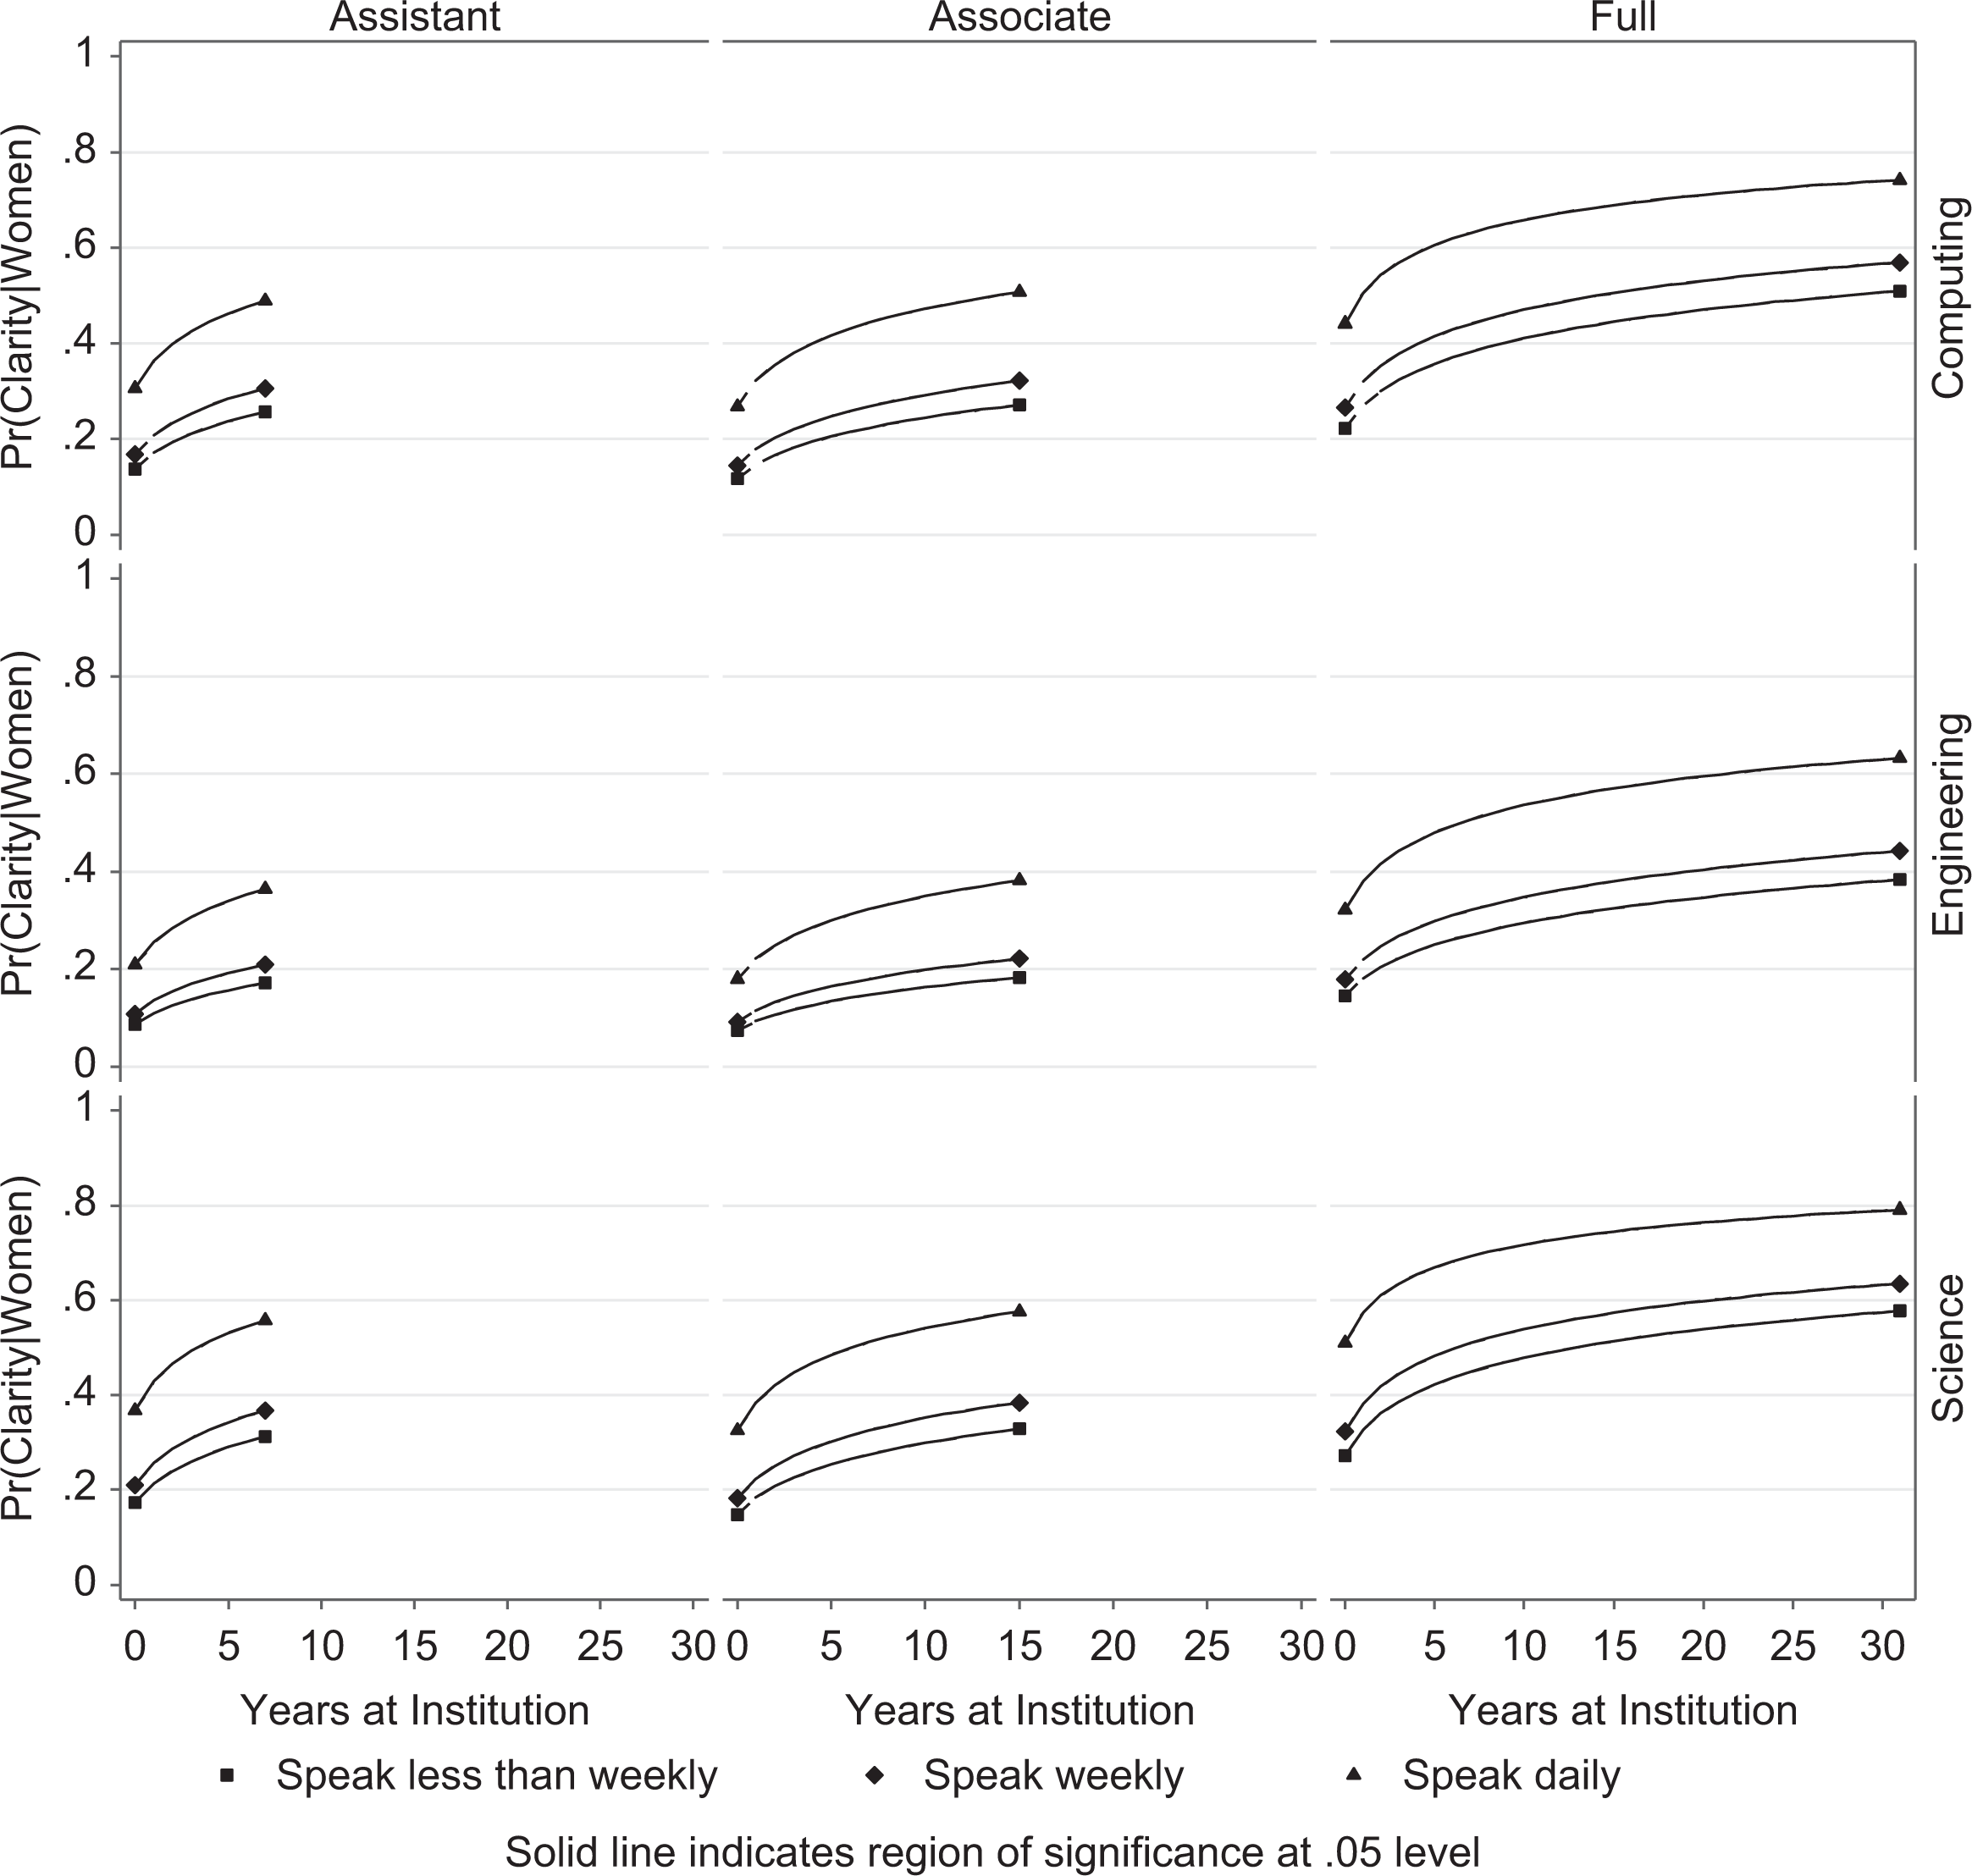
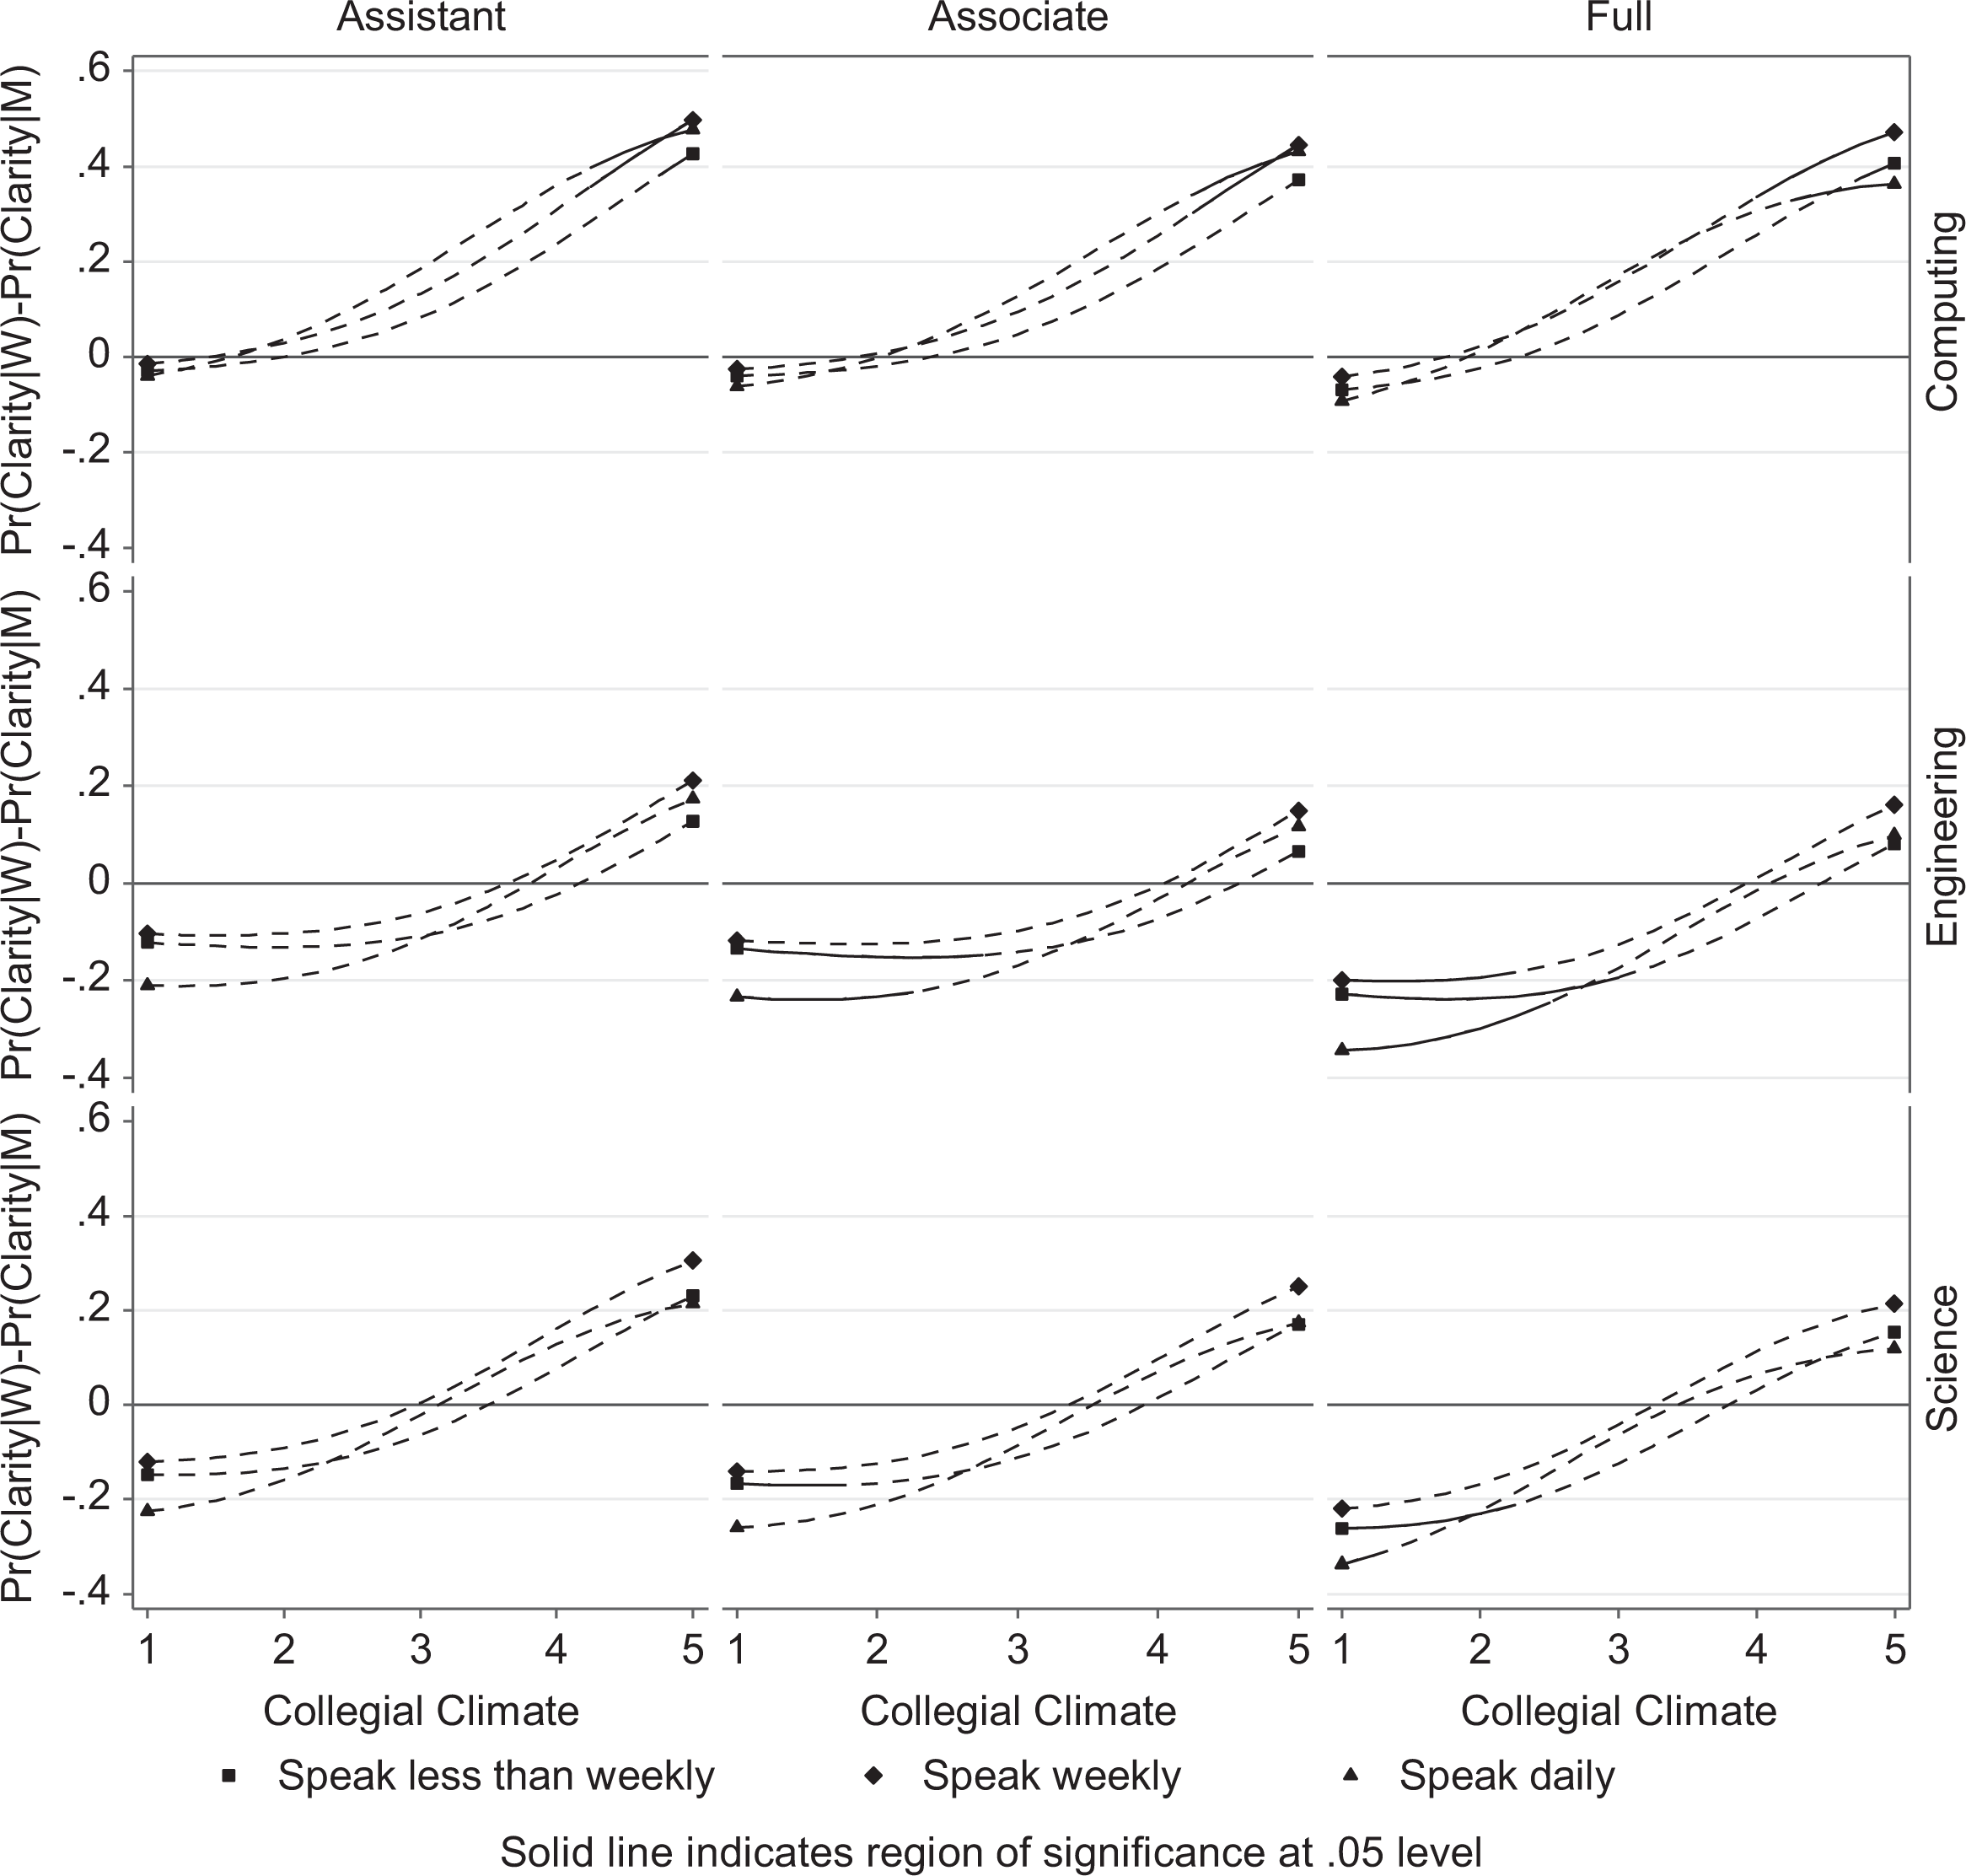
Gender differences in the probability of clarity by years at institution and frequency of speaking for each field and rank.
Probability of clarity for men by collegial climate and frequency of speaking for each field and rank.
Probability of clarity for women by collegial climate and frequency of speaking for each field and rank.
Gender differences in the probability of clarity by collegial climate and frequency of speaking for each field and rank.
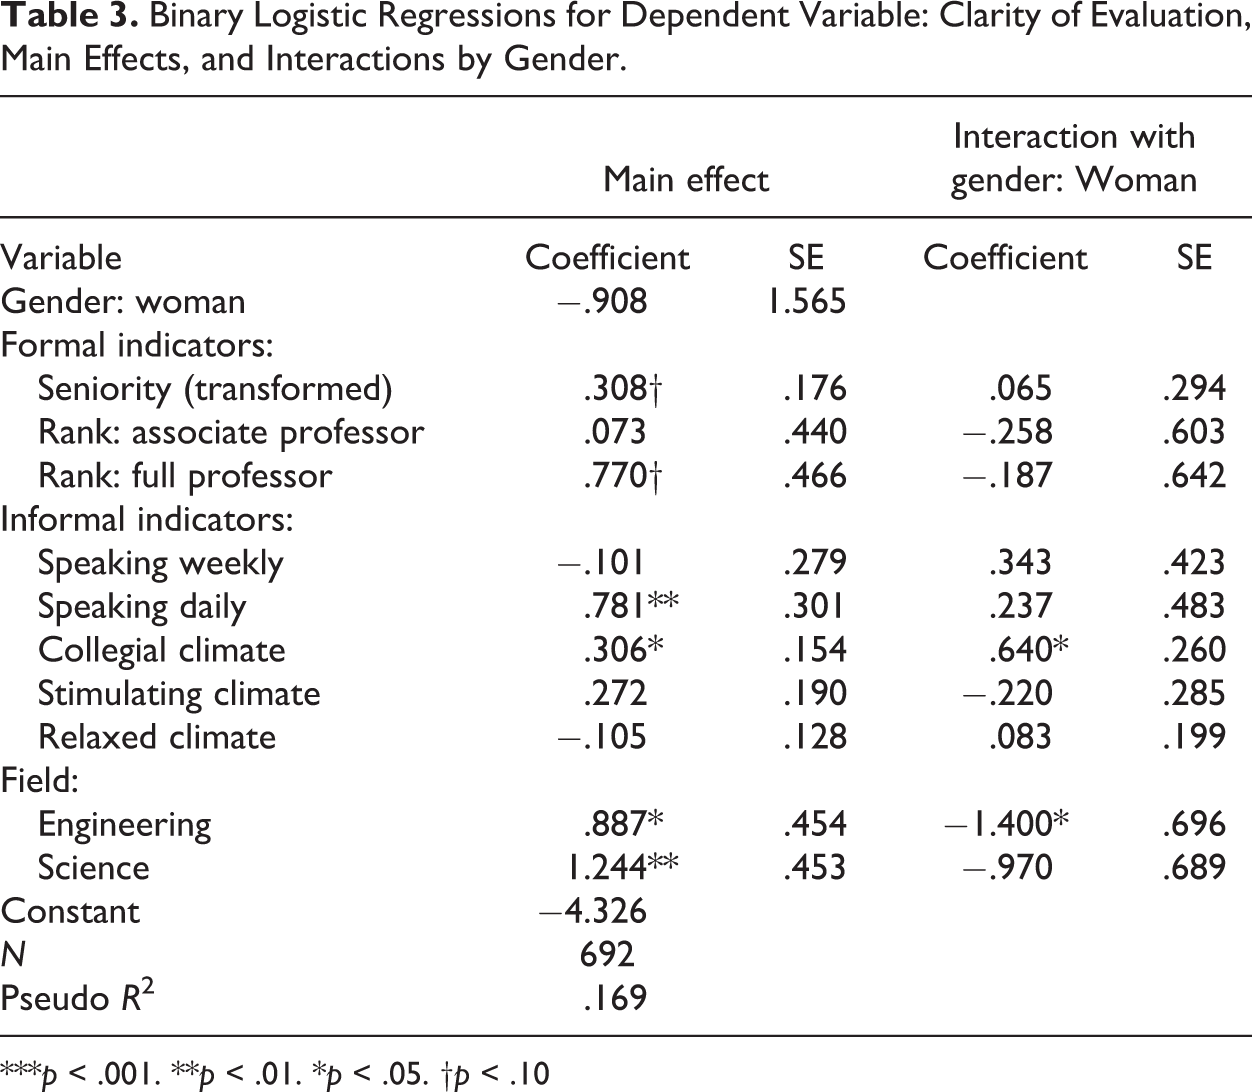
Binary Logistic Regressions for Dependent Variable: Clarity of Evaluation, Main Effects, and Interactions by Gender.
***p < .001. **p < .01. *p < .05. †p < .10
Figure 1 shows the probability of clarity for men, as it varies by years at institution for each field, each rank, and each level of frequency of speaking, holding constant at their means the (three) climate variables. Figure 1 (and the five figures that follow) is arranged in a 3 × 3 table format, where rows are fields, columns are ranks, and for each field–rank combination, the three levels of frequency of speaking appear as three separate lines, identified by symbols (square, diamond, and triangle). A solid line indicates those values of years at institution for which the probability of clarity is significant at the .05 level. 10
To evaluate only those regions of the data that reflect the preponderance of the sample, assistant professors are evaluated for years at institution up to seven years (this includes at least 95 percent of the women), associate professors are evaluated for up to fifteen years at institution (this includes at least 95 percent of the women), and full professors for up to thirty-one years (this includes 95 percent of the women). For each segment of Figure 1, the vertical scale ranges from zero to one (since this is a probability). The horizontal scale is years (the natural unit), while evaluation of the predicted probability uses the transformed value, log (years + 1).
Figure 1 shows that the probability of clarity for men, by most years at institution, is significant for every rank–field combination at every level of speaking, with noticeably higher probability of clarity for the level of speaking daily (compared to less frequent levels of speaking). The lines for the other two frequencies nearly coincide in the figures.
Figure 2 resembles Figure 1, except that probabilities of clarity are for women. As for men, the probability of clarity for women is significant for most years at the institution, as shown by the solid lines, except for the group of full professors in science who speaks less than weekly.
Figure 3 shows the difference between Figure 2 (women) and Figure 1 (men), that is, the probability of clarity for women minus the probability of clarity for men. The vertical scale ranges from −0.4 to +0.6. The gender differences in probability of clarity, by years at institution, are not significant.
Figures 4–6 resemble Figures 1 –3, varying collegial climate, and holding constant at their means the other (two) climate variables and years at the institution. Again, the shift in increase of probability of clarity occurs at the level of speaking daily. Among men (Figure 4), the probability of clarity is significant at varying values of collegial climate, except for the lower values of collegial climate among assistant and associate professors in computing. Among women (Figure 5), the pattern is similar, except that compared to men, the probability of clarity of evaluation is much higher as collegial climate increases.
Figure 6 shows the difference between Figure 5 (women) and Figure 4 (men), that is, the probability of clarity for women minus the probability of clarity for men. Figure 6 shows that the gender difference (1) is significant at the high levels of collegial climate for faculty at all ranks in computing; (2) is significant at the low levels of collegial climate for associate and full professors in engineering; and (3) is significant at low levels of collegial climate for associate and full professors in science who speak less than weekly.
Analogous figures, created for the other two climate variables, are not shown here because the other two climate variables do not predict clarity of evaluation, and no significant gender difference exists for these variables as predictors.
Discussion and Conclusions
What do these findings reveal about formal and informal variables as predictors of clarity of evaluation among women and men scientists? Why do the findings matter for understandings of academic science and for science policy?
To begin, how do the formal organizational variables of academic rank and years at institution predict clarity? In the joint model, the rank of full professor is only marginally significant as a predictor of clarity (p = .098), with no interaction by gender. On the other hand, years at the institution is a complex predictor, as indicated by the separate and joint models.
More specifically, in the models separated by gender, years at the institution marginally increase probability of clarity for men (p = .080), but not for women (p = .112) and the size of the effect of seniority differs by gender. In the joint model, however, no gender difference appears in seniority as a predictor of clarity. The question is: how does this occur? In predicting clarity, the strength of collegial climate and of the interaction between gender and collegial climate is such that they reduce to nonsignificance the interaction of gender and years at the institution. The meaning here is threefold. First, the gender difference of years as a predictor of clarity is not significant. Second, the informal variable, collegial climate, is a stronger predictor than years for both women and men. Third, collegial climate is an even stronger predictor for women than men, meaning that as collegial climate increases, the probability of clarity is higher, especially among women.
What then about the effect of the other informal variable, frequency of speaking about research? Speaking daily is a significant predictor in the models by gender and in the joint model. However, unlike collegial climate, the interaction term with gender is not significant. This means that as a predictor of clarity, frequency of speaking is not operating differently for women and men.
Field is a control or sampling variable. In the models separated by gender, being in science predicts clarity among men; but for women, field is not a predictor. The joint model reveals further: the broad field of science is a significant predictor, but with no interaction with gender; engineering is a significant predictor, but not as strong as being in science; and being in engineering interacts with gender such that the sign is negative (meaning it negatively predicts clarity).
Overall then, the findings point to informal factors as the stronger predictors of clarity of evaluation—especially for women. Specifically, (1) contrary to expectation, the formal variables are not more important for women than for men; (2) the informal factors (collegial climate and speaking daily) are stronger predictors of clarity than are formal factors; and (3) collegial climate, particularly, is a notably stronger predictor among women compared to men.
In this way, the findings suggest that time at the institution, and potential exposure to evaluative processes and observations of outcomes, do not significantly increase the probability of very clear criteria among women in academic science. This has implications for common expectations that women will have clarity (transparency) about evaluation with more experience in the institution. 11 The data here do not support that expectation and suggest that other informal factors are important.
In practice, how may the informal factors operate? First, let me caution that these cross-sectional data do not reveal causal order. Being in department with a collegial climate may be the cause, effect, or both cause/effect of clarity. The faculty who report that their departmental climate is collegial may be in locations where criteria for evaluation are in fact clearly communicated. Or alternatively, those who report the criteria for tenure and promotion to be very clear may be inclined to experience (and thus report) their departmental climates as collegial; or both may operate. It is also possible that faculty members who are generally positive about their home units potentially experience a halo effect, so that they give higher rankings on a range of features of their departments, including climate and clarity of evaluation. This could be even more so for women, given the strength of perceived collegial climate in predicting their clarity.
Likewise, speaking with faculty about research may be cause, effect, or both of perceived clarity of evaluation. In particular, it is the regular, daily occurrence of speaking about research that increases the probability of reported clarity for both genders. Speaking weekly fails to increase the probability of clarity for either women or for men faculty. Speaking weekly may be too infrequent as a means of conveying standards of evaluation; and/or those who have less than very clear conceptions about criteria for tenure/promotion may be inclined to weekly (rather than daily) discussion about research prospects and interests; or both may occur.
In scientific fields, frequency of speaking about research is important because discussion spawns interests, tests ideas, and reinforces research activity (Blau 1994; Nunamaker et al. 1996; Pelz and Andrews 1976; Reskin 1978). Discussion enables scientists to evaluate problems, concepts, and measures, and to do so informally, in ways that provide immediate feedback from others that helps position the place of the work in relationship to others’ research. Noteworthy is the finding that frequency of speaking about research also predicts perceived clarity of evaluation.
In a broader context, the importance of informal factors in evaluation may be part of the autonomy of faculty existing among departments in universities (Birnbaum 1988), particularly in science and engineering fields. Science and engineering faculty are strong “players” in research universities, because the high costs of laboratory staff and graduate training, as well as scientific apparatus, are funded substantially by research grants awarded to individual faculty members. This decentralizes influence in academic institutions, so that power resides with faculty members situated in their individual laboratories. The autonomy and decentralization make it challenging to forge wide, unifying, bureaucratic strategies for clarity of evaluation and to mobilize departments to arrive at clearly communicated standards of evaluation (Fox 2008).
Further, informal social processes, such as frequency of speaking and departmental climate, are less susceptible to practices, policies, and interventions than are more formal processes, such as composing hiring committees. This is because the informal processes reflect faculty members’ preferences about their own sense of social boundaries of inclusion (and exclusion), and because faculty are resistant to what they regard as infringements on their autonomy (Burkhardt 2002). However, informal processes are not immune to organizational interventions (Jordan and Bilimoria 2007).
Thus, in the implications for practices, department chairs and teams of faculty members may purposely create and sustain climates and interaction for wider exposure to information and knowledge about criteria for evaluation. This may occur by supporting collegial work climates (helpful, fair, and inclusive), bringing both women and men faculty into interaction with those who are able and willing to convey the standards about tenure and promotion. These practices have the potential to address clarity of tenure and promotion, particularly for women, for whom collegial climate is an especially strong predictor of clarity.
Clarity of evaluation is important not only to academic departments and universities but also to science policies and policy makers more broadly. In regional and national environments of increasing accountability for universities, the evaluation of academic institutions, and of the scientists within them, is a crucial aspect of science policies (Demeritt 2000; Gibbons 1999; Guston 2000). Policies of “funding for productivity” or “value for money” involve incentives created for performance (see, e.g., Barker 2007). Such incentives, however, rely on clarity among faculty about what is expected and what is rewarded (Van Leeuwen et al. 2003). Thus, if regional and national investments in academic science continue to be increasingly “strategic” about returns expected (economic returns, knowledge returns, or both), then clarity of evaluation is not only an issue for individual faculty members. It is also an issue of public funding and support for universities and of science policies that shape participation, performance, and futures in academic science.
Footnotes
Appendix A
Characteristics of Universities in the Study.
| Types | Number of students | ||||
| Public | Private | <20K | 20K-35K | >35K | Regiona |
| • | • | Midwest | |||
| • | • | Midwest | |||
| • | • | Southwest | |||
| • | • | West | |||
| • | • | South | |||
| • | • | Northeast | |||
| • | • | Northeast | |||
| • | • | Northeast | |||
| • | • | West | |||

aUS Census Bureau.
Appendix B
Descriptive Statistics of Variables by Gender.
| Variable | Men | Women | |
|---|---|---|---|
| N = 384 | N = 308 | ||
| Clarity (percent) | Not at all clear | 3.4 | 3.9 |
| Slightly clear | 8.9 | 13.0 | |
| Moderately clear | 39.1 | 49.0 | |
| Very clear | 48.7 | 34.1 | |
| Seniority (years) | 17.35 | 9.06 | |
| Current rank (percent) | Assistant professor | 13.6 | 35.1 |
| Associate professor | 20.8 | 26.3 | |
| Full professor | 65.6 | 38.6 | |
| Frequency of speaking (percent) | Less than weekly | 31.0 | 43.8 |
| Weekly | 37.2 | 37.0 | |
| Daily | 31.8 | 19.2 | |
| Field (percent) | Computer science | 8.9 | 8.1 |
| Engineering | 45.3 | 45.1 | |
| Science | 45.8 | 46.8 | |
| Departmental climate (scale 1-5) | Collegial | 3.536 | 3.380 |
| Stimulating | 3.812 | 3.587 | |
| Relaxed | 3.522 | 3.656 |

Acknowledgments
For their valued comments on an earlier version of this article, I thank STHV editor, Edward Hackett, three STHV anonymous reviewers, and Irina Nikiforova and Gerhard Sonnert.
Declaration of Conflicting Interests
The author(s) declared no potential conflicts of interest with respect to the research, authorship, and/or publication of this article.
Funding
The research reported in this article was supported in part by the National Science Foundation. No financial support was received for the the authorship and publication of the article.