



Abstract
This study used historical data to find associations between changes in policies, funding, and accountability stemming from No Child Left Behind and the provision of services offered to students identified as gifted in the state of Washington. Descriptive statistics and a regression model are used to examine the change in gifted programs by school districts from 2006 to 2007 up until the point where the state received a waiver (2012–2013). Initial results suggest that, during this time frame, the number of districts reporting having gifted programs declined from 77% to 62% of school districts. Furthermore, the regression results provide evidence that school districts that did not make adequate yearly progress were more likely to no longer report having a gifted program as time progressed (β = −0.29, SE = .11). Those districts that retained gifted programs expanded program options.
On August 18, 2017, the Office of Superintendent of Public Instruction (OSPI) in Washington released a statement outlining the policy changes to the state’s Highly Capable program (Reykdal, 2017), which stated that districts would receive increased funding for gifted programs and would be required to focus on the identification of traditionally underrepresented populations (Black, Latinx, and Native American students) as well as prioritize the identification of low-income students (Engrossed House Bill 2242, 2017). Funding for gifted education programming has more than doubled, and school districts receive this money regardless of the number of students identified as gifted. Furthermore, districts are no longer required to submit grants to Washington State for gifted education funding. Finally, those districts, even if they declined state funds for gifted education, would receive oversight by Washington State as gifted education was deemed to be a part of basic education by the state.
Washington State reevaluated its gifted programming policy and implemented changes to better align with and prioritize values based on inclusivity and equity. Prior to these changes, the gifted education program was under the pressure of a federally determined set of values: the No Child Left Behind Act (NLCB, 2002). NCLB demanded increased accountability that required districts to focus on struggling performance levels and academic proficiency, which ultimately led to negative implications for gifted education programs (Gallagher, 2004; Gentry, 2006; Hodges, 2018; Jolly & Makel, 2010; Kaplan, 2004; Krieg, 2008; Mendoza, 2006) and paved the way for underachievement in some of our most capable students (Davidson Institute for Talent Development, 2006; Jolly & Makel, 2010).
Scholars in education have explored NCLB’s influence on housing markets (Billings, Brunner, & Ross, 2018), the teacher job market (Reback, Rockoff, & Schwartz, 2014), students’ socioemotional well-being (Markowitz, 2018; Whitney & Candelaria, 2017), and average student academic performance (Dee & Jacob, 2011). These scholars used historical educational data to understand the ramifications of policy. Understanding historical context allows scholars to assess the outcomes of policy. In particular, by analyzing the educational data during the NCLB period, scholars are able to understand the relationship between NCLB and gifted education programming.
Scholars in the field of gifted education predicted that NCLB’s focus on struggling students would negatively influence gifted education policy and practice. Scholars also predicted that the end results of NCLB would be detrimental to the outcomes of students identified as gifted (Gallagher, 2004; Gentry, 2006; Kaplan, 2004; Mendoza, 2006). Despite the initial predictions by scholars, a substantial gap in the literature exists on how the provisions of NCLB influenced gifted education policy and practice. To assess the veracity of those predictions, investigating the influence of NCLB provisions on gifted programs as well as the consequences experienced by students identified as gifted or highly capable is warranted.
The influence of NCLB on gifted education policy and outcomes is difficult to assess on a national level because state-level policy differs by state. For example, how NCLB influenced gifted education policy in Washington is different from the influence it had on Texas gifted education policy. This is because gifted education policy in Washington and Texas varied prior to NCLB and continue to vary. This study explored how NCLB influenced gifted education programs in the State of Washington, a state without prior stringent accountability measures before NCLB (Dee & Jacob, 2011). However, to understand the influence of NCLB, the backdrop of NCLB and state-level education policies must first be considered. This article describes one model for how states can assess the influence of events (such as NCLB) on their own educational practices and outcomes.
The impact of current and prior policies must be well understood by policymakers to better inform policy creation and reform. The study of historical longitudinal education data allows researchers to provide policymakers with information to make informed choices. In other words, research is the connecting piece between policy and practice. Each piece—policy, practice, and research—is integral to the other. In this case, Washington State revised its gifted education program and lawmakers replaced NCLB (2002) with the Every Student Succeeds Act (ESSA, 2015; Darling-Hammond et al., 2016).
No Child Left Behind
NCLB had a profound effect on school climates across the United States (Dee & Jacob, 2011), and in Washington, where strong accountability measures were nonexistent, the adjustment to the new norms of NCLB was difficult (Krieg, 2008). The primary accountability measure, adequate yearly progress (AYP), or student performance goals set by the state, was implemented to measure school districts’ progress. These performance goals were formulated using the lowest achievement groups as a baseline with performance targets being raised periodically to demonstrate student growth, and the district’s ability to meet AYP guidelines (U.S. Department of Education, n.d.). Student performance on state standardized tests was used to track AYP for each school district. At the school level, failure to meet AYP resulted in sanctions that increased in severity upon successive failure. For instance, if a school failed to meet AYP for two consecutive years, students were given the flexibility to transfer to other schools in the same district with higher performance, and in the most severe cases (5 years), schools faced closure (U.S. Department of Education, 2002). At the district level, if a district did not make AYP, federal funds were withheld, causing district administrators to reevaluate how resources and personnel were allocated in their school district. In the context of Washington State, NCLB and AYP did not lead to the districts’ adoption of standardized testing as this practice was already in place. What it did do was create consequences for those districts where students did not perform adequately on those tests.
This system of accountability, as measured by AYP, created disincentives for states to support gifted education programs, making earlier predictions pertaining to consequences for gifted programs a reality (Gallagher, 2004; Gentry, 2006; Kaplan, 2004; Mendoza, 2006). For instance, Texas experienced a decline in the proportion of funding allocated to gifted education services during NCLB (Hodges, 2018), California decreased its gifted education budget by 18%, and Illinois completely cut its budget for gifted education altogether (Davidson Institute for Talent Development, 2006). In essence, NCLB provided incentives for the allocation of resources away from gifted education programs within a district.
Contrary to the negative consequences predicted by scholars in gifted education (Gallagher, 2004; Gentry, 2006; Kaplan, 2004; Mendoza, 2006), Dee and Jacob (2011) found that performance on the National Assessment of Educational Progress (NAEP) increased by five scale points in math and two scale points in reading for fourth graders in the 90th percentile in states that did not previously have accountability measures in place (e.g., Washington). In contrast to the overall U.S. findings by Dee and Jacob, Lauen and Gaddis (2012) found that NCLB accountability provisions negatively influenced math scores of high achievers in North Carolina in sanctioned schools. Similar patterns of low performance by high-ability students in sanctioned schools were found in Washington as well (Krieg, 2008).
As outlined by NCLB’s accountability standards and increasingly consequential sanctions, the federal government could restrict Title I funding or even restructure the school district (Dee, Jacob, Hoxby, & Ladd, 2010). In the case of specific sanctions enforced in Washington State, failure to meet AYP meant that a school had to set aside 20% of its Title I funds to support school choice initiatives (OSPI, 2018). As the conflicting results by scholars demonstrated, the consequences of NCLB on the academic performance of gifted students are nuanced. In other words, a student’s state, overall school performance, and grade level all moderate how the provisions of NCLB influenced gifted student achievement.
Gifted Education and NCLB
The enactment of NCLB caused administrators and teachers across the nation to turn their focus to the needs of struggling students (Loveless, Parkas, & Duffett, 2008). In fact, in the same report, more than 80% of nationally surveyed teachers reported that they were more likely to attend to the needs of low-achieving or academically struggling students. In short, the needs of low-achieving students became the focal point at the neglect of high-ability students. Although the intention of NCLB was inherently good in striving to ensure every student has the opportunity to succeed, NCLB approached this national concern to the detriment of academically capable students (Jolly & Makel, 2010).
NCLB placed stringent demands, such as higher standards for teacher quality and increased dependence on standardized assessments (Howley, Rhodes, & Beall, 2009), on school districts without providing additional federal funds to meet those demands. On the contrary, those districts that did not meet the demands placed on them by NCLB could have federal funds withheld. Because gifted education programs are typically funded at the state and local levels, district administrators had to make difficult choices in resource allocation (Reback et al., 2014). Those districts with limited resources, like rural districts, were forced to make the choice between gifted education programs and remedial education programs (Howley et al., 2009).
In 2018, Hodges examined district budget allocations for gifted education in the State of Texas, a state with gifted education funding similar to Washington’s, following NCLB. Both states use a funding structure that provides an amount per identified student up to a cap (5% in Texas, 2.314% in Washington). In Texas, 55% of the funding for gifted education must be used directly for gifted services (e.g., teacher salaries) and 45% indirectly for gifted services (e.g., building maintenance). In contrast, Washington districts are expected to cover remaining gifted education costs from local funding. In other words, Texas districts are incentivized to have gifted education programs through indirect funds, whereas Washington is not.
Washington State and the Influence of NCLB
The 2006–2007 school year marked a critical point in accountability measures in Washington, and, by this academic year, full accountability measures were implemented. According to Washington State’s OSPI (2018), 76% of schools met AYP in the previous academic year; however, the number of schools meeting AYP declined by more than 40% the following year. In total, only 34% of schools met AYP. Following the 2011–2012 academic school year, Washington received a waiver from the federal government, which allowed states to ignore portions of NCLB. For example, a state could receive a waiver regarding NCLB highly qualified teacher mandate allowing the state to broaden its hiring practices. However, Washington would lose its waiver for the 2015–2016 school year as NCLB was replaced with ESSA (Darling-Hammond et al., 2016). In total, Washington was under the full accountability measures of NCLB for six consecutive years (2006–2012) and a single year (2015–2016). The most stringent accountability measure was to maintain AYP toward a 100% student proficiency rate on state exams. No state met this accountability measure (Ladd, 2017). The pressure to meet accountability standards would serve as a catalyst for education reform across the United States, including Washington State.
During the NCLB era, Washington State adopted a new standardized testing format and later the Common Core State Standards to meet accountability standards (U.S. Department of Education, 2014). Following the failure of several school districts to meet AYP, the Washington Office of Superintendent determined that the problem was in the testing measure used, the Washington Assessment of Student Learning. Controversy stemming from how the test was validated would lead to it being replaced in 2010 by the High School Proficiency Exam and the Measurements of Students Progress (Washington Education Association, 2019). In 2011, to qualify for a federal waiver for NCLB, Washington would join a consortium of states in adopting the Common Core State Standards and a new standardized test, the Smarter Balanced Assessment (Washington OSPI, 2015a).
Washington Student Demographics
In 2005, 1,026,682 students were being served in public K–12 districts in the state. Of that population, student demographics were 7.8% Asian, 5.6% Black, 14.0% Latinx, 2.7% Native American, and 67.5% White. By 2012, enrollment increased to 1,043,536 students, and student demographics changed to 7.1% Asian, 4.6% Black, 19.6% Latinx, 1.6% Native American, and 60.2% White (OSPI, n.d.). Of the total student population served in Washington State, between 39,008 (2006) and 37,475 (2012) gifted students were being served in the state (Office for Civil Rights, 2019).
In addition to an ethnically diverse state population, Washington State’s geography and the population distribution is diverse as well. The majority of the state’s population is concentrated in three population centers: the eastern shore of the Puget Sound, which includes the Seattle Metroplex area; Clark County, which makes up the Washington State side of the Portland Metroplex area; and Spokane. Aside from those population centers, nearly half (47%) of Washington State’s school districts are classified as rural (National Center for Education Statistics [NCES], 2018).
Washington State Finances
NCLB and its consequences were not the only policy change enacted in the state during this time frame. The McCleary lawsuit, filed in 2007, alleged that the state was failing to meet its constitutional duty to adequately fund public education (Fraser, 2016). In 2012, the Washington State Supreme Court agreed with the lawsuit ruling that the state was not adequately funding education, and although the case against school funding was being heard in the state’s Supreme Court, an economic downturn sent the country into a recession. Unemployment rates averaged 10% statewide with rural areas disproportionately affected by the recession (Keegan, Sorenson, Morgan, Hayes, & Daniels, 2011).
The Great Recession led to declines in state education budgets (Leachman & Mai, 2014). In the 2009–2011 biennium, the governor mandated a 6.29% state budgetary reduction (or US$527 million dollars; Washington Office of Financial Management, 2012), and a further reduction of US$590 million was made in a special session shortly after. The first round of cuts targeted social services deemed nonessential, whereas the second round targeted nonessential education services and higher education (Washington Office of Financial Management, 2012). In short, Washington State school district administrators faced budgetary shortfalls from reduced funding from the Great Recession while also potentially having Title I funding sanctioned due to NCLB. When faced with lean budgets, district administrators had to decide whether or not to continue funding gifted education programs.
Gifted Education in Washington State Prior to 2017
Although identification for gifted education services is mandated in the Washington State, the identification process is left up to each district. However, legislators mandated that districts use multiple objective criteria when identifying students for the highly capable program (Washington State Legislature, n.d.). Legislators in Washington State (Washington State Legislature, 2015) defined a gifted learner as follows: A student who has been assessed to have superior intellectual ability as demonstrated by one or more of the multiple criteria in WAC [Washington Administrative Code] 392-170-040. These students exhibit high capability in intellectual and/or creative areas, possess an unusual leadership capacity, or excel in specific academic fields, thereby requiring services beyond the basic programs provided by schools. Outstanding abilities are present in students from all cultural groups, across all economic strata, and in all areas of human endeavor. (WAC392-170-035)
In response to state legislation changes, Washington Administrative Code (WAC) designated three pathways of identification for gifted services (National Association for Gifted Children & Council of State Directors of Programs for the Gifted [CSDPG], 2015). The first is a general ability achievement test decided upon by the district (e.g., the Raven, Naglieri Nonverbal Ability Test, or Wechsler Intelligence Scale for Children). The second pathway is through achieving an overall score in the top 10% on one of Washington State’s standardized tests such as Smarter Balanced or Washington Comprehensive Assessment of Science (WCAS; OSPI, 2018); third, a child can achieve a score in the top 5% of a specific content area on one of Washington State’s standardized tests. In addition, subjective measurements (e.g., teacher recommendations and report card grades) can be used to support objective identification measures, but subjective measures cannot be used to prevent a student from being assessed for highly capable services (Washington State Legislature, n.d.).
Finally, during the NCLB era, Washington State provided a funding weight of up to 2.314% of a district’s general enrollment for gifted education programming (Washington State Legislature, 2009). Districts were able to identify over the funding cap but would receive no further state financial support. Further funding for gifted education programming was secured from local revenue sources.
Effects of NCLB on Washington State Highly Capable Programs
NCLB has had a documented negative influence on high-ability performance in Washington State (Krieg, 2008). Krieg (2008) examined Washington testing data on the Iowa Tests of Basic Skills (ITBS) using a differences-in-differences analytical technique, examining the differences among schools in Washington that made AYP under NCLB and those that did not make AYP (and thus received sanctions by the state which led to restrictions on Title I spending). Not only was there a difference in mean score on the ITBS between the sanctioned and unsanctioned schools, the performance gap increased along student ability quintiles. For instance, students in the bottom quintile of both sanctioned and unsanctioned schools performed similarly, but there was a significant difference in performance among students performing in the top quintile. In other words, the performance gap between sanctioned and unsanctioned schools was greatest among the highly capable populations of those schools, thus exacerbating already existing excellence gaps.
Purpose and Objectives
This article contributes to the growing body of research that explores the ramifications of NCLB on U.S. public education. Specifically, this article examines how gifted services in Washington State were affected under the provisions of NCLB. A descriptive method using administrative data from districts reporting gifted programming options was used in this study.
In addition, the purpose of this article was to continue and contribute to ongoing research regarding the impact of high-stakes testing cultures in public schools on gifted education programs. Scholars in the field made dire predictions regarding the fate of gifted education following the inception of NCLB (Gallagher, 2004; Gentry, 2006; Kaplan, 2004; Mendoza, 2006). With the conclusion of the NCLB era in U.S. public schools, a substantial gap remains in gifted education in examining the ramifications of NCLB on gifted students. To date, a single study has been conducted that retroactively examined the influence of NCLB in the context of gifted education since NCLB’s conclusion (Hodges, 2018).
In 2017, Plucker, Makel, Matthews, Peters, and Rambo-Hernandez, (2017) asserted that policy in gifted education was woefully underresearched and called for researchers in gifted education to provide research that can be used to make informed policy choices. Therefore, a final purpose of this article was to extend the body of literature on gifted education policy and contribute to the ongoing body of evidence that will aid legislators in making informed decisions regarding educational policy.
Given this, there are two primary objectives of this study that target policy and research efforts. The first objective of this study was to examine how high-stakes testing in Washington, a state without strong accountability measures prior to NCLB (Dee & Jacob, 2011), coincided with changes to the state’s prior gifted education programming options. A final objective was to provide other researchers with a methodological framework using state administrative data that can be further replicated and generalized in the research of other state gifted programming options and provide meaningful policy analysis. The following research question guided this study: To what extent did gifted education program options provided by school districts in Washington change between the 2005–2006 and 2012–2013 academic school years?
Method
Given that this study encompassed the entire population of Washington State school districts within the time frame, this analysis was conducted as a descriptive analysis. In this case, a descriptive analysis refers to a noninferential study. Because the entire population was used in the analysis, statistics derived are not estimates but can be assumed to be parameters.
Sample
Data were obtained from the Washington State Education Research and Data Center through Washington’s OSPI (2015b). These data are housed online for public use and a public information request was not required (OSPI, 2019). The state mandates that districts report demographic and programmatic information about the district’s gifted education program. The dataset included grade-level programming options for all school districts (n = 294) in Washington State between the 2005–2006 and 2012–2013 academic school years. This time period covers the beginning of full accountability measures up until the academic year prior to Washington State receiving a federal waiver.
Analysis
As the sample represents a population-level summary of all districts in Washington State for the time period in question, a descriptive strategy was first employed to examine trends in provided services. The following were analyzed:
the reported total gifted programming options throughout the state during the time frame and
the gifted programming options reported throughout the state during the time frame by year.
Following the descriptive analysis, the following mixed-effects logistic regression model was used to further examine the relationship between gifted programming options and AYP status:

This model states that the presence of a gifted program in school district i in year t is predicted by the year (M = 3.00, SD = 2.00), whether that school district initially made AYP in 2006 (M = 0.42, SD = 0.49), and the annual change based on the initial AYP status. As this is a mixed model, the intercept was allowed to vary by school district.
In the analysis, p values and t scores are provided. Because this study is exploratory in nature and further encompasses an entire population (and so is descriptive), there is nothing being predicted or estimated. Furthermore, this study used a mixed model format and so traditional critical value estimates are inappropriate (Faraway, 2014). These values do provide useful information on the relative spread of a coefficient and are included to denote the stability of coefficients (Faraway, 2014). In this case, a Wald t score is the ratio of the beta coefficient to the standard error. In turn, a p value denotes the stability of the derived coefficient where small p values are associated with stable coefficients.
Finally, as stated previously, the coefficients from the regression are derived from a population and not a sample. Given this, they are closer to parameters than estimates. For example, the coefficient for Year t is not an estimate of this relationship but is the relationship of Year t on the dependent variable (whether gifted programming is present in a school district).
Results
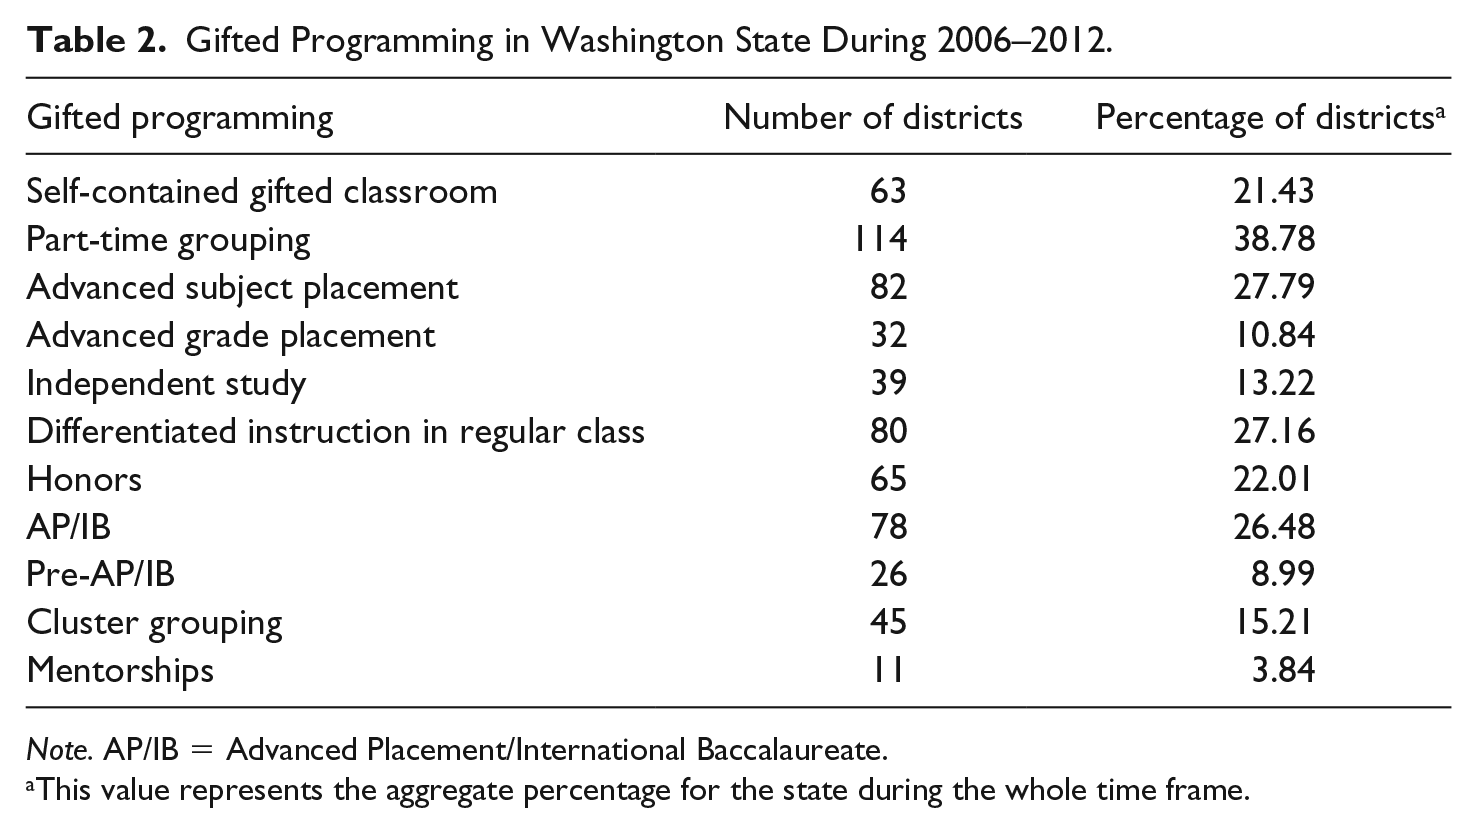
In total, 76% of school districts (223 of 294) initially reported having a gifted education program in the 2005–2006 school year. However, following the implementation of accountability measures in the 2006–2007 school year, this value declined to 67% of school districts (201 of 294) (see Table 1). Of those schools reporting having a gifted program following the implementation of full accountability measures in 2006, the programming options offered by Washington school districts varied among districts (see Table 2). Part-time grouping (also called pull-out programs) was the most widespread gifted programming option in the state between the 2005–2006 and 2012–2013 academic school years (39%). In contrast, mentorships were the least implemented programming option (4%).
The Number and Percentage of All Washington School Districts That Provide Gifted Services by Year.

Gifted Programming in Washington State During 2006–2012.
Note. AP/IB = Advanced Placement/International Baccalaureate.
This value represents the aggregate percentage for the state during the whole time frame.
In the same time frame (2005–2013), the percentage of districts reporting having gifted programs declined from 77% to 62% (see Figure 1). In total, 43 fewer districts reported offering gifted education programming, of which 76% of the districts did not make AYP in 2006 (33 of 43). In fact, the decline in school districts reporting gifted programming was largely among those schools which did not make AYP (80% of school districts not making AYP no longer reported having gifted programs versus 90% of school districts that did make AYP; see Figure 2).

Percentage of Washington school districts reporting gifted education programming between the academic year prior to strict accountability measures (2005) and the year following Washington’s attainment of a waiver (2012).

Of the 243 Washington school districts that reported having gifted programming between 2006–2007 and 2011–2012 (the years of strict accountability measures), the percentage of school districts reporting having gifted programming by year and AYP status. School districts that made AYP (n = 66) and those that failed AYP (n = 177).
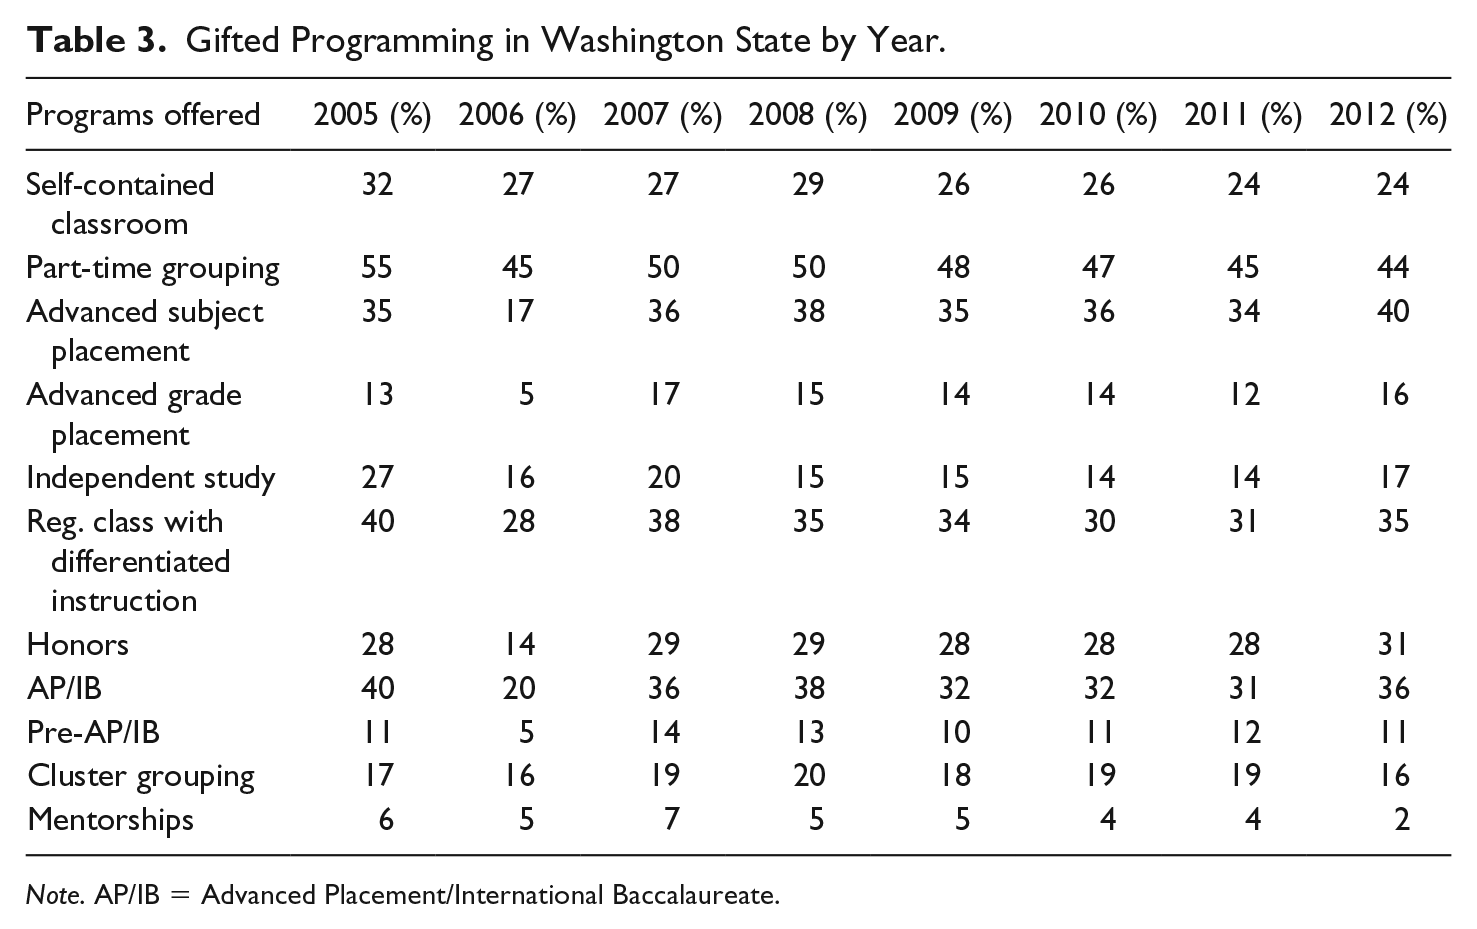
Immediately following the 2005–2006 academic school year, gifted programming declined in all Washington State school districts offering gifted programming (n = 223), with the greatest decline found in districts reporting offering Advanced Placement/International Baccalaureate (AP/IB) options (40% of districts to 20% of districts). The next largest decline came in districts reporting using advanced subject placement as a gifted programming option (35% to 17%; see Table 3). Following the 2006–2007 academic school year, there was an increase in the options provided for gifted programs. In addition, for those districts retaining their gifted programming, there was a greater than 10% increase in districts offering advanced subject placement (17% to 40%), advanced grade-level placement (5% to 16%), honors courses (14% to 31%), and AP/IB courses (20% to 36%).
Gifted Programming in Washington State by Year.
Note. AP/IB = Advanced Placement/International Baccalaureate.
Regression
Regression assumptions were analyzed using R 3.4. (R Core Team, 2017). The Q–Q plot did not provide evidence of any issues relating to normality, and the residuals versus leverage plot suggested that there were outliers present in the data. Given that Washington State allows for extensive district autonomy to create and maintain gifted programs, this was expected. Furthermore, we chose not to remove these outliers from our data because removing these school districts would mean that our dataset no longer encompassed the entire school district population.
To evaluate the assumption of constant variance, the residuals were binned. Unbinned residuals create a residual versus fitted plot that is difficult to interpret because all fitted values of 1 are associated with a positive residual, and all fitted values of 0 are associated with a negative residual value (Gelman, Goegebeur, Tuerlinckx, & Van Mechelen, 2000). The binned residual versus fitted plot provided evidence that the assumption of constant variance was violated. Because our dataset included all school districts in the 2005–2013 time frame, our analysis was primarily descriptive rather than inferential. Thus, the increased standard errors associated with a violation of constant variance were preferable to reduced interpretability from a transformation.
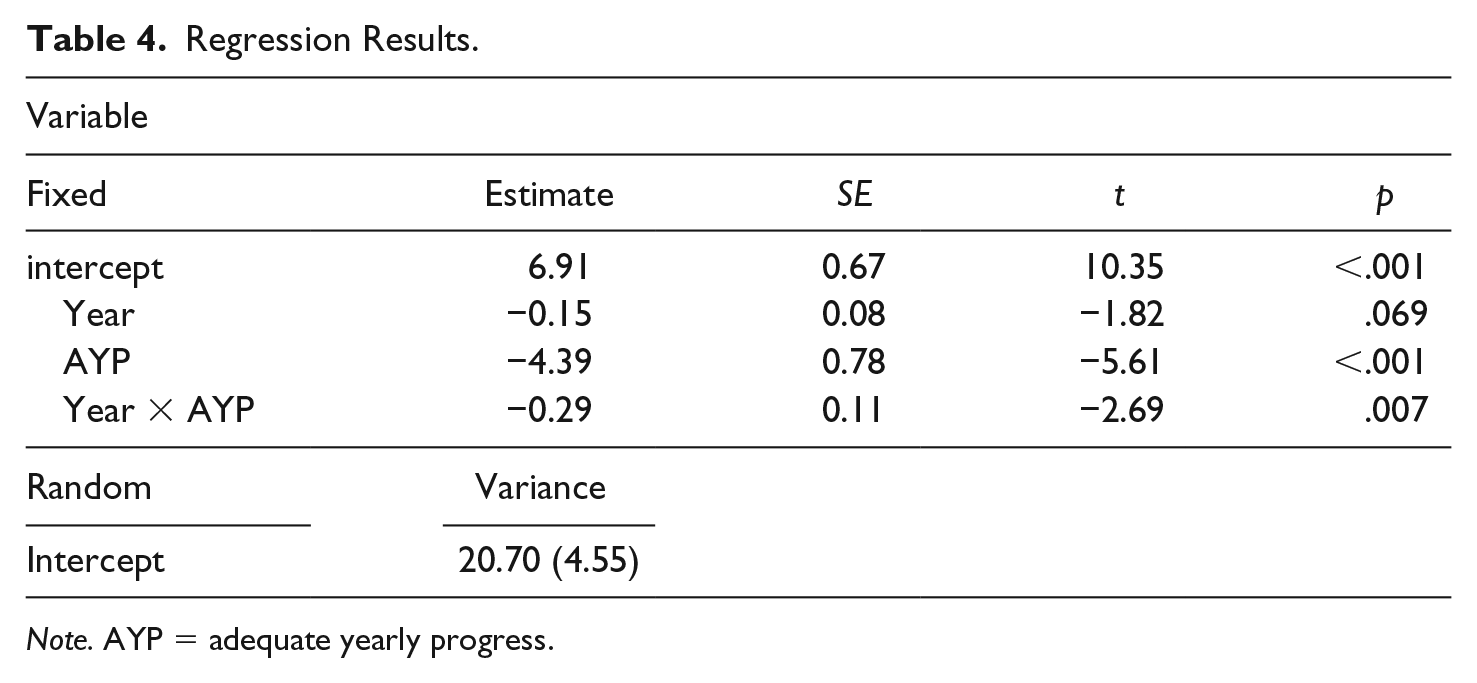
For the regression, the inclusion of AYP and its interaction with year improved model fit—the model r2 improved from .80 to .83 from the unconditional to conditional model. This suggests that 3% of the variance (15% of the remaining variance) was explained by the inclusion of the variables describing AYP. Importantly, districts not making AYP in 2006 had a significantly lower likelihood of having a gifted program as time progressed during the time frame. This further suggests that the drop in overall districts in the state that had gifted programs was likely related to districts’ AYP status. Districts that did not make AYP were less likely to have a gifted education program (β = −4.39, SE = .78, p < .001). Given the magnitude of this coefficient, this reinforced the descriptive statistics finding that, of those districts that dropped their gifted programs in Washington, the vast majority were those districts that did not make AYP.
There was also an additional effect of time in the regression model. School districts that did not make AYP were more likely to drop gifted programs than school districts that made AYP as they progressed through the NCLB time frame (β = −0.29, SE = .11, p = .007). However, the overall time trend did not show an extensive influence on the likelihood of a gifted program in the district (β = −0.15, SE = .08, p = .069). This suggests that, over time, NCLB and AYP status did not influence all districts equally in terms of their likelihood of dropping their gifted programs. Regression results can be found in Table 4.
Regression Results.
Note. AYP = adequate yearly progress.
Finally, the variance component for the random intercept aligned with the initial makeup of school districts reporting having a gifted education program. Interpretation of this intercept must be cautioned though because the dependent variable is a binary variable, so an associated intercept standard deviation is not necessarily meaningful. The magnitude of the standard deviation can provide insight into the proportion of schools and so serves primarily as a diagnostic (Faraway, 2014).
Discussion
Initially, the means plot in Figure 1 describes what would seem to be a straightforward relationship between increased accountability measures under NCLB and gifted programming in Washington. In essence, accountability measures were enacted and the number of school districts reporting gifted programming declined. Not only did the number of schools reporting gifted programming decline, but of those that continued to report having gifted programming, the number of gifted programming options in those schools declined as well. Once the state obtained a waiver, the number of school districts reporting gifted programming increased. Although a descriptive study cannot provide causal evidence, there is certainly a strong relationship between accountability measures and the availability of gifted programming.
Nonetheless, the results from this study demonstrated a contradiction of outcomes. On one hand, the number of schools reporting gifted programs declined by 15%. In other words, the time frame for districts fully implementing accountability measures coincided with 43 schools no longer reporting having gifted education programming. On the other hand, those districts that maintained their programs through the NCLB era expanded their gifted program offerings following the 2006–2007 academic school year, nearly recovering to pre-NCLB levels.
Overall, the results of the regression help provide some context to the descriptive statistics. For instance, there was a significant relationship between school districts not meeting AYP and school districts dropping their gifted program. Stated otherwise, school districts that did not make AYP were more likely to drop their gifted programs as time progressed than districts who initially made AYP. To an extent, these findings support what others initially predicted: consequences to the gifted program within a school district as a result of NCLB (Gallagher, 2004; Gentry, 2006; Kaplan, 2004; Mendoza, 2006) and its overall focus on “universal minimum proficiency for all students” (Jolly & Makel, 2010, p. 35).
More specifically, the implications of this study indicate that NCLB likely had a negative influence on gifted education programs offered in Washington State school districts. Gallagher (2004) and Gentry (2006) predicted that NCLB would lead to a decrease in gifted education programming as standardization became the new educational norm. This research provides evidence that they were partially correct.
For districts that maintained gifted programs, the programming options expanded under NCLB and largely recovered to the level they were in the 2005–2006 school year. This is an important finding and stands in contrast to the predictions made by scholars in the field of gifted education (Gallagher, 2004; Gentry, 2006; Kaplan, 2004; Mendoza, 2006). The school districts reporting advanced subject placement as a form of gifted programming more than doubled in the time frame of the study (17%–40%) representing an increase of 70 school districts. Furthermore, this percentage is greater than that in the 2005–2006 school year (35%). This suggests that the number of school districts reporting advanced subject placement increased following an initial decline and then surpassed preaccountability implementation numbers. A possible explanation for the upswing in these forms of gifted programmatic offerings is due to associated costs. As noted by Steenbergen-Hu, Makel, and Olszewski-Kubilius (2016), subject-level acceleration is cheap. Furthermore, as the authors argue, it does not provide the same disincentives to administrators that grade-level acceleration does because the subject-accelerated student does not graduate early. In other words, advanced subject-level placement is a way to maximize constrained resources for administrators wanting to continue to offer gifted programming in their districts. At most, to implement advanced subject-level placement, a district administrator would need to provide transportation among schools where necessary. This demonstrates that resourceful educators were able to provide expanded programmatic options despite the pressures of NCLB.
Unfortunately, if a child attended a school that was sanctioned under NCLB, their experiences were likely different. They were more likely to see their school drop their gifted program entirely than see an expansion of programmatic offerings. These results provide context to the findings of Krieg (2008) by providing a possible explanation. Krieg found that there was a difference in performance between gifted students based on whether or not they attended a school that was sanctioned under NCLB due to not making AYP. Our findings provide evidence that a possible reason for this difference is due to schools sanctioned under NCLB being more likely to drop their gifted programs, whereas those schools that were not sanctioned expanded programming options. Furthermore, our findings provide the important policy link to provide an answer to why outcomes of gifted students varied during the NCLB time frame in Washington. Krieg (2008) also speculated that the cause for differences in performance outcomes between the two groups of gifted students was due to NCLB putting pressure on administrators to move resources away from the “tails” and into the “middle.” Our findings provide context to this speculation by Krieg (2008) by providing evidence that moving resources away from the “tails” to the “middle” involved dropping gifted programs in those schools. It is important to note that this fact was not consistent across all school districts within the state. As shown in the regression analysis, there were programs that were sanctioned, had a high probability of dropping their programs, yet retained their programs. This again underscores the importance of acknowledging the local control that school districts maintained on their gifted programs under NCLB.
This study provides researchers and legislators with a quantitative measure of the effect of NCLB on gifted education within Washington State. This has important implications as legislators in Washington are currently evaluating gifted education policy. Understanding how previous accountability measures influenced gifted education programs in their state allows them to make more informed decisions in policymaking.
Implications for Policy
The findings of this study highlight the unintended consequences of policy enactment. Clearly, given the recent work from the OSPI for Washington, the state is aware of those consequences. Using Washington State as an example can provide insight to policymakers in other states.
Policymakers should be aware of the existing relationship between increased accountability measures and school districts changing their programmatic offerings for gifted education. This phenomenon has led to two distinct school district populations following accountability measures going into full effect: school districts with expanded gifted programs and those that no longer offer gifted programs.
In essence, the programmatic options available to a student identified as gifted are related more with how their school as a whole performs on state standardized tests than that student’s individual need. Policymakers should in turn offer incentives to school districts that maintain gifted programs despite not making AYP. These incentive structures could come in the form of funding (e.g., flat grants, matching funds, or increased funding weights) to maintain gifted programs. Furthermore, the state could offer increased professional development opportunities for schools in how gifted programs can be maintained despite school performance.
At the end of the day, state policymakers must decide if the needs of gifted children are important. As researchers in the field of gifted education, we most certainly believe they are. Some ascribe to the mentality that gifted students will not need the additional programming and will continue to do well, but as Krieg (2008) demonstrated, gifted students in these schools often perform worse than their peers in schools that did make AYP.
Limitations
The foremost limitation of this study is its observational nature. The study cannot provide causal claims. Even though there is evidence that NCLB is related to the decline in gifted programming in Washington, that claim cannot be said to be causal. Furthermore, untangling the interrelated influences of different policy decisions enacted at the local, state, and federal levels is complex. For example, at the same time that mandates for NCLB were being implemented, the nation was in a recession and the state’s school funding scheme was being challenged in court. An amount of caution must be taken in interpreting these results.
A second limitation of this study is the possibility of serial correlation. Although this study demonstrates a link between not making AYP and not reporting a gifted program by school districts, it is possible that this link is not due to the implementation of stringent accountability measures in 2006 but due to a prior event. Due to the lack of the corresponding administrative data, it is not possible to assess the possibility of other forms of serial correlation and so stands as a limitation of this study.
A third limitation to this study is that it only encompasses a single state. Examining educational policy on a national scale is exceptionally difficult due to the control that state legislators have over education within their own state. This has created a patchwork of 50 different experiments in gifted educational policies across the 50 U.S. states. That said, we believe that there is useful information and insight that can be gained from examining the consequences and outcomes of policy within states.
Future Research
Understanding why school districts dropped their gifted programming is an important next step in understanding the influence of NCLB on gifted programming in Washington State. The data used in this study cannot capture an administrator’s thought process or the complexities he or she may have experienced when the decision to no longer support gifted programming in their district was made. A qualitative study of the school districts that no longer reported having gifted programs is the clear next step in answering this question. Furthermore, not all districts who did not make AYP dropped their gifted program. A qualitative study including school district administrators who decided to retain their gifted programming should be considered so that factors for retainment can also be examined. Qualitative inquiry into this phenomenon can provide a nuanced understanding of what the decision-making process was, the factors that influenced the process, and the time frame that the decision process had to be made in. A qualitative study could also provide insight related to the outcomes administrators experienced pertaining to the decision to retain or reduce gifted programming in their district. Understanding this process can allow policymakers to enhance their understanding of the ramifications their policy decisions have in school districts.
A further area of research is to examine the decline in school districts who made AYP reporting having gifted programming after 2008. This date coincides with the beginning of the Great Recession and the school district budget cuts across the United States. Evidence from Hodges, Tay, Desmet, Ozturk, and Pereira (2018) suggests that school budgetary cuts led to declines in gifted budgets in Texas. In turn, this budgetary decline coincided with statistically significant racial/ethnic demographic changes in the composition of Texas’ gifted student population (Hodges, Tay, Lee, & Pereira, 2019). Using the framework by Hodges and colleagues (2018, 2019) to examine Washington would allow for an extension of their results.
Finally, Washington is unlikely the only state where there was a relationship that existed between accountability measures and gifted education programming. A tremendous gap in the literature exists between what scholars (Gallagher, 2004; Gentry, 2006; Kaplan, 2004; Mendoza, 2006) predicted would happen to gifted education under NCLB and what scholars now believe happened. Scholars need to understand the conditions where NCLB had the greatest influence on gifted education programming to better inform policymakers of the possible unintended consequences of legislation.
Conclusion
NCLB was not written or enacted with the goal of undermining gifted education programs. In fact, the primary purpose of NCLB was to close academic achievement gaps. Unfortunately, scholars examined NCLB and demonstrated that one of the unintended consequences of the legislation was the negative influence on gifted education programs (Hodges, 2018; Krieg, 2008). Understanding these consequences is necessary if informed policy decisions will be made.
The most salient point from this research is not that NCLB led to a decline in districts reporting having gifted programs, but that those that continued to maintain their gifted programs recovered from the initial decline in 2005–2006 and expanded their programming options. Disparity in the state existed before the inception of NCLB. That said, the state became more divided as to who has access to gifted education programming and who does not. NCLB did not just create a decline; it created a gap within the state among school districts. Furthermore, as NCLB continued, that gap only widened.
It took another 5 years after Washington received a waiver for the state to revitalize its gifted education program. State legislators reevaluated gifted programming in Washington and instituted a plan to revive gifted education in the state. The question is whether this will close the gap created by NCLB; the hope is that it will.
Footnotes
Authors’ Note
Jaret Hodges is now affiliated with University of North Texas, Denton, TX, USA.
Declaration of Conflicting Interests
The authors declared no potential conflicts of interest with respect to the research, authorship, and/or publication of this article.
Funding
The authors received no financial support for the research and/or authorship of this article.
