
Abstract
This study illustrates the consequences of accounting for or ignoring teacher variability in student ratings in conjunction with combination rules when identifying students for gifted services in one rural primary school. Teachers (n = 16) rated 282 first-- and second grade students on creativity, motivation, mathematics, and science. Results indicated the most variability in how teachers used the science scale and the least variability in the mathematics scales. Further, teachers rated female students higher than male students in motivation, but not on any other scale. More students were identified if the top students were identified in each class versus the top students in each grade level, and largely, the students who were identified within their classrooms were not the same students who were identified within their grade level. And as expected, OR rules resulted in the highest number of students identified. Implications and recommendations are discussed.
Keywords
Introduction
Statement of the Problem
Students from low-income families continue to be identified for gifted services at lower rates than students from higher income families (Grissom et al., 2019; Roda, 2017), and teacher rating scales have been recommended as an alternative path for gifted identification, particularly for students from low socioeconomic backgrounds (Azano et al., 2017; Peters & Gentry, 2012; Stambaugh, 2007; VanTassel-Baska, 2008). But even with training, teacher ratings of students may vary (Azano et al., 2017; Miller, 2009) and be subject to biases (Neumeister et al., 2007; Siegle & Powell, 2004; Siegle et al., 2010). To complicate matters more, once teachers have rated students across multiple abilities, those ratings need to be combined in some way to determine who is eligible for gifted services (McBee et al., 2014). Thus, the purpose of this study is twofold: (a) to quantify how much variability exists between teachers in student ratings and (b) to examine differences in who is identified for gifted services using various combination rules when variability between teachers is considered or ignored.
Variability in Teacher Ratings of Student Abilities
Teacher rating scales have been commonly used to identify students for gifted services for decades, including students from underrepresented populations (Peters & Gentry, 2012), low socioeconomic status (Stambaugh, 2007; VanTassel-Baska, 2008), and from rural, low education communities (Azano et al., 2017). The constant and continuous interaction between teachers and students in the classroom allows teachers to develop individual student perceptions based on long-term observations of classroom behavior and academic performance in all areas (Jarosewich et al., 2002; Worrell & Erwin, 2011). Thus, teacher ratings may capture unique information about students that is not contained in achievement or ability assessment scores, such as student motivation (Dicke et al., 2012; Skinner & Belmont, 1993; Standage et al., 2006; Sweet et al., 1998).
To showcase the validity and reliability of the scores from teacher rating scales, Farah and Chandler (2018) examined the reliability and validity measures of eight observation instruments commonly used in the field of gifted education, including the Scales for Rating the Behavioral Characteristics of Superior Students (Renzulli et al., 2010), also known as the Renzulli Scales. They found that some of the observation instrument scores were psychometrically sound (i.e., favorable interrater reliability), but they caution their continued use because the scales may no longer be aligned to current conceptions of giftedness. Additionally, several other studies have also illustrated adequate validity and reliability of teacher ratings using different types of observation scales (see Hunter et al., 2018; Kettler & Albers, 2013; Lopata et al., 2020; Nordness et al., 2019; Reid et al., 2014; Smith et al., 2018). Further, to identify students for gifted services and to ensure the scores on the measures are reflective of student-observed behaviors, teachers need to be provided adequate and appropriate training to use the scales (Renzulli et al., 2013; Şahin & Çetinkaya, 2015; Styck et al., 2021; Szymanski & Shaff, 2013). For example, the Renzulli Scales (Renzulli et al., 2010) provide training exercises for teachers for each of its 14 scales.
Like many other well-established observational instruments, the effectiveness of teacher rating scales is contingent upon the consistency with which teachers use the observational instrument. Inconsistency with use of the rating scales could be evidence of teacher rater effects. That is, all the assessments made by teachers are filtered through their perspectives and their judgments are translated to a number based on a rating procedure (Styck et al., 2021). Those judgments are subject to biases or simply tendencies for different teachers to use different parts of the scale (e.g., some teachers tend to rate students more generously than others; some teachers are inclined toward using the higher end of the scales whereas others may be inclined towards using the lower end of the scales). The variability between raters may also exist due to teachers’ narrow conception of giftedness, particularly when serving diverse gifted students or special populations (Neumeister et al., 2007; Pereira, 2021; Siegle & Powell, 2004; Siegle et al., 2010). For example, one study examined teachers' conceptions of giftedness by the amount of training in gifted educationteachers with at least 12 hours of gifted education coursework (35%) were compared to teachers with fewer than 12 hours of gifted education coursework (65%). No differences in their conceptions of giftedness were found between the two groups, and, in general, teachers’ conceptions of giftedness tended to not include characteristics of students from diverse populations (Miller, 2009). Again, some studies have illustrated teachers from different cultures identify giftedness differently based on their preexisting ideas within their own culture, and their perception of giftedness was influenced by students’ interests and socioeconomic status (SES), as well as their academic strengths (Peterson & Margolin, 1997; Siegle et al., 2010). Next, we discuss some of the systematic variability in how teachers rate student ability.
Variability in Teacher Ratings of Student Abilities
There are two types of variability in teacher ratings: within-teacher variability refers to differences in an individual teacher’s rating of students within their classroom and between-teacher variability refers to differences in student ratings across teachers. Within-teacher variability is expected and should be due to true differences between students that should be captured by the scales (e.g., some students demonstrate more creativity than their classmates) but also could be the result of biases (e.g., students from underrepresented groups, such as Hispanic students, tend to be rated significantly lower by their teachers than students from dominant groups, such as White students; Masten et al., 1999; Plata et al., 1999). Between-teacher variability may also be present due to true differences in ability between the groups of students the teachers assessed but may also be due to other factors, such as differences in leniency (e.g., some teachers may tend to use the higher ends of the scale more than others), varied discipline specific self-efficacy (e.g., some teachers may be more confident in rating mathematical ability than other teachers; Mashburn et al., 2006), or the tendencies of some teachers to focus on weaknesses rather than strengths (Siegle & Powell, 2004). Because of the presence of both within and between variability in their ratings that is not due to true underlying differences in student abilities, the use of teacher rating scales for identifying students for gifted services may be less reliable than using traditional measures of achievement or ability (Siegle & Powell, 2004).
One way to illustrate the variability between teachers in ratings is to examine the intraclass correlation coefficient (ICC),the ratio of variability between teachers to the total variability in ratings. Splett et al. (2020) reported intraclass correlation coefficient (ICC) values of .10–.23 when teachers rated their students emotional, behavioral, and adaptive functioning, which is a substantial portion of variability between teachers. Furthermore, larger ratios of ICC (.15–.33) were obtained in a study where 210 prekindergarten teachers rated 711 students on their social competencies (Mashburn et al., 2006). These ICCs indicated a non-ignorable portion of the total variance in ratings was due to the between-teacher variability. Likewise, another study reported the ICC of students’ mathematics and science scores of 0.25 and 0.19, respectively (Woods-Groves et al., 2021), indicating again a substantial amount of the between-teacher variance in predicting students’ mathematics and science outcomes. In sum, the proportion of variability in teacher ratings that lies between teachers has been shown to range from 10% to 33% and depends on the domain assessed. Next, we turn to variability in teacher ratings in some of those specific domains.
Variability in Teacher Ratings Across Domains
The variability between teachers is dependent upon what domain teachers rate (e.g., motivation, creativity, mathematics, and science ability), but in general, teacher ratings are positively correlated with student performance and ability. For example, in a study with more than 3,000 students and 150 teachers, teacher ratings of students' academic and behavioral domains were positively related to students’ cognitive behaviors as well as their mathematics, reading, and science performance (Woods-Groves et al., 2021). Similarly, teacher ratings were found to be predictive of students’ motivation as well as their mastery of mathematics, science, and other subjects such as English, German, and a second foreign language (Dicke et al., 2012).
In affective domains such as motivation and creativity, teacher ratings may be less accurate than academic domains (Praetorius et al., 2017; Urhahne & Wijnia, 2021). When assessing student creativity, teachers have been found to rate students identified as gifted higher in the creativity domain compared to those who were not identified as gifted (Kettler & Bower, 2017). Teachers often generalized the creativity domain in different subjects, such as creativity in mathematics compared to science, due to their lack of understanding of the construct of creativity that affected their ability to rate student creativity accordingly (Beghetto et al., 2011; Gralewski & Karwowski, 2013; Mullet et al., 2016; Hoff & Carlsson, 2011). Conversely, teacher ratings were found to be weakly correlated with students’ creativity and task commitment (Urhahne, 2011), indicating that teachers’ effectiveness and abilities in selecting creative students for giftedness services was fairly low. To increase the reliability of teacher ratings of student creativity, teachers are encouraged to utilize a variety of sources of information about student creativity characteristics prior to rating gifted students’ creativity (Ridgley et al., 2019). Further, in a meta-analysis of teacher ratings of creativity ratings, one trend observed was the more elaborate the rating scale the more accurate teacher ratings of creativity (Gralewski & Karwowski, 2019).
In the mathematics domain, teacher judgments appeared to be less variable compared to the motivation and creativity domains. For example, in one study of 39 teachers, the ratings and confidence toward students’ task-specific performance on sets of mathematics problems in which they found that elementary teachers felt confident were moderately accurate in predicting students’ mathematics performance on specific mathematical tasks (Gabriele et al., 2016). Further, a positive correlation between teacher ratings and students’ mathematics achievement was found (Kolovou et al., 2021), indicating that teachers were capable of assessing students' abilities in mathematics. This may be due to the fact that students’ academic behaviors tend to be more observable in mathematics, which makes it easier for teachers to assess student ability in mathematics (Lee et al., 2022).
Similarly, in the science domain, teacher ratings appeared to have a positive relationship with students’ science performance, but again there is variability between teachers in these ratings (Herman & Choi, 2008). Specifically, teachers appeared to be better equipped to rate students in their science outcomes relative to the length of acquaintance—teachers who had known students for a longer period of time were able to rate their students’ science ability more accurately compared to those who had not (Woods-Groves et al., 2021). In addition, when teachers received sufficient training on how to use the teacher rating scales in the science domain, teachers were found to be more capable of rating their students’ science abilities (Renzulli et al., 2010). In summary, teacher ratings are related to student ability, but some domains are more variable than others. Next, we turn to variability in how teachers may rate individual students differently.
Variability in Teacher Ratings by Student Biological Sex, Race, and Ethnicity
Turning to differences within teachers in how they rate students, some teachers’ subjective perceptions of their students’ biological sex differences may affect their judgments in rating student motivation, creativity, mathematics, and science abilities. For example, Gralewski and Karwowski (2018) found that teachers rated female and male students’ creativity differently, depending upon the teachers’ implicit theory of creativity. In contrast, other studies have found no differences within teachers in how they rate students of different biological sex (Praetorius et al., 2017).
Furthermore, in the mathematics domain, some studies have found teachers tended to rate female students higher in mathematics higher than male students (Dicke et al., 2012). However, teachers have also been found to score female students who are White higher than students who were Hispanic or Black (Copur-Gencturk et al., 2020). In comparison, between female and male White students, teachers tended to favor White male students in terms of their mathematical abilities (Riegle-Crumb & Humphries, 2012), and female students’ mathematics performance likely suffers the most when those students interact with biased teachers on a regular basis (Carlana, 2019). In short, the evidence varies as to whether teachers rate students differently based on their biological sex and appears to be at least partially conditioned upon the student's race or ethnicity.
The Use of Combination Rules
Once teachers have rated students across multiple scales, practitioners are tasked with deciding how to use those scores to determine who is given access to gifted services. Although best practice is to use multiple measures to identify students for services (Lakin, 2018), depending on how related those measures are to each other and the decisions about how to combine the scores, the proportion of students identified can vary wildly (McBee & Makel, 2019). For example, consider the simple scenario illustrated in McBee and Makel’s 2019 study, where two assessments are used with a top 5% cutoff. If students must be in the top 5% in to be identified, then 5% of the students would be identified for services if the assessments were perfectly correlated—but if the assessments are completely uncorrelated, only 0.25% of students would be identified. Considering slightly different requirements—students must be in the top 5% on at least one of two assessments, if the scores are perfectly correlated, then 5% of the students would be identified. If the scores are perfectly uncorrelated, then 10% would be identified. Thus, the decision of how to use multiple measures is a highly consequential one.
There are three recommended approaches for integrating multiple measures to inform gifted identification and are collectively called combination rules, which are comprised of: (a) AND—students must qualify on every measure, (b) OR—students qualify on at least one measure, and (c) AVERAGE—students qualify on the average of the measures (Lakin, 2018). Generally, students identified solely under the AND rule will be more homogeneous in terms of skills and abilities. As more assessments are included, the variance in ability decreases and the rule becomes more exclusive. In contrast, students identified under the OR rule exhibit greater variability in ability because students need only a single score above the cutoff to be identified (McBee et al., 2014). Thus, using AVERAGE or OR (but not AND) with measures of student ability (e.g., academic assessments, teacher ratings) is a more defensible method of identification and helps to alleviate the problem of disproportionality and inequity among student populations in gifted programs (Lee et al., 2022; Peters et al., 2021).
Arguably, student background and culture should be considered as context when making decisions about eligibility for services. Lakin (2018) asserted that by using an OR combination rule, students are not required to be exceptional in all areas, which would be required by the AND combination rule. Further, using an AVERAGE combination rule, students are provided with more opportunities to illustrate that they could excel in one area, which in turn should compensate for lower scores in other areas; better yet, the student’s one lower score in one area could be offset by three other excellent scores (Lakin, 2018; McBee et al., 2014). On account of this, Lakin (2018) contended that the results from both OR and AVERAGE combination rules would have practical implications for the type of instruction needed and differentiation required by selected students who get identified for gifted services.
Consequences of Using Combination Rules When Teacher Ratings Vary
The evidence for the use of teacher rating scales for identifying students for gifted services is mixed (e.g., Copur-Gencturk et al., 2020; Dicke et al., 2012; Gralewski & Karwowski, 2018), and the use of multiple rating scales comes with another complication—how to combine the ratings to determine who is eligible for gifted services. Consider this example: One teacher consistently rates her students using the high end of a scale, and another teacher consistently rates her students using the lower end of a scale. If this between-teacher variability is ignored and the students with the highest absolute scores are identified for gifted services, students from the first teacher are much more likely to be identified for services than students in the second teacher’s classroom. If this variability is accounted for and the students with the highest relative scores in each class are identified for gifted services, students from the first teacher and second teacher are equally likely to be identified for services. Suddenly, which teacher rates the student is likely to be predictive of who gets identified for services. Further, the reality is much more complicated—teachers rate students across multiple scales, those teacher ratings likely vary across domains and may be influenced by teacher biases (Neumeister et al., 2007; Siegle & Powell, 2004; Siegle et al., 2010), and decisions are made about how to combine the ratings—and those ratings may be correlated (McBee & Makel, 2019). The students who are identified for gifted services depend on whether the teachers use the scales differently, whether the teacher variability is considered or not, and how the ratings are combined. We examine these issues in turn.
Current Study
We situated this study in a rural school that had few students identified as gifted using the district standards. To improve identification rates, we chose the Three-Ting Conception of Giftedness (Renzulli, 1978; Renzulli & Reis, 2018) as the underlying theoretical model of gifted education and therefore identification. The Three-Ring Conception of Giftedness identifies three traits that interact to form gifted behaviors in students—above-average ability, creativity, and task commitment (Renzulli, 1978; Renzulli & Reis, 2018). One way to assess all these differing characteristics is through teacher rating scales, but those have complications that we previously described.
Although there are other ways to assess student abilities and behaviors, we opted to use the Renzulli Scales (Renzulli et al., 2010) in this study for two primary reasons: (a) the alignment of the scales to the study’s underlying model of gifted education and (b) the ability to collect data on each of the students across multiple constructs without taking any instructional time from students. Also, we only had teachers rate students on four scales: creativity and motivation (because of their alignment to the gifted education model employed) as well as mathematics and science (because of their alignment to the model and to the planned services).
The first purpose of the current study is to illustrate how much variability exists in teacher ratings and where it lies. If students are not assigned to classes based on ability, average scores across classrooms should be similar—thus, the variability between teachers should be small. Further, if teachers use the domain-specific scales similarly, the variability across domains should also be similar. Additionally, there is mixed evidence as to whether teachers systematically score students differently by race, ethnicity, and biological sex (Carlana, 2019; Copur-Gencturk et al., 2020; Dicke et al., 2012; Gralewski & Karwowski, 2018; Praetorius et al., 2017; Riegle-Crumb & Humphries, 2012). Our sample does not have much variability in race/ethnicity; therefore, we only explored whether the teachers in this sample rated these students differently based on their biological sex. Thus, in this study, we sought to describe just how differently teachers scored students with the first three research questions: 1. How much variability exists between teachers in how they rate student creativity, motivation, mathematics ability, and science ability? 2. What proportion of variability in teacher ratings lies within students, between students in the same classroom, and between teachers? 3. Do teachers rate male and female students differently on creativity, motivation, mathematics ability, or science ability?
The second purpose of this study was to illustrate the consequences of ignoring or accounting for between-teacher variability when identifying students for gifted services under each of the three mechanisms for incorporating multiple scales (AND, AVERAGE, OR; McBee, et al., 2014). We examine how different the groups of students identified for services are across the three combination rules both when between teacher variability is considered (i.e., identifying students who were the top in each classroom) and when between teacher variability is ignored (i.e., identifying students who were top in the grade level). Of note, at this point we are agnostic as to whether students should be compared to students in their classroom or their grade level (that is a different study)—rather, we seek to illustrate the consequences of ignoring or accounting for between teacher variability in teacher ratings by describing just how different the groups of students who are identified for gifted services across the three combination rules. This leads to our final two research questions: 4. What proportion of students would be identified as top in their class (accounting for teacher variability) versus top in their grade level (ignoring teacher variability) using “and,” “or,” or “average” rules across the subscales? 5. How much overlap exists between the students who are identified top in their class (accounting for teacher variability) versus top in their grade level (ignoring teacher variability) using “and,” “or,” or “average” rules across the subscales?
Methods
Participants
Participants included 282 first- (n = 138) and second- (n = 144) grade students in a K—2 Appalachian primary school in the United States. The students were mostly White (84% in first grade and 85% second grade), with 50.71% of the students identified as male (n first = 71, n second = 72) and 49.29% identified as female (n first = 67, n second = 72). In total, 16 teachers observed and rated their own classroom. However, there were a total of 17 classrooms; due to the unavailability of one first- and one second-grade teacher, students in those two classrooms were rated by the school STEM specialist (See Table 4). The school meets the criteria for the Rural and Low-Income School Program (RLIS) as authorized under Title V, Part B of the ESEA, and for high poverty as determined by Section 1113(a)(5) of the ESEA. In fact, 90% of students were eligible for Free and Reduced Price Meals (FARM), and 27% lived below the poverty line, exceeding the ESEA requirements of 50% and 20%, respectively. The principal of the school where the study took place indicated that students are randomly placed into classrooms, with the caveat that students with behavioral problems and students with individualized education plans are equally spread out among the classes. Thus, students are not homogeneously placed into classrooms.
Procedures
For context, currently fewer than 1% of students meet district requirements for identification for gifted services. District requirements for identification as gifted are as follows: Identification as gifted requires a teacher or parent recommendation with six data points supporting that nomination, such as exemplary student work as indicated by grades, a special project, a writing sample, or evidence of critical thinking. The school psychologist administers the Wechsler Intelligence Scale for Children—Fifth Edition (WISC-V; Wechsler, 2014) and either the Kaufman Test of Educational Achievement—Third Edition (KTEA-3; Kaufman & Kaufman, 2014) or the Woodcock-Johnson IV (WJ IV; Schrank et al., 2014) Tests of Achievement if the decision is to evaluate. Students with a full-scale IQ (FSIQ) score of 125 or higher as measured by the WISC-V and achievement above the 90th percentile in four core areas as measured by either the KTEA-3 or WJ IV are deemed eligible for gifted services.
Teachers participated in a half-day virtual online synchronous professional learning to broaden their conception of giftedness and recognize behaviors indicative of giftedness in students from underserved populations. Teachers learned about key concepts, watched video clips, read vignettes, and participated in small- and whole-group discussions. For illustration, as a group, teachers watched a video clip from the movie October Sky, which is situated in rural West Virginia, and identified key indicators of motivation in the protagonist as outlined in the Renzulli Scales, such as “goal directed,” “totally consumed,” and “unwavering drive.” Next, teachers reflected on the behavioral characteristics of their own potentially gifted students. Later, teachers watched self-paced, prerecorded videos illustrating how to report scores via the online Renzulli Scales platform. In May 2021, teachers scored all students on four Renzulli Scales that most aligned with the theoretical framework and future planned services—namely, creativity, motivation, mathematics, and science.
Measures
The Renzulli Scales to Assess Four Behavioral Characteristics of Superior Students.
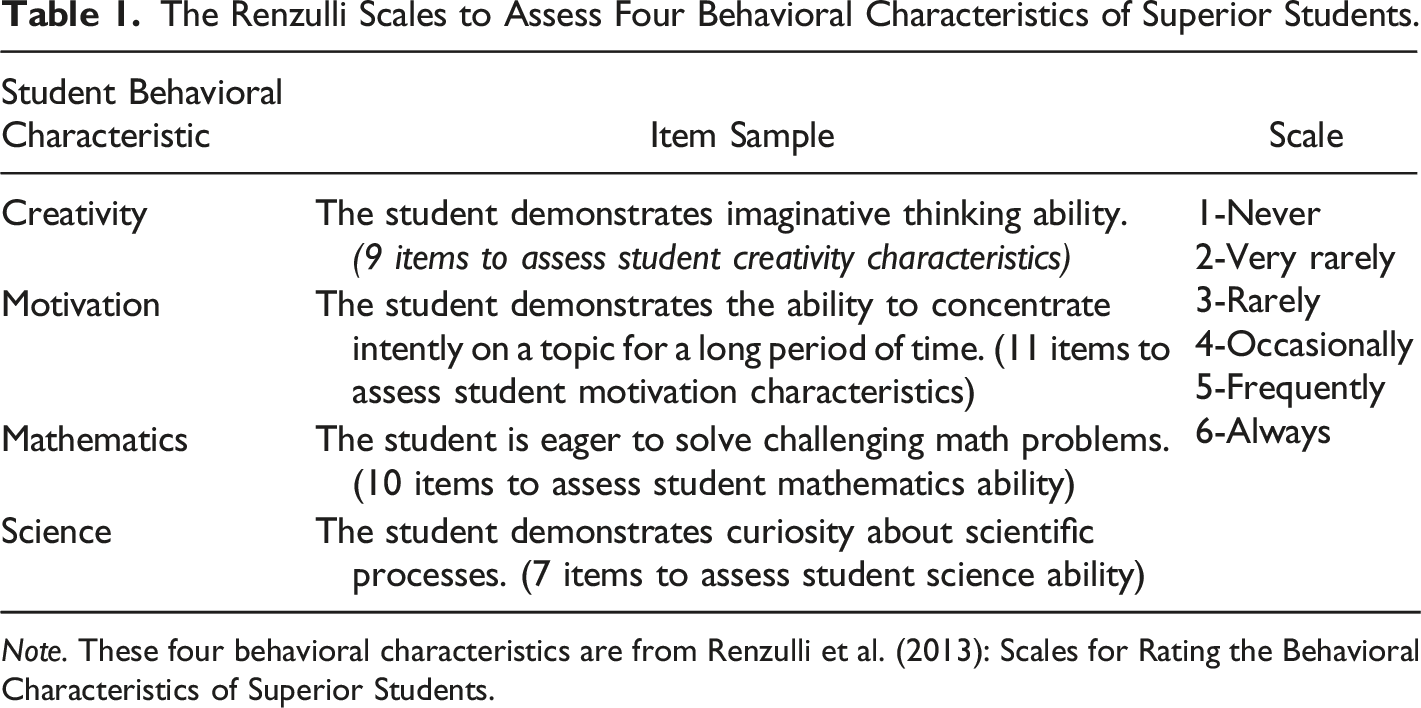
Note. These four behavioral characteristics are from Renzulli et al. (2013): Scales for Rating the Behavioral Characteristics of Superior Students.
Reliability by Grade Level and Correlations Between Subscales.

Note. There were 138 students in the first grade and 144 students in the second grade. These students were rated in four behavioral characteristics: creativity, motivation, mathematics, science. All correlations were statistically significant (p < .0001).
Reliability by Teacher.

Note. This table depicts Cronbach's alpha from 16 teachers (TC1-TC16) who graded all 282 students.
Plan of Analysis
For research question 1, we ran four separate two-level (students nested within teachers) multilevel models, one each for creativity, motivation, mathematics, and science. Because students were nested within teachers and teachers only rated their students, we reported the intraclass correlation coefficients (ICC) to determine the variability between teachers relative to the total variability in the model (within and between teachers) for each of the four scales. Higher ICCs indicate more variability between teachers.
For research question 2, we ran a single three-level model (repeated measures of students, nested within students, nested within teachers) to describe the variability at three levels: the proportion of the total variability within students across scales, between students in the same classroom, and between teachers.
For research question 3, we return to the three-level multilevel model in research question 2. Before addressing the research question, we added three dummy indicators of each scale to level 1, the within students level. We made mathematics the reference scale (see equation (1) below).
Level 1: Within student
where y tij is student i’s score on scale t in teacher j’s class, and π 0ij is the mathematics scale score for student i in teacher j’s class.
Next, we added a dummy code for student biological sex (male = 0, female = 1) at level two, the student level. We examined both the size of the parameter estimates and the proportion of variability explained at level 2 with the addition of the dummy codes.
Level 2: Between students within teacher

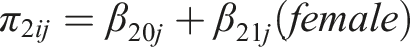

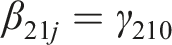
Level 3: Between teachers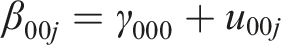


For research question 4, we identified students as either being the top of their class (accounting for between teacher variability) or the top of their grade level (ignoring between teacher variability). Of note, we made within-school and within-classroom comparisons (i.e., local norms) of student ratings. The top students in the class were identified by calculating the 90th percentile within teachers by subscale. The top students in the grade level were calculated as the 90th percentile within their grade level by subscale. Next, we applied three combination rules (AND, AVERAGE, OR) across the four subscales—creativity, mathematics, motivation, and science.
For research question 5, we examined the overlap between the students who were identified as the top of their class versus the top of their grade level by combination rules.
Results
Descriptive Statistics for Creativity, Motivation, Mathematics, and Science Scales by Grade Level and by Teacher Ratings.
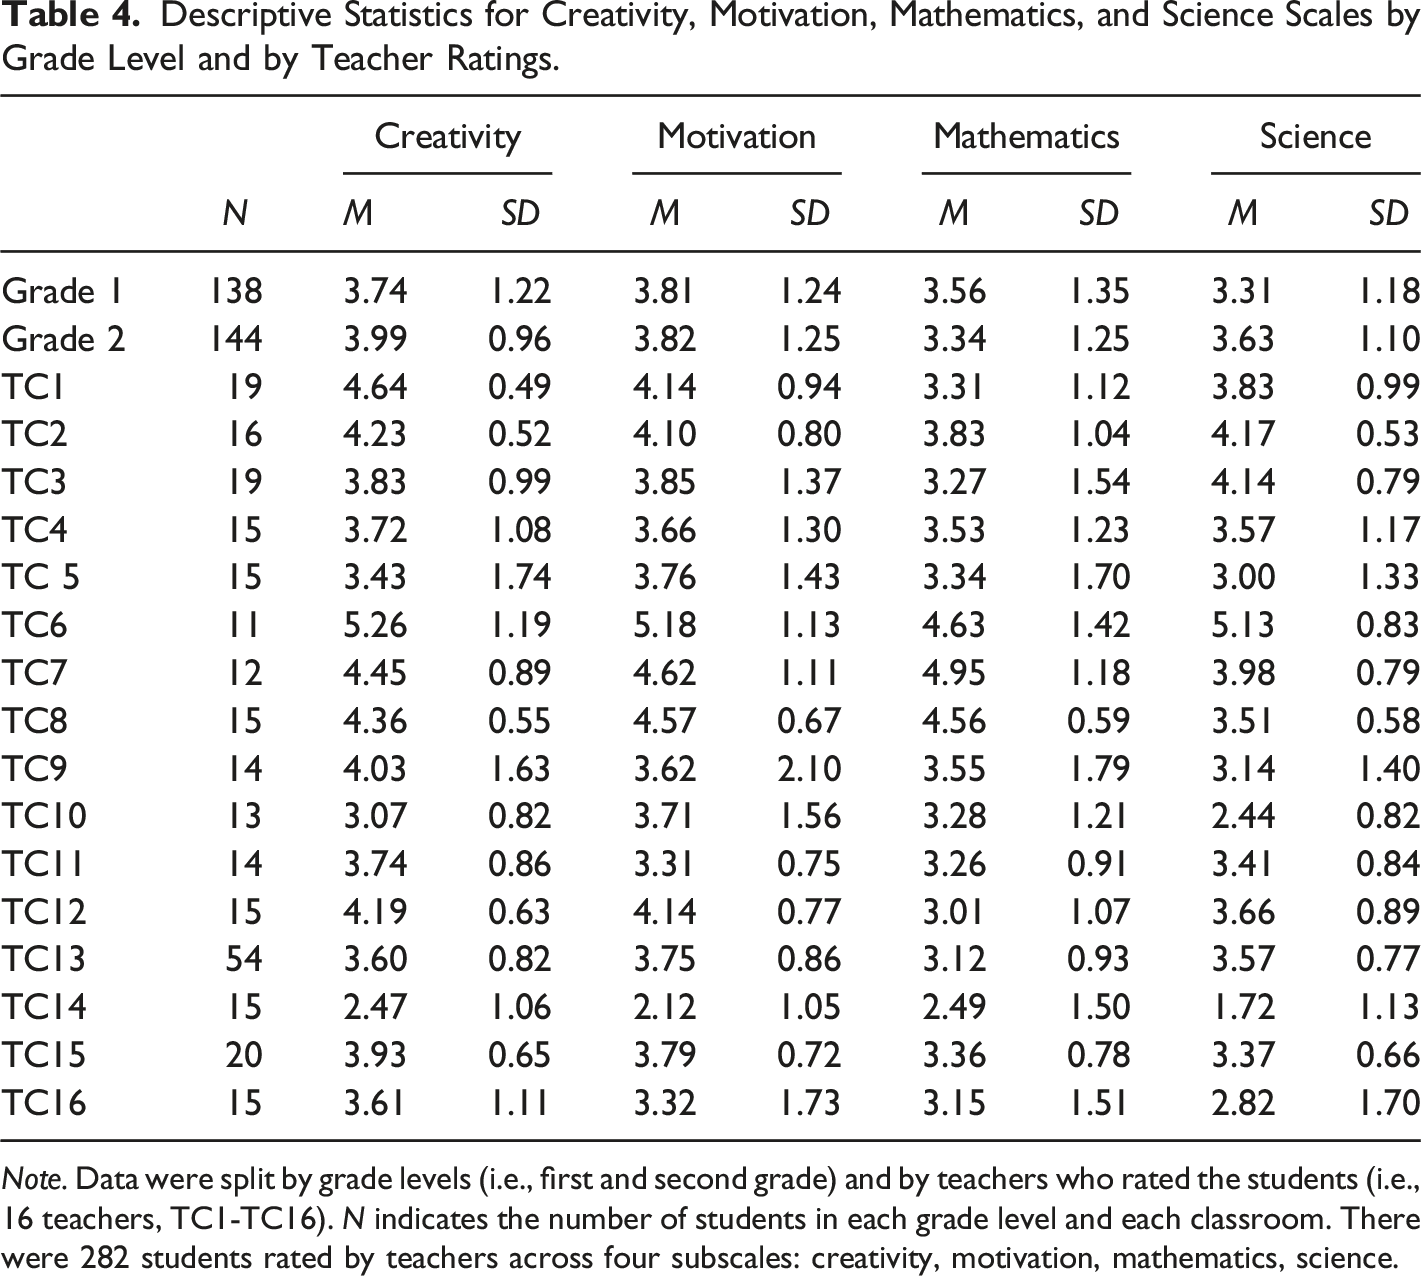
Note. Data were split by grade levels (i.e., first and second grade) and by teachers who rated the students (i.e., 16 teachers, TC1-TC16). N indicates the number of students in each grade level and each classroom. There were 282 students rated by teachers across four subscales: creativity, motivation, mathematics, science.
Research Question 1
To determine how much variability there was between teachers on the Renzulli Scale ratings, we ran four multilevel models with the mean of each student’s score at the dependent variable. Student mean scores (n = 282) were clustered within teachers (n = 16). The ICC for the creativity scale was .28 (
Research Question 2
Next, we examined the variance estimates in the three-level model (repeated measures within students, between students within teacher, and between teachers). The results indicated 25% of the variability was within students across scales, 56% of the variability was between students within teacher, and 19% of the variability was between teachers (
Research Question 3
Multilevel Modeling Results for the Three-Level Model Predicting Student Scale Average Score From Scale Type and Biological Sex.
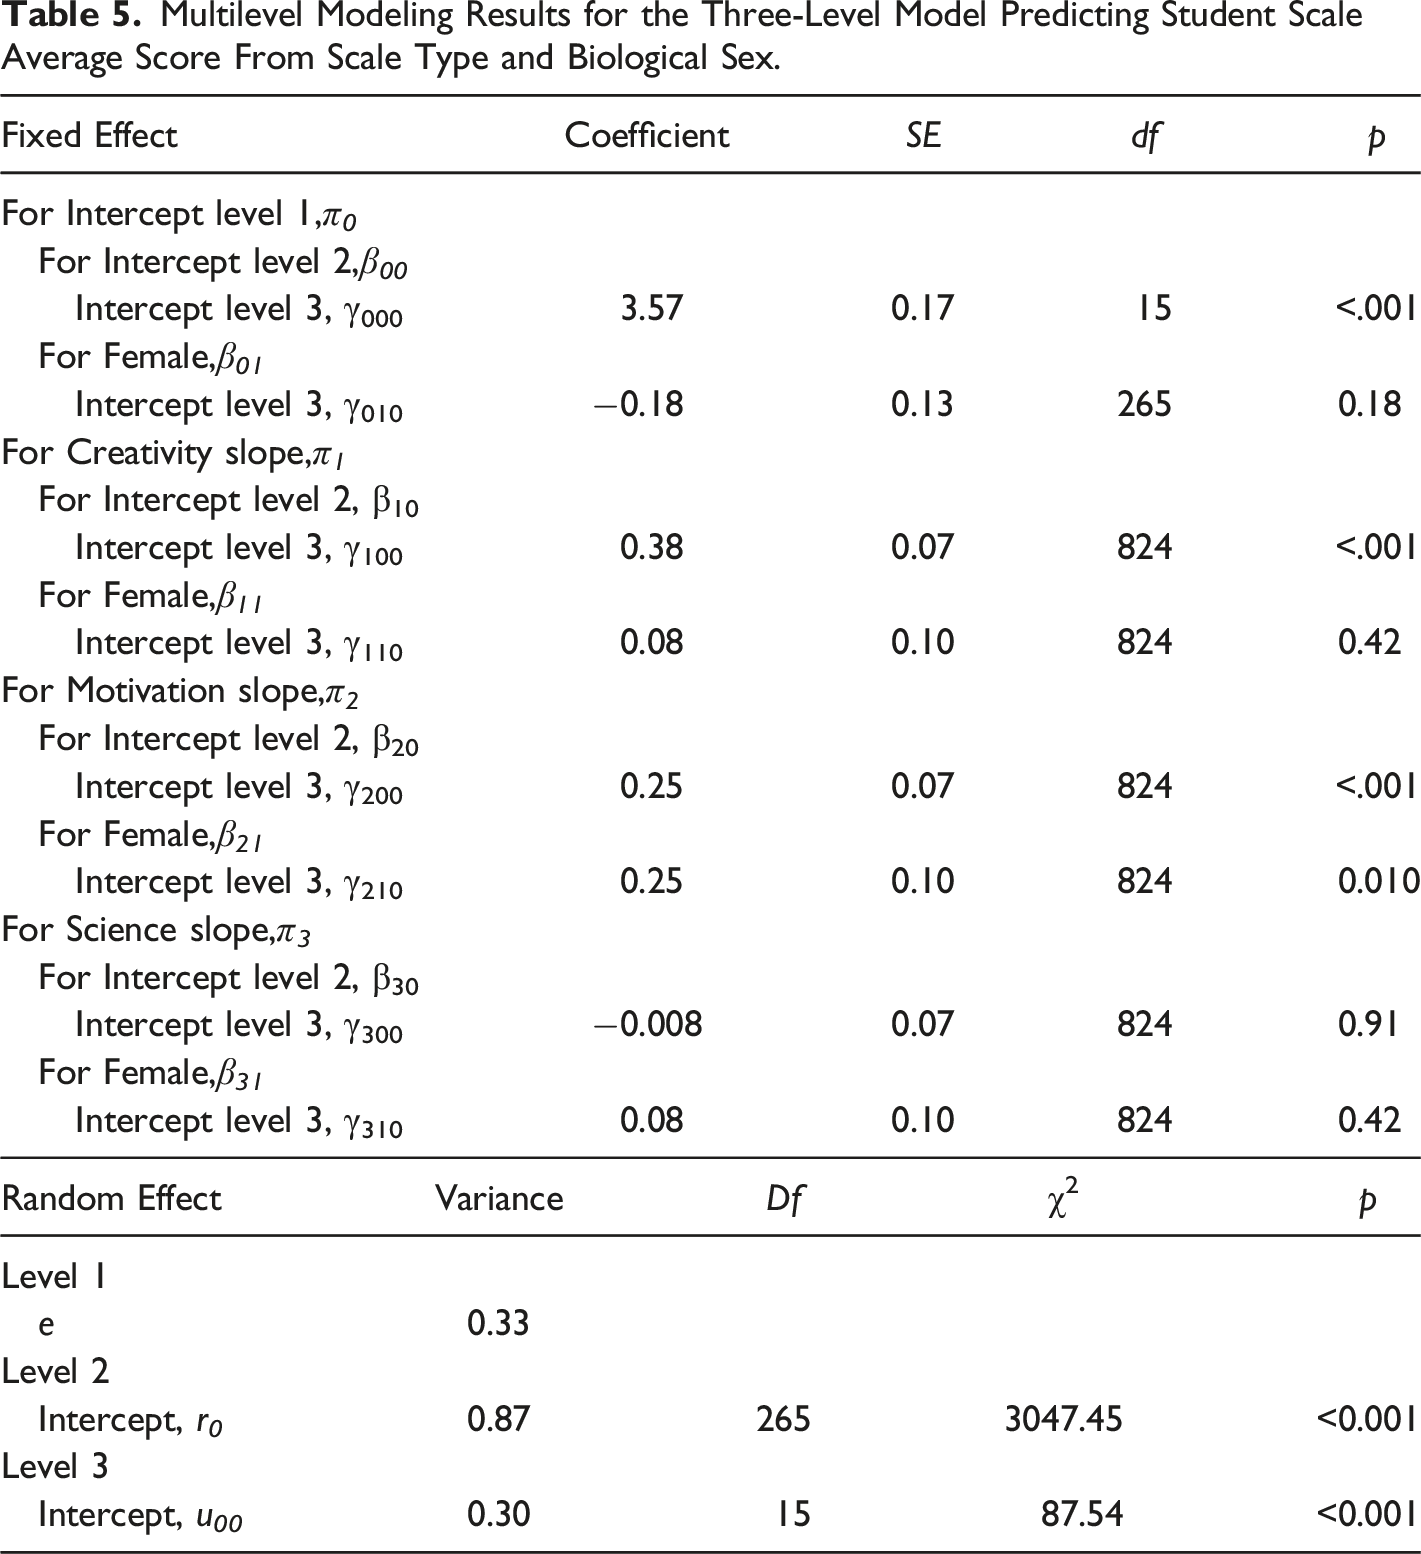
Before examining the biological sex differences, we noted that the average scores for each of the four scales were not the same. Specifically, the average scores were the same for mathematics and science (γ 300 ), but both creativity (γ 100 ) and motivation (γ 200 ) were statistically significantly higher than mathematics. There were no statistically significant differences in how teachers rated students who were male or female—except in motivation where teacher ratings of females were consistently higher than males (γ 210 ). Also noteworthy, there was statistically significant variability between students within classrooms and between teachers in their rating of mathematics ability.
Research Question 4
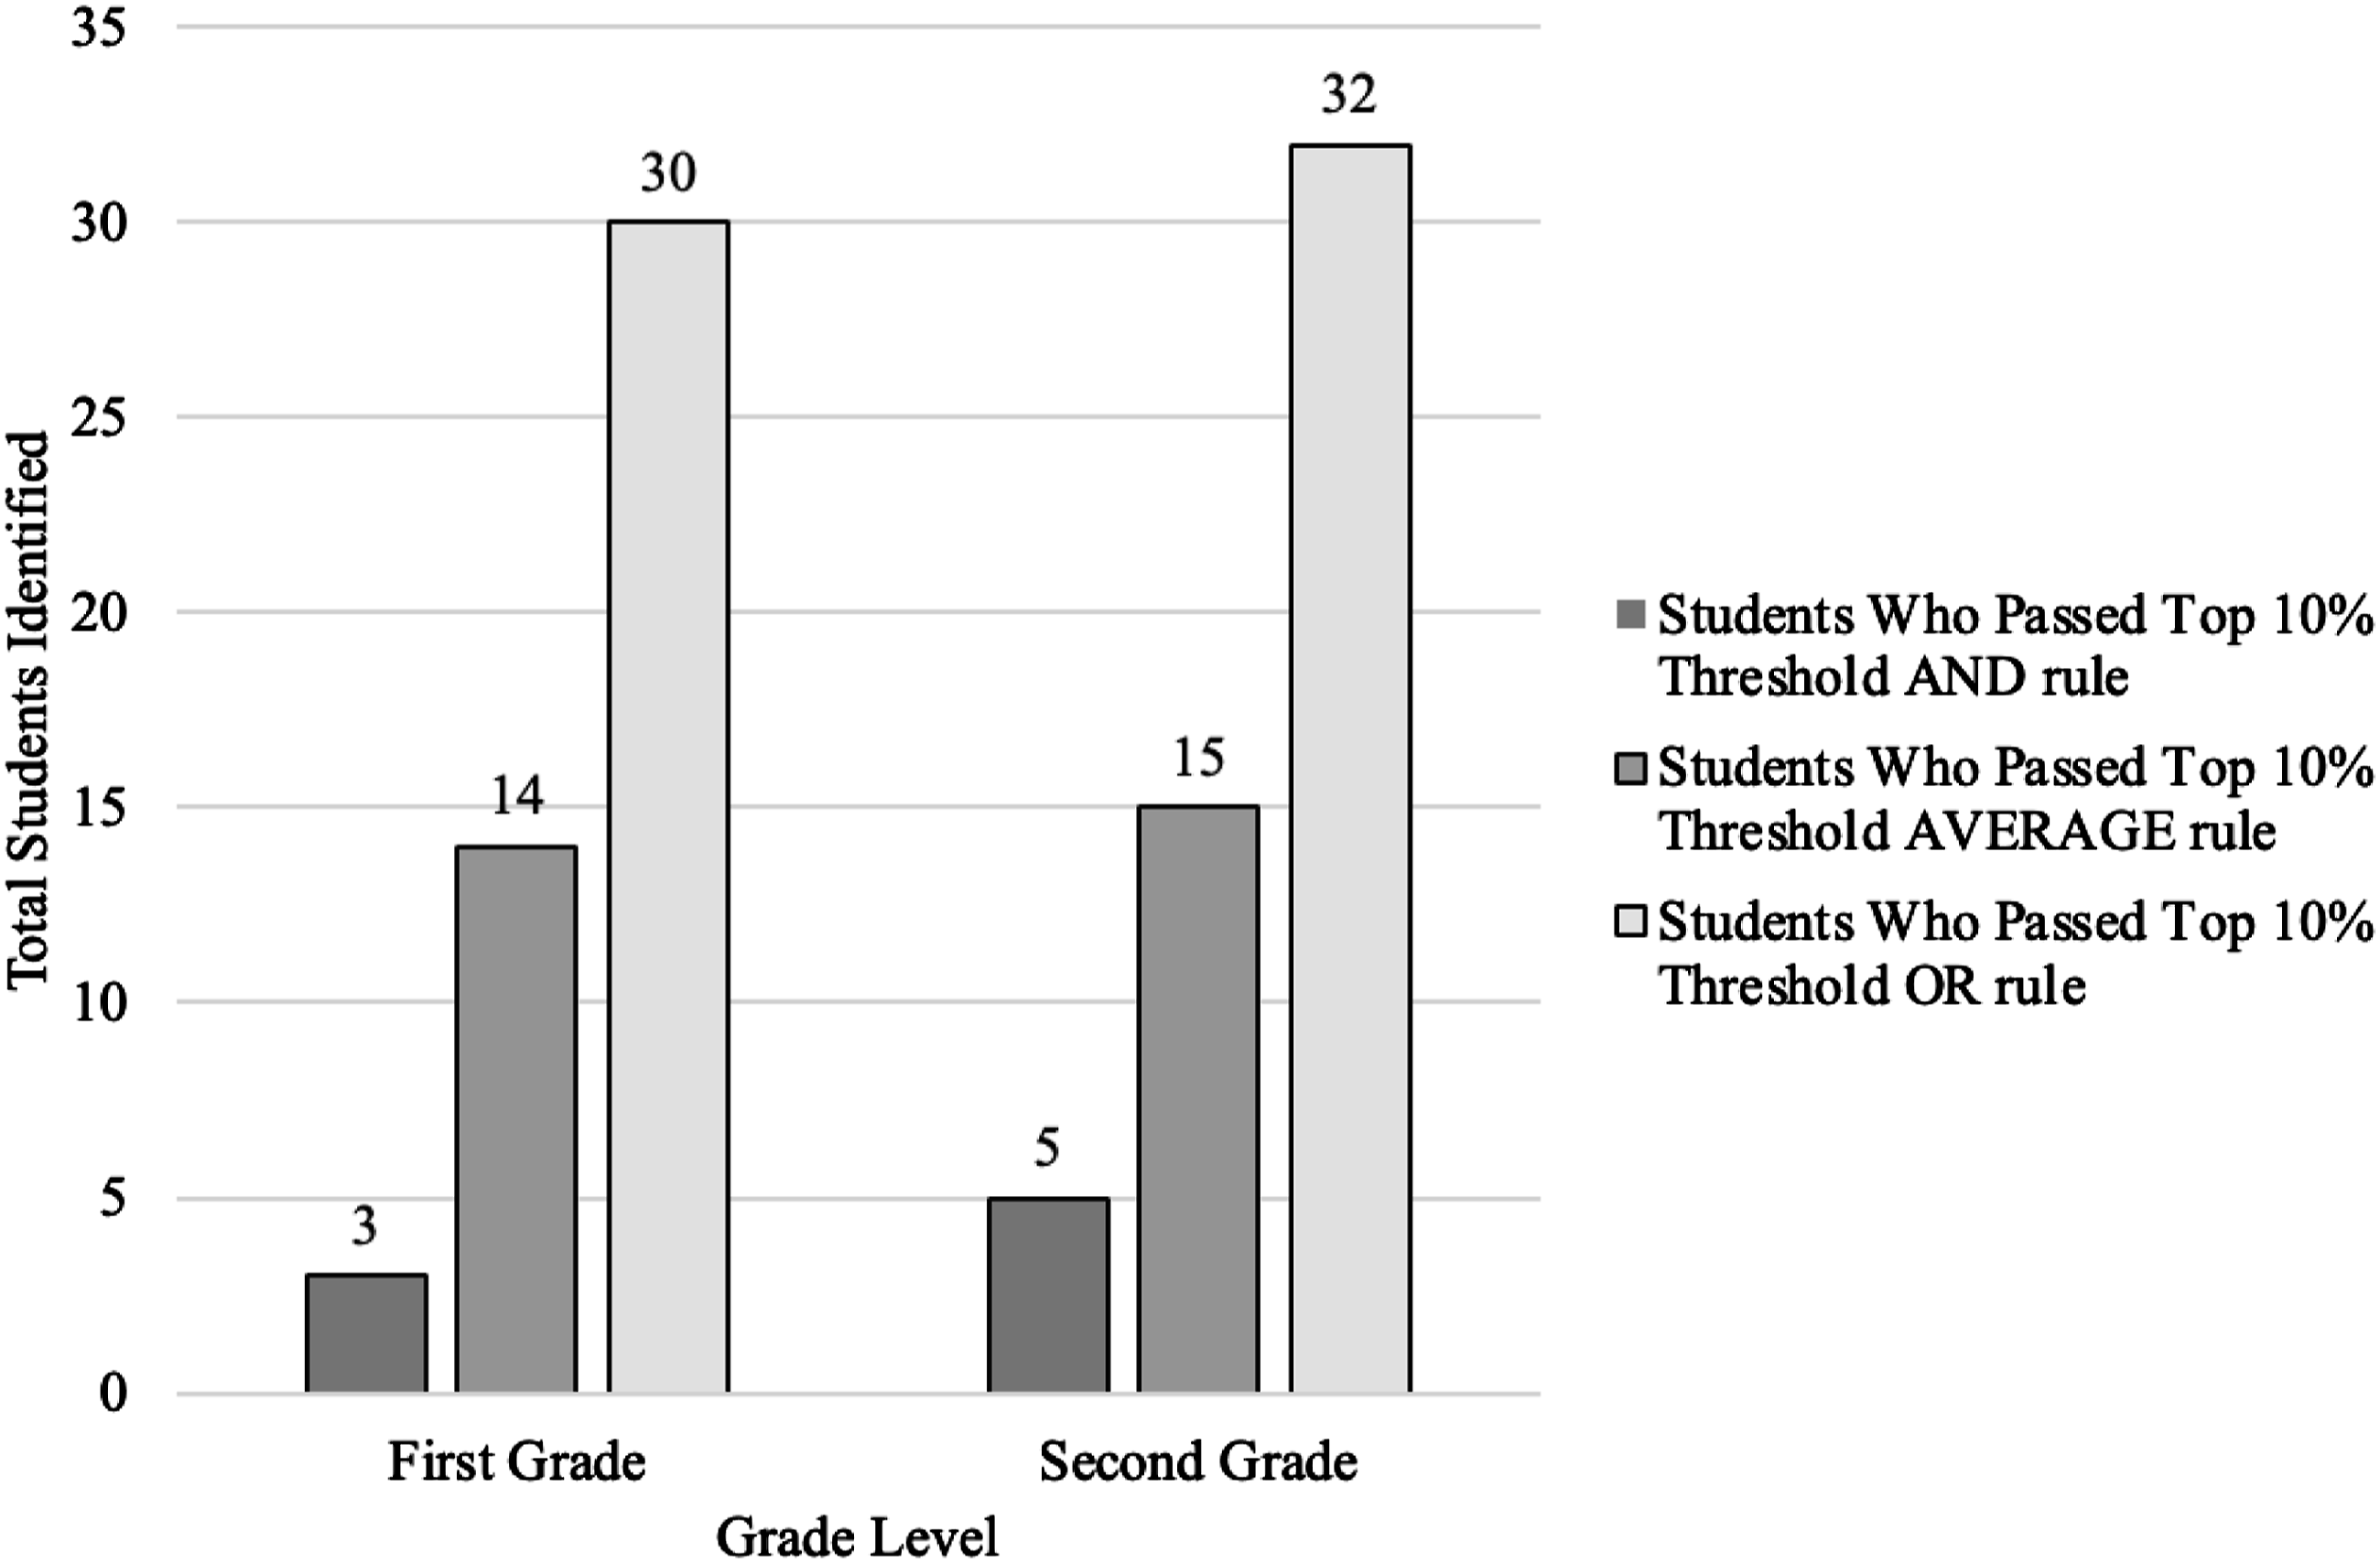
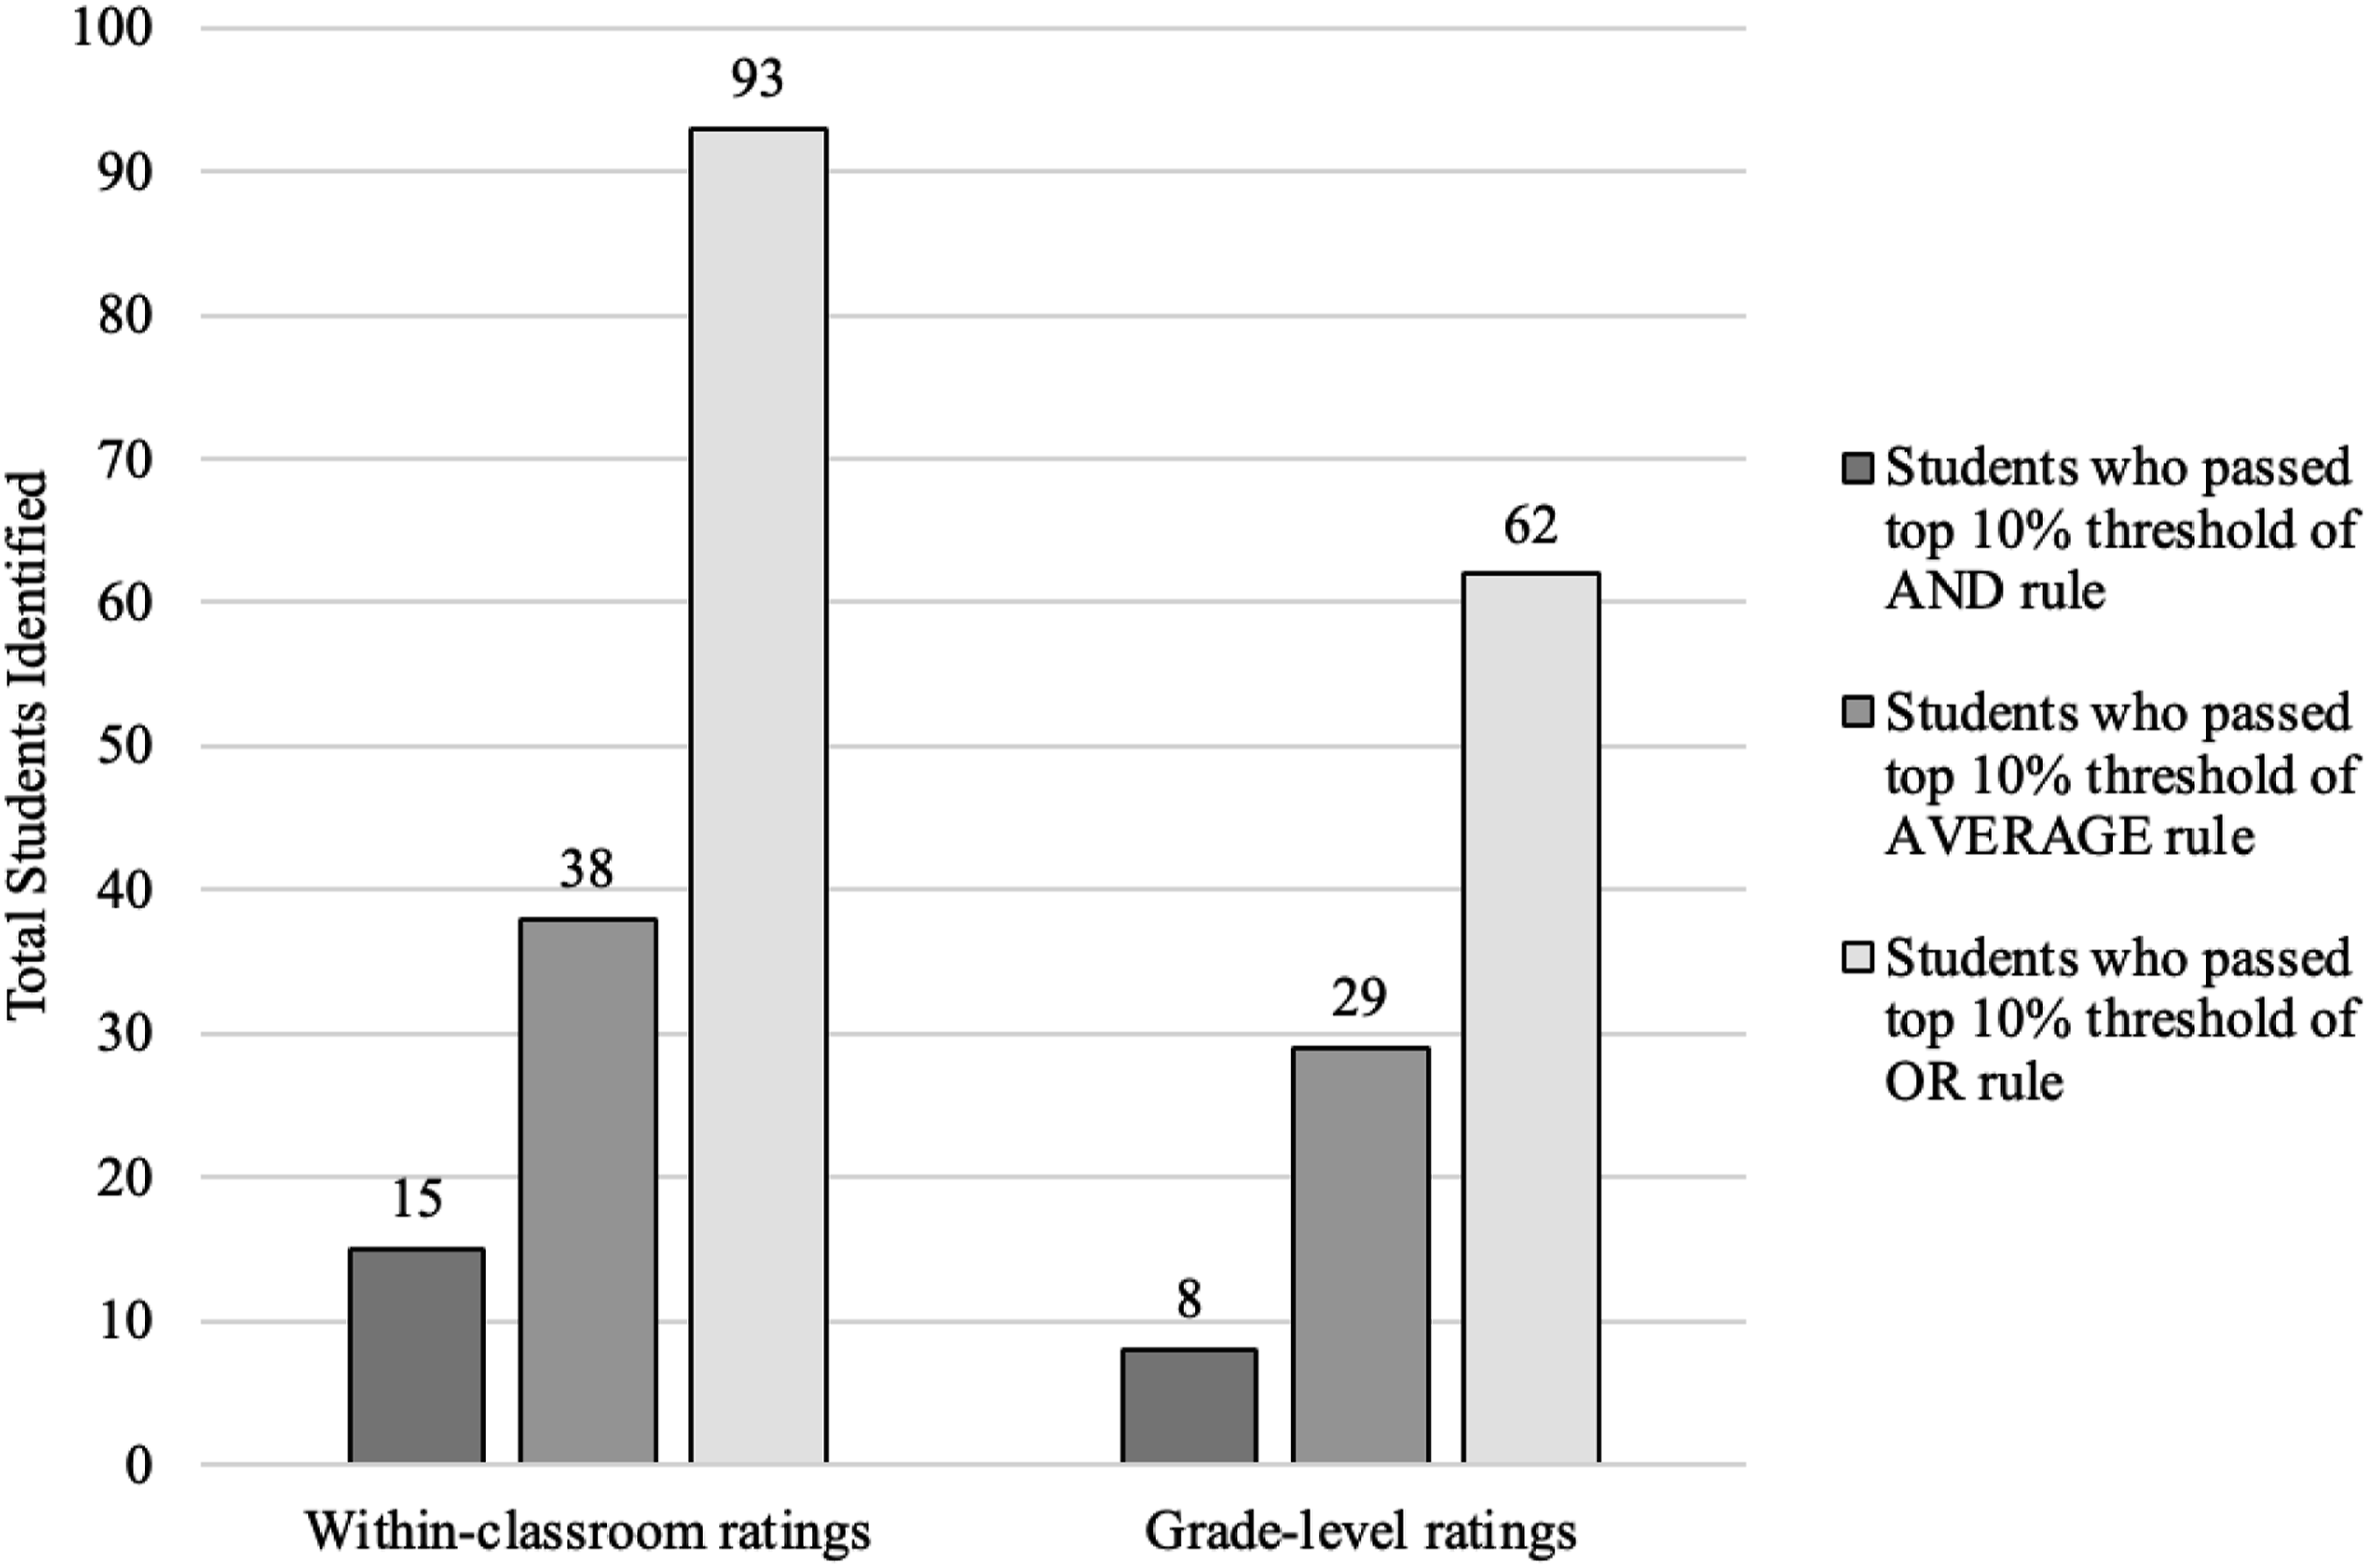
To identify students who passed the top 10% threshold for either AND, AVERAGE, or OR rules, we ran the analysis by examining ratings within the classroom and within the grade level. Regardless of combination rule, more students were identified within their classroom than within their grade level. As expected, by examining within classroom ratings, the OR rule yielded identification of the highest number of students followed by the AVERAGE rule and then the AND rule (see Figure 1). A similar trend was observed when we examined grade-level ratings (see Figure 2). Under both ratings 93 of 282 students (33%) and 62 of 282 students (22%) were identified with the OR rule, respectively (see Figure 3). For the AVERAGE rule, of the 282 students, 13% and 10% were identified within their classroom and grade level respectively. For the AND rule, of the 282 students, 5% were identified within their classrooms compared to only 3% identified within their grade level. Number of students that were identified as gifted within their classrooms at 10% cutoff. Note. Teacher 13 rated two classes. Number of students that were identified as gifted within their grade level at 10% cutoff. Number of students that were identified as gifted based on the AND, AVERAGE, and OR rules within their classrooms and grade level. Number of students identified using the combination rules (OR, AVERAGE, OR) as top in their classroom and top in their grade level.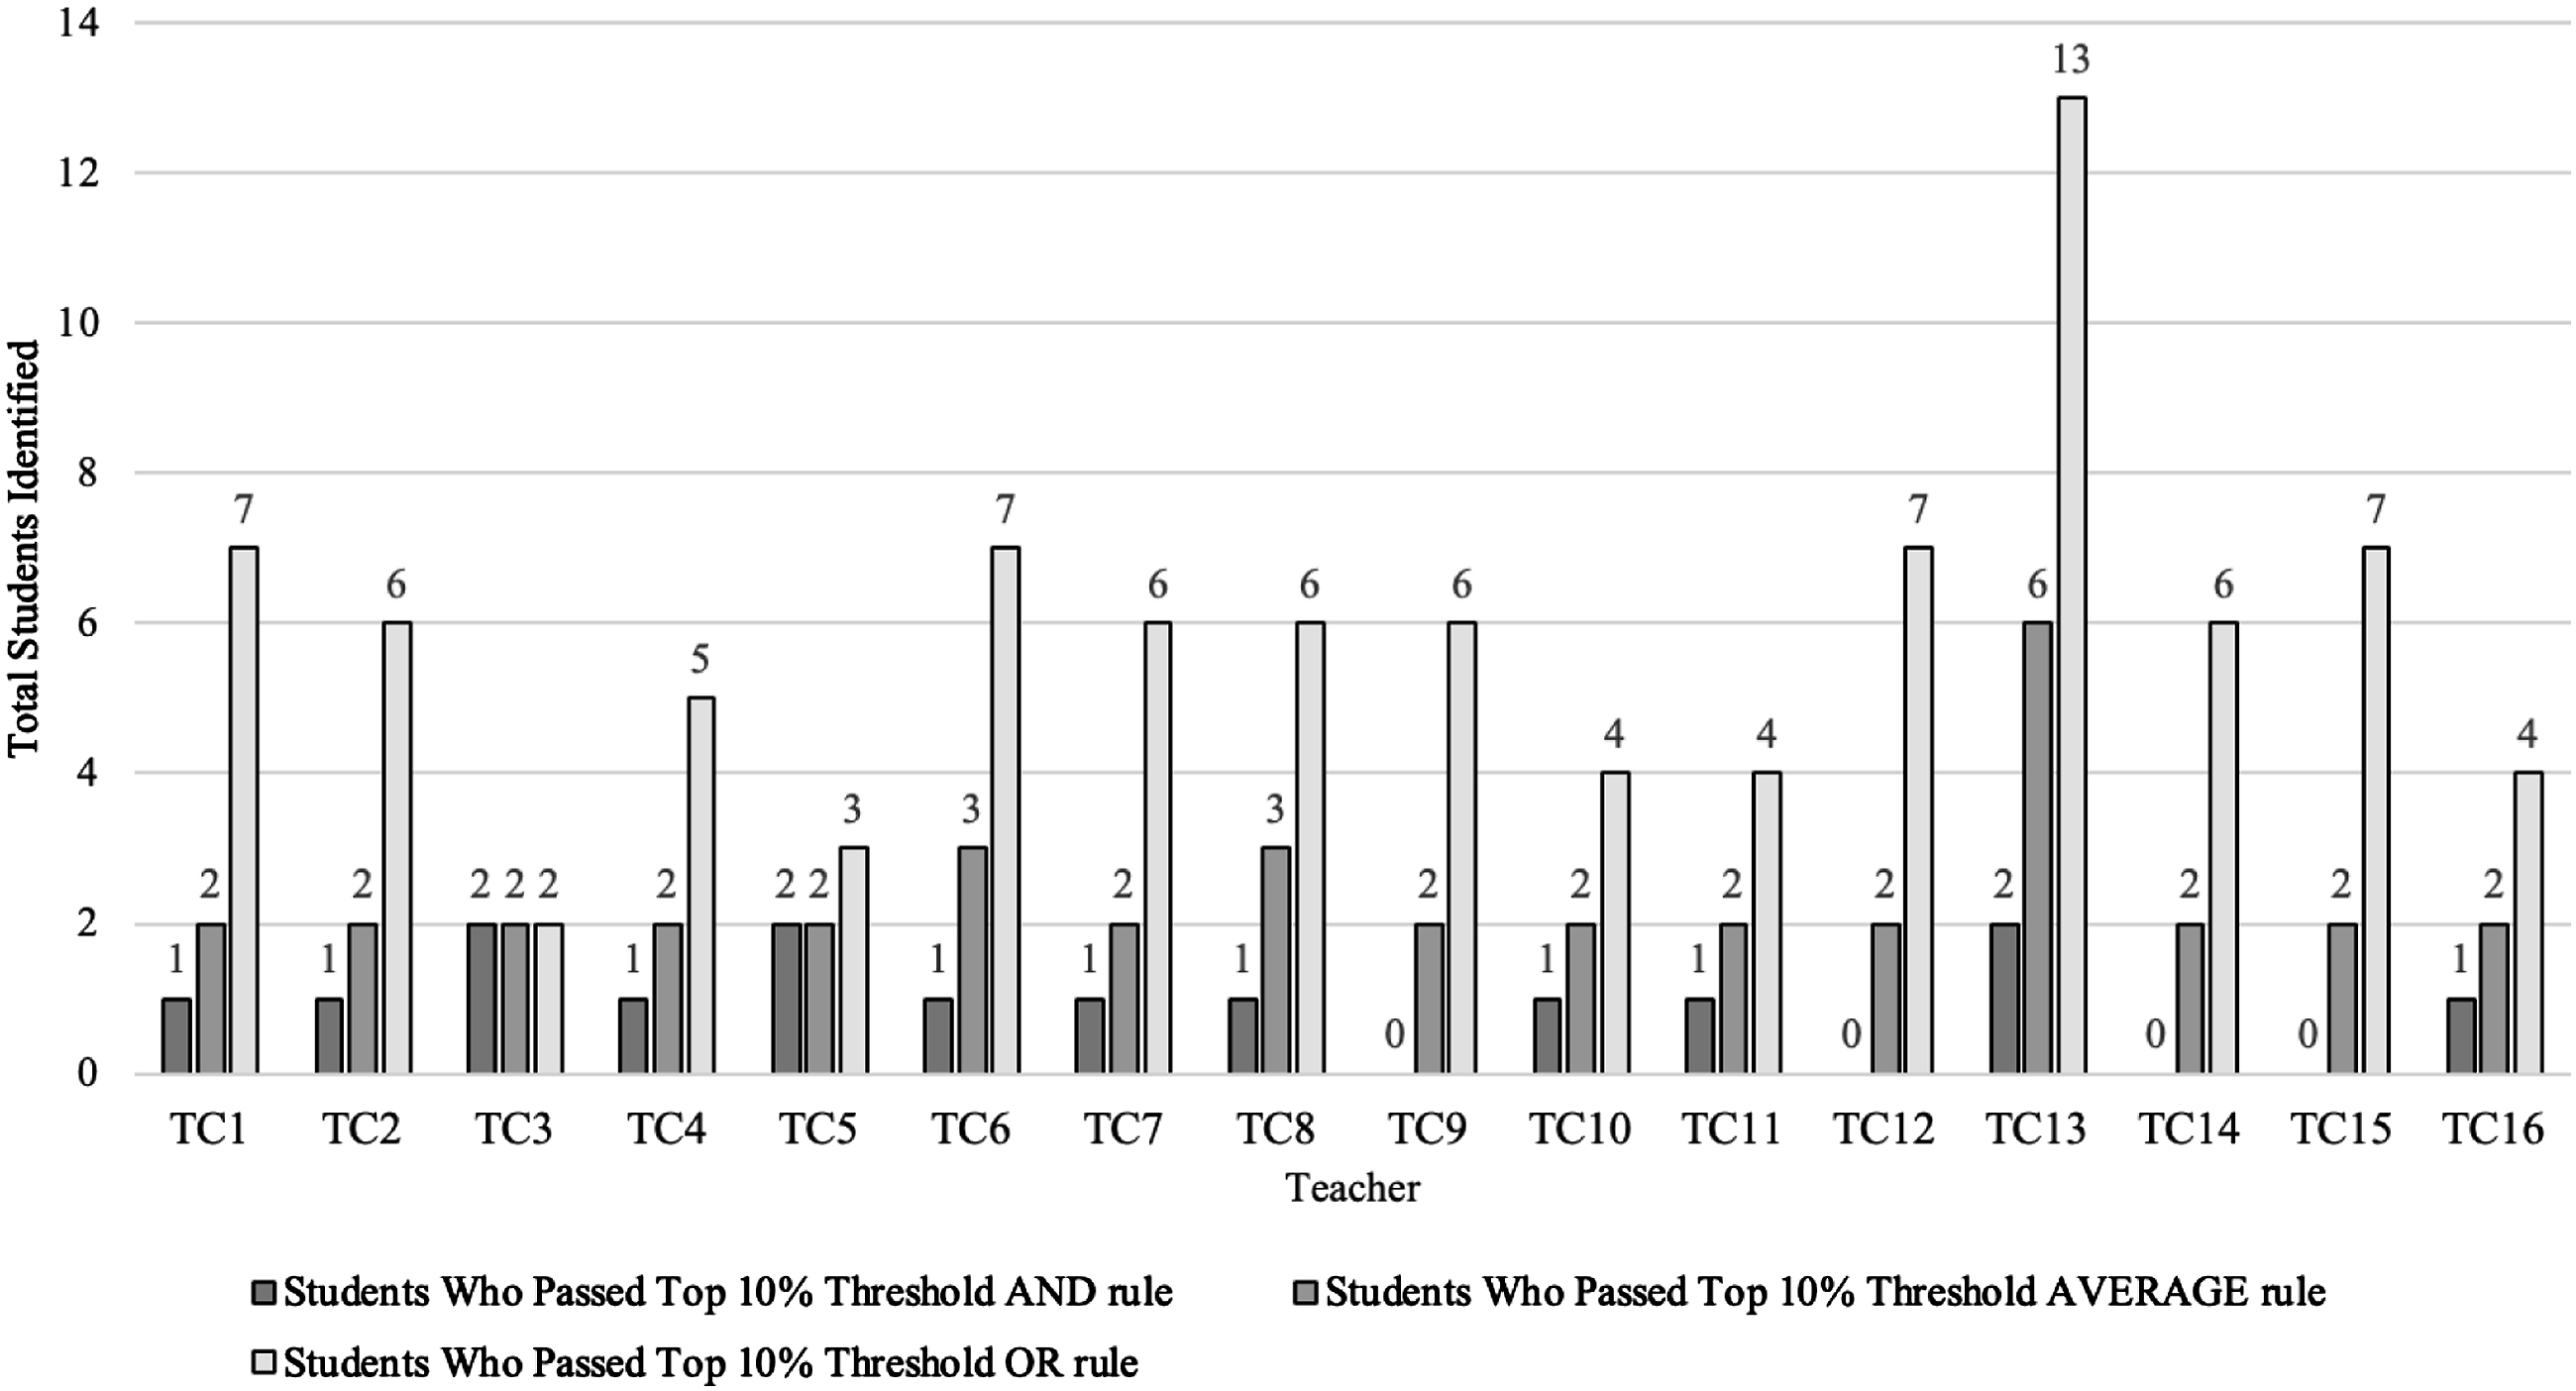

Research Question 5
Our last research question examined how much overlap existed between students identified using teacher ratings within classroom and grade levels after applying AND, AVERAGE, or OR rules across the subscales. For example, under the AND rule, there were 15 students identified within their classrooms, and eight students identified within their grade level. As to the overlap, six students identified within their classrooms were also identified within their grade level. Under the AVERAGE rule, there were 38 students identified within their classrooms, and 29 students identified within their grade level. As to the overlap, only two students identified within their classrooms were also identified within their grade level. In addition, under the OR rule, there were 93 students identified within their classrooms, and 62 students identified within their grade level (Figure 4). As to the overlap, nine students identified within their classrooms were also identified within their grade level. Ultimately, the OR rule had the most overlap, whereas the AVERAGE rule had the smallest overlap in identifying students for gifted services.
Discussion
Even though the teachers in this study received training, results indicate considerable variability exists between teachers in their ratings of students. Further, regardless of the combination rule, ignoring between-teacher variability in scoring patterns results in a very different group of identified students than if between teacher variability is taken into consideration. We discuss each in turn.
Teacher Rating Variability
Specifically, we observed several patterns in teacher rating variability: (a) there was substantial variability in teacher ratings and (b) teachers tended to rate female students higher than male students in motivation but similarly in creativity, mathematics, and science. The first way we examined the variability in teacher ratings was separately by scale. Teachers did not use the scales consistently across creativity, motivation, mathematics, and science. Some variability within a class is to be expected as students naturally vary in their interests and abilities (Pfeiffer, 2002; Reis et al., 2021), but if students are not systematically placed into classes (e.g., ability placements) the average ability across classes should be similar. Of all four scales, science averages across teachers were the most disparate, with motivation and creativity falling between the two extremes of mathematics (smallest) and science (largest) variability. More than a third of the variability in teacher ratings of student science ability was between teachers, which indicates that teacher class averages were quite different from each other. In mathematics, the variability between teacher scores was less than half of the variability between teachers in science scores. As mathematics is considered a core subject and science tends to be less of a focus in elementary school (McMurrer, 2008), how teachers view science ability appears to be more variable—perhaps more subjective—than mathematics ability. Given the high variability between teachers in science scores, it may be worth considering that science ratings should not be included when making determinations about who gets access to gifted services, especially for young students.
Despite the variability, the reliability across the scales between and within teachers was quite high. Other studies have illustrated the consequences of rater effects. For example, in Anthony et al. (2022), 134 teachers used the Academic Competence Evaluation Scales–Short Form–Teacher (ACES-SF-T) to rate students. Researchers evaluated the validity and utility of this scale. Despite high reliability estimates, the presence of rater effects impacted the validity of the use of the scores, which varied across subscales. Perhaps, the high reliability of the teacher ratings found here and in other studies is a consequence of rater effects. If teachers tend to use the scales similarly within themselves, this may artificially inflate the reliability of the ratings. If so, then teacher rating scales are less reliable than they appear, which raises additional concerns about using them to identify students for gifted services.
Next, we examined the variability in teacher ratings from another angle. We looked at how much variability there was within students across all four scales, how much was between students within a class, and how much was between teachers. About half of the total variability was between students in the same classroom, and there was almost as much variability between teachers as within students across scales. This indicates when a teacher rated a single student, the teacher did not rate the student the same across all scales—there was variability within a student’s ratings across creativity, motivation, mathematics, and science ability. We see this variability as evidence of the validity of teacher ratings within students as teachers were capturing some of the natural differences within students (e.g., a student with high mathematics ability may not also have high creativity), and it emphasizes the importance of taking into account multiple factors when selecting students for gifted services (Worrell, 2009). However, given the relatively high correlations among the constructs, there is also evidence that teachers may not differentiate well among the domains. This potential is consistent with some prior findings that suggested teachers using the Renzulli Scales may not score students uniquely across domains (Gridley & Treloar, 1984). We also looked at how teachers rated students within a class differently.
Concerning teacher’s judgments on rating student motivation, the previous finding affirmed that teachers’ judgments were not, or only very weakly, associated with student biological sex (Zhu & Urhahne, 2015). That said, our finding warrants further investigations to make certain that teachers reliably assess student motivation regardless of student biological sex. On the other hand, the extant literature highlighted that teachers might be susceptible to the influence of certain student behaviors as they rated male students lower because their behaviors were deemed inadequate compared to the female students’ behaviors (Bennett et al., 1993). Moreover, regardless of student biological sex, teachers were found to be less accurate in rating student motivation because they were not adequately informed on student motivation constructs and this might have affected their judgment (Urhahne et al., 2011). For this reason, teachers may need more training to evaluate student motivation and use multiple valid indicators so that they can gauge student characteristics (i.e., motivation) properly.
Another way we examined our data was whether teachers rated male and female students similarly or not. Our results indicated that teachers did not rate female and male students differently across three of four scales (i.e., creativity, mathematics, and science). This finding is consistent with a previous study in which researchers found no statistically significant relationship between student biological sex and teacher ratings (Biber et al., 2021). This latest finding from our study lends support to a newly published extensive review about teacher judgments by Urhahne and Wijnia (2021). That is, they concluded that most studies have confirmed that teacher judgment accuracy is no longer or only weakly associated with student biological sex. We found that teachers consistently rated female students higher than their male counterparts concerning their motivation scale. This finding replicates findings from a previous study in which female students in the gifted program were found to excel in motivation, metacognition, general academic self-concept, and academic self-perceptions compared to their male counterparts (Castejon et al., 2016). Further, our finding is also consistent with Praetorius et al. (2017)’s study indicating that teachers’ level of judgment on student motivation was found to be higher for female students than male students. Overall, our finding is aligned with a meta-analysis study by Petersen (2013) highlighting that biological sex bias in gifted education has significantly declined, specifically when students were identified using multiple assessment criteria.
To the implications of variability in teacher ratings, the variability between teachers in their ratings across multiple areas such as academic ability (in this case, mathematics, and science) and their motivation and creativity is, at best, a nuisance and, at worst, quite problematic. As the delivery of services for gifted students often depends on these judgments, we urge caution as to whether or not teacher rating scales should be used to determine eligibility for services. At the very least, the variability in scores should be acknowledged, considered, and addressed.
Combination Rules
With respect to our identification approaches, we employed a combination rule of the conjunctive (AND), disjunctive/complementary (OR), and compensatory (AVERAGE) models developed by McBee et al. (2014) in which gifted students were identified at the 10% cutoffs of their mathematics, science, creativity, and motivation scores rated by their teachers. Because the scores were determined by teacher ratings, we extended these analyses by taking into account teacher variability (identifying the top students in a classroom) as well as the grade level where students were situated (identifying the top students in the grade level). Our results indicated that more gifted students were identified when the top students in a classroom were identified (i.e., the highest rated students for each teacher) compared to ignoring the clustering by teacher and identifying the top students in each grade level (see Figure 3).
Furthermore, of all three combination rules that we employed (AND, AVERAGE, OR rules), the disjunctive/complementary (OR) rule identified 93 gifted students by teacher compared to only 62 students using grade-level rating. That said, the OR rule is best suited for identifying gifted students from more diverse backgrounds in terms of their skills and abilities, socioeconomic status, and school locations (McBee et al., 2014). This finding is aligned with previous studies in which the OR rule along with teacher ratings have been identified as a more inclusive way to identify gifted students (Azano et al., 2017; McBee et al., 2014).
Particularly noteworthy was that students who were identified within their classrooms were a very different group than those who were identified within their grade level across every type of combination rule. This study marks a first step in illustrating the consequences of accounting for or ignoring teacher variability in ratings and applying combination rules to identify students for gifted services—but only in counts and overlaps (or lack thereof). Future studies should consider examining just how different the academic profiles (e.g. performance on achievement assessments, ability tests) are of the identified students from teacher ratings (both top in the classroom and top in the grade level). Also, future studies should consider how the application of combination rules across multiple data sources relates to the composition of students identified (e.g., do OR and average rules applied to achievement scores and teacher ratings produce a more diverse group of students than achievement scores alone?).
Limitations
All studies have limitations, and this is no exception. Between-teacher variability could be reflective of true teacher-scoring variability or actual variability in the students placed into each classroom. Also, each student was evaluated by only one teacher. Although given the setting of students within a single teacher’s classroom, future studies may want to consider having multiple teachers rate the same students. Also, due to the unavailability of a first grade and a second grade teacher, one of the elective teachers rated their classrooms. Although this teacher works with the students weekly, the teacher is not the primary teacher for the classes and may not know the students as well as their classroom teacher. Also, the use of percentiles may have inflated the number of students identified in teacher’s classrooms. For example, in one class, four students of 19 had the same 90th percentile score in creativity and were thus identified as meeting the criteria for creativity. Additionally, having multiple assessors would help to further specify what variability is due to teacher differences in how they use the scale versus true underlying ability differences within students. Further, with only 16 teachers, we were underpowered to detect any effects at the teacher level (e.g., grade level taught, years of experience). Also, due to the homogeneity of the students at this school, we were unable to determine the potential for biases with respect to race, ethnicity, or background.
Conclusions
In an increasingly diverse society, processes for identification that include rather than exclude students from underserved populations have value. For the school in our study, less than 1% of students are identified for services, which is the result of traditional exclusive requirements for gifted services and severely behind the national identification rate of 6% (Office of Civil Rights, n.d.). We were hopeful that using teacher ratings would be an effective way to identify more students. Unfortunately, this approach yielded a large amount of variability between teachers in their ratings of student abilities. When added to the suite of assessments to consider for identification for gifted services, teacher rating scales may increase diversity and number of students in gifted classrooms (Lohman & Lakin, 2021), but the consequences of accounting for or ignoring teacher variability in ratings in conjunction with combination rules have not been previously illustrated. These results illustrate that although the AVERAGE and OR combination rules applied to teacher ratings increases in the number of students identified, the lack of consistency between teacher ratings makes the determinations of who gets access to services largely dependent on who rated the student. Simply put, this is unfair to students and not defensible.
Unfortunately, given the considerable variability in teacher ratings, using classroom or grade-level comparisons resulted in two mostly non overlapping groups of students regardless of the combination rule applied. In this way, multiple measures may not simplistically “be better” because the combination of these multiple measures that contain between teacher variability has real consequences for who has access to services. Assuming the average achievement in classrooms is similar, who rated the student has a large impact on who is likely to receive services. Perhaps, this is problematic enough to support that teacher ratings should not be considered when making decisions about services. If teacher ratings are going to continue to be a mainstay of gifted education identification practices, our recommendation is to use them to widen the pool of potential students—but never to narrow it.
Footnotes
Declaration of Conflicting Interests
The author(s) declared no potential conflicts of interest with respect to the research, authorship, and/or publication of this article.
Funding
The author(s) disclosed receipt of the following financial support for the research, authorship, and/or publication of this article: This work was supported by the US Department of Education-Javits Grant (s206a190014).