



Abstract
Individuals with intellectual disabilities (ID) often experience a combination of both intellectual and adaptive functioning deficits that impact conceptual, social, and practical domains. These deficits can negatively impact an individual’s ability to achieve independence and sustained employment. Fortunately, research has shown assistive technology can help support employment skills for individuals with ID. This multiple baseline design study investigated the use of a Task Analysis smartphone application, which utilized video and audio prompting, with four young adults with ID on the completion of work-related office tasks. Findings indicate that all four young adults with ID showed large effect size gains for completing several common office-related tasks including shredding, copying, and scanning. Implications and future research are discussed.
A number of reports have shown unemployment rates for individuals with intellectual disabilities (ID) range between 66% and 95.3% (Anderson, Larson, & Wuorio, 2010; Butterworth et al., 2012; National Core Indicator [NCI], 2015; Siperstein, Parker, & Drascher, 2013). The high unemployment rates for individuals with ID are disheartening, especially given the U.S. unemployment rate has been on a steady decline for the past decade, hovering around 4% for the past several years (U.S. Bureau of Labor Statistics, 2018). Individuals with ID are greatly underemployed, with only 17% reporting to have a paid community job (NCI, 2015). For those individuals with ID who are employed, very few are employed full time, paid competitive wages, or receive work-related benefits (Anderson et al., 2010; NCI, 2015; Siperstein et al., 2013; Siperstein, Heyman, & Stokes, 2014). The average salary for adults with ID was US$7.82 per hour, with only 24% of those employed receiving job benefits (NCI, 2015).
Research has repeatedly demonstrated the positive impact of employment on individuals with ID. Employment for individuals with ID has shown to result in improved quality of life including increased self-confidence, a source of income, feelings of community, and an improved social network (Lindsay, Cagliostro, Albarico, Mortaji, & Karon, 2018; Nota, Ginevra, & Carrieri, 2010; Wehmeyer & Bolding, 2001). Completing a job independently and correctly while feeling connected to others at work helps to fill basic psychological needs for individuals with ID (Akkerman, Kef, & Meininger, 2017). Employment for this population holds great value; however, many individuals with ID continue to face many barriers preventing them from maintaining gainful employment.
Employment Barriers
There are a number of barriers (e.g., lack of social skills, cognitive difficulties, missing prerequisite work skills) that individuals with ID must overcome in order to be successfully employed (Noel, Oulvey, Drake, & Bond, 2017). These barriers are often a combination of both intellectual and adaptive functioning deficits that affect conceptual, social, and practical domains (Noel et al., 2017). These deficits can negatively affect an individual’s ability to maintain sustained employment due to reduced cognitive abilities, which impacts their working memory and conceptual understanding (Davies, Stock, & Wehmeyer, 2002). Moreover, to increase job skills and employability, individuals with ID often require continued assistance, training, and frequent prompts (Sauer, Parks, & Heyn, 2010). Generally, these supports are provided in a variety of ways including the use of job coaches, instructional support, prompting, and assistive technology (AT).
Effective Employment Supports
Job coaches
Instructional support for individuals with ID on the job site is typically provided by job coaches. The purpose of a job coach is to support and assist an individual with disabilities in the completion of tasks associated with the individual’s work setting. Job coaches typically employ strategies and instructional supports such as verbal instruction, modeling, prompting and fading methods, as well as task analysis to aid individuals in learning and performing a specific skill. The support and instruction provided by job coaches has been shown to positively impact work performance of individuals with ID, ultimately leading to sustained gainful employment (Rogan, Banks, & Howard, 2000). While job coaches provide invaluable assistance, they are a limited and costly resource. Additionally, there is some concern that individuals with ID may become overreliant upon job coaches, which may inadvertently hinder opportunities for social interactions and independence (Carter, Sisco, Brown, Brickham, & Al-Khabbaz, 2008; Gilson & Carter, 2016).
Instructional support
Another way that individuals with ID can be supported in employment settings, in addition to job coaches, is through instructional support. Successful employment has been found to be a result of quality transition education that includes instructional support (Mazzotti et al., 2016). Systematic instruction that includes chained responses (via task analysis) has been found to be an effective evidence-based practice (Spooner, Knight, Browder, & Smith, 2012). Additionally, various prompting methods (e.g., verbal, visual) are commonly used to provide instructional support and are an important component of many interventions to teach diverse skills to students with ID (Gilson, Carter, & Biggs, 2017).
Prompting methods
Historically, prompting has been one of the most important methods for teaching new skills to individuals with disabilities (Banda, Dogoe, & Matuszny, 2011; Wolery & Gast, 1984). Prompting is used during instruction to help individuals acquire new skills and behaviors, minimize errors, and provide feedback for incorrect responses. Sensory prompting methods are those that include auditory, verbal, or visual prompts. Visual prompts of supports such as static picture prompts and video modeling have shown to be effective strategies in teaching skills to individuals with moderate ID (Alberto, Cihak, & Gama, 2005).
Video prompting has been used widely to teach a variety of skills to individuals with ID. A review by Banda, Dogoe, and Matuszny (2011) found video prompting was a viable option for teaching household, work, and independent living tasks. Video modeling uses recordings of a model completing all of the required steps of a task from the beginning to the end (Alberto et al., 2005). In contrast, video prompting uses recordings of a model completing specific steps of a task that are played individually. While both have proven to be effective in teaching skills to individuals with ID, video prompting has been found to be more effective than modeling (Cannella-Malone et al., 2006; Cannella-Malone et al., 2011). Prompting methods have been shown to help individuals with ID complete employment tasks and maintain employment.
AT
AT is a resource that has repeatedly demonstrated the ability to help individuals with ID gain independence across various aspects of their lives and is capable of reducing the dependence upon others to promote independence within the workplace (Cihak, Kessler, & Alberto, 2008). Recent reviews found AT was successful for increasing work performance of individuals with ID in the workplace in respect to productivity, navigation, time management, and task completion (Collins & Collet-Klingenberg, 2017; Morash-MacNeil, Johnson, & Ryan, 2018). AT that includes evidence-based techniques, such as videos as prompting tools or task analysis, has been shown to increase job task performance and completion, while decreasing the number of prompts required by a job coach (Van Laarhoven, Johnson, Van Laarhoven-Myers, Grider, & Grider, 2009). Additionally, AT is much more cost-effective than one-to-one job coaching. AT also provides several other advantages over depending solely upon job coaches, in that it is more affordable, readily available, and there is minimal social stigma associated with its use (Chang & Wang, 2010).
Portable devices
Portable electronic devices (e.g., smartphones, media players) are a type of AT. Portable electronic devices have increasingly been used to assist individuals with ID to successfully complete work-related tasks by utilizing audio, video, and picture prompts (Collins, Ryan, Katsiyannis, Yell, & Barrett, 2014; McMahon, Cihak, & Wright, 2015). A recent review by Morash-MacNeil, Johnson, and Ryan (2018) identified five studies that examined the effectiveness of portable electronic devices in employment settings and found the use of these devices resulted in large effective ES gains percent of nonoverlapping data (PND) 98%; standard mean difference (SMD) 2.9; Tau-U 0.93).
Purpose
Video prompting has been shown to be a robust method for teaching skills to individuals with ID (Banda et al., 2011). Additionally, research has shown that AT has helped individuals to complete step-by-step tasks correctly and independently and has also been used effectively in employment settings (Cihak et al., 2008). However, there is limited research available examining the use of portable electronic devices to self-direct video prompts for individuals with ID. The potential this technology may have in increasing sustainable employment for individuals with ID is immense. Hence, the purpose of this study is to examine the effectiveness of a highly customizable Task Analysis application that utilizes a combination of features, including picture, text, audio support, video prompting, and video modeling feature, as a mechanism to complete assigned novel office tasks independently and efficiently.
Method
Participants and Setting
Participants included four young adults with ID attending a 4-year postsecondary education program that is housed on a medium-sized public university located in the Southeastern United States. The program provides an integrated course of study for 40 students with ID to enhance independent living and employment skills. Selection criteria for participants required that they (a) be enrolled in the post-secondary education program (PSE) designed for young adults with ID, (b) have a diagnosis of moderate ID (i.e., IQ of 36–51), (c) be able to use mobile technology (e.g., text, email, check account balances) independently and proficiently, and (d) not be able to perform common office-related tasks (shredding, copying, and scanning) independently. Students were considered to be independent when they could complete a task without instruction from a program instructor. After program instructors made preliminary recommendations of students who typically encounter difficulties with work-related tasks, participants were screened to identify those who could not operate the shredder, copier, or scanner independently using a checklist of basic functions for each office task. All work tasks (i.e., shredding, copying, and scanning) were conducted in the program’s office workroom with dimensions of approximately 9 feet × 12 feet.
Alex
Alex was a 19-year-old male student in his first year of the PSE program. Alex had an IQ of 44 (Wechsler Adult Intelligence Scale—Fourth Edition) which placed him in the moderate ID range. He had an adaptive behavior composite standard score of 81 according to the Adaptive Behavior Inventory–Short Form.
David
David was a 20-year-old male student in his first year of the PSE program. David had an IQ of 42 which placed him in the moderate ID range. He had an adaptive behavior composite standard score of 38 according to the Adaptive Behavior Assessment System—Second Edition.
Finn
Finn was a 20-year-old male student in his first year of the PSE program. Finn had an IQ of 46 which placed him in the moderate ID range. He had an adaptive behavior composite standard score of 75 according to the Vineland II Adaptive Behavior Scale.
Spencer
Spencer was a 19-year-old male student in his first year of the PSE program. Spencer had an IQ of 48 which placed him in the moderate ID range. He had an adaptive behavior composite standard score of 70 according to the Vineland II Adaptive Behavior Scale.
Materials and Procedures
Task analysis using AT
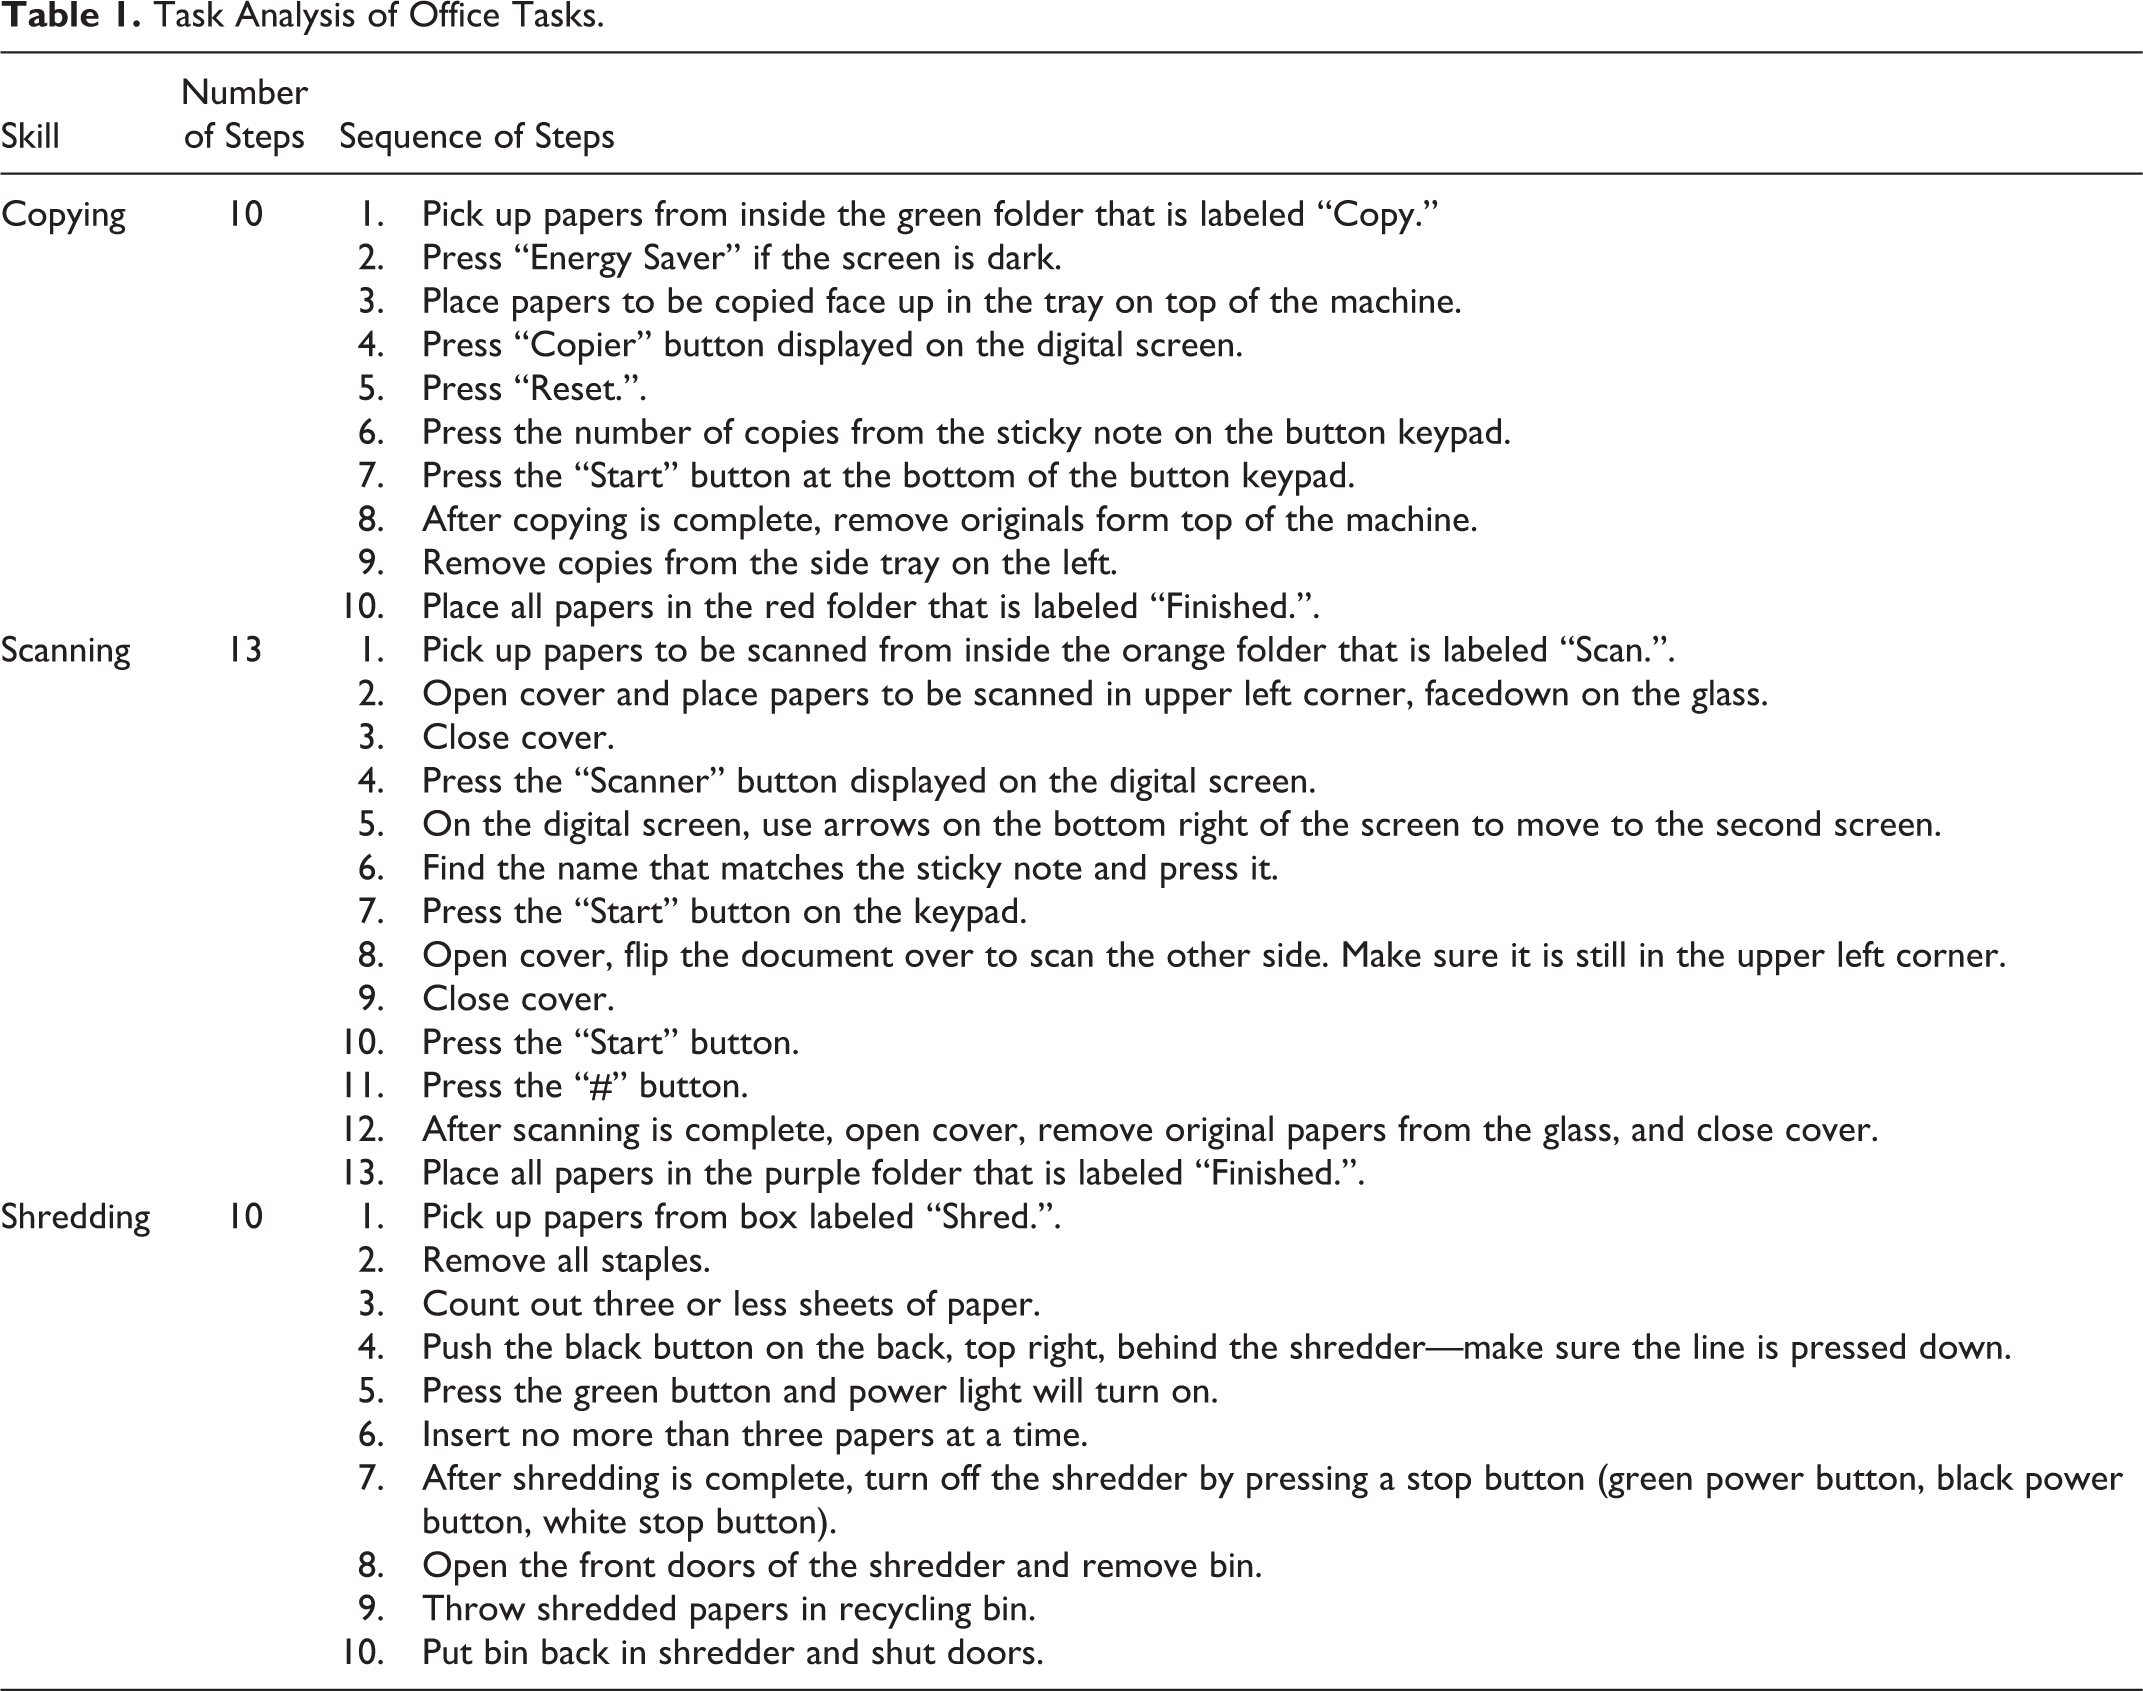
Students used an iPhone 6 with Task Analysis Lite application software that can be downloaded for free through the Apple Store. This software breaks complex tasks into individual steps by providing students with a picture, audio, and video delivery for each step of the task. The app also has a feature called the overall video mode that combines all individual step recordings into one continuous video to display the task analysis in its entirety. The researchers developed separate task analyses for three common office-related tasks including shredding paper, copying documents, and scanning documents. Each task analysis consisted of 10–13 steps of similar levels of difficulty (see Table 1). Tasks were broken into their individual steps and then recorded sequentially using the Task Analysis app. Each step of the task analysis included the following three components: (a) directions for the individual step, (b) a picture of the completed step, and (c) recording of a researcher completing that step, while reading the directions for the step aloud. Using the Task Analysis app on the mobile device, participants were able to view the step-by-step task analysis for each office task. Participants had the option of watching the overall video or click on each individual step. Individual steps included text directions, video, and audio of the step being completed. Participants had the option of replaying individual steps at any time. Figure 1 displays screen images of the app that participants used during the study.
Task Analysis of Office Tasks.
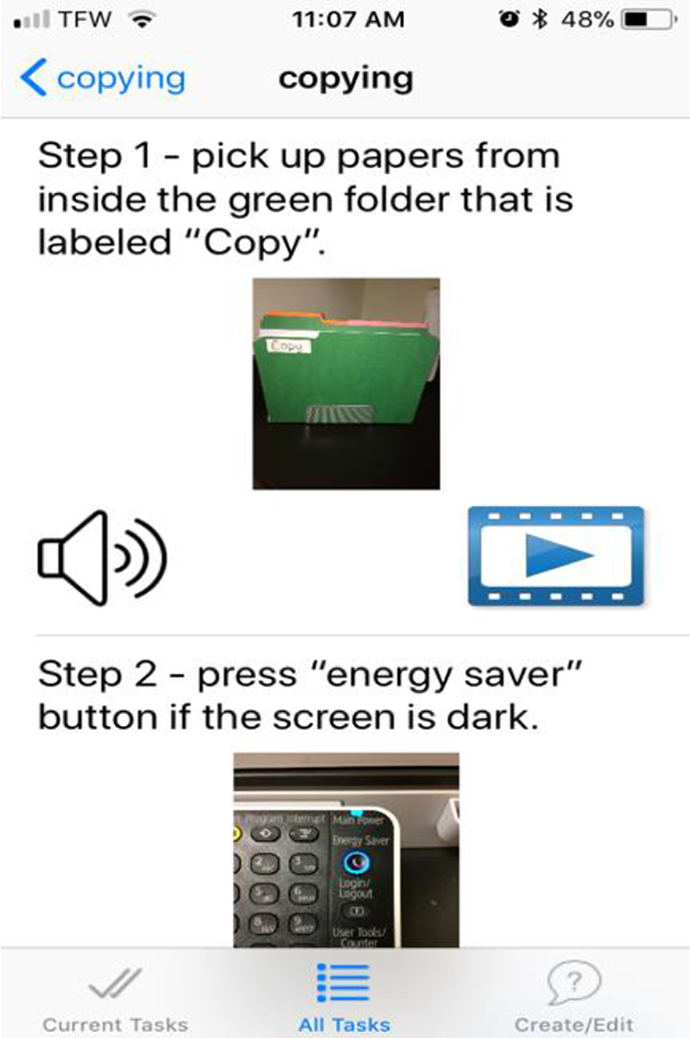
Screenshot of step-by-step task analysis.
Experimental Design
A multiple baseline design across participants was used to examine the effect of the Task Analysis app on the completion of the office tasks (Kazdin, 2011). Upon the university's Institutional Review Board's approval, the study was conducted over the spring semester when freshmen students are assigned to approximately 10 hr of job internships. The specific order students were provided the intervention was randomly selected prior to the study with the exception of Finn due to ethical considerations. Finn had exhibited clear signs of frustration during baseline data collection due to not knowing how to perform the assigned tasks, and the research team determined it was best if he was permitted to undergo the intervention first to reduce his anxiety.
Baseline
The baseline phase consisted of a minimum of five sessions or until a stable pattern of performance was established. During the baseline phase, each session included a trial for each of the three tasks. Participants were not provided instruction or prior training and did not have access to the mobile device app. Participants were brought individually into the office workroom, and a research assistant provided verbal instructions, such as “Please make copies of the papers that are in the orange folder and put them back in the purple folder when you are finished.” The participant was told to try their best to complete the task independently. Participants were provided with nonspecific verbal praise for their attempt of the task. There were four discontinuation rules that were followed, and if any of these criteria were met, the task was immediately stopped. Discontinuation criteria were as follows: (a) failed to initiate a task within 15 s, (b) pressed a random button 3 times in a row, (c) did something that could potentially damage machinery (e.g., caused paper jam), or (d) participant indicated he was finished.
Training
Upon completion of the baseline phase, participants were introduced to the Task Analysis Lite app on the mobile device. Instruction varied throughout the training process. Initially, a researcher demonstrated to all participants the functions of the Task Analysis app via a smart board. Participants were then given individual instruction in the use of the app. A researcher guided participants individually through the use of the app as they manipulated the functions of the app using the mobile device. When participants demonstrated that they could use the functions of the app with little to no help from the researcher, students were given independent practice tasks. Tasks practiced using the Task Analysis app included a variety of cooking tasks (making a frozen pizza and spaghetti) as well as following steps to build various Lego cubes. Practice with the Task Analysis app continued until each participant demonstrated that he could independently use the mobile device and Task Analysis app independently and successfully complete an office task of sorting and stapling paper packets with 100% accuracy. The students mastered using the app at varying rates ranging from 30 to 225 min (average = 110 min).
Intervention
One session occurred each day during the intervention phase. Each daily session contained one trial for each of the three tasks assigned (i.e., copying, scanning, and shredding). Sessions varied in length but were approximately 20 min in duration. Participants chose how to utilize the Task Analysis app (e.g., step-by-step instructions or overall recording) based on personal preference. Each session began with a research assistant giving the participant the mobile device and providing verbal instructions, “Please make copies of the papers that are in the orange folder and put them back in the purple folder when you are finished, using the Task Analysis app on the mobile device.” Following the initial prompt, and all subsequent steps thereafter, if the student did not begin the task within 15 s, if the step was incorrect, or if he asked for help, prompting or assistance was provided using a system of least to greatest prompting (i.e., gestural, verbal, hand over hand). After prompting, if the participant continued to fail at the step, then after 5 s, the next prompting level was used. At the end of each trial, the participant was given nonspecific verbal praise.
Maintenance
During the maintenance phase, students were asked to complete the three office tasks after not using the app and completing the task for approximately 2 weeks. The same protocol was used during the maintenance phase as was used during the intervention phase. Students completed the tasks on the last two sequential days of the semester.
Dependent measures
During all phases, data were collected on the number of steps that were completed independently, correctly, and in proper order for each task. Additionally, data were taken regarding the type of prompting required by the participant (gestural, verbal, hand over hand).
Data Recording and Analysis
Data recording
During each trial, data were collected by researchers regarding the number of steps completed independently and correctly by each participant. Responses were only scored as correct if the participant (a) completed the step accurately, (b) did not receive any prompting, and (c) the step was completed in the proper sequential order. At the end of each session, data were entered into an Excel spreadsheet where it was converted to a percentage by dividing the number of steps completed by the total number of steps and then multiplying by 100. Data points were then graphed.
Data Analysis
Effects of the Task Analysis app on student ability to complete common office work tasks were examined using a combination of visual analysis and calculation of effect sizes (ES) between baseline and the intervention condition.
Visual analysis
While there has been much dispute regarding the best method to calculate an effect of single case design, there has been general agreement that the primary method of assessment has been and should remain visual analysis (Rakap, 2015; Wolery, Busick, Reichow, & Barton, 2010). Visual analysis provides a useful tool for making a summative judgment about the outcome of treatment for a case. To measure study effects of each student, a visual analysis of the graphed data was completed. This technique allows for analysis of changes in level, trend, variability, immediacy of the effect, overlap, and consistency of data patterns across similar phases. Specific guidelines for visually analyzing single case research design (SCRD) outlined in Kratochwill et al. (2010) were followed.
Tau-U
Tau-U has become one of the more commonly used measures of ES today due to its nonparametric approach (Morash-MacNeil et al., 2018; Parker, Vannest, Davis, & Sauber, 2011). Tau-U is derived from Kendall’s and Mann–Whitney U (see Parker et al., 2011) and is calculated by merging trend and nonoverlap data. Advantages of Tau-U include its (a) consistency with visual analysis, (b) applicability for short data series and simple designs, (c) appropriateness with any type of SCRD, (d) strong statistical power, (e) control for trend during baseline phase, (f) usefulness with nonaggregated data from either a single client or a complex design, and (h) usefulness for meta-analysis (Parker & Vannest, 2012; Parker et al., 2011). Tau-U was calculated using the online Tau-U calculator (Vannest, Parker, & Gonen, 2011) for each individual contrast between the baseline and adjacent intervention contrast for each academic measure. Tau-U effects are measured as small (0–0.65), medium (0.66–0.92), and large (0.93–1.00), which are equivalent to ranges recommended for nonoverlap of all pairs (Parker, Vannest, & Brown, 2009).
Interobserver Agreement (IOA) and Treatment Integrity
IOA was completed with two observers in the room during the intervention sessions. A minimum of 50% of all baseline and intervention sessions were coded independently to estimate reliability for data collection. IOA was calculated for the baseline with 99% reliability, 100% reliability during the intervention phase, and 100% reliability during the maintenance phase of the study.
Fidelity of Implementation
Researchers followed an instructional script to ensure consistency of directions provided to students. IOA for fidelity of implementation was completed with two observers in the room during the intervention sessions. Researchers followed the script and recorded whether script steps were read accurately. Research staff observed implementation and completed the script for 100% of the intervention sessions. Fidelity of intervention was 100% across all sessions.
Social Validity
At the conclusion of the study, the students were asked to complete a social validity questionnaire. The survey used a 5-point Likert-type scale with picture symbols of various faces, ranging from sad (score of 1 = strongly disagree) to happy (score of 5 = strongly agree). Faces were converted to their respective Likert-type score and analyzed for mean and standard deviation for overall social validity of the intervention. Additionally, the students’ job coaches completed the intervention rating profile (IRP-15; Martens, Witt, Elliott, & Darveaux, 1985). The IRP-15 consisted of 15 questions scored on a 1–6 Likert-type scale describing items such as how well the teacher thought the intervention worked, if it was appropriate for use, and would they use it again. Scores on the IRP-15 can range from 15 to 90, with higher scores indicating a greater acceptance level. Scores above 52.50 are considered acceptable (Von Brock & Elliot, 1987). The internal consistency reliability for the IRP-15 ranged from .88 to .98 (Lane et al., 2009).
Results
A visual analysis was performed on the four students’ task performance, as shown in Figure 2. The figure displays the task performance for Finn, Alex, Spencer, and David over the course of 5 weeks of data collection. Observational measures of all three of the office tasks and the students’ level of task step completion in order are graphed using percentage of steps in order as the comparable unit. The figure graphically displays the baseline, intervention, and maintenance phases of the study for each of the students.
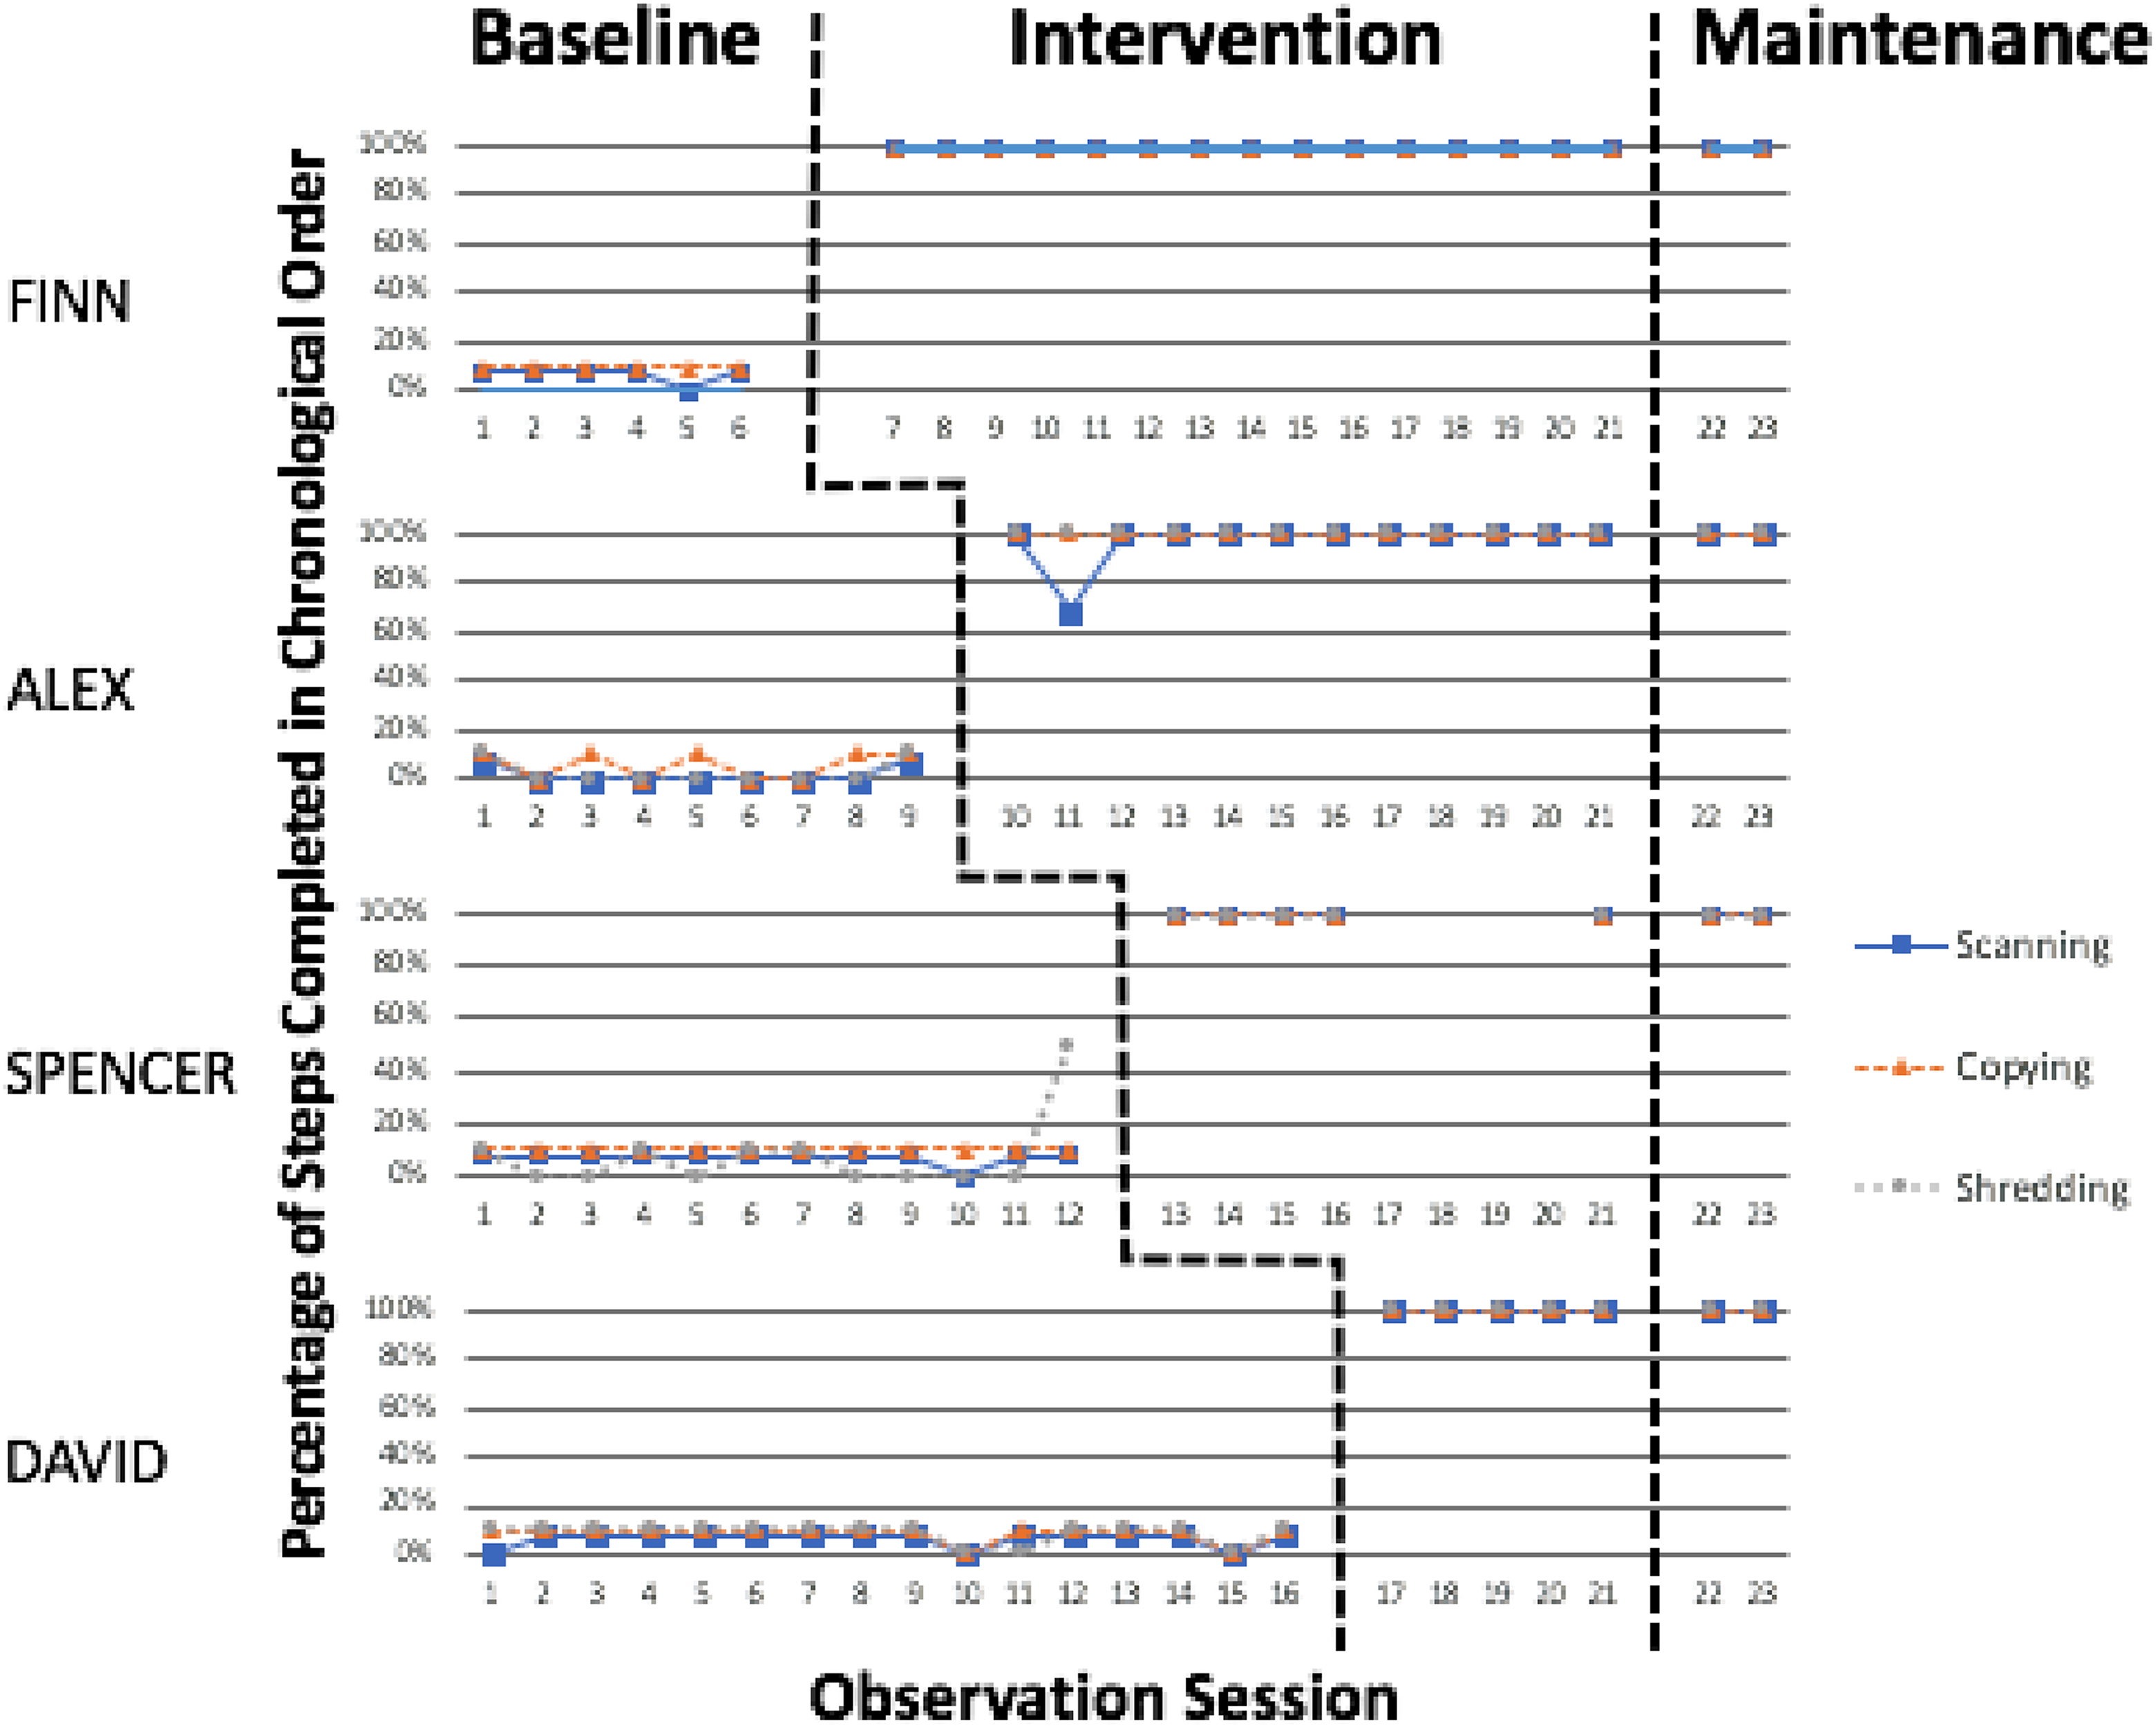
Multiple baseline study of student office task performance.
Finn
A visual analysis was performed of Finn’s graphed data. The baseline phase for Finn was stable with no trend in his performance and minimum variability across all three tasks. Throughout the intervention phase, Finn’s preferred mode of presentation was the step-by-step video modeling. Use of the Task Analysis app resulted in Finn showing an immediate and dramatic change in level and mean across all three tasks including scanning (8–100%), copying (10–100%), and shredding (0–100%). His performance throughout the intervention phase was stable at 100% with no variability. Finn showed no reduction in performance during the maintenance phase. Analysis of ES resulted in a large 1.0 Tau-U gain, meaning the Task Analysis app was a highly effective intervention for helping him complete all three office-related tasks accurately and independently.
Alex
A visual analysis was performed of Alex’s graphed data. The baseline phase for Alex displayed a steady floor effect for his performance across all three tasks, with no trend and minimal variability. Throughout the intervention phase, Alex’s preferred mode of presentation was the step-by-step video modeling. The Task Analysis app intervention resulted in an immediate and large change in level and mean of Alex’s task performance for all three office tasks including scanning (8–100%), copying (10–100%), and shredding (10–100%). Alex’s performance during the intervention phase was stable at 100% for all three tasks, except for a single outlier during the second observation of the intervention phase for scanning. Alex exhibited overconfidence in his ability to perform the office tasks without the use of the mobile device application. Alex was reminded to use the app after the data collection session and his performance returned to 100%. Alex showed no reduction in performance during the maintenance phase. Analysis of ES provided a large 1.0 Tau-U gain, which demonstrated the effectiveness of the app on Alex’s ability to complete the office tasks with minimal prompts.
Spencer
A visual analysis was performed of Spencer’s graphed data. The baseline phase for Spencer showed a stable performance with minimal variability for two of the three office tasks (i.e., copying and scanning). However, Spencer began to display an increased level of performance (up to 50%) on shredding immediately prior to the intervention phase through a series of trial-and-error attempts. However, the Task Analysis app resulted in Spencer showing an immediate and dramatic change in level and mean across all three tasks including scanning (8–100%), copying (10–100%), and shredding (50–100%). Throughout the intervention phase, Spencer’s preferred mode of presentation was the step-by-step video modeling. His performance throughout the intervention phase was stable at 100% with no variability in his performance. Spencer showed no reduction in performance during the maintenance phase. Analysis of ES resulted in a large 1.0 Tau-U gain, meaning the Task Analysis app was a highly effective intervention for helping him complete all three office-related tasks accurately and independently with minimal prompts. Worth noting was Spencer had three missing data points during his intervention phase due to a medical emergency. The student was able to return to the program after several days and resumed participation in the study.
David
A visual analysis was performed of David’s graphed data. David showed a stable performance throughout baseline with no trend in his performance and minimum variability across all three tasks. Throughout the intervention phase, David’s preferred mode of presentation was the step-by-step video modeling. The use of the Task Analysis app resulted in David showing an immediate and dramatic change in level and mean across all three tasks including scanning (8–100%), copying (10–100%), and shredding (10–100%). His performance throughout the intervention phase was stable at 100% with no variability. David showed no reduction in performance during the maintenance phase. Analysis of ES resulted in a large 1.0 Tau-U gain, meaning the Task Analysis app was a highly effective intervention for helping him complete all three office-related tasks accurately and independently with minimal prompts.
Social Validity
Students were given a social validity questionnaire focused on their interactions and perceived usefulness of the app using a smiley face, 5-point Likert-type format. Scores could range from a minimum of 1 (all strongly disagree) to a maximum of 35 (all strongly agree). The mean score of all social validity measures was 33.75 (n = 4). All four participants strongly agreed that the app was (a) easy to use, (b) easy to follow the steps to complete a task, (c) helpful using the video feature, and (d) easy to learn how to use. Comments from the students were all positive (e.g., “It was fun using the app” and “The video feature of the app was helpful.”)
Teachers and job coaches working with the students anonymously completed the IRP-15 to assess the Task Analysis app’s acceptability as a possible instructional or intervention tool resulting in a mean score of 79.75 (n = 4). Given scores above 52.50 are considered acceptable, the staff rated the Task Analysis app with high levels of consumer satisfaction. Staff were also given the option of including comments, and one stated, “I think this would be extremely beneficial for my students.”
Discussion
Previous research suggests that portable electronic AT increases the ability of individuals with ID to independently complete tasks. In this study, we investigated the effectiveness of a Task Analysis application as a tool to help individuals with ID to independently complete work-related office tasks. Overall, outcomes demonstrated that all four participants showed large and meaningful ES gains for completing scanning, copying, and shredding in an office environment. Based on social validity measures, all participants enjoyed using the app and felt it was easy and fun to use. Additionally, their job coaches and teachers stated they believed the Task Analysis app was useful and identified numerous potential other uses for it ranging from cooking to cleaning.
A notable trend seen across all four participants was the immediate and dramatic change in level that resulted in a floor to ceiling effect once shifting from baseline to the intervention phase. This immediate and rapid change in level across participants indicates that a reliable effect occurred from the intervention (Kazdin, 2011). This information further validates the effectiveness of the task analysis intervention on completion of employment-related tasks. In addition to being able to immediately complete the tasks, participants were doing so independently with little or no prompting by researchers. The results of this study culminated in similar immediate effects as noted in an earlier study by Collins, Ryan, Katsiyannis, Yell, and Barrett (2014), where investigators examined the effectiveness of using portable electronic AT as a means to complete work-related office independently by individuals with ID. In addition to the sudden change in level, the reduction in the number of prompts needed throughout the intervention and maintenance phases was an encouraging finding. These results are congruent with findings in prior research indicating the use of AT reduced the need for the number of instructor prompts (Mechling, 2007).
Benefits of Using AT
Several considerable benefits of using AT were demonstrated in this study and are consistent with previous research. First, research indicates that one advantage of using portable AT is its ease of use. Collins and colleagues (2014) noted that their technology was easy to use and required less than 1 hr of training for participants to use it with proficiency. In our study, although training time varied across participants, they all learned to use the application quickly and with relative ease. For example, Finn required the least amount of training, taking only 30 min of instruction and practice prior to mastering the use of the Task Analysis app. All of the participants indicated that the application was easy to learn and use.
Other advantages found in the literature include the common use of mobile technology devices and their affordability. Mobile devices are routinely used by people of all ages without disabilities and are less likely to be stigmatizing when students with disabilities are using them (Davies et al., 2002; Gentry, Wallace, Kvarfordt, & Lynch, 2010). Participants in this study were able to discreetly use the smartphone in an employment setting and appear to be no different than their peers without disabilities. Another aspect that makes today’s technology an integral part of daily life is the affordability of many devices and apps (Fichten, Asuncion, & Scapin, 2014). The Task Analysis Lite application used for this study was free to download.
Video Modeling
Previous studies have shown that multiple modes of prompting (e.g., video, audio, and picture) have been used to assist individuals with disabilities in task completion, with results from several studies indicate that video prompting has been most effective (Mechling & Collins, 2012; Mechling & Stephens, 2009). Video prompting and modeling have been effective in increasing independence of individuals with ID in the absence of an instructor (Cannella-Malone, Brooks, & Tullis, 2013; Collins et al., 2014; Sigafoos et al., 2005). Although our study did not focus on identifying which mode of prompting was most effective, our study provided participants the opportunity to utilize a combination of audio, video, and text prompting. All four participants preferred to use the step-by-step video modeling feature of the task analysis app.
Limitations and Future Research
Study results should be interpreted with the understanding of their limitations. First, our study was limited to a small sample size. As a result, it should not be assumed that our findings will generalize to the entire population of young adults with ID. It is also recommended to extend the research to different settings including the classroom, home, and other industries that typically employ individuals with ID (e.g., retail, food services). Second, this study also provided participants the opportunity to utilize a combination of audio, video, and text prompting. Future research should evaluate the effectiveness of each type of prompt (e.g., video) in acquiring new skills. Third, instructor prompting (e.g., gestural) was used only during the intervention phase and not baseline. Similar prompts could not be used during the baseline and intervention phases due to the nature of the prompts and their correspondence with the use of the mobile device. The success of the Task Analysis app may be a combination of the app and prompting. Further research should focus on isolating the impact each of these factors has on independent task completion. Fourth, there was a limited time between the intervention and maintenance phases due to participants leaving campus for the summer. Therefore, it is a possibility that the behavior would not have been maintained over a longer period of time. Future studies should extend the maintenance phase to determine whether the effects are permanent. Finally, if the use of AT may reduce the need or level of supports provided by the job coach, further investigation evaluating to what extent Task Analysis reduces that level of support is warranted.
Conclusion
Overall, the results of this study are consistent with prior research indicating that the use of portable electronic AT can be used as an instructional tool and mechanism to promote independence in work-related tasks. Large ES gains indicate that the Task Analysis application is a promising intervention that is beneficial to the ID population. In addition, the app is accessible, affordable, and easy to use. Although employment outcomes for individuals with ID continue to be problematic, results from this study suggest that the use of portable electronic AT may be a possible solution for improving employment outcomes.
Footnotes
Declaration of Conflicting Interests
The author(s) declared no potential conflicts of interest with respect to the research, authorship, and/or publication of this article.
Funding
The author(s) received no financial support for the research, authorship, and/or publication of this article.
