



Abstract
Students who demonstrate mathematics difficulties (MDs) in the early grades are at risk of poor educational outcomes. Fortunately, strategic early mathematics intervention programs can improve academic outcomes for students with MDs, and instructional technology has demonstrated promise in delivering targeted and individualized mathematics instruction. However, it is unclear whether instructional technology is effective for all students, and there is a dearth of research on adaptations to technology-based interventions for students with difficulties attending to instruction. To this end, the current study investigated functional relations between the use of targeted instructional cueing and self-regulation support features in an iPad-based mathematics program and improved response accuracy for kindergarten students. Results presented here suggest a functional relation between the provision of instructional cueing and self-regulation support features and improved response accuracy for students who participated in an iPad-based mathematics intervention program. Implications for early mathematics instruction and technology-based intervention development are discussed.
Early mathematics knowledge is a strong predictor of later mathematics achievement (Duncan et al., 2007). Children who enter kindergarten with poor mathematics skills and fail to make mathematics progress throughout the school year are likely to demonstrate continued low mathematics achievement (i.e., mathematics difficulties [MD]; Geary, 2013; Kohli, Sullivan, Sadeh, & Zopluoglu, 2015) and to progress academically at a slower rate than their peers (Morgan, Farkas, & Wu, 2009). Failure to master foundational skills in the early grades prevents access to higher level concepts, resulting in an increasingly wide mathematics achievement gap for students with MD (Judge & Watson, 2011). Without early and intensive intervention, students with MD are at risk of poor long-term educational and employment outcomes (Morgan, Farkas, & Wu, 2011; Rivera-Batiz, 1992). Furthermore, given the high correlation between academic difficulties and attention difficulties (Alexander, Entwisle, & Dauber, 1993; Sims, Purpura, & Lonigan, 2016), it is critical that intervention instruction be engaging and responsive to the strengths and areas of need of each individual student (Dennis et al., 2016).
Mathematics Intervention
Early and strategic mathematics intervention programs can improve the academic outcomes of students with MD (Gersten et al., 2009; Misquitta, 2011; Swanson, 2009; Swanson & Sachse-Lee, 2000). Explicit and carefully sequenced instruction, opportunities to engage in mathematics discourse, practice with key concepts, teacher feedback, cumulative review, and student motivators have all been found effective in increasing mathematics achievement scores for students with MD (L. S. Fuchs et al., 2008). Further, students with MD may need individualized instruction to meet their unique learning needs (D. Fuchs, Fuchs, & Vaughn, 2014). In recent years, there has been an increase in research examining the overall efficacy of mathematics intervention programs in the early elementary grades (Clarke et al., 2014a; Dyson, Jordan, & Glutting, 2013; Gersten et al., 2015; however, those investigations have not focused on specific instructional supports that may be critical in improving student outcomes. Given that responsiveness to generally effective programs varies across students (L. S. Fuchs & Vaughn, 2012) and the potential need of students with MD to receive individualized instruction, systematic investigations of instructional supports are warranted (Bryant et al., 2016).
Instructional technology, such as computer-based or computer-assisted instruction, may provide one potential solution to the dearth of specific instructional supports for students with MD (Smith & Okolo, 2010). The National Mathematics Advisory Panel (, 2008) recommended that well-designed and appropriately implemented technology-based software can be used to teach students new instructional content and increase students’ mathematics automaticity. A recent explosion of technology-based instructional products has demonstrated that instructional technology can be an effective academic aid for students with a variety of disabilities (Everhart, Alber-Morgan, & Park, 2011; Praet & Desoete, 2014) and for students with MD specifically (Li & Ma, 2010; Tolentino, 2016). This type of instruction has the advantage of delivering “frequent and immediate feedback, instant reinforcement, and continuous opportunities to respond to academic stimuli” (Xu, Reid, & Steckelberg, 2002, p. 230) without tapping into critical classroom resources such as teacher time (Mautone, DuPaul, & Jitendra, 2005). These products are increasingly embraced by educators who find technology useful for enhancing teaching and learning and increasing student motivation (Liu, We, & Chen, 2013; Proctor & Marks, 2013).
Promise of Instructional Technology to Provide Individualized Mathematics Instruction
In addition to the importance of providing timely intervention for students with or at risk of academic difficulties, adapting instruction and the implementation of interventions based on specific student need is critical. In fact, individualized intervention adaptations are associated with improved intervention outcomes and are a recommended aspect of intervention planning (Berkel, Mauricio, Schoenfelder, & Sandler, 2011; Durlak & DuPre, 2008).
To this end, instructional technology can deliver individualized and adaptive instruction for students with MD. Carefully designed interventions can enable students to engage in lessons at their instructional level and progress through content at their own pace. Instructional technology can also provide numerous practice opportunities, combined with clear, consistent academic feedback, and empower instructors to track student progress (Bryant et al., 2015; Ok & Bryant, 2016). In a research synthesis on the use of iPad instruction for students with disabilities, Ok and Kim (2017) found overall strong effects for the effectiveness of iPad apps to enhance academic performance and medium to strong effects for the use of iPad apps to increase students’ academic engagement. Students reported that iPad instruction was fun and helpful for focus and motivation.
Despite these promising findings, there is substantial variation in the extent to which specific technology-based instructional products demonstrate an ability to enhance engagement for students with MD (Moos & Marroquin, 2010; Star et al., 2014). Few studies have empirically examined the specific features of instructional technology tools that may be helpful in increasing engagement for students with MD (Liu et al., 2013). Some relevant research findings related to instructional technology, attention difficulties, and MD are described below.
Instructional Technology and Students With Attention Difficulties
Research indicates that attention difficulties may put students at a higher risk of MD (Alexander et al., 1993; Sims et al., 2016). One explanation for this finding is that students who struggle to attend in school often exhibit decreased task persistence and lower levels of self-regulation, resulting in less time engaged in academic instruction (Duncan et al., 2007). Attention difficulties may be particularly troublesome for students in the early elementary grades due to students missing out on instruction targeting foundational academic skills (Rabiner, Carrig, & Dodge, 2016). Importantly, the flexibility to customize and adapt instructional technology, coupled with its engaging and motivational nature, makes it appropriate for addressing the unique needs of students with attentional difficulties (Xu et al., 2002). Thus, instructional adaptations to support students who have difficulties attending to instruction in the early grades may result in improved outcomes for students at risk of MD.
Research findings from several studies indicate that literacy instruction delivered via computer-assisted instruction or iPads may be effective in increasing reading performance for students who struggle to attend to instruction (Clarfield & Stoner, 2005; McClanahan, Williams, Kennedy, & Tate, 2012). Ota and DuPaul (2002) found that a mathematics game software package increased academic engagement and decreased time off task for three students with attentional difficulties in Grades 4–6. A similar study by Mautone, DuPaul, and Jitendra (2005) found that the same mathematics software increased active engaged time for three students in Grades 2–4. However, rates of off-task behavior were still variable and moderately high after the introduction of the instructional technology.
Despite the potential benefits of instructional technology for students with difficulties attending to instruction, overall effectiveness remains inconclusive due to the relative dearth of research and the prevalence of mixed findings (Ross, Morrison, & Lowther, 2010; Xu et al., 2002). Whereas instructional technology may be particularly advantageous due to its adaptable nature, there is little to no evidence of research focused on specific adaptations for students with attentional difficulties. Self-regulation plays a key role in whether instructional technology leads to academic learning (Winters, Greene, & Costich, 2008), and adaptations to instructional technology aimed at improving self-regulatory behaviors may maximize academic and behavioral outcomes, especially for young students with attention or self-regulation difficulties. Consequently, it is critical to investigate the efficacy of adaptations (e.g., purposeful instructional cueing and self-regulation support features) to instructional technology for students with problems attending to instruction in the early elementary grades. That is, to better understand how instructional technology can be maximally effective for all students, additional research is needed to identify and evaluate design features that are associated with engagement and improved attention to mathematics instruction for students with MD in the early grades.
Purpose and Research Question
The purpose of the current study was to investigate associations between the use of targeted instructional cueing and self-regulation support features in an iPad-based, kindergarten mathematics program, and improved response accuracy. Through the application of a reversal design across five participants, the current study explored the following research question: To what extent, is there a functional relation between the utilization of targeted instructional cueing and self-regulation support features and improved response accuracy on an iPad-based mathematics program for kindergarten students with difficulties attending to instruction?
Method
An ABAB reversal design (Horner et al., 2005; Kratochwill et al., 2013) was used to evaluate the extent to which there was a functional relation between increased response accuracy and instructional cueing and self-regulation supports as activated in the intervention phases. There were two primary conditions in the study, baseline (i.e., KinderTEK), and intervention (i.e., KinderTEK with supports). Stability of data for moving from baseline to intervention was determined via visual inspection. Measurement of the dependent variable, accurate responding, continued until the observed pattern of responding was sufficiently consistent to allow prediction of future responding. Documentation of a predictable pattern during the first baseline phase required three or more data points without substantive trend or without a decreasing trend (Kratochwill et al., 2013). In the intervention phases, a minimum of three data points were required without an increasing trend.
KinderTEK Mathematics
Aligned with the Common Core State Standards, KinderTEK provides systematic and explicit adaptive mathematics instruction across 51 instructional activities specifically targeting whole number concepts and procedural fluency in solving whole number problems. KinderTEK employs research- and evidence-based instruction, rewards to maximize student learning. The individualized educational system provides instruction and targeted practice shown to support deep and lasting learning. Systematic, focused lesson content and a Pretest-Guided Practice-Test structure, combined with KinderTEK’s continuous progress monitoring ensure students demonstrate mastery in each phase of learning before moving on to more independent and challenging tasks. Carefully chosen practice opportunities, “just enough” scaffolding, and timely academic feedback is provided in every lesson. As a result, each student experiences success as they continually encounter KinderTEK’s Common Core-aligned kindergarten content. KinderTEK is designed to be used in 15-min sessions and students’ progress is automatically saved from session to session. Within a session, students are motivated through engaging content, intermittent rewards, and activity center (i.e., scrapbook, puzzle, matching game) time. Across sessions, they accumulate rewards that provide evidence of their persistence, and content mastery, and unlock new material.
Individualized supports
As implemented in the intervention phase of the current study, KinderTEK has customizable settings to fit varied educational contexts and students. Some settings help teachers fit KinderTEK to their class-level lesson plans and content goals (e.g., session duration and learning mode; i.e., app directed, teacher directed, or student directed). Others offer much finer-grained manipulation of the student experience and can be adjusted on an as-needed, student-by-student basis (e.g., audio and visual cues to act, optional midsession reward time, higher sticker award rate, on screen timer, and visualization of session structure). In practice, teachers can track student progress and adjust students’ settings via the app and accompanying web dashboard; however, all instructional cueing and self-regulation supports were activated by research personnel, as this served as the independent variable in the current study.
KinderTEK research base
Data from pilot studies conducted during KinderTEK development indicate that KinderTEK produces positive student outcomes. As part of an Institute of Education Sciences development grant, 11 kindergarten classes participated in a randomized control trial study (Shanley et al., 2013, 2015; Cary et al., 2014b). After attrition, the final analytical sample included 45 KinderTEK students and 49 control students. Two substantively important (Hedge’s g > .25) effect sizes were found in favor of the KinderTEK group: Magnitude Comparison = .36 and Number Line Estimation = .36 (Cary et al., 2014c). For students who were able to complete a significant portion of the lessons (i.e., 75% of the activities introduced), six meaningful effect sizes were detected: Magnitude Comparison = .43, Number Line Estimation = .29, Missing Number = .26, Oral Counting = .29, Number Sense Brief = .26 (Jordan, Glutting, & Ramineni, 2008), and Test of Early Mathematics Ability (TEMA-3) = .27 (Ginsburg & Baroody, 2003).
Accurate Responding
Response accuracy was the dependent variable in the current study. Accurate responding was selected as an indicator of attention to instruction based on the adaptive and flexible nature of the KinderTEK program wherein students are presented academic material tailored to their instructional level and high levels of response accuracy are expected based on the accessible nature of the content. In the current study, accurate responding was operationally defined as student actions that were neither out of turn nor resulting in the provision of corrective academic feedback from the app. Acting out of turn (i.e., attempting to respond before prompted) and receiving in-app prompting (i.e., repeated or modified directions as a result of no response or an inaccurate response) were coded as indicators of inaccurate responding and intervals with accurate responding were those without instances of inaccurate responding. For example, when a student was prompted to identify the next number in a sequence and either (a) did not give a response or (b) selected an incorrect number, the student received corrective feedback, and this was coded as an occasion of in-app reprompting. Similarly, if a student attempted to select an answer while instructional information was being presented or before he or she was prompted to respond, this action was recorded as acting out of turn. Alternatively, accurate responding was characterized as correct responses to KinderTEK instruction when first prompted.
Setting and Participants
Setting
The study took place in two public schools located in a suburban district in the Pacific Northwest. School A was an elementary school serving approximately 400 students in Grades K through 5, 100% of whom received free or reduced-price lunch services and 48% of whom were from minority backgrounds. School B was an elementary school serving approximately 530 students in Grades K through 5, 66% of whom were eligible for free or reduced-price lunch services and 38% of whom were from minority backgrounds. All observations took place in a quiet space apart from the general education classroom (e.g., commons, hall, separate room). During observation sessions, students worked one-on-one with observers to use an iPad-based mathematics program. The research team is not aware of any other behavioral interventions offered to participating students.
Participants
The five participants in the present study were selected from a larger group of children participating in a study funded by the Office of Special Education and Rehabilitative Services aimed at exploring the feasibility and usability of a kindergarten iPad-based mathematics program. Prior to identifying potential research participants, human subjects approval was obtained from Research Compliance Services in accordance with institutional guidelines. In all, five kindergarten students were nominated for participation by their classroom teacher based on teacher-reported difficulties attending to instruction as compared to their classroom peers. Participants 1 and 4 (identified here with the pseudonyms Nicole and Samuel, respectively) attended School A and were in the same class taught by a White, female teacher. Participants 2, 3, and 5 (identified with the pseudonyms Edwin, Ruby, and Michael, respectively) attended School B. Ruby and Michael had the same White, female teacher, and Edwin’s teacher was female, and of more than one race. All participating teachers were fully licensed and had between 5 and 10 years of teaching experience.
All participants completed a prestudy screening battery in midfall that consisted of a brief curriculum-based measurement battery (Assessing Student Proficiency in Early Number Sense [ASPENS]) and an engaging, popular measure of self-regulation for preschool-aged children (head–toes–knees–shoulders [HTKS]). These measures are described in more detail in the Materials section below, and participant scores are summarized to provide additional context about each participant’s initial mathematics and self-regulation skills.
Nicole
Nicole was a 5-year-old, female, White (non-Hispanic) student who was eligible for free or reduced-price lunch services and received special education services under the category of Other Health Impairment. Nicole did not have any mathematics-specific goals in her individualized education plan (IEP), but she demonstrated underdeveloped mathematics skills during prestudy screening. She was able to count to three and identify two numerals in a 60-s time frame. She was unable to identify missing numbers or complete magnitude comparison tasks. She was also unable to complete any items in the HTKS task. Notably, Nicole demonstrated marked gains in mathematics achievement with an overall ASPENS composite score in the strategic range by early spring.
Edwin
Edwin was a 6-year-old, male, Hispanic student who was eligible for free or reduced-price lunch services and received English language development services at school. Edwin also demonstrated underdeveloped mathematics skills in prestudy screenings. He was able to count to four but was unable to complete any of the other ASPENS and HTKS items. Encouragingly though, he also demonstrated mathematics gains with improved scores in both magnitude comparison and missing number identification on assessments conducted in early spring.
Ruby
Ruby was a 5-year-old, female, Hispanic student who was eligible for free or reduced-price lunch services and received English language development services at school. Ruby demonstrated emerging mathematics and self-regulation skills during prestudy assessments with an ASPENS composite in the intensive range and the successful completion of 2 HTKS items. By early spring, Ruby was performing in the strategic range on ASPENS measures.
Michael
Michael was a 5-year-old, male, White (non-Hispanic) student who received special education services under the category of Other Health Impairment, but he did not have any mathematics specific goals in his IEP. At pretest, Michael was proficient on the HTKS task with an overall raw score of 22 and performed in the strategic range on the ASPENS assessments of basic mathematics skills. Michael continued to demonstrate scores in the strategic range on the ASPENS measure at follow-up testing in the spring.
Samuel
Samuel was a 6-year-old, male, multiracial (non-Hispanic) student who was eligible for free or reduced-price lunch services. Samuel demonstrated proficiency on the HTKS task with an overall raw score of 18 but performed in the intensive range on the ASPENS assessments of basic mathematics skills. Early spring assessment scores are not available because Samuel demonstrated increasingly disruptive behavior in class, which ultimately resulted in his suspension prior to the end of study.
Measures
A set of brief measures were administered to all participants to assess basic mathematics and self-regulation skills. ASPENS (Clarke et al., 2011) is a set of curriculum-based measures validated for screening and progress monitoring in kindergarten and first grade (Clarke et al., 2011). Each 1-min fluency-based measure assesses an important aspect of early numeracy development including oral counting, number identification, magnitude comparison, and missing number in kindergarten. The reliability of kindergarten ASPENS measures across benchmark periods ranges from .71 to .82. Concurrent validity of the composite score with the Test of Early Mathematics Ability (TEMA-3) is reported as ranging from .57 to .63. HTKS (Ponitz, McClelland, Matthews, & Morrison, 2009) is an observational assessment of behavioral self-regulation that measures a child’s ability to inhibit imitative responses, focus and shift attention, and remember and apply multiple rules. The HTKS takes approximately 5 min to complete. Interrater reliability for the task is high (.95; Ponitz et al., 2009). The HTKS is positively correlated with (a) parent ratings of attentional focusing (.25) and inhibitory control (.20) and (b) teacher ratings of classroom behavioral regulation (.20; Ponitz et al., 2009). Further, fall HTKS scores are a significant predictor of spring mathematics performance in kindergarten (d = .56; Ponitz et al., 2009).
Procedures
Baseline
During baseline, participants used the basic KinderTEK iPad mathematics intervention daily in 15-min structured sessions without the instructional cueing and self-regulation supports activated. Under staff supervision, students entered their personal password, worked on at least two different mathematics instructional activities as assigned by the program, and had reward time at the end of the session.
Intervention phase
During intervention phases, participants used KinderTEK in 15-min structured sessions with instructional cueing and self-regulation supports activated and no other instructional modifications. Instructional cueing and self-regulation supports consisted of visual and audio cues to act, a progress bar, and a countdown timer that displayed remaining session time. The visual indicator consisted of a red “stop” hand and a green “thumbs up” sign indicating to wait and respond, respectively. Modeled from common choral response procedures (Adams & Carnine, 2003), a “ding” sound serves as the auditory cue to indicate when it is the student’s turn to respond. To ensure students were aware of the instructional cueing and self-regulation supports, staff demonstrated the audio and visual cues and showed students the progress bar and countdown timer before students began the first intervention phase. Figure 1 shows these cues as experienced by KinderTEK users.
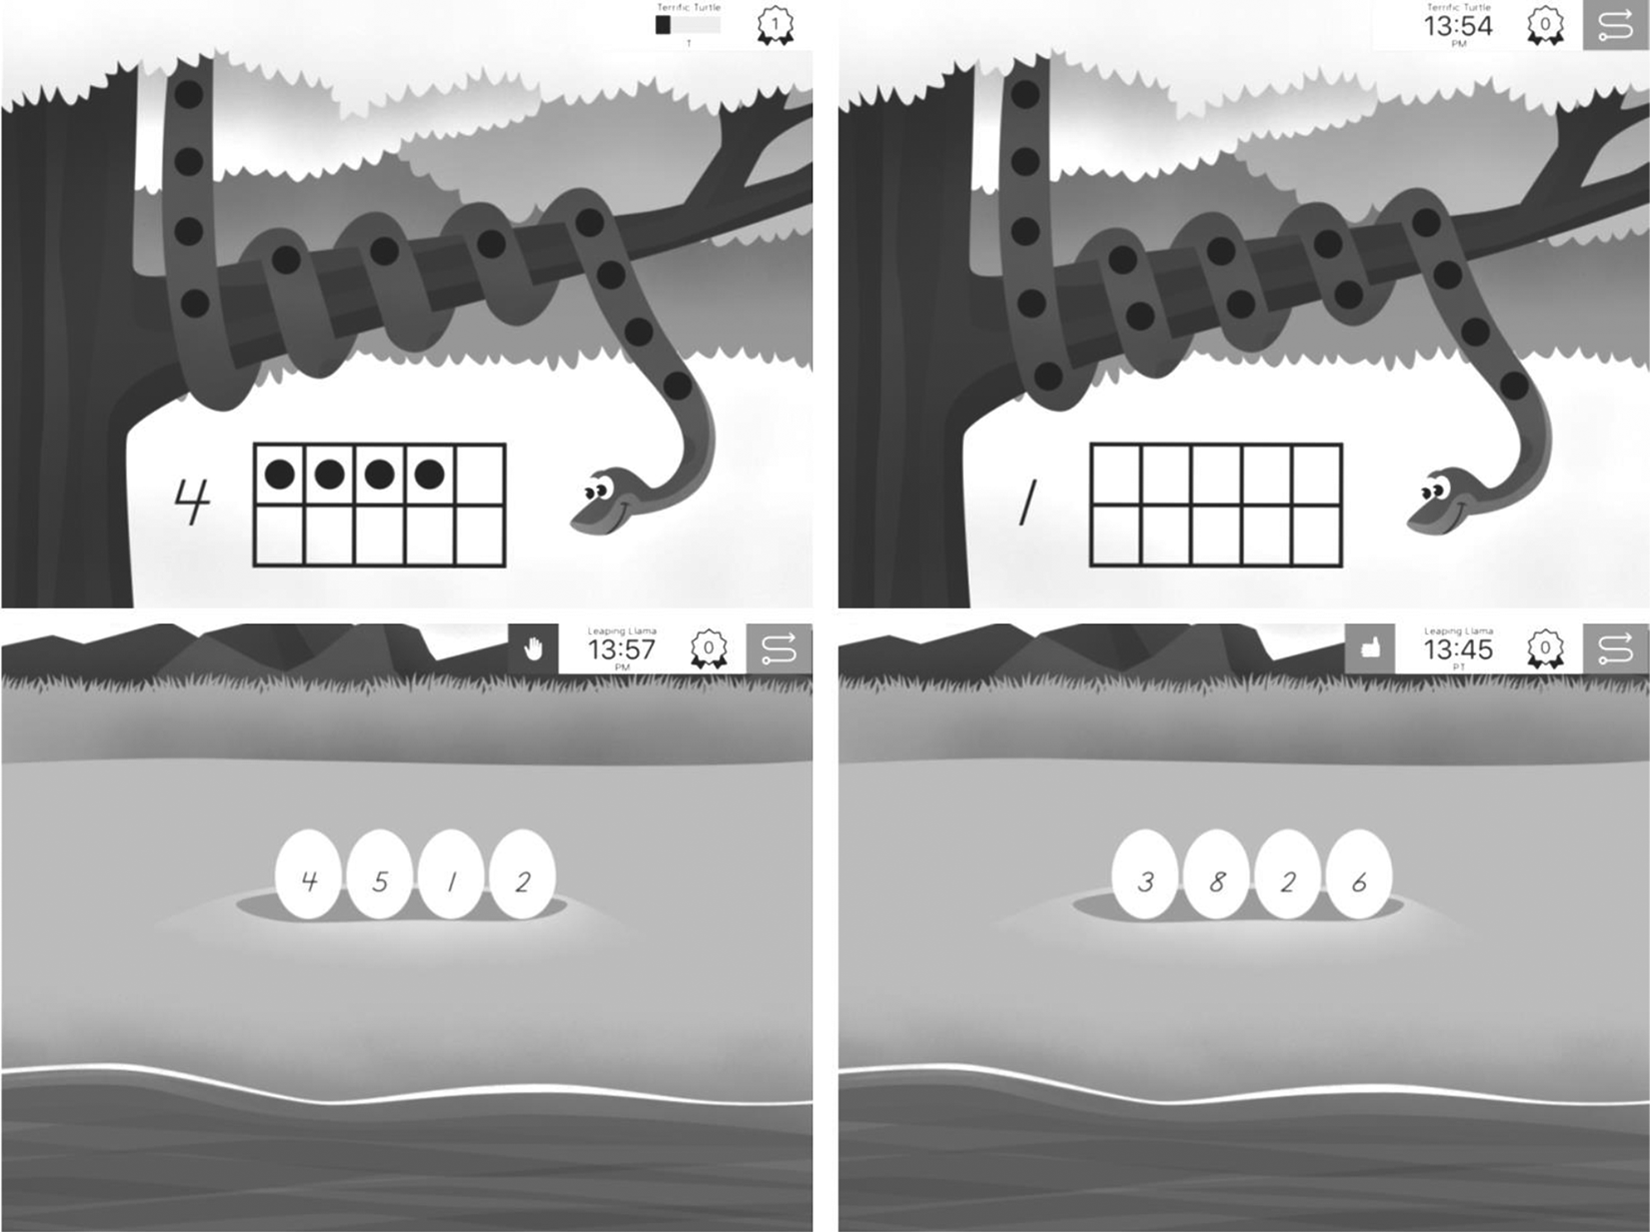
KinderTEK screenshots of inactive (top left) and active instructional cueing and self-regulation supports including countdown timer, progress path, visual indicators, and auditory cues (not pictured).
Maintenance
One maintenance data point was also collected for all but one participant. Each maintenance observation occurred 4–7 days after the end of the final intervention phase and was conducted in an identical manner to all previous observations. Students were able to access the KinderTEK program with settings activated as implemented by their classroom teacher between the end of the intervention phase and the maintenance observation.
Social validity
A student survey was administered to all participants to assess the extent to which students were satisfied with and enjoyed participating in the KinderTEK intervention. Questions were crafted to query student agreement with statements about KinderTEK and included statements like “How much did you like using KinderTEK?” “Did KinderTEK teach you math?” and “Did KinderTEK make math fun?” These surveys were group administered with teachers reading each statement and students responding by circling a picture (i.e., smiling/frowning face or thumbs up/down) representing their agreement with each statement.
Participating teachers were also surveyed to assess the extent to which they were satisfied with the KinderTEK intervention. Survey questions were used to gauge teacher impressions of KinderTEK, teacher perceptions of the student experience, and the extent to which KinderTEK was feasible for use in their classrooms. Satisfaction surveys were distributed after the conclusion of the study and all responses were anonymous.
Observer training
Prior to beginning data collection, four university staff familiar with the KinderTEK mathematics program and with conducting student assessments were trained to facilitate and observe students’ use of the KinderTEK program without (i.e., baseline) and with (i.e., intervention) instructional cueing and self-regulation supports and to record behaviors related to response accuracy. In an in-person training day, staff were trained how to describe the study to students and to identify and code the target behavior. Observers were given guidelines about (a) the extent to which they should and should not interact with students during the study, (b) how to activate KinderTEK’s instructional cueing and self-regulation supports (i.e., the intervention), and (c) a script for introducing these the instructional cueing and self-regulation supports to students.
Interobserver agreement
During training, observers practiced coding while the trainer played the KinderTEK program with the display mirrored on a large screen and the audio turned up so that all could hear. All observers completed a checkout coding exercise to meet a 90% interobserver agreement criterion on the target behaviors. Interobserver agreement was not calculated in the field because coding participant behavior required that observers sit close to the participant and share an audio source, and having multiple adults sitting with one student proved to be untenable. However, observers were required to conduct monthly reliability checks using training materials and simulated sessions to insure ongoing reliability across observers. Observers also participated in follow-up trainings, if the reliability check data did not meet the 90% interobserver agreement threshold.
Fidelity of implementation
Once activated in KinderTEK, instructional cueing and self-regulation supports were “on” until deactivated; thus, no formal fidelity measures of the implementation of the instructional cueing and self-regulation features were needed. To assess fidelity of implementation of the iPad sessions, observers were instructed to take notes of anything unusual during the session that might affect the child’s behavior. Because data collection was conducted on iPads and uploaded for review each day, these notes provided valuable contextual information to help inform study decision-making. For example, an observer noted that a participating student’s parent was present for a study session and the parent frequently interacted with the student during the session, so the research team was able to account for this anomaly in the data. Similarly, because the outcome of interest was an average count across intervals, observer notes were used to determine whether the session length was sufficient for inclusion in the study. Ultimately, analyzed data included only those observations for which students were present for at least 80% of the session (i.e., 12 min of KinderTEK use) and sessions for which there were no additional observers (i.e., parents, school psychologists) present. Across all participants, 85 of the 94 (i.e., 90%) attempted sessions were successfully conducted.
Data Collection and Analysis
Response measurement
Direct observation data were collected by trained observers using an iPad-based data collection system, and all direct observations of student behavior took place as students used KinderTEK in a quiet space in the school (e.g., commons, hallway, unused room). Coding required an understanding of the instructional context (e.g., what student was seeing on the iPad screen, what the student was hearing, and whether it was the student’s turn to respond), so observers sat next to the student within view of the screen and used a headphone splitter so both the student and the observer could wear headphones and hear the program audio. Direct observation of student behavior was conducted 3–5 days per week per student across 15-min sessions. All responses were scored using partial interval recording across 20-s intervals. As described in the Observer Training section, observers were required to meet a 90% interobserver agreement criterion on the target behavior before entering the field
Analysis
Data were analyzed to assess the extent to which the intervention was functionally related to change in response accuracy. Data related to accurate responding were analyzed using traditional single-case design procedures that included visual inspection to examine (a) level (i.e., average behavior), trend (i.e., increasing or decreasing data points), and variability (i.e., spread of data points) within phases; (b) immediacy of effects (i.e., change in level), overlap (i.e., proportion of data points that overlap) between phases; and (c) consistency of data patterns within and across phases (Barton, Lloyd, Spriggs, & Gast, 2018; Gast & Spriggs, 2010; Kennedy, 2005; Kratochwill et al., 2010). Participant behavior was considered responsive to intervention if observable and sustained reductions in problem behavior and increases in desired behaviors were observed during the intervention phases (Fairbanks, Sugai, Guardino, & Lathrop, 2007). Accurate responding was the dependent variable upon which demonstration of functional control was predicted. Graphs (see Figure 2) depict the percentage of observation intervals with at least one instance of accurate responding.
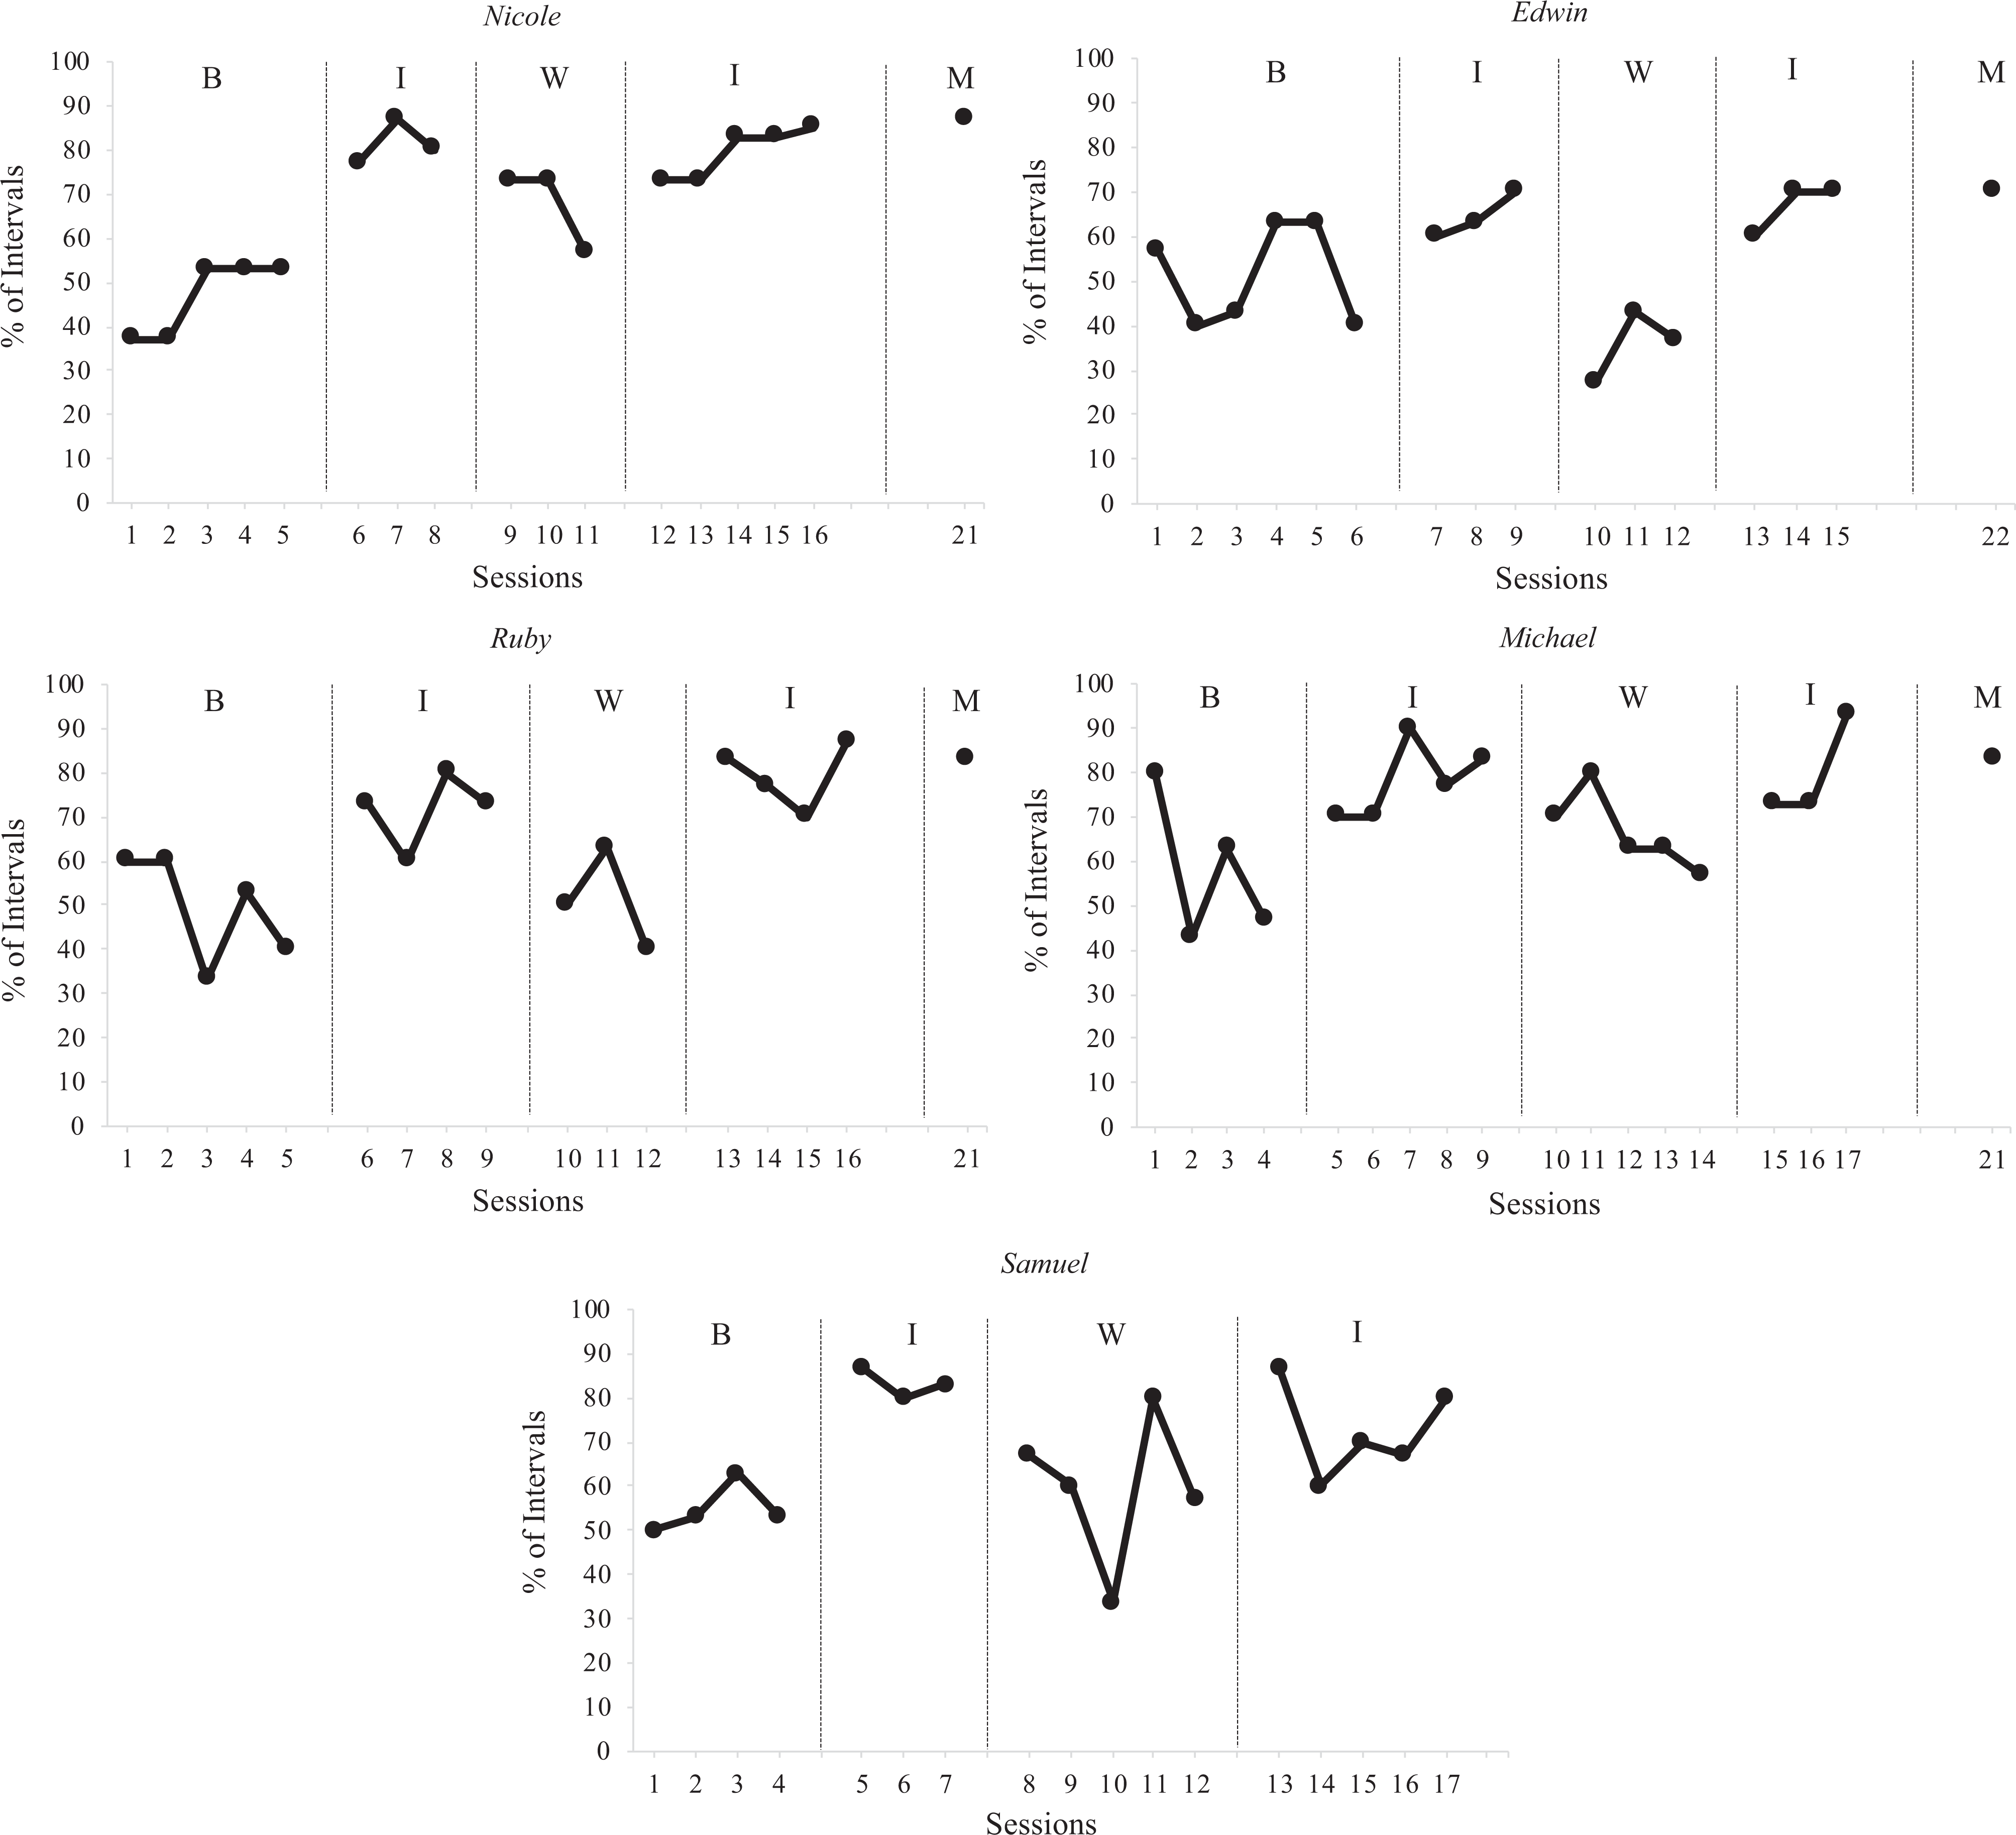
Percentage of intervals with accurate responding during baseline, intervention, withdrawal, and maintenance phases for study participants. B = baseline; I = intervention; W = withdrawal; M = maintenance.
Effect size
To estimate the effect of the intervention, two effect sizes were calculated. First, the percentage of nonoverlapping data (PND; Scruggs & Mastropieri, 2001) was calculated for each participant by dividing the number of nonoverlapping intervention points (i.e., those below the lowest baseline measurement in the initial baseline phase) by the total number of intervention points. Next, the percentage exceeding the median (PEM; Ma, 2006) was also calculated for each participant. The PEM effect size was selected based on its straightforward interpretation and its ability to better reflect behavior trends within phases as compared to other widely used metrics like PND (Olive & Franco, 2008; Vannest & Ninci, 2015). After establishing the median baseline data point, PEM was calculated by dividing the number of nonoverlapping intervention points (i.e., those that fell below the median baseline measurement in the initial baseline phase) by the total number of intervention points and then multiplying that value by 100. Common rules of thumb for evaluating treatments (i.e., 90% and above = very effective, 70–90% = effective, 50–70% = questionable, below 50% = ineffective; see Scruggs & Mastropieri, 1998) were applied to both PND and PEM to approximate the effectiveness of the intervention for each participant.
Results
Effects on Response Accuracy
Participant data obtained for accurate responding are depicted in Figure 2 and average percentages of accurate responding in each phase for participant are summarized in Table 1. Across the five participants, the intervention produced increases in the average rates of response accuracy as compared to baseline phases. Specific participant behaviors are discussed below.
Average Percentage of Intervals With Accurate Responding for Each Participant in Each Phase.

Note. B = baseline; I1 = first intervention phase; W = withdrawal; I2 = second intervention phase; M = maintenance.
Nicole
During baseline, intervals scored with accurate responding averaged 46.6% (range = 37.0–53.0%). As is shown in Figure 2, implementation of the intervention resulted in an immediate increase in accurate responding, with the behavior occurring in an average of 81.3% of intervals (range = 77.0–87.0%). As illustrated in Figure 2, the data document a slight increasing trend during this intervention phase, with low variability.
A withdrawal of the intervention was implemented to establish functional control over accurate responding and, as seen in Figure 2, resulted in a slight but immediate decrease in accurate responding. During this phase, intervals scored with accurate responding averaged 67.7% (range = 56.0–73.0%) and displayed a decreasing trend. Upon return to intervention, an immediacy of effect and improvement of response accuracy was again observed, with the behavior occurring in an average of 79.3% of intervals (range = 73.0–85.0%). Data collected during a maintenance phase documented that accurate responding continued, with accurate responding occurring in 87.0% of intervals. Nicole’s data demonstrated evidence of a very effective treatment with both effect size metrics (i.e., PND and PEM) indicating 100% nonoverlap.
Edwin
During baseline, intervals scored with accurate responding averaged 51.0% (range = 40.0–63.0%). As is shown in Figure 2, implementation of the intervention resulted in an increasing trend in accurate responding. Edwin also demonstrated an increase in level of accurate responding in the intervention phase with accurate responding occurring in an average of 64.3% of intervals (range = 60.0–70.0%).
Upon return to the baseline condition, Edwin demonstrated an immediate decrease in level of accurate responding. Intervals scored with accurate responding averaged 35.7% with a range of 27.0–43.0%. Upon return to intervention, an increase in accurate responding was again observed, with an immediacy of effect displaying a rise in level from the previous phase. During this phase, accurate responding was consistent with the similar intervention phase and occurred in an average of 66.7% of intervals (range = 60.0–70.0%). Maintenance data document that Edwin’s accurate responding continued to occur at a similar rate to intervention phases, with accurate responding occurring in 83.0% of intervals. PND effect size calculations for Edwin’s data indicated a potentially questionable treatment effect with PND = 50%; however, the PEM statistic accounted for the desirable increasing trend in the intervention phases and reflected a very effective treatment measure with PEM = 100%.
Ruby
In general, Ruby demonstrated less consistent performance within each phase and there were more overlapping data points across phases. However, her average performance within phases was quite consistent. During baseline, Ruby demonstrated accurate responding during an average of 49.2% of intervals (range = 33.0–60.0%). As shown in Figure 2, these data document a decreasing trend with moderate to high rates of inaccurate responding and some variability across sessions. In the first intervention phase, the introduction of the added instructional cueing and self-regulation supports resulted in an immediate increase in accurate responding from 40.0% to 73.0%, with accurate responding occurring in an average of 71.5% of intervals across sessions (range = 60.0–80.0%).
With the withdrawal of intervention in Session 10, Ruby demonstrated an immediate decrease in accurate responding and during this phase, intervals scored with accurate responding averaged 51.0% with a range of 40.0–63.0%. Figure 2 indicates that these data show a slight decreasing trend. An immediate increase in intervals with accurate responding occurred upon return to intervention. During this phase, Ruby continued to demonstrate more instances of accurate responding, with the behavior occurring in an average of 79.2% of intervals across sessions (range = 70.0–87.0%). As seen in Figure 2, rates of accurate responding remained high during the maintenance probe. Additionally, effect sizes measures indicated evidence of treatment effectiveness for Ruby with PND = 88% and PEM = 100%.
Michael
Like Ruby, Michael had overlapping data points across phases, but he demonstrated consistent trends of performance in similar phases. In the baseline phase, Michael exhibited accurate responding in an average of 58.2% of intervals (range = 43.0–80.0%) and these data showed a decreasing trend. With the addition of the instructional cueing and self-regulation supports, the percentage of intervals with accurate responding rose from 47.0% during Session 4 to 70.0% in Session 5. Accurate responding during the first intervention condition averaged 78.0% across intervals (range = 70.0–83.0%) and followed an increasing trend.
After the withdrawal of the instructional cueing and self-regulation supports, Michael exhibited accurate responding during an average of 66.6% of intervals (range = 57.0–80.0%), demonstrating a decrease in level compared to the intervention phase, with a decreasing trend. Last, with intervention reimplementation, accurate responding again increased in level (average = 79.7%, range = 73.0–93.0%) and showed an increasing trend. A follow-up maintenance probe revealed similarly high levels of accurate responding. Like Edwin, Michael’s effect size metrics were highly impacted by the trends across phases. The high initial point in the baseline phase of Michael’s data resulted in PND = 38%, which suggests an ineffective treatment, but when evaluating overlap based on median baseline behavior PEM = 100%, suggesting that the intervention was also generally effective for Michael.
Samuel
During baseline, Samuel exhibited accurate responding in an average of 55.0% of intervals (range = 50.0–63.0%). With the introduction of the intervention, Samuel’s rate of accurate responding increased from 53.0% to 87.0% of intervals. As displayed in Figure 2, rates of accurate responding remained high and stable during the first intervention phase, with an average of accurate responding occurring in 83.3% of intervals (range = 80.0–87.0%).
With the removal of the added instructional cueing and self-regulation supports following the intervention phase, rates of accurate responding decreased and were highly variable across sessions (average = 59.6%, range = 34.0–80.0%). Last, with the reintroduction of the intervention, levels of accurate responding increased to an average of 72.8% of intervals (range = 60.0–87.0%). However, data during this phase were moderately variable, and this was presumably due to the discipline issues occurring outside of the study as detailed above. Due to the eventual suspension of this participant, no maintenance data are available. Nonetheless, effect size measures supported treatment effectiveness for Samuel with PND = 88% and PEM = 100%.
Social Validity
To maintain participant confidentiality, student satisfaction with KinderTEK was summarized across all participants in the feasibility and usability study. Seventy-six percent of students indicated that they liked or really liked to play KinderTEK. Similarly, 78% of students replied that KinderTEK made math fun and 86% indicated that they believed KinderTEK taught them math. Teachers also indicated satisfaction with the KinderTEK intervention. Specifically, they agreed–strongly agreed with all survey questions indicating that they found KinderTEK feasible to implement and effective for use with the kindergarten students in their classrooms.
Discussion
Establishing positive mathematics learning trajectories for all students in the early grades is of critical importance. To this end, the current study aimed to evaluate the extent to which the use of targeted instructional cueing and self-regulation supports embedded in an iPad-based kindergarten mathematics program was associated with an increase in accurate responding by students with difficulties attending to instruction. Whereas technology tends to be motivating and interesting for students, the application of instructional cueing and self-regulation supports may be especially important for technology-based instruction where there is less direct teacher monitoring and a high potential for unfocused, ineffective student interaction with the learning material. Curricula and intervention development can be improved if developers have a clear understanding of the impact of specific learning supports as they are applied to technology delivered interventions.
Results of the current study suggest a functional relation between the provision of targeted instructional cueing and self-regulation support features and improved response accuracy for kindergarten students in the context of an iPad-based mathematics intervention. At baseline, all study participants demonstrated accurate responding behavior approximately 50–60% of the time. By the final intervention phase, the frequency of accurate responding was observed in approximately 70–80% of the intervals, and this pattern remained consistent in maintenance observations. Additionally, all participants demonstrated a return to less desirable response patterns, either in rate or trend with the withdrawal of the instructional cueing and self-regulation support features in the middle of the study, and PEM effect sizes indicated that the intervention was highly effective in all cases. These results suggest that the targeted instructional cueing and self-regulation support features of the iPad-based mathematics intervention were effective in increasing response accuracy for participants.
These findings make an important contribution to our understanding of factors associated with the efficacy of educational technology and suggest that targeted, individualized support features may improve student response to technology-based interventions. Creating features that encourage all users to interact with educational technology with a high level of attention and engagement is key for evaluating the utility and effectiveness of educational technology and technology-based interventions. Improved attention to instruction is critical to ensure that students gain educational value from technology-based interventions, especially students who are at risk of MD (Sims et al., 2016). Learning depends on students attending to the instruction and responding to prompts and items when presented.
The effectiveness of these kinds of supports is also important in light of the increasing prevalence of technology-based instructional programs (Devlin, 2014). Technology continues to be integrated at a steady pace into schools across the country [Association for Supervision and Curriculum Development (ASCD, 2016)], and touch screen devices are used by even the youngest children (e.g., over 72% of children under the age of 8 were reported to have used mobile devices in past year; Common Sense Media, 2013), but the utility of providing instruction via technology especially for young students with difficulties attending to instruction requires additional examination. As curriculum developers and education technology companies begin to tackle the challenge of using computers, tablets, and other technologies to provide academic content to elementary-aged children, a simultaneous focus on the quality of the learning experience is essential. That is, in order for instructional technologies to be maximally effective, they need to incorporate features that ensure users are attending to the instruction being provided.
Knowledge of the extent to which students are engaged in technology-based instruction is also critical for researchers who aim to test the validity of technology-based performance data. Making inferences about student learning related to educational technology requires that users interact with the technology with a high degree of fidelity. Thus, developers who aim to create efficacious educational technology programs that meet the needs of a range of students must maximize user engagement and response, embedding individualized instructional delivery options may be one way to address this challenge.
In sum, results from this study suggest that technology-based instruction built around differentiated content and pacing may be improved by offering differentiated learning environments and targeted, in-app behavioral supports. Individualized settings or user options may dramatically enhance the user experience for—and achievement gains by—learners with specific, identifiable needs. Embedding these features in technology products represents an important next step in educational technology development.
Limitations
Results of the present study suggest that the targeted instructional cueing and self-regulation supports were effective for increasing accurate responding of students; however, several limitations exist. First, participants in this study were those identified by each general education teacher as having “poor attention to instruction.” Teachers’ interpretations of this term and their ability to separate behavioral issues and other manifestations of inattention may have led to a heterogeneous sample. Future research should investigate the utility of administering specific measures of attention, as it relates to instructional material in the subject selection process to more clearly describe and identify the aspects of attention being addressed.
Second, coding required knowledge of the app’s visual and auditory activity, so students’ behavior during baseline and intervention could have been affected by their close physical proximity to the researcher staff/observer. Some students may have attended to the instruction more than they would have normally, whereas others may have taken advantage of the one-on-one environment’s personal attention and attended less to the task at hand. However, we expect this limitation to affect the study’s generalizability rather than its accuracy because this was a within-student manipulation of condition. Additionally, given the required proximity for data collection, field-based interobserver agreement was not collected. Future research efforts should explore video recording or other methods to track interobserver agreement.
Third, the number of data points collected in each phase of the study was less than the recommended five points per phase (Kratochwill et al., 2013) for some participants. Due to the resource intensive nature of this study, which required trained research personnel to conduct one-on-one intervention sessions, phase changes were made after a consistent pattern of behavior was established via a notable change in level or trend. To meet What Works Clearinghouse standards for single-case designs without reservations, future research efforts should aim to include at least five data points per phase.
Next, there is little consensus about effect sizes in single-case research. In an effort to address some of these concerns, two overlap-based, nonregression effect sizes were generated in the current study. Additional information could be gathered through the application of other effect size approaches that draw on similarities between single-case research and group designs (see Hedges, Pustejovsky, & Shadish, 2012). Furthermore, the PND and PEM values calculated in the current study sometimes varied for individual participants. Additional study is needed to further explore these discrepancies.
Finally, the present study is limited in that only one dependent variable associated with attention to instruction (i.e., accurate responding) was coded. Future research should examine the effect of the targeted instructional cueing and self-regulation supports on additional student behaviors and how the application of specific instructional cueing and self-regulation supports is associated with changes in other specific attentional and critical learning behaviors. Additionally, the outcome variable measured here could be a reflection of learning in addition to attending. Although outside of the scope of the current study, future research could also examine the extent to which the provision of targeted, individualized supports in technology-based applications is associated with improved achievement.
Conclusion
If students are not attending to instructional material, regardless of the delivery method, they are not likely to reap much educational benefit. For all students to be optimally successful in acquiring knowledge from educational technologies, students must be attending to the intended information and be able to accurately respond when prompted. Ensuring that students are attending to the material presented and aware of requests for input is critical to the learning process in technological environments. Whereas teachers can flexibly add and remove instructional cueing and self-regulation supports when particular students need them in a traditional instructional environment, educational technologies have not—to our knowledge—supported this level of customization. This study suggests the value of offering such student supports and the importance of continuing to monitor and track student engagement in technology-based instructional situations.
Footnotes
Authors’ Note
The opinions expressed are those of the authors and do not represent views of the Institute or the U.S. Department of Education.
Declaration of Conflicting Interests
The author(s) declared the following potential conflicts of interest with respect to the research, authorship, and/or publication of this article: Lina Shanley, Mari Strand Cary, and Ben Clarke are eligible to receive a portion of royalties from the University of Oregon’s distribution and licensing of certain KinderTEK-based works. Potential conflicts of interest are managed through the University of Oregon’s Research Compliance Services..
Funding
The author(s) disclosed receipt of the following financial support for the research, authorship, and/or publication of this article: The research reported here was supported by the Office of Special Education and Rehabilitative Services through Grant R324A110286 to the University of Oregon.