



Abstract
There are multiple pathways for students with and without disabilities to learn new vocabulary terms. However, the number of empirically tested and validated multimedia options is surprisingly limited. In this study, researchers tested a commercially available app (InferCabulary) to evaluate the impact on vocabulary performance of fifth-grade students with and without disabilities. A key practice that can take many forms while maintaining its core characteristics is explicit instruction. Therefore, researchers paired the functionality of the app with explicit instruction to evaluate its impact on student learning. Based on a counterbalanced design across 6 alternating weeks accessing the app or teacher-led business-as-usual instruction, students scored higher on weeks when they used the app plus explicit instruction to learn new terms. Implications for future research are included.
Keywords
Researchers in the field of vocabulary instruction generally agree on effective instructional practices that should reside within all teachers’ repertoires (Beck, McKeown, & Kucan, 2002; Jitendra, Edwards, Sacks, & Jacobsen, 2004; Stahl & Nagy, 2006). To illustrate, researchers recommend spending instructional time explicitly teaching the meaning of terms (Graves, 2006), which includes providing student-friendly definitions (Archer & Hughes, 2011), highlighting and explaining relevant examples and nonexamples (Byrant, Goodwin, Bryant, & Higgins, 2003), and cueing students to the semantic features within and across related words (Bos & Anders, 1990). Experts suggest to also explicitly teach meanings of morphological parts of words, which doubles as a generative strategy for unlocking meaning of terms (Ebbers & Denton, 2008; Harris, Shumaker, & Deshler, 2011; Nagy, 2007). The keyword mnemonic strategy is another well-known approach for teaching word meanings to students with disabilities (Scruggs, Mastropieri, Berkeley, & Marshak, 2010). These practices can be used individually but are more effective when used together or in concert with other approaches (Baumann, Kame’enui, & Ash, 2003; Kennedy, Deshler, & Lloyd, 2015).
Additionally, teachers are encouraged to provide students with multiple opportunities to interact with terms, which may include discussions, writing, or other applied activities that provide semantically rich contexts for encountering and manipulating words (Ford-Connors & Paratore, 2015; Lesaux, Kieffer, Kelley, & Harris, 2014; Snow, Lawrence, & White, 2009). Many teachers believe students can learn new vocabulary simply through reading; however, the extent to which students with disabilities and others who struggle with reading can do so is questionable (National Reading Panel, 2000). In sum, there is an impressive amount of scholarship demonstrating the impact of high-quality vocabulary instruction on student learning. However, two open questions are (1) the extent to which the empirical knowledge base matches implementation by practitioners in schools and (2) whether there are any emerging approaches to teaching vocabulary that researchers and practitioners should be aware of.
The purpose of this article is to introduce and empirically test a novel, multimedia approach to vocabulary instruction for students with and without disabilities. Across the research literature noted above, a commonality is the teacher provided the meaning of terms in an explicit, orally driven way to students. A potentially interesting idea is to have students engage vocabulary terms in such a way that they use various visual and text-based clues to infer the meaning of an unknown term. When added to scaffolds offered within a teacher-directed, explicit instruction framework (e.g., opportunities to respond [OTRs], modeling), and delivered using a multimedia platform, the cognitive act of inferring word meaning using visually and text-driven examples might provide an interesting and powerful mode of learning for students with and without disabilities.
Intensifying Vocabulary Instruction for Students With Disabilities
Researchers in the field of special education recognize the need to provide a more intense form of vocabulary instruction to students with disabilities than what may be necessary for their peers without learning challenges (Jitendra et al., 2004). However, general education teachers receive minimal, if any, specific training on how to provide evidence-based instruction for students with disabilities, and they report feeling unprepared to meet the individual needs of these students (Reschly, Holdheide, Behrstock, & Weber, 2009). This is problematic because most students with high-incidence disabilities spend the majority of their school day in general education classes (U.S. Department of Education, 2016).
Observational studies of general education teachers find wide use of orally driven vocabulary instruction (without elements of explicit instruction as defined by Archer & Hughes, 2011), frequent reliance on text-laden slides, and the practice of students copying notes into notebooks at the expense of recognized best practice in this domain (Klingner, Urbach, Golos, Brownell, & Menon, 2010; Swanson, Solis, Ciullo, & McKenna, 2012). Although some students can and do learn from these approaches, most students with disabilities require more explicit, intense instruction in order to master use of new vocabulary (Archer & Hughes, 2011). Hallmarks of explicit instruction per Archer and Hughes include a high rate of OTRs, frequent feedback, clear and focused language for definitions, use of examples and nonexamples, modeling, and independent practice. Not all explicit lessons have all of these elements, but OTRs, feedback, and clear language are omnipresent for vocabulary learning. The vocabulary learning approach tested within this article is multimedia, meaning it relies on visuals and text but also leverages elements of explicit instruction.
Nearly any teacher can provide and repeat a student-friendly definition, but it takes a higher level of content expertise to formulate effective examples and differentiate from nonexamples, highlight key semantic features of words, generate discussion questions to situate a term or concept within a unit or broader theme, and deliver relevant, illustrative, and effective demonstrations (Ball, Thames, & Phelps, 2008; Hill, Rowan, & Ball, 2005). Therefore, even if special educators tasked with supplementing students’ vocabulary knowledge and performance have sufficient instructional time, that time may not reflect what experts would consider to be high quality within a given content area (Swanson et al., 2012). In sum, although our field does possess a strong base of knowledge for providing effective vocabulary instruction, for many, a gap remains between the research and what is implemented in schools.
Multimedia Cures All?
Some researchers and practitioners have looked to multimedia as a possible supplement to regular instruction for students with disabilities given its portability, flexibility, and increasing capacity to deliver high-quality instruction and embedded practice opportunities (Kennedy, Rodgers, Romig, Lloyd, & Brownell, 2017). This is logical—multimedia has great promise to package and deliver instruction that incorporates known evidence-based practices as well as leverage the power of visuals to create powerful cognitive anchors within students’ existing schemas (Xin & Rieth, 2001). Using multimedia that embeds evidence-based vocabulary practices could help address the implementation gap noted above. If instruction can be delivered using an app, a piece of software, or another web-based program, and students with disabilities demonstrate measurable gains, it makes sense that practitioners would consider adopting that tool. However, empirical research providing evidence that multimedia can be effective in this space is limited, particularly in terms of measurable learning gains for students with disabilities (Byrant et al., 2003; Kuder, 2017).
Existing empirical research
In one study by Horton, Lovitt, and Givins (1988), six ninth-grade students with learning disabilities (LD) in a social studies course participated in a multimedia vocabulary program that taught word meanings using direct instruction and corrective feedback. The definition for a term was shown on a computer screen. Students were then provided a list of distractors and were required to find and click on the correct term without the support of pictures or other graphics. Students received feedback based on their response and were required to try again when they made errors. Following instruction, researchers gave students a posttest consisting of multiple-choice vocabulary items. Results indicated students made significant improvement (26–68% correct) between the pretest and posttest.
Xin and Rieth (2001) used the theoretical principle of anchored instruction to support the use of video in vocabulary instruction for upper elementary students. Students were shown anchor videos to build their cognitive understanding of unknown words and then teachers led explicit discussions centered on their content. Students who learned using the anchor videos significantly improved their vocabulary performance relative to peers in a nonmultimedia condition.
Kennedy, Deshler, and Lloyd (2015) and Kennedy, Thomas, Meyer, Alves, and Lloyd (2014), respectively, used Content Acquisition Podcasts for Students (CAP-S) to provide supplemental vocabulary instruction to high school students with and without disabilities. CAP-S are short, multimedia vignettes that package a sequence of explicit vocabulary practices (i.e., student-friendly definition, example, nonexample; highlight morphological word parts; and highlight semantic relationships with similar terms) all using images, narration, and limited on-screen text in accordance with Mayer’s (2009) cognitive theory of multimedia learning. Students with and without disabilities who learned using CAP-S significantly improved their vocabulary performance relative to peers who learned using nonmultimedia approaches.
Summary of existing research
Although these four studies provide a basic level of knowledge regarding the use of multimedia to support the vocabulary performance of students with disabilities, there is still much that is unknown in this space. Each study focused on a relatively small group of students learning a few, select terms. That said, the successes of these studies demonstrate that it is possible to improve vocabulary outcomes for students with disabilities using multimedia as a core feature of the instruction. It is important to note that each study combined nonmultimedia vocabulary practices within the features of their multimedia delivery vehicle. This is critical to the success of new and existing multimedia products; multimedia should be used to enhance effective vocabulary instruction not as a replacement for such instruction.
These studies represent the potential of technology to address one of the limitations of vocabulary instruction described above. That is, as vocabulary definitions become more subject-specific and require a high level of content expertise from teachers, technology can supplement a teacher’s knowledge in an area where they lack expertise. For example, technology created by content experts could provide the examples, nonexamples, and distinguishing features of a term that might be unfamiliar to the special education teacher tasked with supporting students with disabilities.
Purpose of study
Another commonality of most empirical approaches to vocabulary instruction in the field of special education is the teacher is largely responsible for delivering instruction. This is no surprise—explicit instruction is a prevailing pedagogical paradigm (Archer & Hughes, 2011). However, a critical feature of effective vocabulary instruction is students’ immersion with words in terms of independent reading, writing, and participation in other activities that require application of knowledge that are not provided within an explicit framework (Snow et al., 2009). As noted, for students with disabilities and others who struggle, learning from reading and other independent means can be a challenge (Jitendra et al., 2004). Opportunities for students to experience carefully scaffolded opportunities to use inferencing skills to figure out the meaning of terms could be an opportunity to blend explicit instruction and a deeper type of vocabulary learning often reserved for students who are functioning on a higher academic level (Nassaji, 2003). The multimedia product introduced and empirically tested within this article provides this type of hybrid student-centered but teacher-scaffolded instruction.
Many publishers and multimedia developers market instructional product(s) to teachers and make claims about effectiveness without supporting empirical evidence. This creates a paradox because developers and publishers have little incentive to subject their products to rigorous empirical testing when consumers (e.g., schools) have demonstrated a willingness to buy these products without strong research evidence. The burden thus falls upon researchers to conduct rigorous investigations of multimedia tools, and the school personnel who make purchasing decisions to demand publishers and developers provide empirical evidence of effectiveness prior to purchasing the product. This is especially critical when considering the learning needs of students with disabilities, as putting untested products in the hands of students with the most intensive needs may not constitute the type of evidence-based, individualized instruction called for in their individualized education plans (IEPs).
The purpose of this article is to describe the pilot results of an empirical study testing the impact of a multimedia tool designed to provide students with and without disabilities multiple exposures to the meaning of unknown terms by using rich visuals, semantically driven examples, student-friendly definitions, and interactive practice opportunities. The InferCabulary® app (https://infercabulary.com) can be used by students for independent learning and practice or by teachers within an explicit lesson. In this study, researchers evaluated the impact of the app paired with explicit instruction on vocabulary performance of students with and without disabilities. Those outcomes were compared with those of students taught by teachers using a nonmultimedia vocabulary approach.
This article addresses two research questions:
Method
This research study is an independent field test of the InferCabulary app, which is available for purchase on www.infercabulary.com. The researchers have no financial stake in this product, received no payment or support from the developers of the app to conduct this study, and were similarly not unduly influenced in any way by the app developers. The developers did not have access to any data, findings, or conclusions prior to publication.
Setting and Participants
The University Human Subjects Committee, the participating school district’s research review board, the principal of the school, the parents of all students, and the students gave permission to conduct this research. The school district is located in a rural, mid-Atlantic county of ∼15,000 residents. The researchers recruited three fifth-grade teachers and their students to participate. A total of 75 students received parental permission to participate. Caucasian students represented the largest ethnic subgroup (N = 58, 77.3%), African American students were the next largest group at (N = 12, 16%, and Hispanic/Latino students comprised the balance (N = 5, 6.6%).
Of the 75 participants, 52% were female and 48% were male. The mean age of participants was 10.7 years. At the time of the study, the school had a student enrollment of 395, 67% of whom received free and/or reduced-price lunch. Permission to collect individual socioeconomic status could not be obtained from the school district’s human subjects review board. However, given that 67% of the students in the school receive free or reduced-price lunch, we assume an approximately matching percentage of participants received free or reduced-price lunch.
Teacher participants
Two certified fifth-grade teachers from the same school participated in this study. Teacher 1 was a Caucasian female with a master’s degree in her 15th year of teaching. Teacher 2 was a Caucasian female with a bachelor’s degree plus 15 credits toward a master’s degree in her 9th year of teaching. Both teachers received an honorarium from a fund for pilot research established at the first author’s university. The school’s 3rd fifth-grade teacher agreed to participate but was unable due to her maternity leave. However, the students from that teacher’s class still participated by being split among the two other teachers’ classes. Thus, Teacher 1 taught 38 students, and Teacher 2 taught 37 students. To make the class size more manageable, the teachers split the students into two groups each and rotated them through the experimental and silent reading conditions during the daily literacy block time set aside for the 6-week study (see below for details).
Student participants with IEPs
Students with IEPs (n = 11, 14.6%) and without IEPs (n = 64, 85.4%) participated in this project. The specific educational diagnoses for the 11 students with IEPs were specific LD (n = 4), attention deficit hyperactivity disorder (ADHD; n = 3), communication disorders (n = 2), and autism spectrum disorder (n = 2). Two of the students with LD and one student with ADHD were African American. The remainder were Caucasian. Based on IEP records and results from the Wechsler Intelligence Test for Children, Fourth Edition, the mean IQ score for the 11 students was 92.1 (standard deviation [SD] = 8.2). Individualized testing information was not made available.
Each student received daily special education services embedded within their core academic content classes (i.e., social studies, science, mathematics, and language arts) taught by a general education teacher and supplemented by a special educator. Additionally, six students received pull out, small group reading instruction in a Tier 3 setting from a special educator. Scores from the preceding year’s state reading assessment (fourth grade) were the only interpretable data made available. All students with IEPs in this study took the state assessment with accommodations (as designated by IEPs). However, only 2 of the 11 received a passing score (see Table 1 for more information about the participants with disabilities).
Participant Information for Students With IEPs.

Note. Overall fourth-grade reading raw score and fourth-grade vocab raw score refer to number of raw questions answered correctly on the preceding year’s end of year state reading assessment. Passing score for the fourth-grade reading assessment was 27+ raw questions correct. The fifth-grade benchmark score for the CORE assessment is 23+. LD = specific learning disability; ADHD = attention deficit/hyperactivity disorder; ASD = autism spectrum disorder; CD = communication disorder; AA = African American; C = Caucasian; H = Hispanic/Latino.
Struggling student participants
In addition to the approximately 14% of students in the sample who had documented IEPs, another group of students in the sample could be classified as struggling. Based on data made available to the researchers from the previous year’s (fourth grade) statewide reading assessment, 20 of the 64 students without IEPs (31.25%) did not earn a passing score. The sample students who could be identified as struggling comprised 11 male and 9 female students. Of these participants, 12 are Caucasian, 6 are African American, and 2 are Hispanic/Latinx. Thus, in total, 29 of 75 participants did not pass the fourth-grade state reading assessment (38.6%; (see Table 2 for additional information about the students designated as struggling).
Participant Information for Struggling Students.
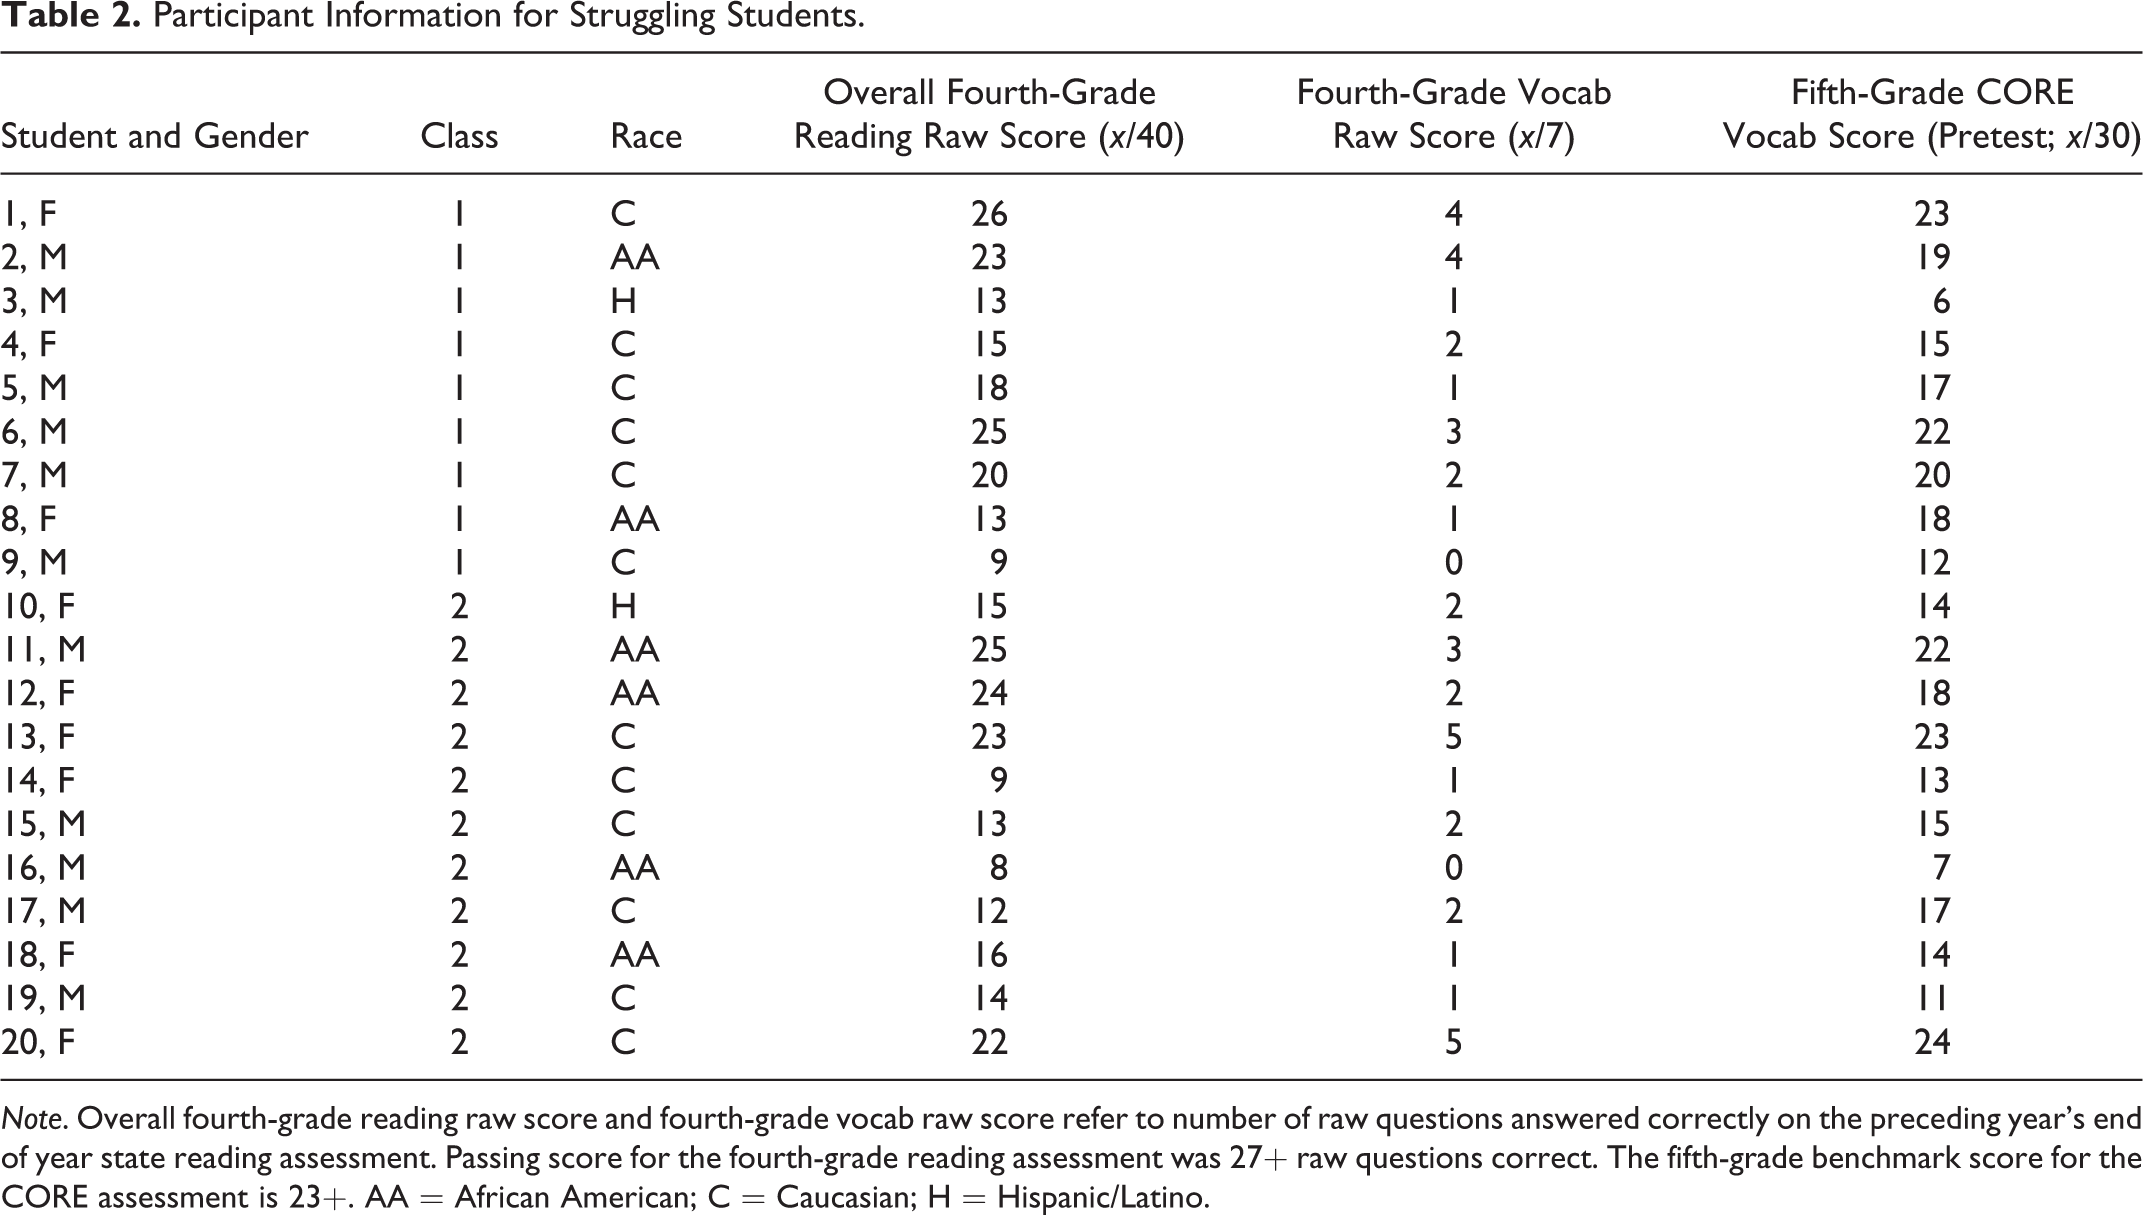
Note. Overall fourth-grade reading raw score and fourth-grade vocab raw score refer to number of raw questions answered correctly on the preceding year’s end of year state reading assessment. Passing score for the fourth-grade reading assessment was 27+ raw questions correct. The fifth-grade benchmark score for the CORE assessment is 23+. AA = African American; C = Caucasian; H = Hispanic/Latino.
In addition to IEP status and performance on the previous year’s state reading assessment, all students in this project took the fifth-grade probe within the Consortium on Reaching Excellence in Education (CORE) Vocabulary Screening (Diamond & Thorsnes, 2008) as a pretest and posttest. This measure’s results at pretest provided another, more current data point to identify students who were struggling at the time of the study and corroborate the decision to label students who did not pass the prior year’s state reading assessment as struggling. We note the CORE screening score for the students identified as struggling in Table 2. All instruments in the study are described in detail in the measures section below.
Procedures
Intervention
This study is a pilot of the InferCabulary app for supporting vocabulary development. The app is intended to help students figure out the meaning of unknown words using captioned images and a student-friendly definition. The app can be used by students working alone or a teacher can integrate the app into an explicit lesson. In this study, teachers did the latter. The app also has a “game mode” where the user sees images and has to pick the correct typed vocabulary term from a list. Teachers used this mode with students on Thursdays as part of their review.
When first activated, the app shows a student six images (without captions) and the printed vocabulary word (without definition). Each image illustrates the meaning of the vocabulary term via an applied example. For example, with the term prominent, six pictures are shown, including a large historic building, a tall skyscraper, a green match pulled out from a group of red matches, a close-up of a person’s vividly green eye, a stock photo of four white bubble men with a fifth red one standing in front, and a leading business manager surrounded by admirers. Students use these example images as clues to begin inferring the meaning of the term. When the screen is touched, each image produces a caption read aloud by a voice within the app. In the current study’s intervention, the teacher instructed students to use the images, the caption, and their inferential skills to try and figure out what the term means. The teacher asked questions along the lines of “What do you notice about this picture?” Once the students had a chance to see each image and caption, the teacher prompted them to make a good guess at what the term means. After a short discussion, the teacher clicked on the vocabulary term, revealing a student-friendly definition that is read aloud. The teacher then led another discussion to see the extent to which the real definition fits with the students’ hypotheses. Figure 1 is a screenshot of the app when all captions and the student-friendly definition are revealed for the term exasperated.

InferCabulary sample.
The app, therefore, leverages several well-known practices for teaching vocabulary such as using imagery, multiple examples, authentic discussion, and student-friendly definitions within an explicit framework (e.g., providing multiple OTRs and modeling). However, the novel approach of using multiple images and corresponding captions to have students infer the meaning of the term within a multimedia explicit framework has potential to be a powerful addition/alternative to the traditional practices often deployed by teachers to teach vocabulary.
Selection of terms and lesson plans
The intervention lasted for 6 weeks. Prior to the implementation, researchers identified approximately 200 vocabulary terms available within the InferCabulary app to teach during the study. According to the developers, the terms in the app were drawn from “Great Books” and other standards-driven sources appropriate for use in the late elementary grades (4–6). The full list of 200 words were shown in isolation to three fifth-grade students not involved in the study (without IEPs and not designated as struggling) to estimate the likelihood of the terms being known before the study began. The students were shown each word one at a time and asked to state its definition. The goal was to identify 90 difficult but grade-appropriate words for use in this study. When all three students did not know a term’s definition, it was selected. A total of 71 words were identified using this procedure. The remaining 19 words were known by no more than one of the pilot students. A version of the app was prepared, so only those 90 words would be available to teachers.
Once terms were selected, researchers developed written lesson plans and instructions for teachers to use during the 6-week study. The lesson plans for the weeks when the app was used included principles of explicit instruction. Each lesson included an advance organizer, clear language, multiple opportunities for students to respond, explicit prompts for students to use their inferential thinking, teacher modeling via a think aloud, student-friendly definitions, and use of examples delivered via the app with images and corresponding captions. Researchers developed a fidelity checklist to use when observing teachers to monitor and evaluate fidelity of implementation to the lesson plan template and instructional process. A sample lesson plan and the fidelity checklist are available in Appendix.
It was not possible to randomly assign students to experimental conditions. Therefore, the two teachers used a counterbalanced design by alternating weeks either using the app or using their regular approach to vocabulary instruction. In Week 1, the teachers drew straws to see which one would begin using the app, and which would begin using a BAU approach. Teacher 1 drew the long straw and taught the first 15 words using the app during Week 1. Teacher 2 taught the same words using a BAU approach. In Week 2, the teachers switched: Teacher 1 taught words 16–30 using her typical approach, and Teacher 2 used the app. The teachers continued alternating across all 6 weeks, so each teacher and class of students had 3 weeks and 45 terms taught using the app, and the same in the BAU condition. Researchers documented what the BAU condition looked like (see below).
InferCabulary condition
For 3 alternating weeks of the 6-week study, teachers used the app to lead instruction. Researchers provided the two participating teachers an in-person app training prior to the undertaking of research activities. During the treatment sessions, teachers received access to the aforementioned written lesson plans. Teachers spent no more than 20 min per day using the app. The time was spent teaching five words each on Monday, Tuesday, and Wednesday; providing a review on Thursday; and administering a quiz on Friday. Two members of the research team used the fidelity checklist to conduct weekly observations during one 20-min lesson on Monday, Tuesday, or Wednesday.
Researchers also used a low-inference observation software, the Classroom Teaching (CT) Scan, to observe instruction (Kennedy, et al., 2017). The CT Scan permits recording of discrete teaching moves in real time as well as counts of individual questions and feedback statements provided by the teacher and questions posed by students. For example, when watching a lesson, the CT Scan permits an observer to record questions and feedback statements as well as the word being taught, the amount of time spent teaching that term, the specific instructional practices that were used—along with corresponding descriptive markers (e.g., steps or components of the practice)—and the visual aids that were used (see http://www.classroomteachingscan.com/ctscan/timeline.htm?menus.txt&341 for a sample data output). The CT Scan does not provide a quality score, although the observer can use the descriptive data to make a value judgment about the extent to which the instruction was or was not high quality. The purpose of using the CT Scan in this study in addition to the fidelity checklist described above was primarily to describe instruction occurring during the comparison condition (see below) to draw a contrast with the approach offered by the app.
BAU comparison condition
For the 3 alternate weeks when the app was not used, each teacher taught 15 terms using their normal (i.e., BAU) approach. The only restriction researchers put on the teachers was to not use the images from the app during instruction. Two members of the research team used the CT Scan to observe teachers once during each of the 3 weeks of BAU instruction to document what practices were used. This approach also guarded against teachers adopting the methods from the app into their regular instruction, which is an unavoidable confounding variable in this study. No teacher in the BAU condition was observed using any images or other approaches from the app; however, one of the limitations of this study is that researchers did not observe every lesson. The Results section describes instruction in the BAU condition for each teacher.
Regardless of experimental condition, the teachers were instructed to spend no more than 20 min per day for 6 weeks engaged in activities for this study. The 20-min limit was agreed to by the participating teachers in part so as to not create a major detour from their regular curriculum. By holding the amount of instructional time and broad format of teaching constant, observed differences in student learning can be attributed to the type of instruction provided across the two conditions.
Pretest Measures
CORE vocabulary instrument
All students took two pretests prior to beginning the study. The first was the CORE Vocabulary Instrument (Diamond & Thorsnes, 2008), used to corroborate identification of potentially struggling students following evaluation of state testing data from the previous school year. The CORE instrument is group administered and is a quick probe teachers and researchers can use to obtain a snapshot of how well students know grade-appropriate words. The probe is untimed and has two equivalent forms for use at multiple time points. During the assessment, students are provided with a target word and three similar words; they choose one of the three related words that means the same or about the same as the target word. For example, if the target word is fling, then three related words might be accuse, demand, and throw. The student must circle the correct synonym (i.e., throw). The measure has 30 words per form.
Benchmarks for each grade are set as a guide for teachers to identify students at risk of difficulty in vocabulary. A score range of 0–14 indicates intensive supports may be needed, 15–22 means additional supports may be needed beyond core instruction, and 23–30 means the student is meeting benchmark expectations. Results from the administration of the CORE instrument prior to the experiment demonstrated 10% of participants scored 0–14, 24% scored 15–22, and 65% scored at benchmark (23–30). The mean score at pretest (n = 75) was 22.2, with a SD of 6.0. Individual scores for students with IEPs and those labeled as struggling on the CORE are included in Tables 1 and 2. Researchers calculated the reliability α at pretest to be .87.
Silverman and Hartranft (2015) note important limitations of this measure. First, students’ decoding capacity (or lack thereof) can prevent students from correctly identifying words they might actually know. Second, this measure only gives a unidimensional look at students’ understanding of each word. These limitations aside, this measure provided a standardized level of vocabulary performance we could evaluate across study conditions.
State fourth-grade reading assessment
At the time of the study, the state reading assessment was a standards-based assessment that converted raw score performance into scaled scores. A scaled score of 400 was needed to pass the assessment, and a score of 500 or above indicated an advanced level of performance. Cut scores for passing are determined each year, but at the time of the study, a raw score of 27 was needed to pass, and 36 was needed for advanced performance. As noted, 29 out of 75 participants in this study did not achieve a passing score, and only 9 (12%) scored at the advanced level.
Based on the state testing blueprint, the items on the fourth-grade reading assessment covered the following areas: (1) use of word analysis strategies and word reference materials (7 items), (2) comprehension of fictional texts (17 items), and (3) comprehension of nonfiction texts (16 items). This study was completed before the state assessment went to a computer adaptive testing format. Released items from the state assessment in the year before our study was conducted are available at: http://www.doe.virginia.gov/testing/sol/released_tests/2015/gr_4_reading_released_spring_2015.pdf. Given the relatively short duration of the experiment (see below), it did not make sense to examine performance data from the fifth-grade state reading assessment.
The specific standard and benchmark indicators for the first reporting category are that the students will expand vocabulary when reading by using (a) context to clarify meanings of unfamiliar words; (b) knowledge of roots, affixes, synonyms, antonyms, and homophones; (c) word-reference materials, including the glossary, dictionary, and thesaurus; and (d) vocabulary from other content areas (State Department of Education, 2010). These performance data from the previous school year are not perfect, given that approximately 5 months of additional student growth had happened in fifth grade, and, in some cases, delivery of individualized or intensified instruction occurred prior to the study commencing. Despite this, we are comfortable assigning proxy covariate status given our research questions.
The students with disabilities’ mean score for the fourth-grade reading assessment was 13.8 (SD = 8.2); on the vocabulary subtest, it was 1.8 (SD = 1.4). Students labeled as struggling based on the criteria described above had a mean score on the reading assessment of 17.2 (SD = 5.9) and an average score of 2.1 (SD = 1.5) on the vocabulary subtest. Finally, the mean score for students without an IEP or labeled as struggling for the reading assessment was 29.9 (SD = 3.5), and their mean score on the vocabulary subtest was 5.8 (SD = .84; see additional details in Tables 1 and 2).
Researcher-created vocabulary measures
To accompany the two standardized assessments, researchers designed a three-part assessment to measure student knowledge of the vocabulary terms taught within the experiment. This measure had three parts: multiple choice, sentence identification, and image identification. The three-part measure was given as a pretest to establish equivalence of groups prior to the study and also to establish that the terms being taught within the study were not already known. On the pretest version, 30 terms were randomly drawn from the full bank of 90 study terms. This measure was also used as the primary dependent variable to evaluate student learning each week of the study. On Friday of each week, students took the three-part measure, which only contained the 15 terms taught during that week. This allowed researchers to compare student performance on a week-to-week basis and tie to the mode of learning depending on whether they accessed the app or BAU instruction.
Multiple-choice items
The multiple-choice items were standardized in form; the stem was the term, followed by five answer choices (three distractors, the answer, and an “I don’t know” option). A sample question is provided in Figure 2. These items were scored either 1 or 0 for correct or incorrect answers; the possible score range was 0–30 on the pretest and 0–15 on each weekly quiz. The reliability α at pretest was .83.

Sample questions.
Sentence identification items
The second part asked students to put a check mark next to sentences where the word was used correctly. Incorrect sentences were expected to be left blank. Six sentences were provided for each term, with three correct sentences given. An example is provided in Figure 2. These sentences were different from any that were used in the app. Sentences were reviewed by a team of doctoral students at the first author’s university to ensure they were appropriate and accurate examples of the term. Researchers scored these items using a system to account for the identification of correct sentences and subtracting points for selection of an incorrect sentence. If all correct sentences were checked with no incorrect ones checked, a score of 3 was given. Other point amounts were possible depending on the combination of correct versus incorrect sentence choices. The possible score range was 0–90 on the pretest and 0–45 on weekly quizzes. The reliability α for this measure at pretest was .76.
Picture identification items
The final part of the pretest was a picture identification activity. The student was provided with six images (different from those used in the app) for each vocabulary term. The instructions were to circle each image that shows the term. Researchers printed out color copies of this measure for students. Three images were correct for each term. Images were reviewed by three doctoral students at the first author’s university to ensure accuracy and appropriateness in terms of matching the term’s meaning to the image. Images that were unclear or provided a tangential or abstract illustration of the term were discarded. An example is provided in Figure 2. Researchers used a similar scoring process as with the sentence identification section. The reliability α for this measure at pretest was .83.
Satisfaction Survey
Researchers created a short student satisfaction survey in an attempt to capture their thoughts about the InferCabulary app. All items were scored on a 5-point scale (1 = strongly disagree, 5 = strongly agree). Survey questions included the following: (1) The app helped me learn terms and definitions, (2) I liked learning vocabulary using the app, and (3) If given the opportunity, I would use the app on my own. The reliability α for this survey was .89.
Design
Because of the teachers’ intact classes, it was not possible to randomly assign students to conditions or use a traditional between-groups design. Therefore, we counterbalanced each of the 6 weeks, so one teacher was using the app and the other was not. The initial order of who used the app first was random, but the teachers simply alternated back and forth in the five following weeks. Each student had the opportunity to learn 90 total terms (45 using the app, 45 in the BAU condition). Researchers used a series of analyses of covariance (ANCOVAs) to evaluate differences among and between groups. The covariate used was performance on the CORE screener at pretest given that it is an established, standardized measure.
Results
Our counterbalanced research design permits evaluation of student data between groups (i.e., teachers using the app or BAU). For between-groups analyses, researchers treated students from Teacher 1 and students from Teacher 2 as separate groups and compared results at all six time points. We therefore have six between-groups replications on each measure (multiple choice, sentence ID, picture ID). In this section, we present data for students without an IEP or labeled as struggling (n = 44) and then separated out by students with IEPs (n = 11), and students labeled as struggling (n = 20). Levene’s test for equality of error variances was conducted for each analysis presented in this section.
Between-Groups Analyses—Students With Disabilities
All raw score data for the 11 students with IEPs for the three weekly dependent vocabulary measures are presented in Table 3. We provide our full data set to put readers in a position to transparently evaluate performance for individual students in and out of the app treatment compared to BAU instruction over time despite the small sample size. All effect sizes presented in Tables 4–6 should be interpreted with caution.
Raw Scores for Students With Disabilities on Six Weekly Probes; Comparisons of Mean Scores on Each Probe Between Groups Week to Week When Taught by Teacher Using the App or BAU (Vertical), and Comparisons of Mean Scores on Each Probe Within Individual Students Week to Week (Horizontal).

Note. W1 = Week 1, and so on. App = InferCabulary app; BAU = business as usual; MC = multiple-choice assessment/15 points; Sent = sentence identification assessment/45 points; Pict = picture identification assessment/45 points; LD = specific learning disability; ADHD = attention deficit/hyperactivity disorder; ASD = autism spectrum disorder; CD = communication disorder; IEPs = individualized education plans.
Descriptive Data for Multiple-Choice Instrument.
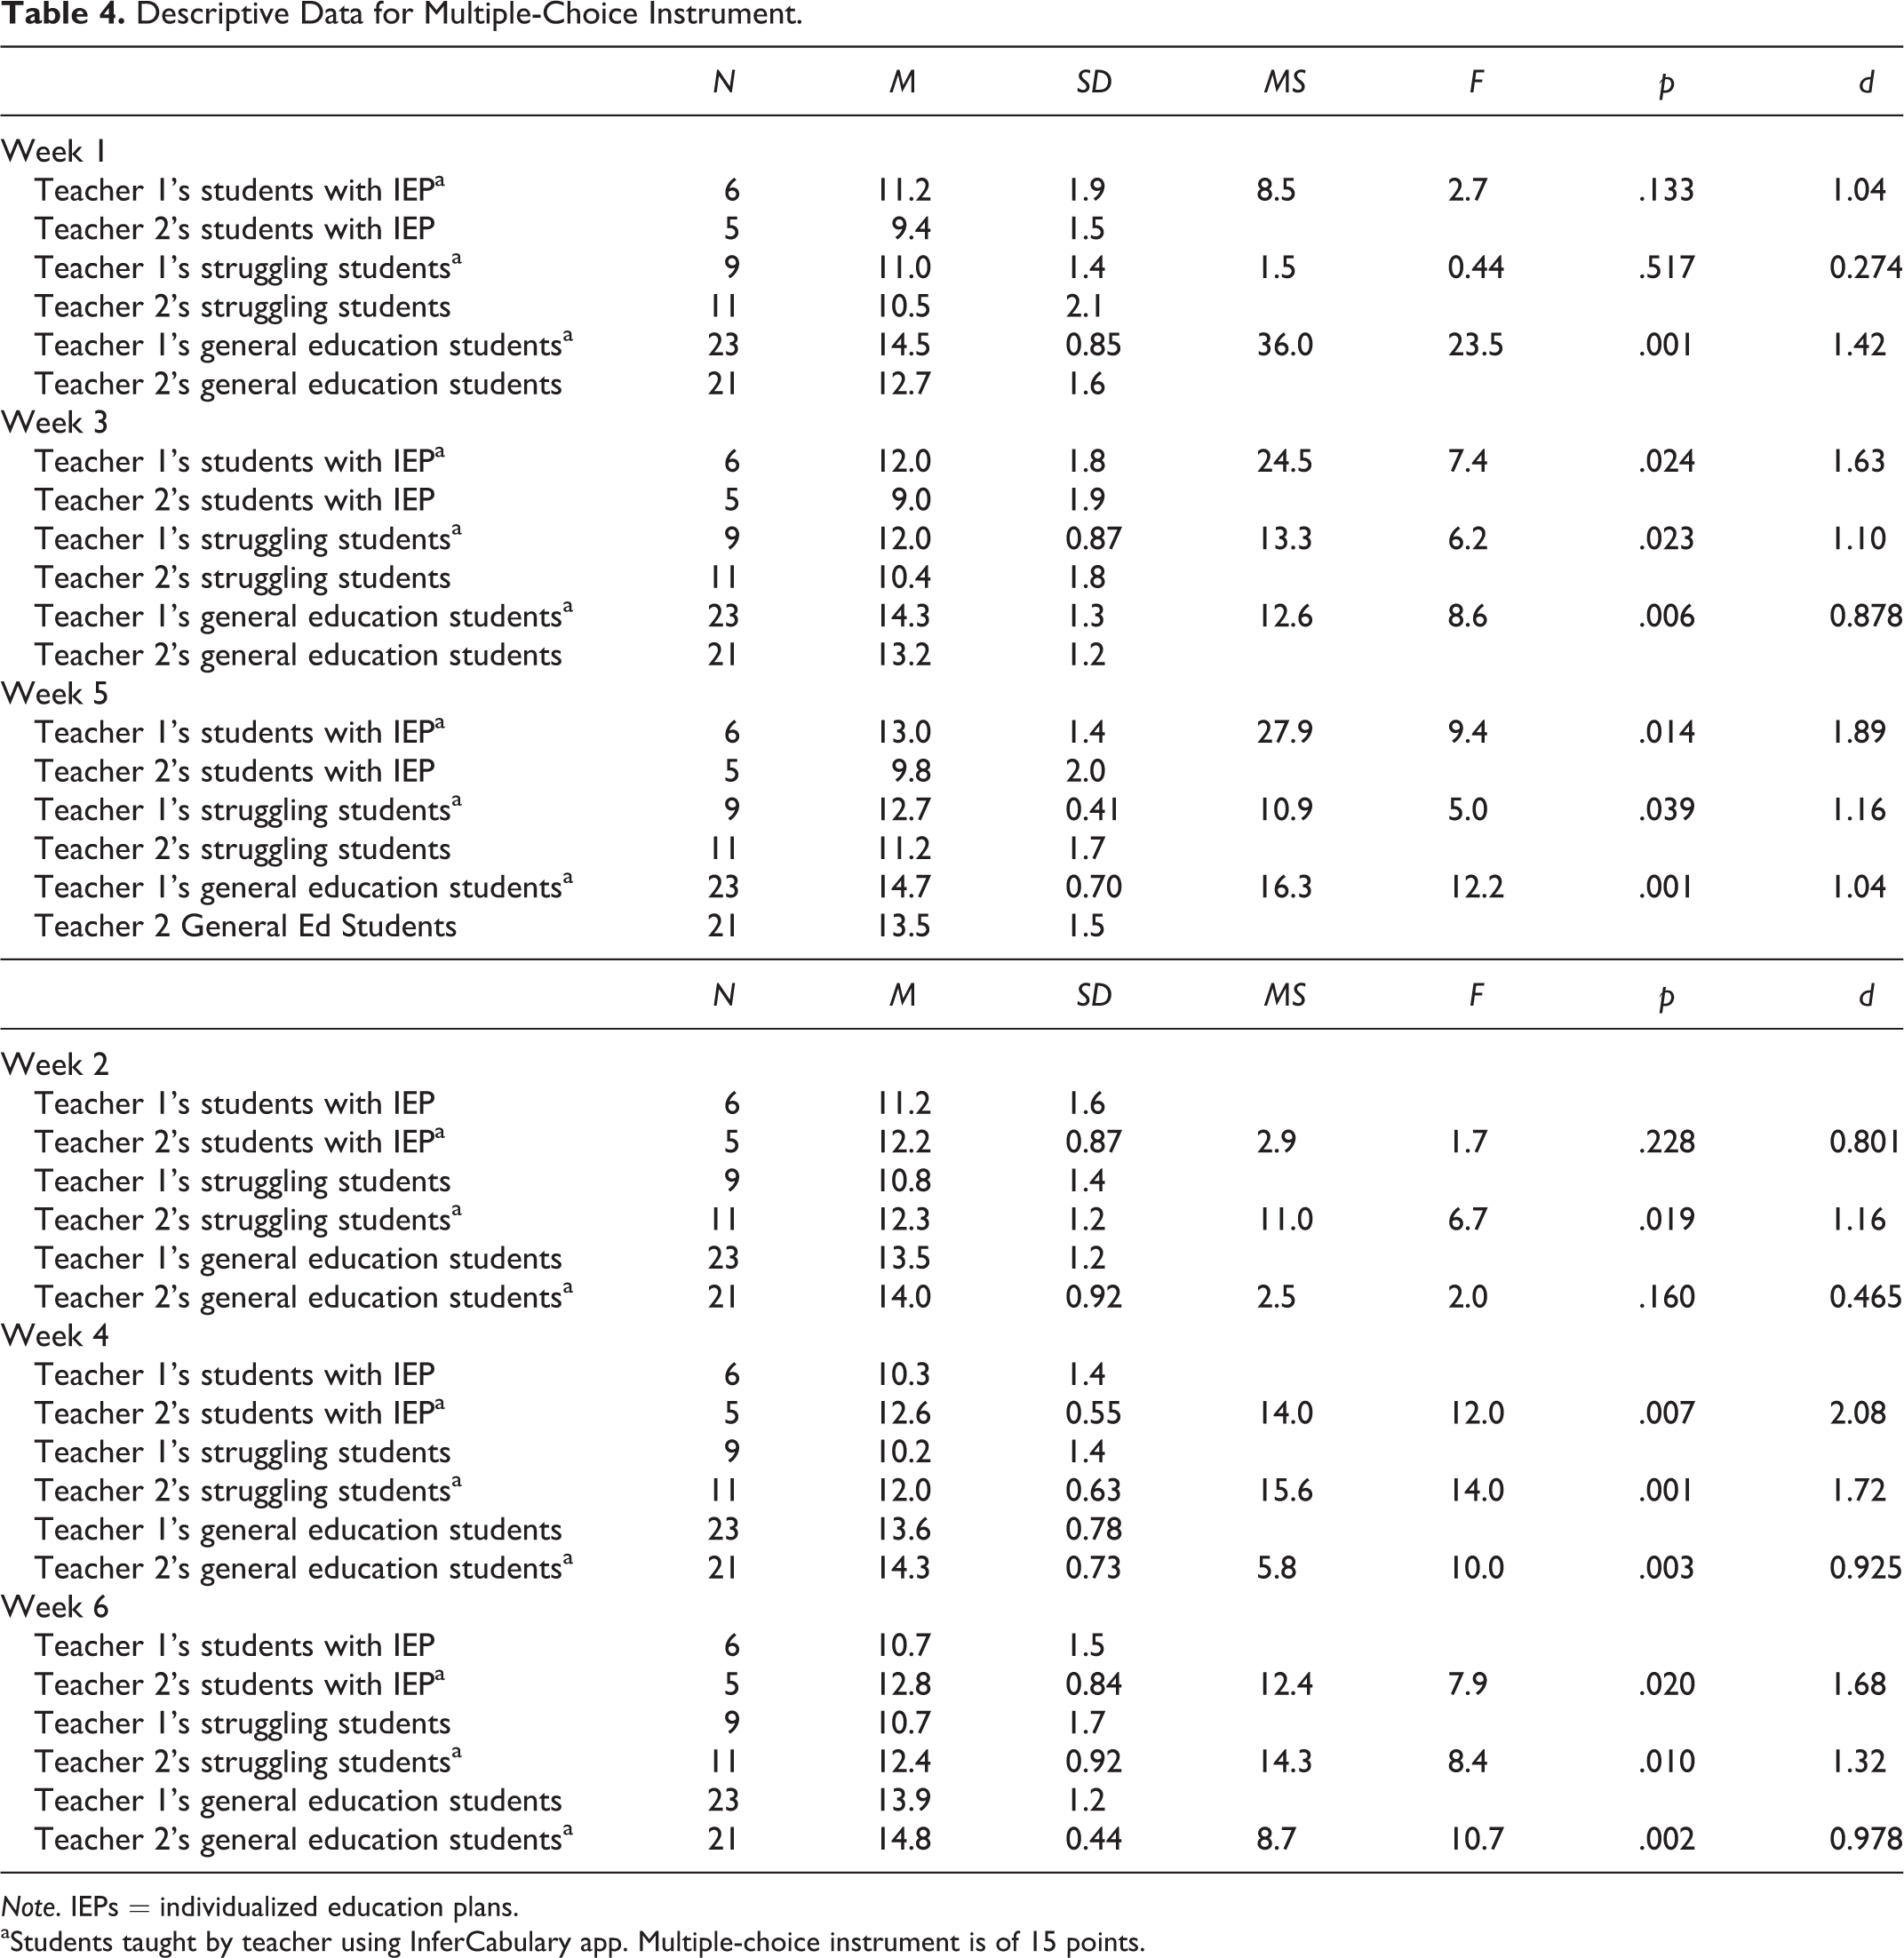
Note. IEPs = individualized education plans.
aStudents taught by teacher using InferCabulary app. Multiple-choice instrument is of 15 points.
Descriptive Data for Sentence Identification Instrument.
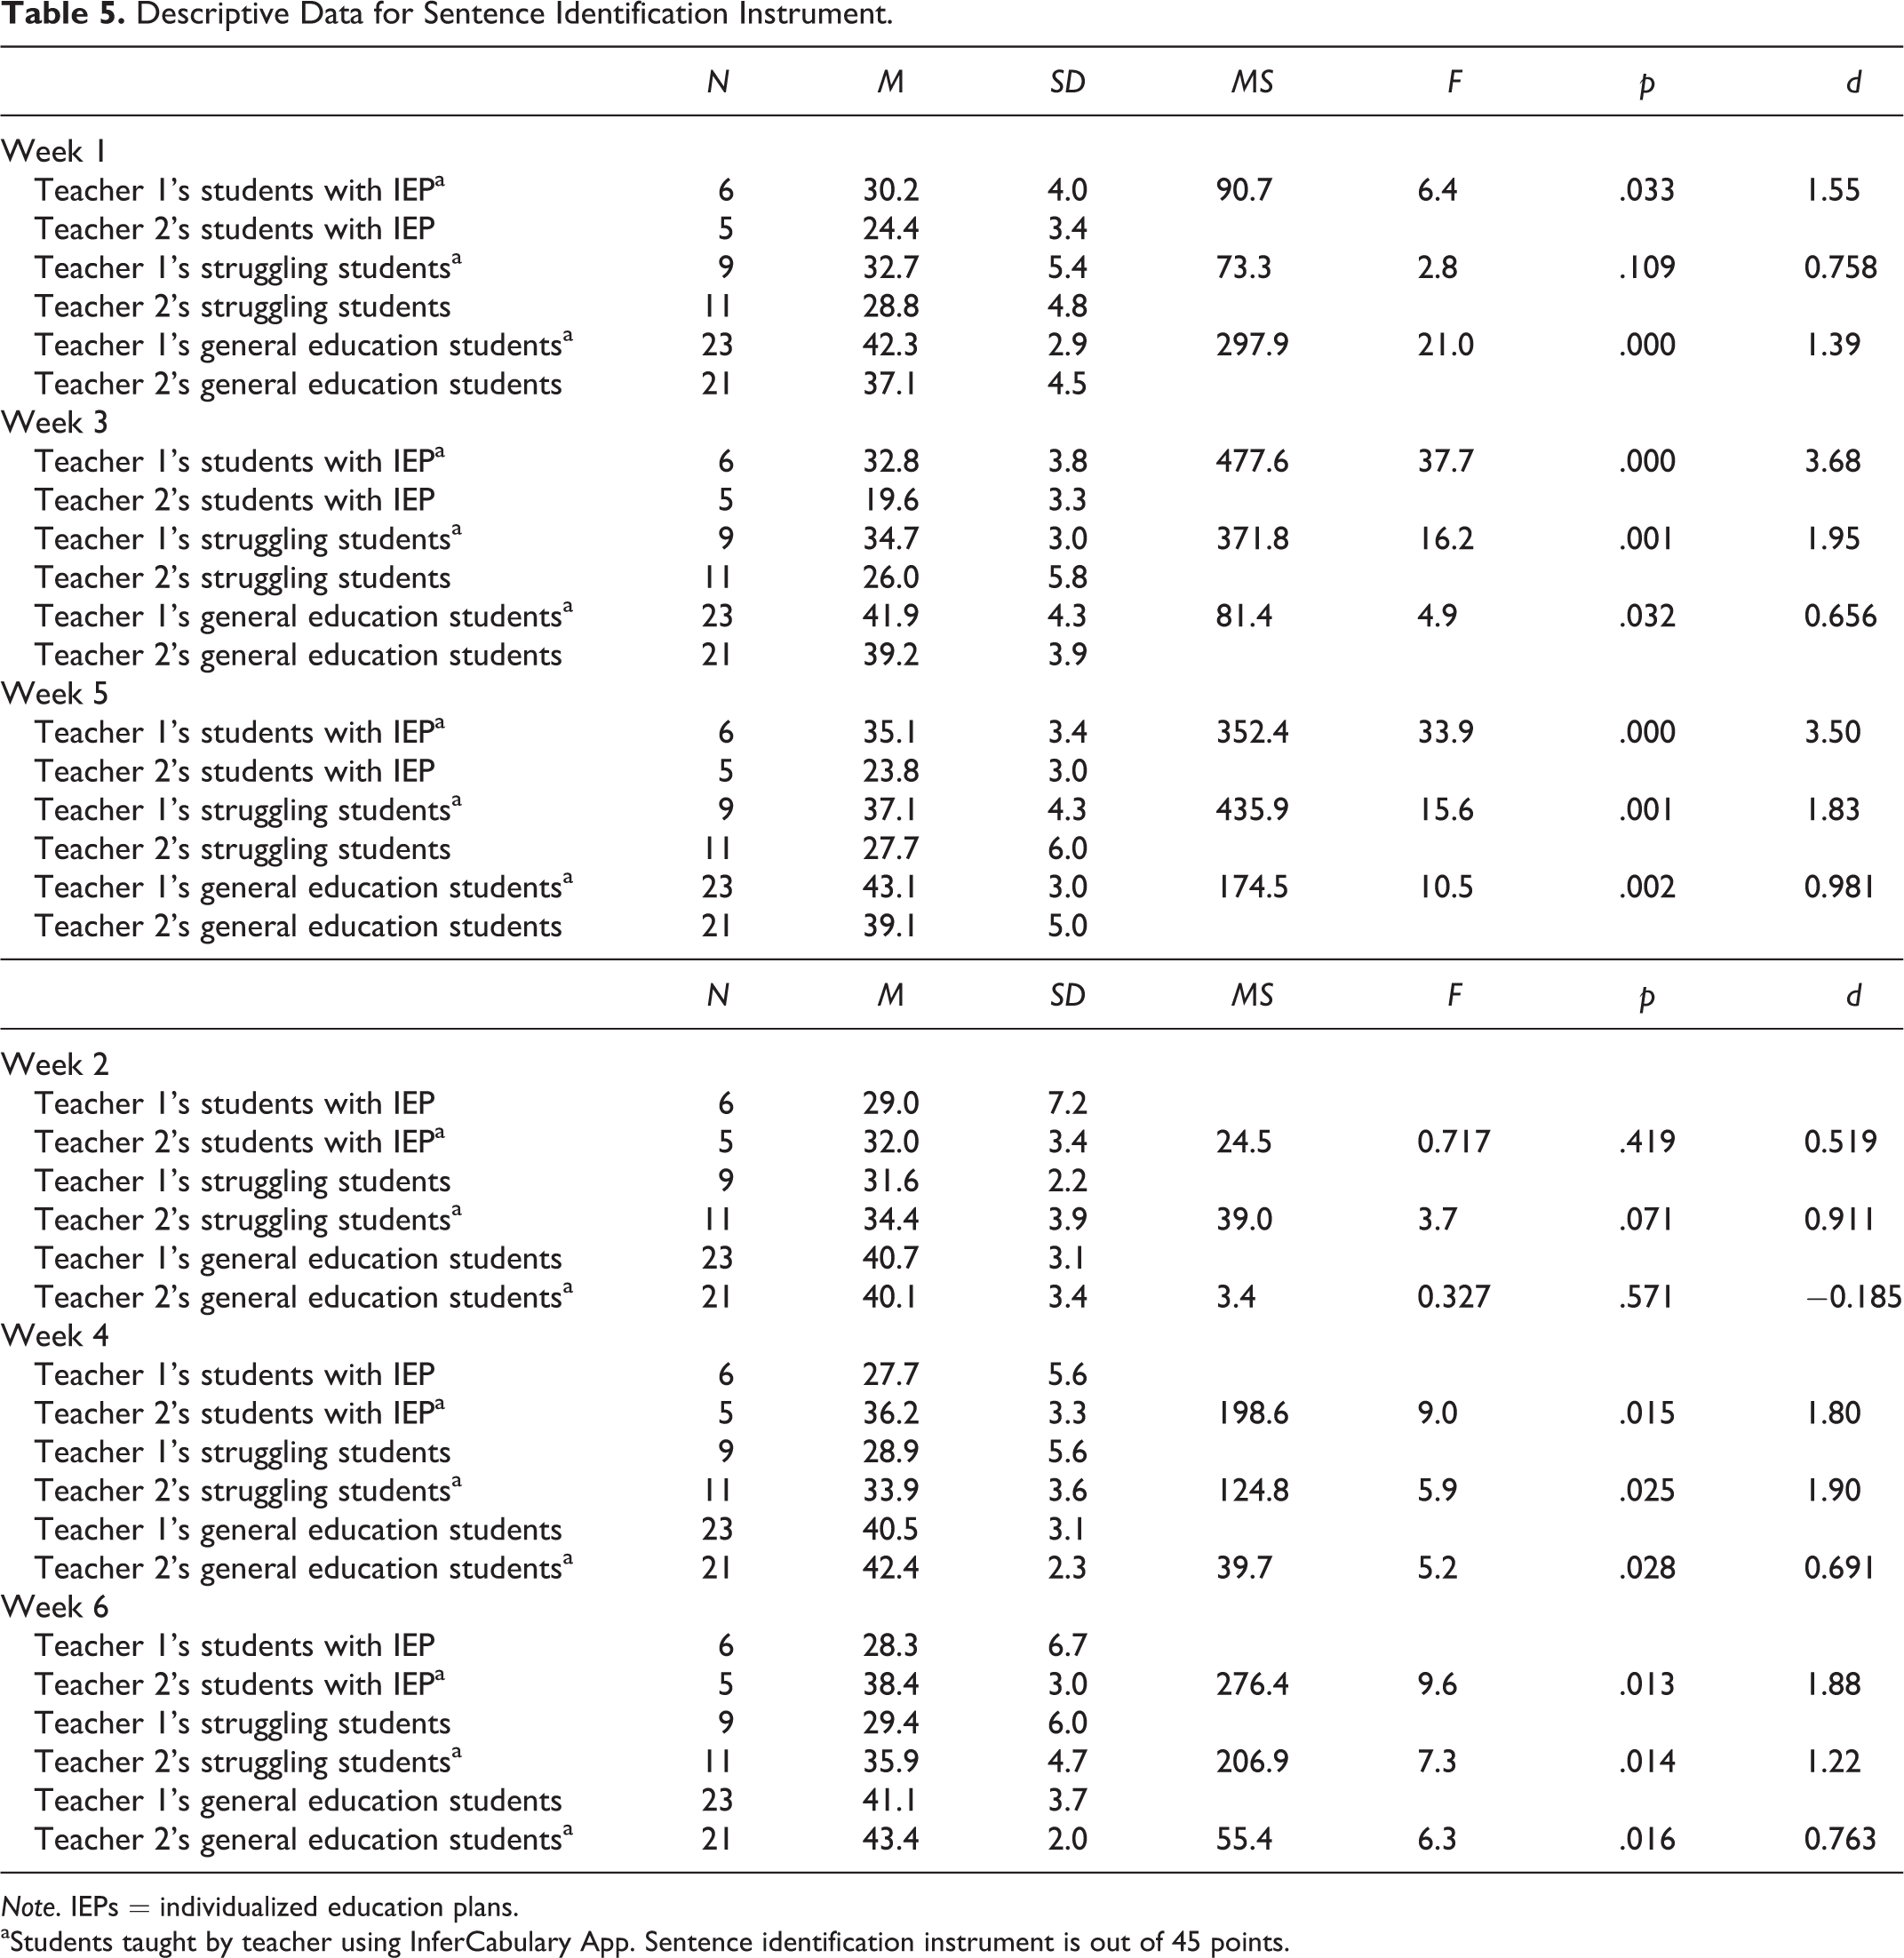
Note. IEPs = individualized education plans.
aStudents taught by teacher using InferCabulary App. Sentence identification instrument is out of 45 points.
Descriptive Data for Picture Identification Instrument.

Note. IEPs = individualized education plans.
aStudents taught by teacher using InferCabulary app. Picture identification instrument is of 45 points.
There were no significant differences between students with IEPs in Teacher 1 (n = 6, M = 17.2, SD = 7.2) and Teacher 2’s classes (n = 5, M = 16.2, SD = 3.8) on the CORE screening instrument, F(1, 9) = 0.07, p = .80, given before the study began. There were also no significant differences on the three components of the pretest between students in Teacher 1 and Teacher 2’s classes: multiple choice, F(1, 9) = 0.03, p = .87; sentence identification, F(1, 9) = 2.5, p = .15; and picture identification, F(1, 73) = 0.19, p = .67.
Multiple-choice measure
Students with IEPs taught by Teacher 1 had access to the app in Weeks 1, 3, and 5 of the study. Three one-way ANCOVAs were conducted to determine a statistically significant difference between app or BAU instruction on multiple-choice instrument performance, controlling for pretest performance on the CORE screening instrument. In Week 1, students with IEPs taught by Teacher 1 (n = 6, M = 11.2, SD = 1.9) did not score significantly higher than students taught by Teacher 2 (n = 5, M = 9.4, SD = 1.5) who used the BAU approach, F(1, 8) = 2.6, p = .145, d = 1.04. However, using the same ANCOVA model, students with IEPs in Teacher 1’s class did significantly outscore peers in Teacher 2’s class in Weeks 3, F(1, 8) = 8.1, p = .022, d = 1.63, and 5, F(1, 8) = 9.0, p = .017, d = 1.89. Full descriptive data for the group comparisons are available in Table 4. The CORE screener covariate was not a significant predictor of results in any of the ANCOVAs, and Levene’s statistic for homogeneity of variances was also not significant in any test.
Students with IEPs taught by Teacher 2 had access to the app in Weeks 2, 4, and 6. Researchers continued to use the same ANCOVA model as noted above. On the multiple-choice measure in Week 2, students with IEPs taught by Teacher 2 (n = 5, M = 12.2, SD = .87) did not score significantly higher than peers taught by Teacher 1 (n = 6, M = 11.2, SD = 1.6) who used the BAU approach, F(1, 8) = 2.7, p = .136, d = 0.801. However, the results were statistically significant in Weeks 4, F(1, 8) = 13.5, p = .006, d = 2.08, and 6, F(1, 8) = 7.9, p = .023, d = 1.68. Table 4 contains full descriptive data. Thus, for students with IEPs in both teacher’s classes, the same pattern of scoring higher when using the app emerged. The CORE screener covariate again was not a significant predictor of results in any of the ANCOVAs, and Levene’s statistic for homogeneity of variances was also not significant in any test.
Sentence identification measure
In Week 1, students with IEPs taught by Teacher 1 accessed the InferCabulary app. Using the same ANCOVA model described above, on the sentence identification measure (of 45 points), students taught by Teacher 1 (n = 6, M = 30.2, SD = 4.0) significantly outscored peers with IEPs taught by Teacher 2 (n = 5, M = 24.4, SD = 3.4) in the BAU condition, F(1, 8) = 5.7, p = .044, d = 1.55. This result was replicated at the end of Weeks 3, F(1, 8) = 52.4, p > .001, d = 3.68, and 5, F(1, 8) = 38.6, p > .001, d = 3.50. Full descriptive data are available in Table 5. The CORE screener covariate again was not a significant predictor of results in any of the ANCOVAs, and Levene’s statistic for homogeneity of variances was also not significant in any test.
In Week 2, students with IEPs taught by Teacher 2 accessed the InferCabulary app. On the sentence identification measure (of 45 points), students taught by Teacher 2 (n = 5, M = 32.0, SD = 3.4) did not significantly outscore peers taught by Teacher 1 (n = 6, M = 29.0, SD = 7.2) who used the BAU approach, F(1, 8) = 1.00, p = .347, d = 0.519. However, in Weeks 4, F(1, 8) = 12.1, p = .008, d = 1.80, and 6, F(1, 8) = 10.3, p = .013, d = 1.88, results were statistically significant. Full descriptive data for the analyses are available in Table 5. Again, a clear pattern of higher scores by students with IEPs on the sentence ID measure emerged across the study replications during weeks when the app was accessed. The CORE assessment covariate and Levene’s statistic were not significant.
Picture identification measure
In Week 1, students with IEPs taught by Teacher 1 accessed the app. Using the same ANCOVA model, on the picture identification measure (of 45 points), students taught by Teacher 1 (n = 6, M = 33.3, SD = 4.2) significantly outscored peers taught by Teacher 2 (n = 5, M = 26.4, SD = 3.4) in the BAU condition, F(1, 8) = 7.8, p = .023, d = 1.79. This result was replicated at the end of Weeks 3, F(1, 8) = 10.3, p = .012, d = 1.69, and 5, F(1, 8) = 25.2, p = .001, d = 3.07. Full descriptive data are available in Table 6. The CORE assessment covariate and Levene’s statistic were not significant.
In Week 2, students taught by Teacher 2 accessed the app. Using the same ANCOVA model, on the picture identification measure (of 45 points), students with IEPs taught by Teacher 2 (n = 5, M = 35.6, SD = 2.6) did not significantly outscore peers taught by Teacher 1 (n = 6, M = 28.7, SD = 6.8) in the BAU condition, F(1, 8) = 4.6, p = .065, d = 1.29. However, this result was reversed in Weeks 4, F(1, 8) = 15.4, p = .004, d = 2.18, and 6, F(1, 8) = 14.9, p = .005, d = 2.03. Full descriptive data are available in Table 6. For all three measures, and for nearly all students, scores were higher following weeks when they learned vocabulary terms using the app. The CORE assessment covariate and Levene’s statistic were not significant.
Between-Groups Analyses—Struggling Learners
All raw score data for the 20 students designated as struggling are presented in Table 7. We again provide our full data set to put readers in a position to transparently evaluate the performance for individual students in and out of the app treatment compared to BAU instruction over time despite the small sample size. There were no significant differences between struggling learners in Teacher 1 (n = 9, M = 16.2, SD = 5.2) and Teacher 2’s classes (n = 11, M = 16.7, SD = 5.4) on the CORE screening instrument, F(1, 18) = 0.045, p = .834, given before the study began. There were also no significant differences on the three components of the pretest between students in Teacher 1 and Teacher 2’s classes: multiple choice, F(1, 18) = 0.375, p = .548, sentence identification, F(1, 18) = 3.0, p = .098, and picture identification, F(1, 18) = 0.046, p = .833. Researchers continued to use ANCOVA with the CORE pretest score as a covariate in all analyses.
Raw Scores for Struggling Students on Six Weekly Probes; Comparisons of Mean Scores Between Groups Week to Week when Taught by Teacher Using the App or BAU (Vertical), and Comparisons of Mean Scores Within Individual Students Week to Week (Horizontal).

Note. W1 = Week 1, and so on. MC = multiple-choice assessment/15 points; Sent = sentence identification assessment/45 points; Pict = picture identification assessment/45 points.
Multiple-choice measure
Students designated as struggling taught by Teacher 1 had access to the app in Weeks 1, 3, and 5 of the study. On the 15-item multiple-choice measure in Week 1, students with IEPs taught by Teacher 1 (n = 9, M = 11.0, SD = 1.4) did not score significantly higher than students taught by Teacher 2 (n = 11, M = 10.5, SD = 2.1) who used a BAU approach, F(1, 17) = 0.723, p = .407, d = 0.274. However, students designated as struggling in Teacher 1’s class did significantly outscore peers in Teacher 2’s class in Weeks 3, F(1, 17) = 9.3, p = .007, d = 1.10, and 5, F(1, 17) = 7.2, p = .016, d = 1.16). Table 4 contains full descriptive data related to the analyses of variance (ANOVAs) for these students designated as struggling. For each of these ANCOVAs, the CORE pretest score was a significant predictor of performance, and Levene’s statistic for homogeneity of means was not significant.
Students designated as struggling taught by Teacher 2 had access to the app in Weeks 2, 4, and 6. On the multiple-choice measure in Week 2, students taught by Teacher 2 (n = 11, M = 12.3, SD = 1.2) scored significantly higher than peers taught by Teacher 1 (n = 9, M = 10.8, SD = 1.4) who used a BAU approach, F(1, 17) = 6.7, p = . 019, d = 1.16. The results were also statistically significant in Weeks 4, F(1, 17) = 13.5, p = .002, d = 1.72, and 6, F(1, 17) = 7.9, p = .012, d = 1.32. Table 4 contains full descriptive data. Most students designated as struggling joined their peers with disabilities in scoring higher on the multiple-choice measures following weeks using the app. In these tests, the CORE pretest screening score was not a significant predictor of performance, and Levene’s statistic was also not significant.
Sentence identification measure
In Week 1, students designated as struggling taught by Teacher 1 accessed the InferCabulary app. Using the same ANCOVA model as above, on the sentence identification measure (of 45 points), students taught by Teacher 1 (n = 9, M = 32.7, SD = 5.4) did not significantly outscore peers with IEPs taught by Teacher 2 (n = 11, M = 28.8, SD = 4.8) in the BAU condition, F(1, 17) = 2.8, p = .110, d = 0.758. However, the differences between the groups were significant after Weeks 3, F(1, 17) = 18.0, p = .001, d = 1.95, and 5, F(1, 17) = 22.9, p = .001, d = 1.83. Full descriptive data are available in Table 5. The CORE screener pretest covariate was significant for Week 5, but not Weeks 1 or 3. Levene’s statistic was not significant for any test.
In Week 2, students designated as struggling taught by Teacher 2 accessed the InferCabulary app. The same ANCOVA model was used; on the sentence identification measure (of 45 points), students taught by Teacher 2 (n = 11, M = 34.4, SD = 3.9) significantly outscored peers taught by Teacher 1 (n = 9, M = 31.6, SD = 2.2) who used a BAU approach, F(1, 17) = 4.5, p = .049, d = 0.911. The result was replicated in Weeks 4, F(1, 17) = 6.3, p = .023, d = 1.90, and 6, F(1, 17) = 7.4, p = .015, d = 1.22. Full descriptive data are available in Table 5. The CORE pretest screener score was a significant predictor of the sentence score in Week 2. Levene’s statistic was not significant in any week.
Picture identification measure
In Week 1, students designated as struggling taught by Teacher 1 accessed the app. On the picture identification measure (of 45 points), students taught by Teacher 1 (n = 9, M = 34.6, SD = 3.4) significantly outscored peers taught by Teacher 2 (n =11, M = 30.4, SD = 4.5) in the BAU condition, F(1, 17) = 5.1, p = .037, d = 1.04. This result was replicated at the end of Weeks 3, F(1, 17) = 12.4, p = .003, d = 1.53, and 5, F(1, 17) = 18.6, p = .001, d = 1.78. Full descriptive data related to the ANOVAs are available in Table 6.
In Week 2, students designated as struggling taught by Teacher 2 accessed the app. On the picture identification measure (of 45 points), students taught by Teacher 2 (n = 11, M = 36.4, SD = 5.3) significantly outscored peers taught by Teacher 1 (n = 9, M = 31.1, SD = 3.3) in the BAU condition, F(1, 17) = 6.7, p = .019, d = 1.17. This result was replicated in Weeks 4, F(1, 17) = 19.8, p = .001, d = 1.95, and 6, F(1, 17) = 17.1, p > .001, d = 1.92. Full descriptive data are available in Table 6. Again, a clear pattern of higher student scores emerged following weeks using the app for students designated as struggling. The CORE pretest was not significantly predictive of any results.
Between-Groups Analyses—Students Not Identified as Struggling or With an IEP
All analyses used one-way ANOVA to compare mean scores between groups. There were no significant differences between students not identified as struggling or with an IEP in Teacher 1 (n = 23, M = 26.2, SD = 1.9) and Teacher 2’s classes (n = 21, M = 26.2, SD = 1.4) on the CORE screening instrument, F(1, 42) = 0.016, p = .901, given before the study began. There were also no significant differences on the three components of the pretest between this subset of students in Teacher 1 and Teacher 2’s classes: multiple choice, F(1, 42) = 0.903, p = .347, sentence identification, F(1, 42) = 1.7, p = .199, and picture identification, F(1, 42) = 0.025, p = .874.
Multiple-choice measure
Students without IEPs and not labeled as struggling taught by Teacher 1 had access to the app in Weeks 1, 3, and 5 of the study. On the 15-item multiple-choice measure in Week 1, this subset of students taught by Teacher 1 (n = 23, M = 14.5, SD = .85) scored significantly higher than students taught by Teacher 2 (n = 21, M = 12.7, SD = 1.6) who used the BAU approach, F(1, 41) = 26.1, p = .001, d = 1.42. The results were replicated in Weeks 3, F(1, 41) = 10.1, p = .003, d = .878, and 5, F(1, 41) = 14.6, p > .001, d = 1.04. Table 4 contains full descriptive data for these students on the multiple-choice measure. The CORE pretest score was a significant predictor of the student score in each week.
This subset of students who were taught by Teacher 2 had access to the app in Weeks 2, 4, and 6. On the multiple-choice measure in Week 2, students taught by Teacher 2 (n = 21, M = 14.0, SD = .92) did not score significantly higher than peers taught by Teacher 1 (n = 23, M = 13.5, SD = .92) who used a BAU approach, F(1, 41) = 2.2, p = . 145, d = 0.465. However, the results were statistically significant in Weeks 4, F(1, 41) = 10.6, p = .002, d = 0.925, and 6, F(1, 41) = 11.0, p = .002, d = 0.978. Table 4 contains full descriptive data. The CORE pretest was significant for Weeks 2 and 4.
Sentence identification measure
In Week 1, this subset of students taught by Teacher 1 accessed the InferCabulary app. On the sentence identification measure (of 45 points), students taught by Teacher 1 (n = 23, M = 42.3, SD = 2.9) significantly outscored peers taught by Teacher 2 (n = 21, M = 37.1, SD = 4.5) in the BAU condition, F(1, 41) = 21.2, p = .001, d = 1.39. This result was replicated at the end of Weeks 3, F(1, 41) = 5.4, p = .026, d = 0.656, and 5, F(1, 41) = 11.6, p = .001, d = 0.981. Full descriptive data are available in Table 5. The CORE pretest only significantly predicted the final sentences score in Week 5.
In Week 2, this subset of students taught by Teacher 2 accessed the InferCabulary app. On the sentence identification measure (of 45 points), students taught by Teacher 2 (n = 23, M = 40.1, SD = 3.4) did not score statistically differently than those taught by Teacher 1 (n = 23, M = 40.7, SD = 3.1) using a BAU approach, F(1, 41) = 0.360, p = .552, d = −0.185. However, in Weeks 4, F(1, 41) = 5.1, p = .029, d = 0.691, and 6, F(1, 4.1) = 6.2, p = .017, d = 0.763, results were statistically significant. Full descriptive data are available in Table 5. The CORE pretest was not significant in any week.
Picture identification measure
In Week 1, this subset of students taught by Teacher 1 accessed the app. On the picture identification measure (of 45 points), students taught by Teacher 1 (n = 23, M = 42.7, SD = 2.3) significantly outscored peers taught by Teacher 2 (n = 21, M = 38.8, SD = 2.3) in the BAU condition, F(1, 41) = 18.7, p = .001, d = 1.26. This result was replicated at the end of Weeks 3, F(1, 4.1) = 7.0, p = .011, d = 0.76, and 5, F(1, 41) = 9.3, p = .004, d = 0.88. Full descriptive data are available in Table 6.
In Week 2, this subset of students taught by Teacher 2 accessed the app. On the picture identification measure (of 45 points), students taught by Teacher 2 (n = 21, M = 41.1, SD = 2.9) did not score differently than peers taught by Teacher 1 (n = 23, M = 40.0, SD = 4.0) using a BAU approach, F(1, 41) = 0.940, p = .338, d = 0.31. However, students taught by Teacher 2 did significantly outscore peers from Teacher 1 in Weeks 4, F(1, 41) = 10.8, p = .002, d = 1.00, and 6, F(1, 41) = 12.4, p > .001, d = 1.07). Full descriptive data are available in Table 6. Results therefore indicate nearly all students, regardless of disability or status as struggling scored higher on the various measures following weeks when they accessed the app. The CORE pretest was not a significant predictor for this set of tests.
CT Scan Descriptive Data
The researchers trained the teachers on how to use the InferCabulary app with fidelity based upon the provided lesson plan format. Two members of the research team observed each teacher once per week to document practices used within the BAU condition and the extent to which they used the app with fidelity to the lesson plan template. Adherence to the lesson plan was noted to be 100% by both observers for each classroom observation during the weeks the app was utilized. The structured nature of the app made it extremely easy for teachers to follow the format once they learned the routine.
Researchers also used the CT Scan (Kennedy, et al., 2017) once per week to observe the teacher in the BAU condition (three for Teacher 1, three for Teacher 2). Observations occurred on Monday, Tuesday, or Wednesday to allow a look at initial vocabulary instruction for the day’s terms. Researchers observed the full 20-min sequence for all six lessons for a total of approximately 120 min of BAU instruction. Although all lessons were double coded for reliability, data from the second scorer were lost stemming from a hard drive crash. At the time of the study, the CT Scan saved data output only to the user’s hard drive. While we are unfortunately unable to report specific interscorer agreements, anecdotally, no red flags were raised between the reviewers at the time of the study. Because of the small sample size, the data loss, and limited scope of this preliminary study, the following data from the CT Scan are not used in any statistical analyses. Future research will attempt to systematically link teacher practice to student outcomes.
Teacher 1
According to Observer 1’s data, Teacher 1 spent an average of 13.1 min per lesson (SD = 1.4), providing student-friendly definitions by writing the terms on the board and having students copy those definitions into notes. An average of 3.4 min (SD = 2.1) was spent highlighting examples of terms. Smaller amounts of time were spent asking students to state the definition and having discussions about terms. CT Scan data output showed a high degree of homogeneity for vocabulary lessons for Teacher 1 across the three BAU observations. In other words, she kept to the same routine in each lesson of providing a student-friendly definition (no images) and then noting an example before moving on to the next term. In Week 2, she asked students to respond to 20 questions; in Week 4, she asked 28; and in Week 6, she asked 18. This is compared to her asking 58 questions to students in Week 1 using the app, 82 in Week 3, and 95 in Week 5. While the number of questions asked by the teacher using the app compared to BAU was not an original research question, this descriptive finding is interesting. The questions teachers asked within the app condition were not entirely scripted but followed a pattern that was followed and could be extended by teachers.
Teacher 2
Teacher 2 was more diverse in terms of her approach to BAU vocabulary instruction. She did, on average, spend 5.3 min providing student-friendly definitions (SD = 1.6). However, she also had students apply their knowledge during each observation (average of 8.2 min, SD = 2.1) by asking students to work in groups to match definitions to terms and perform short skits, and relied upon demonstrations of terms, when feasible (average of 3.1 min, SD = 1.1). Teacher 2 asked 20 questions in Week 1 during her first BAU lesson, 20 in Week 3, and 25 in Week 5. When using the app, she asked 60 questions in Week 2, 60 in Week 4, and 62 in Week 6.
Satisfaction Survey
Following the final week of the study, researchers administered a brief satisfaction survey to students who participated in the project. Students were asked to rate the extent to which they agreed or disagreed with three statements about the app. The scale was a 5-point Likert-type scale (1 = strongly disagree, 5 = strongly agree). The prompts and results were as follows: (1) The app helped me learn terms and definitions (n = 75, M = 4.1, SD = 1.2), (2) I liked learning vocabulary using the app (n = 75, M = 4.2, SD = 1.1), and (3) If given the opportunity, I would use the app on my own (n = 75, M = 4.0, SD = 1.1).
Discussion
Results from this study are preliminary but potentially promising for the InferCabulary app and its capacity to support vocabulary learning of all students including those with IEPs and others labeled as struggling. The field needs high-quality options for supporting students’ vocabulary development. Although researchers have spent literal decades conducting research in this space, for a variety of reasons, students with disabilities and others who struggle continue to have problems with vocabulary. For one, teachers do not always implement evidence-based practices with fidelity or administer the correct dosage needed to move the needle on student learning (Klingner et al., 2010; Swanson et al., 2012). In other words, decades of research do not do much good when they are not deployed by practitioners on the front lines. Many general and special educators could benefit from refreshers on evidence-based vocabulary instruction and receive ongoing coaching including personalized feedback.
Another issue yet to be fully resolved by research or in practice is the sheer volume of terms students are expected to learn, which intersects with various cognitive learning impairments experienced by students with disabilities (Kesidou & Roseman, 2002). In many instances, words have multiple meanings, depending on context, which can confuse students. An example of this is the term revolution. Not only can revolution be defined differently in each context of social studies, science, literature, and mathematics, it can also have multiple meanings within a single content area, like in history (e.g., social revolutions, military revolutions). When added to the dozens of other terms that need to be learned within and across the school day, students can easily become overwhelmed.
The combination of weak instructional methods plus overwhelming volume of terms can cause substantial learning problems for students with disabilities and others who struggle. New thinking and planning is needed to support students’ unique needs, while simultaneously not shying away from the need to provide a high-quality, standards-based education. Multimedia is a seductive option to provide vocabulary instruction or practice in an efficient manner, but researchers and practitioners should insist upon a level of empirical evidence prior to adoption and deployment when teaching vulnerable students.
Summary and Analysis of Results
Students with IEPs
For students with IEPs, in both teacher’s classes, results illustrate an escalating trend across the their respective 3 weeks of app use on the multiple-choice, sentence ID, and picture ID measures. In other words, the mean score difference between the two groups went up from Week 1 to 3 to 5 for students with IEPs in Teacher 1’s class, and the same in Weeks 2, 4, and 6 for these students in Teacher 2’s class. In reviewing the raw data (see Table 3), it is clear most individual students with IEPs made within student gains from week to week on all three measures depending on their learning mode. All but two students with IEPs (9/11) had a net positive mean score for the three measures. Effect sizes are large based on these comparisons and should be interpreted with caution given the small sample size. However, it is clear based on the mean scores for individual students compared to themselves, and to peers in the opposite teacher’s class, that accessing the app plus explicit instruction did indeed result in higher scores on the various assessments.
Students designated as struggling
Students with IEPs from Teacher 2’s class had higher mean scores across all measures from the full 6-week study. This could be attributed to the type of vocabulary instruction observed using the CT Scan during weekly fidelity checks. Data from the CT Scan described above in the Results section do note Teacher 2’s use of more evidence-based practices than Teacher 1. This included more average time spent providing student-friendly definitions and having students apply their learning with various activities. However, these findings could be coincidental given the small sample size.
Results for students designated as struggling replicated the findings for students with IEPs. With individual exceptions, an examination of data in Table 7 illustrates higher mean scores across the 3 weeks for these students in weeks when they accessed the app compared to BAU instruction. Students in Teacher 2’s class also scored higher, on average, on all three measures across the 6 weeks of the study. This provides some confirmatory evidence noted above that the BAU instruction provided by Teacher 2 was in some way superior to Teacher 1. More research, however, should be conducted to further explore this potential finding.
Implications
The InferCabulary app is an example of a multimedia instructional tool teachers can pair with explicit instruction to help support students’ vocabulary needs. The novel approach of having students use their inferencing skills to evaluate images and corresponding phrases to figure out the meaning of terms before hearing the official definition, in this study, led to positive learning gains. This app can also be used independently by students. Although researchers did not evaluate that mode, it is reasonable to expect positive gains. Further research of multiple modes using this tool is warranted.
The results of this study, although preliminary, have potentially promising indications. First, use of the app combined with explicit instruction was more effective than BAU in almost all weeks for almost all groups. The intervention was designed using principles of effective instruction for students with disabilities, but it was also effective for struggling students and general education students, making it a potentially interesting choice for instruction in a co-taught or inclusive classroom. Additionally, the effect sizes in most cases increased from week to week, indicating that with practice and increasing comfort with the app, students improved their vocabulary understanding over time. The primary assessments used in this study were researcher-generated, proximal measures, which is a limitation; future studies need to determine whether the effects would be noticeable on a more distal measure. It is possible results are attributable to the close connection of the intervention and dependent measures. However, the assessments were designed to assess a robust understanding of the vocabulary words, not simply identification of the words’ definitions. To do well on the assessments, students needed to demonstrate flexibility of thinking and the ability to deeply process the nuances of words, which is essential for vocabulary knowledge to impact other processes such as reading comprehension (McKeown, Crosson, Moore, & Beck, 2018).
Future Research
Future studies should add a third treatment group that received “best practice,” which could include explicit instruction, but then not access to the InferCabulary app. Adding this treatment group would allow researchers to determine the extent to which variability is being contributed independently by explicit instruction or the app. Finally, future research should add more dependent measures to determine why explicit instruction plus the InferCabulary app led to better student vocabulary performance. For example, measures of student motivation and/or engagement could tell a powerful story about why the intervention group outperformed peers.
Limitations
These results should be viewed in light of some important limitations. First, this study examined the short-term effects of a vocabulary intervention. Each week, students learned 15 terms in 3 days, reviewed on Thursday, and completed the three dependent measures on Friday. Short-duration interventions often have larger effects than long-term interventions, particularly when using researcher-created instruments. Researchers were not able to examine the long-term maintenance of vocabulary knowledge. The second main limitation was the lack of random assignment. We attempted to maximize the research design to allow for a replication of each analysis (Weeks 1, 3, and 5 and Weeks 2, 4, and 6). This research design, however, did not overcome the lack of experimental assignment to groups.
A small number of students nested within two teachers’ intact classes participated in the study. Specifically, only 11 with IEPs, and 20 identified as struggling were enrolled in the participating teachers’ classes. With these small numbers, it is difficult to fully interpret results from a statistical standpoint, although the presentation of raw data in Tables 3 and 7 across each replication helps alleviate some concern about credibility of findings. Future research with larger numbers of students should be conducted.
Another limitation is students with IEPs and students designated as struggling received instruction using the app or BAU without any specific accommodations or modifications. This included extended time and multiple repetitions in small groups. This decision was a practical one for researchers (having already asked teachers to shoehorn the study activities into their crowded school day), but it is possible results would have been different if students had more time and trials to learn terms. That being said, students with IEPs and those designated as struggling did outperform their peers when using the app and did outscore themselves from week to week when in and out of the treatment.
Footnotes
Appendix
Declaration of Conflicting Interests
The author(s) declared no potential conflicts of interest with respect to the research, authorship, and/or publication of this article.
Funding
The author(s) received no financial support for the research, authorship, and/or publication of this article.
