
Abstract
While technology-based interventions enhance instruction and improve outcomes for students with disabilities, implementing and integrating technology in authentic learning environments continues to be a challenge. Based on the experiences of a variety of Stepping-Up Technology Implementation projects funded by the U.S. Department of Education, Office of Special Education Programs, this mixed-methods study explored the essential factors for the successful implementation of technology-based interventions in K-12 schools and early childhood programs. Based on the qualitative analysis of projects’ implementation reports and responses to the follow-up questionnaire, four major themes emerged. The barriers and facilitators to technology implementation were reported across such areas as (a) developing and sustaining buy-in, (b) ensuring implementation fidelity to support the intervention, (c) research-to-practice dilemmas, and (d) data serving multiple purposes. The discussion and practical implications for supporting technology implementation are provided.
Technological innovations have revolutionized special education and created new possibilities for students with disabilities by supporting their unique needs (Edyburn, 2013; Kennedy & Boyle, 2017). When implemented with fidelity, educational technology enhance instruction and improve outcomes for students with disabilities (Israel, 2019; McLeskey et al., 2017). The teachers of these students should be equipped to select, implement, and monitor use of the technology tools, although teacher education programs in the U.S. vary widely in terms of preparing savvy consumers of educational technology (Rock et al., 2017). While there has been an explosion in the development of evidence-based technological innovations in recent years with the majority of K-12 classrooms in the U.S. using digital age technologies every day, the challenge researchers continue to face is translating their research into everyday practice (Kennedy & Boyle, 2017). Even with laws requiring the provision of assistive technologies to students with disabilities in the U.S. (Individuals with Disabilities Education Act, 2004) and efforts to decrease disparities in access to educational technology across contexts (Every Student Succeeds Act of 2015, 2015), differences in the availability and accessibility of educational technology tools in U.S. schools and elsewhere around the world persist (Gallup, 2019; Ong, 2020). Further hindering implementation and sustained use of evidence-based educational technology in the classroom is the complexity of technology itself including the technology’s relevance to the target environment, knowledge and skills of the user implementing the technology, and available resources and organizational structure to support training and coaching (Cook & Odom, 2013). One approach to address the challenges of implementing and integrating technology in authentic learning environments is implementation science, which is the study of methods to promote the uptake of EBPs into real-world contexts (Eccles & Mittman, 2006).
Literature Review
Many models of implementation science exist to facilitate the effective adoption of EBPs. Fixsen and colleagues from the National Implementation Research Network (NIRN) developed a series of Active Implementation Frameworks that apply to implementing and integrating EBPs, including educational technologies, in authentic learning environments and then scaling-up and sustaining these practices and technologies in multiple sites (Fixsen et al., 2009). The model consists of four implementation stages and multiple implementation drivers organized into three categories (Bertram et al., 2015; Blasé & Fixsen, 2013). The four stages of implementation describe a comprehensive non-linear process that requires a few years of trial and error before finding a sustainable fit for new innovations (Fixsen et al., 2009). The stages include: 1. Exploration—investigating a fit between innovation and setting; identify resources needed to implement it. 2. Installation—preparing to start the innovation (develop protocols, confirm resources). 3. Initial implementation—launching innovation. This is a period of learning and growth as it requires rapid problem solving and reassessment of tools and strategies. The procedures are refined, and the iterative process of implementation, feedback, and change happens. 4. Full implementation—fully integrating innovation into classroom and school district settings. In this stage, fidelity and outcomes are measured to continue improving the impact of the innovation in practice (Bertram et al., 2015).
Embedded within the NIRN Active Implementation Frameworks are implementation drivers used to integrate and sustain innovations over time. A discussion of the implementation drivers occurs throughout the implementation stages, where they are selected, planned for, installed, refined, and sustained along with the innovation itself (Fixsen et al., 2009). The three main categories of implementation drivers include (a) competency, (b) organization, and (c) leadership (Blasé & Fixsen, 2013). Specifically, competency drivers include selecting, training, and coaching staff who deliver the technology-based program. First, the team must be selected with the required skills and abilities to serve the program’s needs. Next, the team receives training to learn when, how, and with whom to use these new skills. Finally, coaching strategies are put into place to increase mastery, while fidelity assessments ensure consistent and appropriate implementation of the innovative practices (Fixsen et al., 2013).
The organizational drivers include decision support data systems, facilitative administration supports, and systems interventions. As described by Fixsen et al. (2009), decision support data systems include collecting accurate and reliable data to inform decisions at the student, teacher, and staff level to implement the innovations. Facilitative administrative supports seek to identify challenges, develop clear communication, and reduce administrative barriers for the technology program. Systems interventions are strategies used by the organization to ensure alignment with external systems not under the administration’s control (e.g., local, district, state priorities, and regulations; Fixsen et al., 2009). Lastly, leadership drivers include technical and adaptive strategies. The goal of leadership drivers is to establish reliable management for productive output of intervention strategies. The leadership driver refers to a core group of people in the organization to continue running effective programs while adapting to new circumstances. These leaders utilize “adaptive drivers” when they support an organization through changing procedures and philosophies. They are the “champions” that create and maintain buy-in throughout the implementation stages. Leaders apply technical strategies to focus on the necessary details and specific activities for adopting a new technology-based practice or program (Fixsen et al., 2013).
Technology Implementation and Integration—Scaling-Up
Scaling-up innovations, especially technology ones, is generally difficult in educational settings (Dede et al., 2005). While technology innovations have the potential to improve learning outcomes for students across ages and abilities, simply providing access to technology does not ensure its use or the realization of potential outcomes (Grunwald & Associates, 2010). Instead, technology must be aligned with the goals and practices of the systems where it is being implemented (ISTE, 2021; Perlman & Redding, 2011). Two significant challenges of this successful technology implementation and integration are that technologies are often difficult to scale in contexts where they were not developed, and researchers and developers often have little incentive to scale their solutions prior to broad dissemination (Looi & Teh, 2015b). Despite these challenges, educational and technology innovations have been scaled successfully (Looi & Teh, 2015a); however, no single approach or formula has emerged as the impetus for these successes (Pang et al., 2015). Instead, general practices that support successful scaling vary a great deal and typically include attention to various dimensions including depth, sustainability, spread, shift (Coburn, 2003) and evolution (Clarke & Dede, 2009) as the technologies and interventions are implemented locally (Means & Penuel, 2005).
Stepping-Up Technology Implementation Funding Program
This study explores the experiences of a variety of Stepping-Up Technology Implementation projects funded by the U.S. Department of Education in the Office of Special Education Programs (OSEP). This project first started in 2012, supporting 35 projects by the time of the study. The overarching purpose of all projects is to implement and integrate educational technology, with a strong evidence base, in early childhood programs and K-12 classroom settings. The innovative technology is meant to engage, motivate, and benefit learners with disabilities as well as to improve teaching pedagogy. All projects work directly with educators, students, and families by providing coaching and professional development (PD) to understand and use the technologies. The target users are expected to be ready to integrate the technology tools in their practices. Projects are required to test the implementation of their technology as well as provide supporting materials and products in three development, four pilot, and 10 dissemination sites. This enables the technologies to be scaled-up and sustained across multiple settings, while documenting the impact on educators’ use and learners’ outcomes.
Across the 35 individual projects located at Institutes of Higher Education (IHE) and research institutes, the technologies are being implemented to support learners with disabilities in a wide array of areas: literacy (n = 11), science/math (n = 8), behavior management and social skills (n = 5), college/career readiness (n = 3), PD for in-service trainers (n = 3), teacher coaching (n = 2), early childhood (n = 1), progress monitoring (n = 1), and student engagement/dropout prevention (n = 1). B, At the time of the study, the projects have disseminated technology across 350 sites in 37 States and the District of Columbia. They supported over 457 K-12 school sites and early childhood programs (e.g., public, private, charter, alternative, and vocational); improved outcomes for over 36,301 students, including more than 10,150 students with disabilities, 26,145 students in general education and 130 English Language Learners; as well as supported over 3745 educators, 540 parents, and 40 early childhood providers.
Study Purpose and Research Questions
The purpose of this study was to identify factors essential for the successful implementation of technology-supported interventions in K-12 schools and early childhood programs serving children with or at-risk for disabilities. It also aimed to characterize common challenges and solutions to conducting implementation research in authentic education settings.
Method
A sequential exploratory mixed-methods design was used in this study (Creswell & Plank Clark, 2017). Both quantitative and qualitative data were rigorously collected and analyzed to explore the implementation of technologies in authentic settings. The initial qualitative data collection and analysis was followed by the quantitative phase. Then, the data from each phase were mixed to corroborate the overall findings.
Participating Projects
Stepping-Up Technology Implementation projects that had been funded by OSEP at least 1 year prior to the study were invited to participate. Twenty-six projects had received at least 1 year of funding and submitted at least one annual report by the beginning of this study. All 26 project Principal Investigators (PIs) consented to participate. They represented 15 IHEs and 2 research institutes. Of those projects, 70% implemented technology with students in K-12 settings (n = 4 in elementary grades; n = 8 in secondary school; and n = 6 across grades); 27% focused on educators (n = 7); and 3% was based in the early childhood setting (n = 1). The innovative technology-based interventions implemented with learners supported literacy (28%), science/math (22%), college/career readiness (16%); behavior management and social skills (11%), literacy and assessment for students with complex needs (11%), progress monitoring (6%), and student engagement/dropout prevention (6%). Learners supported by technology included students with learning disabilities, emotional disturbance and behavior disorders, other health impairments, autism, deaf/hard of hearing, visual impairments, students with significant disabilities, complex communication needs, and speech impairments, English language learners as well as students at risk for school failure and infants/toddlers with or at-risk for disabilities.
The majority of the projects (57%) have used the National Implementation Research Network (Blasé & Fixsen, 2013) to guide their technology implementation project. Among other implementation models, the following were reported: • Practical, Robust Implementation and Sustainability Model (PRISM) (Feldstein & Glasgow, 2008) • RE-AIM Framework (Glasgow et al., 1999) • Dynamic Sustainability Framework (Chambers et al., 2013) • The Consolidated Framework for Implementation Research (Damschroder et al., 2009) • Others; for example, Knowledge-to-Action Framework (Graham et al., 2006); adaptation of the Knoster Model (Knoster, 1991)
Based on the most frequently used Blasé and Fixsen (2013) implementation model, 30% of projects (n = 7) were in the exploration stage, 19% (n = 5) were in the installation stage, 12% (n = 3) were in the initial implementation, and 42% (n = 11) were in the full implementation.
Qualitative Phase
This study began with a phase of collecting and analyzing qualitative data.
Data Sources
The primary data sources for this study were the implementation narrative reports submitted by the project research teams. At the end of each implementation year, all Stepping-Up projects prepared and submitted a descriptive “story” of the technology implementation process. Projects were given a template including guided questions around how the evidence and experiences were used as part of the iterative process to develop and scale-up the successful implementation of the technology tools and products. Qualitative and rich descriptions were requested. These reports were used as a running record for both documenting and reflecting on the key decision points, critical events, and important influences guiding the technology implementation. The templates were tailored to align with different implementation stages: exploration (submitted after year 1), exploration and installation (submitted after year 2), installation and initial implementation (submitted after year 3), and implementation (submitted after year 4). Year 1 templates focused primarily on working with sites (e.g., selecting sites, gathering information about sites, preparation work with sites, profes professional development for the implementation team, developing products to support technology delivery, influencing factors). In addition to all the similar guiding questions around working with sites, Years 2–4 templates had additional sections focused on the supports provided to the users (e.g., coaching, PD, materials, and products), implementation of technology, refinement plans, and plans for measuring outcomes.
Data Organization
After obtaining all the necessary permissions from the Institutional Review Board and receiving consent from the 26 eligible projects, the annual implementation “stories” were collected and analyzed. These reports were on average 35.6 pages long (SD = 32.02), ranging between 6 and 26 pages for Year 1: Exploration reports; 13–49 pages for Year 2: Exploration and Installation reports; 12–27 pages for Year 3: Installation and Initial Implementation reports; and 25–122 pages for Year 4: Implementation reports.
In order to minimize bias, the “stories” were first disaggregated according to the implementation drivers or key components necessary for the successful implementation and sustainability of the innovation (Blasé & Fixsen, 2013). The first two authors read each report and assigned a tag to each text block including: (1) selection and recruitment; (2) training (prior to the implementation); (3) coaching (during the implementation); (4) fidelity of implementation; (5) decision support data systems (usability data); (6) facilitative administration (internal policies and regulations on sites that can be controlled); (7) systems intervention (external policies and structures outside of control); (8) leadership; (9) description of the tool (including accessibility); and (10) sustainability plans. The two researchers reviewed all tagging and discussed those cases where tagging was unclear. After that, a graduate research assistant copied and pasted all text blocks into separate documents representing the aforementioned drivers. While all project identifying information was removed, the text within each driver was organized according to the implementation stage in an effort to explore possible patterns based on the stage.
Data Analysis and Credibility
After the “stories” were disaggregated and de-identified, 10 documents representing implementation drivers were shared with the full research team. The content within each driver was then analyzed in researcher dyads using thematic analysis (Braun & Clark, 2006; Guest et al., 2012). First, each document was read and re-read while looking for patterns. Text, organized by driver, was analyzed using open coding and compared across implementation stages to develop categories. The categories were color coded throughout the document and were later merged into three to four core themes within each driver. These thematic descriptions from each of the data sets were then provided to the second author for axial coding in order to link the themes across all of the data. This included an initial compilation of 38 themes. Observing some redundancies, connections, and subcategories across these themes, 31 of these themes were then sorted under six overarching themes. The second author conducted a virtual peer review with the researcher dyads, as needed. Finally, the matrix of themes was virtually shared with the research team for feedback and to ensure that the themes captured the meaning of the data accurately and that the themes were integrated in a systematic way. Following researcher triangulation, the team established four overarching themes. In order to establish credibility and trustworthiness of findings, peer reviews were used to examine all open and axial coding. Specifically, the researchers reviewed and commented on each other’s emerging codes using a shared platform (i.e., Google Docs). During research meetings, the debriefing and general discussions about categories and themes occurred. In addition, the data were triangulated across different projects, implementation stages, and data sources. Specifically, a matrix included themes, subthemes, and examples from multiple reports and questionnaires combining multiple perspectives on the same phenomenon. Finally, the follow-up questionnaire was used for member checking.
Quantitative Phase: Data Collection and Analysis
In order to triangulate the qualitative findings in this study, a follow-up questionnaire was developed by the research team. The first several questions asked projects to rate how much emphasis each project placed on innovation and sustainability of their technology. Then the four overarching themes from the qualitative analysis of implementation reports were presented. Projects were asked to agree/disagree using a five-point Likert-scale on how much they could relate to each theme as well as provide additional examples. Specifically, projects were asked to rate the following statements: • Our project experienced many competing initiatives in our implementation settings and had to be creative in “selling” our technology-based intervention. • Our project effectively monitored and worked to improve users’ knowledge of the intervention after training (e.g., through coaching and/or other ways). • There were instances when the fidelity of implementation was low at our sites. • In our project, we differentiated between usability testing studies (e.g., observing the technology being used by target user groups) and outcome studies (e.g., evaluating the impact of the technology intervention package on target skills and understandings).
If any of these statements were rated as 4 or 5 (agree or strongly agree), the projects were prompted to provide descriptive examples for (a) ways to better “sell” the technology-based intervention in order to improve users’ outcomes; (b) strategies to monitor and/or improve users’ knowledge after training; (c) action steps (if any) taken during the study with low fidelity of implementation as well as changes incorporated before subsequent stages of the project to improve fidelity, and (d) examples of how projects tested the usability and quality of technology by itself versus the impact of the technology intervention on user outcomes.
The questionnaire was developed by the first author and reviewed by the research team representing the experts in the field of technology implementation. The questionnaire was designed to take about 15–20 minutes to complete. One questionnaire per project was completed either by the project lead or by the person preparing the annual implementation report. Overall, 23 out of 26 projects provided complete responses resulting in the 88% response rate. The responses to the Likert-scale questions were analyzed using frequencies and descriptive statistics. The responses to the open-ended questions were analyzed using a similar thematic analysis described earlier, where all the similar responses were grouped into categories and themes (Braun & Clark, 2006; Guest et al., 2012). The researchers were asked to review and comment on all the responses and emerging themes to ensure interrater reliability.
Results
Qualitative Phase
The qualitative analysis across all project reports was conducted to identify how the implementation and integration of technology happens in authentic learning environments. The data revealed common patterns across the reports regardless of each projects’ stage of implementation. Especially pronounced were the barriers and facilitators to the implementation of technology integration. Four themes regarding the implementation and integration of technology are reported: Developing and Sustaining Buy-In, Ensuring Implementation Fidelity to Support the Intervention, Research-to-Practice Dilemma, and Data Serving Multiple Purposes (see Figure 1). Important considerations for implementation and integration of technology.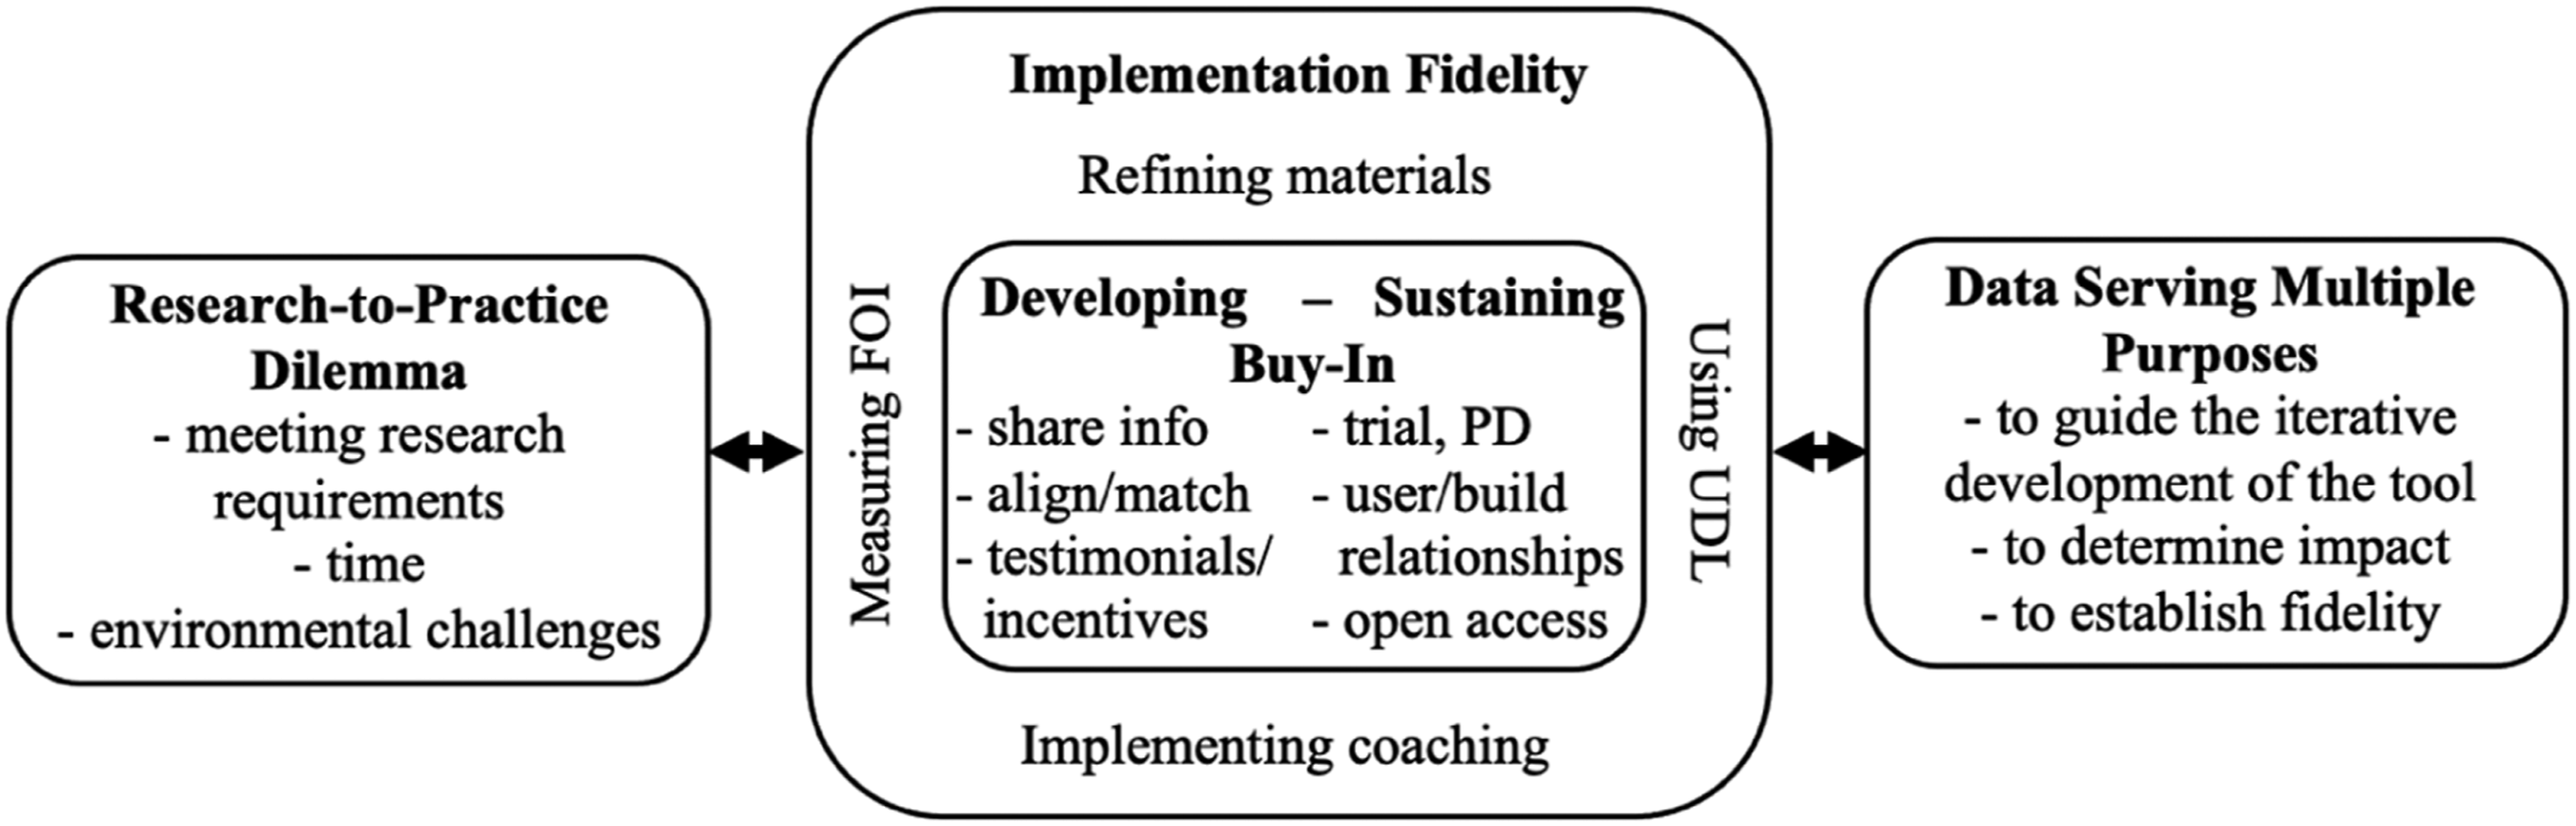
Developing and Sustaining Buy-In
The first theme characterizing the 26 project reports focuses on how projects navigate introductions of an innovative technology at the school and/or district level as well as how to maintain use of the technology.
When the intervention was not closely aligned with the targeted curricula, the competing initiatives were a challenge to implement. For example, several projects reported that a consistent barrier to buy-in was a lack of time to commit to the use of the intervention and/or the PD required for successful implementation of the intervention as intended. Sometimes the school/district partners had the foresight to this dilemma prior to the onset of training, whereas others discovered that scheduling sufficient time was a substantial barrier after they began training and initial implementation. Projects also stated that school leadership largely influenced teacher behavior and, in turn, student outcomes. For example, as one project noted, “when there was authentic buy-in from a school director, there seemed to be greater teacher interest and commitment to following through on a PD and coaching program.” A school’s culture and organizational “health seems to be an important factor in the implementation and sustainability.”
In order to increase buy-in more directly, project personnel provided testimonials, narratives of positive case studies, and offered incentives. Examples of incentives included stipends and gifts for participants, substitute teacher costs, purchase of resources related to the intervention, family engagement events, as well as “offering wait-listed comparison options” for control sites. Another part of the buy-in process was for the projects to clearly understand the users’ needs and allow flexibility in addressing those needs. Some projects directly observed implementation to better understand current practice, while most project personnel utilized a readiness assessment (e.g., surveys and/or interviews of school staff) to efficiently “match” the intervention with the needs of the implementation site. Continuous improvement of the validity of the readiness assessment was reported to be essential to the process. Readiness instruments allowed projects to determine the users’ philosophical beliefs, pre-requisite skills, technical capacities, school(s) or district(s) needs, and to ensure that the process of selection was mutual between the project and the participants.
A lack of compatibility between the district’s technology infrastructure and the intervention’s platform or operating system was reported across projects as a key barrier. For example, an Android-based intervention could not be implemented in a school district that used iOS devices exclusively. Also, some projects reported that sites had non-negotiable technology policies that conflicted with the delivery of the intervention. For example, sites may have had limited capacity of the platforms and/or filters which blocked access to the intervention.
In the absence of having a prior relationship with the implementation sites, project reports indicated that an efficient, consistent, and flexible research implementation team was needed to establish positive relationships within the school culture and with the teachers. For example, a research team supporting implementation of a writing intervention reported, “At the building level, a needs assessment was necessary to determine how teachers perceived writing, how they went about facilitating writing instruction, how they provided feedback in the writing process, and how they assisted struggling learners with more direct and specific instruction”. Another team reported that meeting teachers and administrators at the school rather than over the phone or at their campus offices “helped them feel comfortable to ask any and all questions they might have”. Project reports also described ways they fostered the beneficial partnership. Foremost, the reports highlighted the collaborative efforts between the user and project personnel to integrate the technology effectively and support the fidelity of implementation as well as the sustainability of implementation after the project “ends”. For example, data from the reports described professional learning communities (PLCs) or groups of users and project personnel having regular meetings in order to support implementation and engage in a cycle of feedback. In addition, project reports recognized leaders of and members of the instructional technology departments at school sites as key facilitators to implementation.
Finally, reports identified that sustainability was largely conceptualized by school and district partners as having ongoing access and use of the technology-based intervention when project personnel would no longer be available. Creating open-access materials under creative commons license for non-commercial use, relying on “barebones” ready-to-use solutions, and making all or part of the technology available at no cost are just some examples of how projects ensured ongoing access to their interventions.
Ensuring Implementation Fidelity to Support the Intervention
The second theme characterizing the data addresses how implementation fidelity was achieved across the projects. Before use and during the integration of the technology products at sites, project personnel provided ways to ensure fidelity of implementation. Those included the ongoing refinement of materials, use of coaching models, and an emphasis on structural fidelity.
As an illustration of UDL application, one project reported relying on “videos with captions and transcripts, a glossary, visual supports such as tables and images, review sheets, checklists, and hands on explorations.” These represent all three guidelines under multiple means of representation: provide options for perception (e.g., captioned videos), for language and symbols (e.g., glossary), for comprehension (e.g., visual supports). Several projects also used a combination of formats to deliver those materials: facilitated, self-paced, individualized, face-to-face, online, and blended (representation—options for comprehension). Sometimes, the users needed the materials delivered with a higher frequency or duration (engagement—sustaining effort and persistence), while other projects created different content to “fit” the users’ needs and ability to respond (action/expression—options for expression and communication). The malleability of the materials and the flexibility in the delivery and use of the materials was a consistent thread across all project reports at every stage of implementation.
Coaching Features Reported Across Projects.
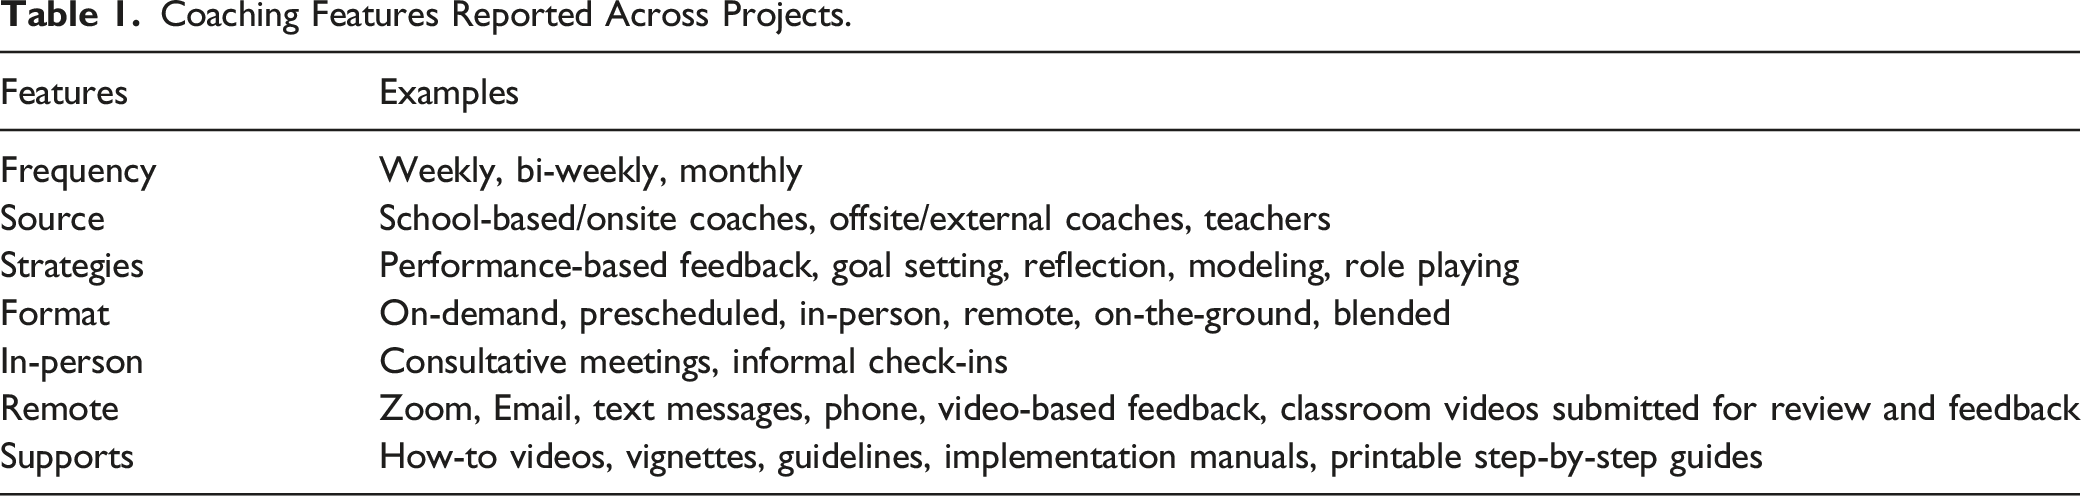
As a result of coaching, project personnel reported that they were able to identify barriers and facilitators to implementation in order to make adjustments and improve student outcomes. What was not largely represented in the data was how projects determined which coaching strategy to use and/or the dose of coaching needed. Reports included in the analysis suggest that measures of structural fidelity of implementation were used to determine coaching needs.
Research-to-Practice Dilemma
The third theme that emerged from the data reinforces a persistent and familiar barrier of translating research and development to practice. The research-to-practice barrier was apparent across all stages of implementation. Dilemmas on the research into practice paths that were identified by the projects included the balance of meeting research requirements while still being responsive to the practical needs of the site, time, and environmental challenges.
Data Serving Multiple Purposes
Finally, the types of data and the varying utility of data were prominent across all project reports. There were several sources of qualitative and quantitative data that research projects gathered in their work. Generally, these included process data (e.g., usage log data, user clicks, number of downloads), student outcome data (pre-post test data, progress monitoring data), teacher outcome data (e.g., teacher beliefs, self-efficacy), user perceptions, and fidelity data. These data served multiple purposes related to (a) guiding the iterative development of the tool, (b) determining the impact on student learning, and (c) establishing FOI.
The documentation and subsequent analysis of 26 implementation reports helped us deepen our understanding of what happens throughout the implementation of varied technologies for students with disabilities. These findings were corroborated and further explained by the quantitative results described next.
Quantitative Phase
Based on the responses from 23 out of 26 projects, there were the following averaged agreements with the overarching themes, based on a five-point Likert-scale: • Our project experienced many competing initiatives in our implementation settings and had to be creative in “selling” our technology-based intervention—3.5 (SD = 1.24). • Our project effectively monitored and worked to improve users’ knowledge of the intervention after training (e.g., through coaching and/or other ways)—4.52 (SD = 0.73). • There were instances when the fidelity of implementation was low—3.96 (SD = 1.02). • In our project, we differentiated between usability testing studies (e.g., observing the technology being used by target users) and outcome studies (e.g., evaluating the impact of the technology intervention package on target skills)—4.35 (SD = 0.83).
In addition to these ratings, a qualitative analysis of open-ended follow-up questions expanded our understanding of each theme. Based on the responses from 16 projects (62%), the ways to better “sell” the technology intervention focused on (a) aligning the tool with federal, state, district, and school-based education policies, standards and initiatives, (b) demonstrating how the technology can improve everyday practices and result in superior outcomes, and (c) relying on user testimonials. Flexibility of technology as well as ensuring that the target users have the sufficient background knowledge to implement the tool were reported as important elements for initial and sustained buy-in. Often “selling” had to go beyond the tool. As one project described, “We needed to help schools understand the commitments needed when adopting our technology, as it also meant adopting a practice, which in turn could be seen as something to compete with existing or other initiatives.”
Based on the responses from 22 projects (85%), some strategies to monitor and/or improve users’ knowledge after training included (a) virtual coaching and regular site visits and/or meetings, (b) building a community of practice, (c) remotely monitoring technology’s use and sending reminders, and (d) developing checklists and forms to accompany tutorials and guide implementation. These continuous check-ins were very important. As one project summarized, “Of course, “all” the content had been addressed in some way during the initial training, but we found teachers did not really “hear” it until they “needed to”...until they saw something work (or not work) in THEIR classroom.”
In an effort to improve the FOI, suggestions from 17 projects (65%) have been organized in the following action steps: (a) collect data on the FOI with immediate feedback and coaching, (b) develop comprehensive instruments with clear explanations and ample examples or teacher anecdotes, (c) disseminate regular emails and/or newsletters with tips, tricks, and direct links to project resources, (d) demonstrate the results of previous studies showing improved learning outcomes when implementing intervention with fidelity, (e) assess readiness and communicate clear expectations prior to providing access to technology, as well as (f) individualize technical assistance when needed.
Finally, based on the responses from 21 projects (81%), many have purposefully tested the usability and quality of technology by itself separate from testing the impact of the technology intervention package on user outcomes. Different types of data collected to inform the successful technology implementation included: (a) usability data (e.g., ease of use, interface) through focus groups, observations, and review of user logs, (b) pre-post outcome data (e.g., specific to the target skill), (c) implementation data (e.g., dosage, fidelity), and (d) sustainability data (e.g., surveys). While some projects tested technology usability prior to the implementation across dissemination sites, others continued to test usability throughout the duration of the project. In some cases, the satisfaction rating scale was built-into the technology to continuously receive feedback from users. All projects’ suggestions were organized into a compilation of practical implications for scaling-up technology implementation. They are presented below.
Discussion
This study represents experiences of 26 Stepping-Up Technology Implementation projects funded by OSEP that first began in 2012. All projects were charged with scaling-up the implementation of innovative, evidence-based technology-driven education interventions for special education students and teachers, from early childhood through high school. They were guided by implementation science models in order to translate these EBPs into an authentic classroom environment. The goal of this study was to identify factors that facilitated and challenged the implementation of these large-scale technology-based education interventions among projects with a similar mission but differing audiences and implementation needs. A mixed-methods research design was utilized in the collection and analysis of this study data.
Various implementation science models guided the work of the participating projects; however, for this study, project teams shared qualitative and quantitative data related to how their project could be viewed from the lens of the National Implementation Research Network (NIRN). This model consists of four main implementation stages and implementation drivers, yet the themes that emerged in this study were equally represented across all stages of implementation (Bertram et al., 2015; Fixsen et al., 2009). The four most salient thematic factors that impacted the implementation efforts across 26 projects included a) developing and sustaining partner buy-in; b) ensuring implementation fidelity to support the intervention; c) navigating the research-to-practice continuum; and 4) utilizing data to guide the iterative development, the fidelity, and the impact of the education technology.
First and foremost, finding the alignment or fit between the education technology and the implementation setting to develop buy-in was vital. Similar to previous research, many projects commented on how initial and ongoing buy-in from partner sites was influenced by how well their tool fit with the goals and values of the implementation site (Perlman & Redding, 2011). This was often driven by state initiatives, internal organization or district priorities already set in place at the school locations. Consistent with the NIRN framework, during the exploration stage, the intervention delivery team and school team must determine if the proposed intervention is of most need to the teacher or student population at the current given time (Bertram et al., 2015). Findings from this study revealed that if intervention delivery teams could make the case for and cultivate, a mutually beneficial partnership, then a strong foundation could be set for sustained adoption of the new technology.
Findings also revealed that teams used implementation drivers such as continuous data collection to refine materials and technology, strong leadership in the schools, in-service coaching and communities of practice for teachers, and fidelity processes in order to sustain buy-in. These essential implementation drivers were useful to support teams' continued integration of the education technology at the school sites. Indeed, previous research that found that strategies to ensure sustainability are critical to bring technology innovations to scale (Clarke & Dede, 2009; Pang et al., 2015). In practice, the use of these implementation drivers can be used to help sustain forward momentum, even when energy wanes during the middle of the academic year, or implementation plan, and various priorities are vying for attention.
Integrating technology-based education interventions from an implementation science perspective takes particular navigation skills and processes to ensure fidelity of implementation. Findings from this study found that beyond cultivating buy-in for the technology intervention itself, project teams encountered challenges with ensuring proper implementation of EBPs. The intention of implementation science allows for the adaptation to site and population specific needs; yet, the ongoing question is how much adaptation is allowed before the integrity of the evidence-based practice is misaligned (Ogden & Fixsen, 2014). To ensure effective delivery of technology innovations, fidelity of implementation should move beyond adherence and dosage, and include measures to assess participant responsiveness, program differentiation, and quality of delivery (Vroom et al., 2020).
Research-to-practice challenges (i.e., needs of the site, time, and environmental barriers) in technology adoption were apparent across all stages of implementation. These research-to-practice dilemmas are consistent with other studies that found that implementing evidence-based programs in authentic settings comes with distinct challenges (Cook & Odom, 2013; Looi & Teh, 2015b). Many factors have an impact on this research-to-practice process - population and organizational culture, socioeconomic factors, leadership and staff capacity, competency and turn-over are some (Ogden & Fixsen, 2014). To bridge the gap from research to practice, implementation teams should consider lessons learned from implementation science and identify change agents to adopt, implement, and maintain EBPs (Cook & Odom, 2013).
One of the most salient themes among projects in this study was the use of data for implementation, specifically for measuring fidelity of the program itself, the use of the technology, and educator or student outcomes. The findings from this study make the case for designing and delivering evidence-based interventions with fidelity within an implementation science framework so that program and participant outcomes show greater improvements (Durlak, 2015; Vroom et al., 2020). These components (fidelity, technology use, and student outcomes) must be measured in order to make a difference during implementation (Vroom et al., 2020). Coming back to the NIRN implementation science framework, decision support data systems is an implementation driver to strengthen the implementation of evidence-based programs; however, it requires having structures in place to collect, analyze and use the data for such purposes, in a timely and functional manner. If data are collected, yet not available to inform decisions in crucial moments of program implementation, then, the value of measuring fidelity becomes less applicable (Bertram et al., 2015; Harn et al., 2013).
Practical Implications
As noted, across the 26 projects who participated in this study, themes from the implementation drivers were derived as well as provided recommendations for researchers and practitioners. Findings have definite implications for future research and practice.
A frequently identified challenge for Stepping-Up Technology Implementation projects was the recruitment of sites and technology users. Researchers should do their “homework” in advance of finalizing a commitment with potential sites. Obtaining information about school structures including competing or coordinating initiatives, policies, school organization, outside influences (e.g., state, district, and parents) before and throughout implementation is crucial in order to avoid potential barriers. Additionally, it is important to clearly provide sites with information about both time commitments and tasks necessary for technology implementation. Suggestions to set the stage for success and implementation with fidelity included both obtaining and communicating clear information within each building prior to startup. Do users have time to implement the intervention and participate in other activities (e.g., PD)? Are there any competing initiatives? Does the intervention closely align with goals, initiatives, as well as curriculum at the site? Do users meet all the necessary pre-requisite requirements? These questions can be answered by collecting data via surveys, readiness assessments, or interviews from administrators, educators, support personnel, students and parents, if applicable. Over-recruitment and early recruitment should be considered. More in-depth discussions, often face-to-face, are useful following the initial recruitment and may include technology demonstrations, testimonials, and clear communication of goals and commitments.
The balance between the interest from the users around the innovation and the readiness requirements that make up the core components required to implement the technology is important. If sites who desire to use the intervention cannot sustain a required technology (e.g., hardware and supporting infrastructure such as internet reliability, bandwidth, and in-school IT support), the implementation becomes incredibly challenging for all, practitioners and researchers alike. Sustainability of a technology-based intervention should be at the core of making a decision about implementation. Developing the technology compatible with the school infrastructure or selecting an intervention that is adaptable/compatible across platforms may be a solution here. This will allow for sustainability of technology from research to practice.
The implementation of technology-based intervention with fidelity requires additional supports such as training, coaching, protocols, instruments, videos, and other “just-in-time” resources. Both researchers and practitioners should consider opportunities for peer-to-peer support and/or PLCs. The findings in this study presented above offer numerous recommendations on how to improve technology integration, which all corroborate that it is not enough to just provide access to technology (Israel, 2019). Continuous measurements of both FOI and impact on learner outcomes using various data sources are essential for successful technology integration in both research and practice.
Limitations
The breadth of interventions and target populations represented in this analysis is a strength of this report, but it can also be a limitation because it may be difficult to apply the lessons learned to a specific intervention and/or student population. For example, the implementation challenges encountered by developers of a web application designed to provide direct intervention supports to high school students’ transition to post-secondary education are likely much different than the challenges faced by developers of an application to support infant-toddler service providers’ screening and intervention decision-making for young children with disabilities. The relatively small sample size and the heterogeneity of the target populations and content areas represented by these projects prevented us from exploring relationships between implementation barriers and facilitators, and target populations or content areas.
As described in the Research-to-Practice Dilemma theme, research personnel often provided implementation support that would not be available at the conclusion of the project, which can limit sustainability. However, research activities unrelated to technology integration might and did reportedly interfere with implementation, preventing exploration of implementation science under truly authentic conditions. These activities included obtaining consents or assents, conducting classroom observations, administering standardized and other assessments with students to measure intervention effects, collecting data from educators, etc. In addition, the prospect of being involved in a research project might also interfere with recruitment. While schools/districts are interested in using EBPs, few are willing to take on the added burden of engaging in research activities simply for the sake of advancing science. Financial burden was unlikely an implementation barrier, since all projects made their technology tools and interventions available at no charge to schools or districts and often provided financial incentives in an attempt to offset the burden of engaging in research activities. However, without data on the number of schools that had the opportunity to participate versus those that agreed and achieved full implementation, it is impossible to make valid claims about the effect of research activities and incentives on implementation of EBPs. Finally, the reliability of the implementation information reported for each project is unknown because it is self-reported by project PIs and it was provided in a narrative format rather than any observable data.
Future Research
This study provides a unique look at the challenges and facilitators for developing and evaluating implementation support for evidence-based technology interventions. Because these findings were primarily based on self-reported data and qualitative analyses, additional work is needed to validate the themes that emerged from the project reports. For example, using common measures of implementation based on student and educator data (e.g., collected using common metrics or technology logs) across projects would provide a more precise and reliable method of measuring implementation and identifying barriers.
Additionally, due to the limited timeframe of these projects, we are unable to report data on the sustainability of these technology interventions beyond funding timeline. This is a particularly important area of future research given the additional implementation supports, technical assistance, and financial incentives often provided through the projects. Although sustainability is a consideration in nearly all implementation frameworks, including the NIRN model (Fixsen et al., 2009), it is often difficult to measure without sustained research support. Factors reported to be critical to exploration, installation, initial and full implementation of the technology-based interventions in this study should be further explored during sustainability.
Footnotes
Declaration of conflicting interests
The author(s) declared no potential conflicts of interest with respect to the research, authorship, and/or publication of this article.
Funding
The author(s) disclosed receipt of the following financial support forthe research, authorship, and/or publication of this article: This study was conducted in collaboration between several projects funded under U. S. Department of Education, Office of Special Education programs.