
Abstract
This study explored the technology integration attitudes and perspectives of special education co-teachers within the United States. The sample consisted of 300 special education co-teachers working in the inclusion classroom in grades pre-kindergarten through 12th grade throughout the country. In the quantitative phase, participants completed a three-part survey about their technology integration attitudes within their co-taught classroom, as well as their practices in integrating specific technology tools. For the qualitative phase, semi-structured interviews were conducted with eight of the outlier co-teachers about their lived experiences with technology as a co-teacher. The pairing of the quantitative and qualitative data collected led to three conclusions about special education co-teachers, including that they (a) are seeking additional learning opportunities about technology, (b) plan asynchronously using collaborative technology tools with their partners, and (c) tend to focus on pedagogy within technology integration.
Keywords
Throughout the United States, co-teaching is a commonly accepted model for school districts (Beninghof, 2020). Inclusion refers to the process of educating all learners within the general education classroom, as opposed to removing students with disabilities to receive their services. The co-teaching model was first defined by Cook and Friend (1995) as a process of teaching with two or more instructors in a single classroom filled with a diverse range of learners.
Co-teaching involves the processes of co-planning, co-instructing, and co-assessing (Murawski, 2003, p. 10). Co-planning, or collaborative planning, consists of both teachers working together to pair their individual areas of expertise and design content, instructional activities, and assessments that meet the needs of their learners. This process gives the special education teacher an opportunity to share information about differentiated learning, accommodations for learners, or classroom management strategies related to behavior (Murawski & Lochner, 2011). According to Cook and Friend (1995), co-instructing involves both teachers must actively be involved in the delivery of a substantial portion of the instruction occurring in the classroom. Co-assessment involves collaboration between both teachers to identify methods for students to display their understanding of a skill. This process often includes determining assessment accommodations, designing alternate assessments, and considering students on an individual level when determining their mastery of a grade-level standard or learning objective (Murawski & Lochner, 2011).
The benefits of this model are well-documented for students with disabilities, including the ability to close the achievement gap (Friend & Barron, 2016), fewer behavioral outbursts and increased social progress (Conderman & Hedin, 2015; Lochner et al., 2019; Scruggs & Mastropieri, 2017), and improved academic performance (King-Sears et al., 2021). This model is also beneficial for the other students in the class (Krammer et al., 2018; Simpson et al., 2014), and the two teachers collaborating together (Chatzigeorgiou & Barouta, 2021; Conderman & Hedin, 2015).
For all of the benefits of co-teaching, there are also barriers that exist to prevent the model from being fully successful. One of the most documented obstacles is a lack of planning time (Alnasser, 2020; Friend et al., 2010; Shamberger et al., 2014). Planning is an essential part of co-teaching, but many partners have minimal time to work together outside of their instruction time due to schedule-related issues.
This lack of planning time impacts the processes of co-teaching and co-assessing, as well. When the appropriate planning time is not provided, special education co-teachers often assume the role of the assistant in the classroom, as opposed to a teacher of equal status (Young et al., 2020). Furthermore, co-planning also provides the opportunity for teachers to determine their individual responsibilities within the classroom (Murawski & Lochner, 2011). Without the opportunity to partake in this process, the types of co-teaching models adopted in the classroom and the type of co-instruction that takes place can vary greatly. Additionally, training is needed for co-teaching in the areas of collaboration, differentiation, and co-teaching itself (Battaglia & Brooks, 2019). However, most teachers are not receiving consistent and continued professional development within these areas.
The literature on co-teaching suggests that technology can be advantageous when trying to overcome the existing barriers to the model. Email and web-based documents have been suggested as a way to find common planning time asynchronously (Brown et al., 2013; Scruggs & Mastropieri, 2017; Villa et al., 2013). The use of personal devices, such as smartphones, to host web conference meetings, share calendars, and share resources has also been suggested as a way to overcome co-planning obstacles (Shamberger et al., 2014; Villa et al., 2013).
Within the areas of co-instruction and co-assessment, technology has been suggested as a way to improve instructional design. For example, Barron et al. (2021) recommend using web conference platforms to provide breakout rooms and targeted, small group instruction for students. This process can destigmatize small group learning because students can discreetly receive extra support without being singled out from their peers (Chizhik & Brandon, 2020). Similarly, technology can be used to provide more accessibility options and utilize the Universal Design for Learning (UDL) framework, especially within specific co-teaching models (Wilson, 2016).
Within the co-assessment portion of co-teaching, technology provides teachers with an opportunity to provide students with improved feedback. Having two instructors allows for quicker feedback and answers to student questions (Scribner-MacLean & Miller, 2011), which can be further improved using digital tools. Furthermore, co-teachers can integrate various adaptive platforms to assess student progress, or forms and spreadsheets can be integrated to track student progress and mastery (Friend & Friedlander, 2016). Despite these recommendations, there are few studies that specifically address how co-teachers are currently integrating technology into their inclusion classrooms.
The purpose of this explanatory mixed methods study was to determine how special education co-teachers are currently using technology within their co-taught classes, including within the co-planning, co-instructing, and co-assessing parts of their role. The intent was to answer the research questions:
What are the technology integration attitudes and practices of special education co-teachers?
What are the lived experiences of special education co-teachers in integrating technology into the inclusion setting?
In what ways does the qualitative interview data with special education teachers explain the quantitative data about their frequency of and attitudes toward technology integration in the inclusion setting?
Theoretical Framework
This study was grounded in the Technological Pedagogical Content Knowledge (TPACK) framework. Proposed by Mishra and Koehler (2006), this framework builds on Shulman’s (1986) Pedagogical Content Knowledge (PCK) framework, which suggests that content knowledge and pedagogy should be intersected and not treated as separate entities. Mishra and Koehler (2006) saw a need for a theoretical framework focused on technology integration and added “technology” to Shulman’s existing model. The TPACK model bridges instructional best practices, subject matter expertise, and technical knowledge. The intersection of these three knowledge bases helps teachers to make technology-based decisions in their classrooms (Mishra & Koehler, 2006). These frameworks also include hybrid domains. The technological content knowledge (TCK) domain focuses on technical skills and subject matter expertise, including how to find specific technologies to help learners meet content area instructional objectives, and the technological pedagogical knowledge (TPK) domain combines technical skills and pedagogy, where a teacher can use technology to support specific instructional strategies and classroom activities (Mishra & Koehler, 2006). Figure 1 demonstrates the intersection between the three main knowledge domains, as well as the hybrid domains. The technological pedagogical content knowledge framework diagram.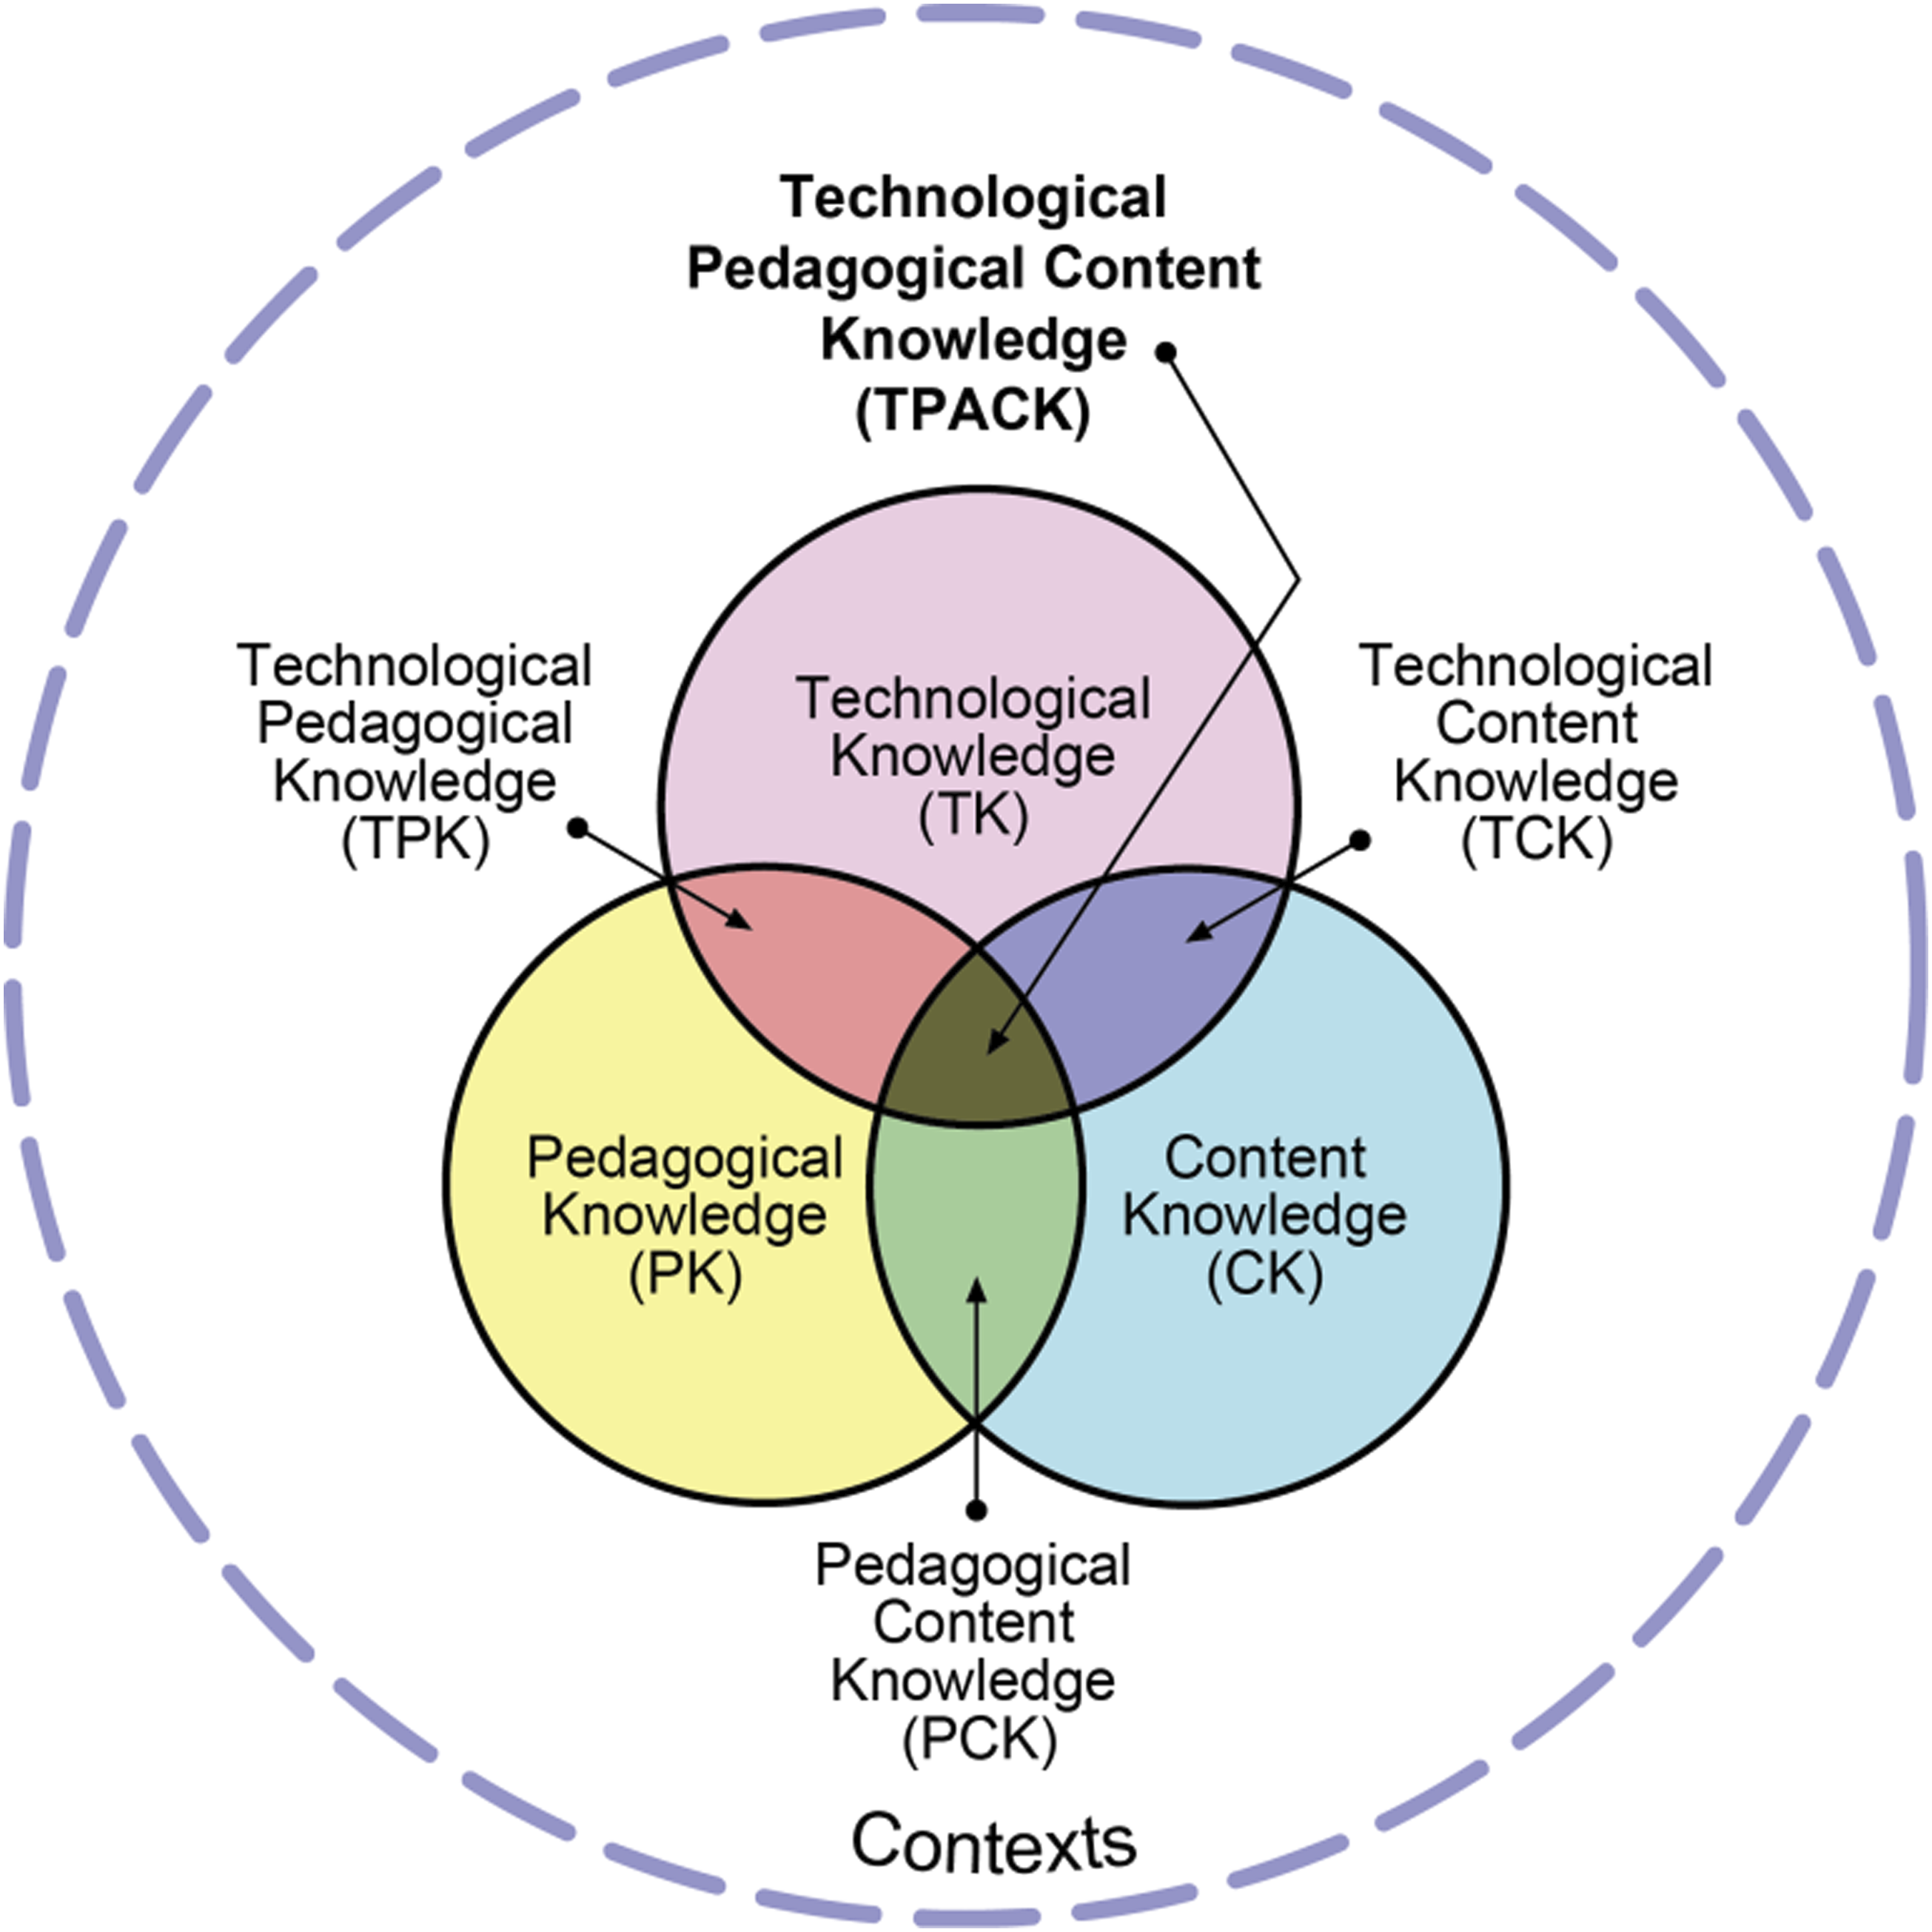
The TPACK framework offers opportunities for integration within co-teaching, including the planning, instructing, and assessing processes. According to Koehler and Mishra (2009), there is no best way to bring technology into the classroom; rather, teachers need to identify how the technology can best support the instruction of a subject and the needs of a specific classroom. As a result, this framework could be considered by co-teachers when they are determining how to integrate technology tools and resources into their instruction within the inclusion classroom. For example, this framework could be paired with the popular UDL framework to plan for creating inclusive learning environments (Bento-Borghi, 2013). Additionally, the pedagogical knowledge (PK) base was defined as the concept of planning, instructing, and assessing students by Shulman (1986) before being adopted for the TPACK framework. Consequently, there is a connection between the overall TPACK framework and the processes of co-planning, co-instructing, and co-assessing within the co-taught classroom.
Method
Quantitative Phase
The targeted population was special education co-teachers working within pre-kindergarten through twelfth-grade inclusion classrooms in public schools throughout the United States. Although co-teaching pairs typically include both general and special educators, this study focused only on special education teachers. The rationale for only selecting half of the co-teaching partnership was due to the differences in experiences between both co-teachers. Studies have suggested that general and special education co-teachers have unique role expectations. For example, special education co-teachers are tasked with tracking goals, differentiating, behavior management, increased paperwork, and communication with parents, caregivers, or specialists (Eisenman et al., 2010), which is not expected of the general education teacher to the same capacity.
In total, 300 special education co-teacher participants fully completed the survey. There were a total of 46 states represented in this study. Only Alaska, Hawaii, Idaho, and South Dakota did not have participants. Figure 2 contains a breakdown of state participation in this study. New Jersey was the most common state of participation with 43 participants, while Texas and Illinois are the next most frequent, with 21 and 20 participants respectively. Location demographics of 300 survey participants.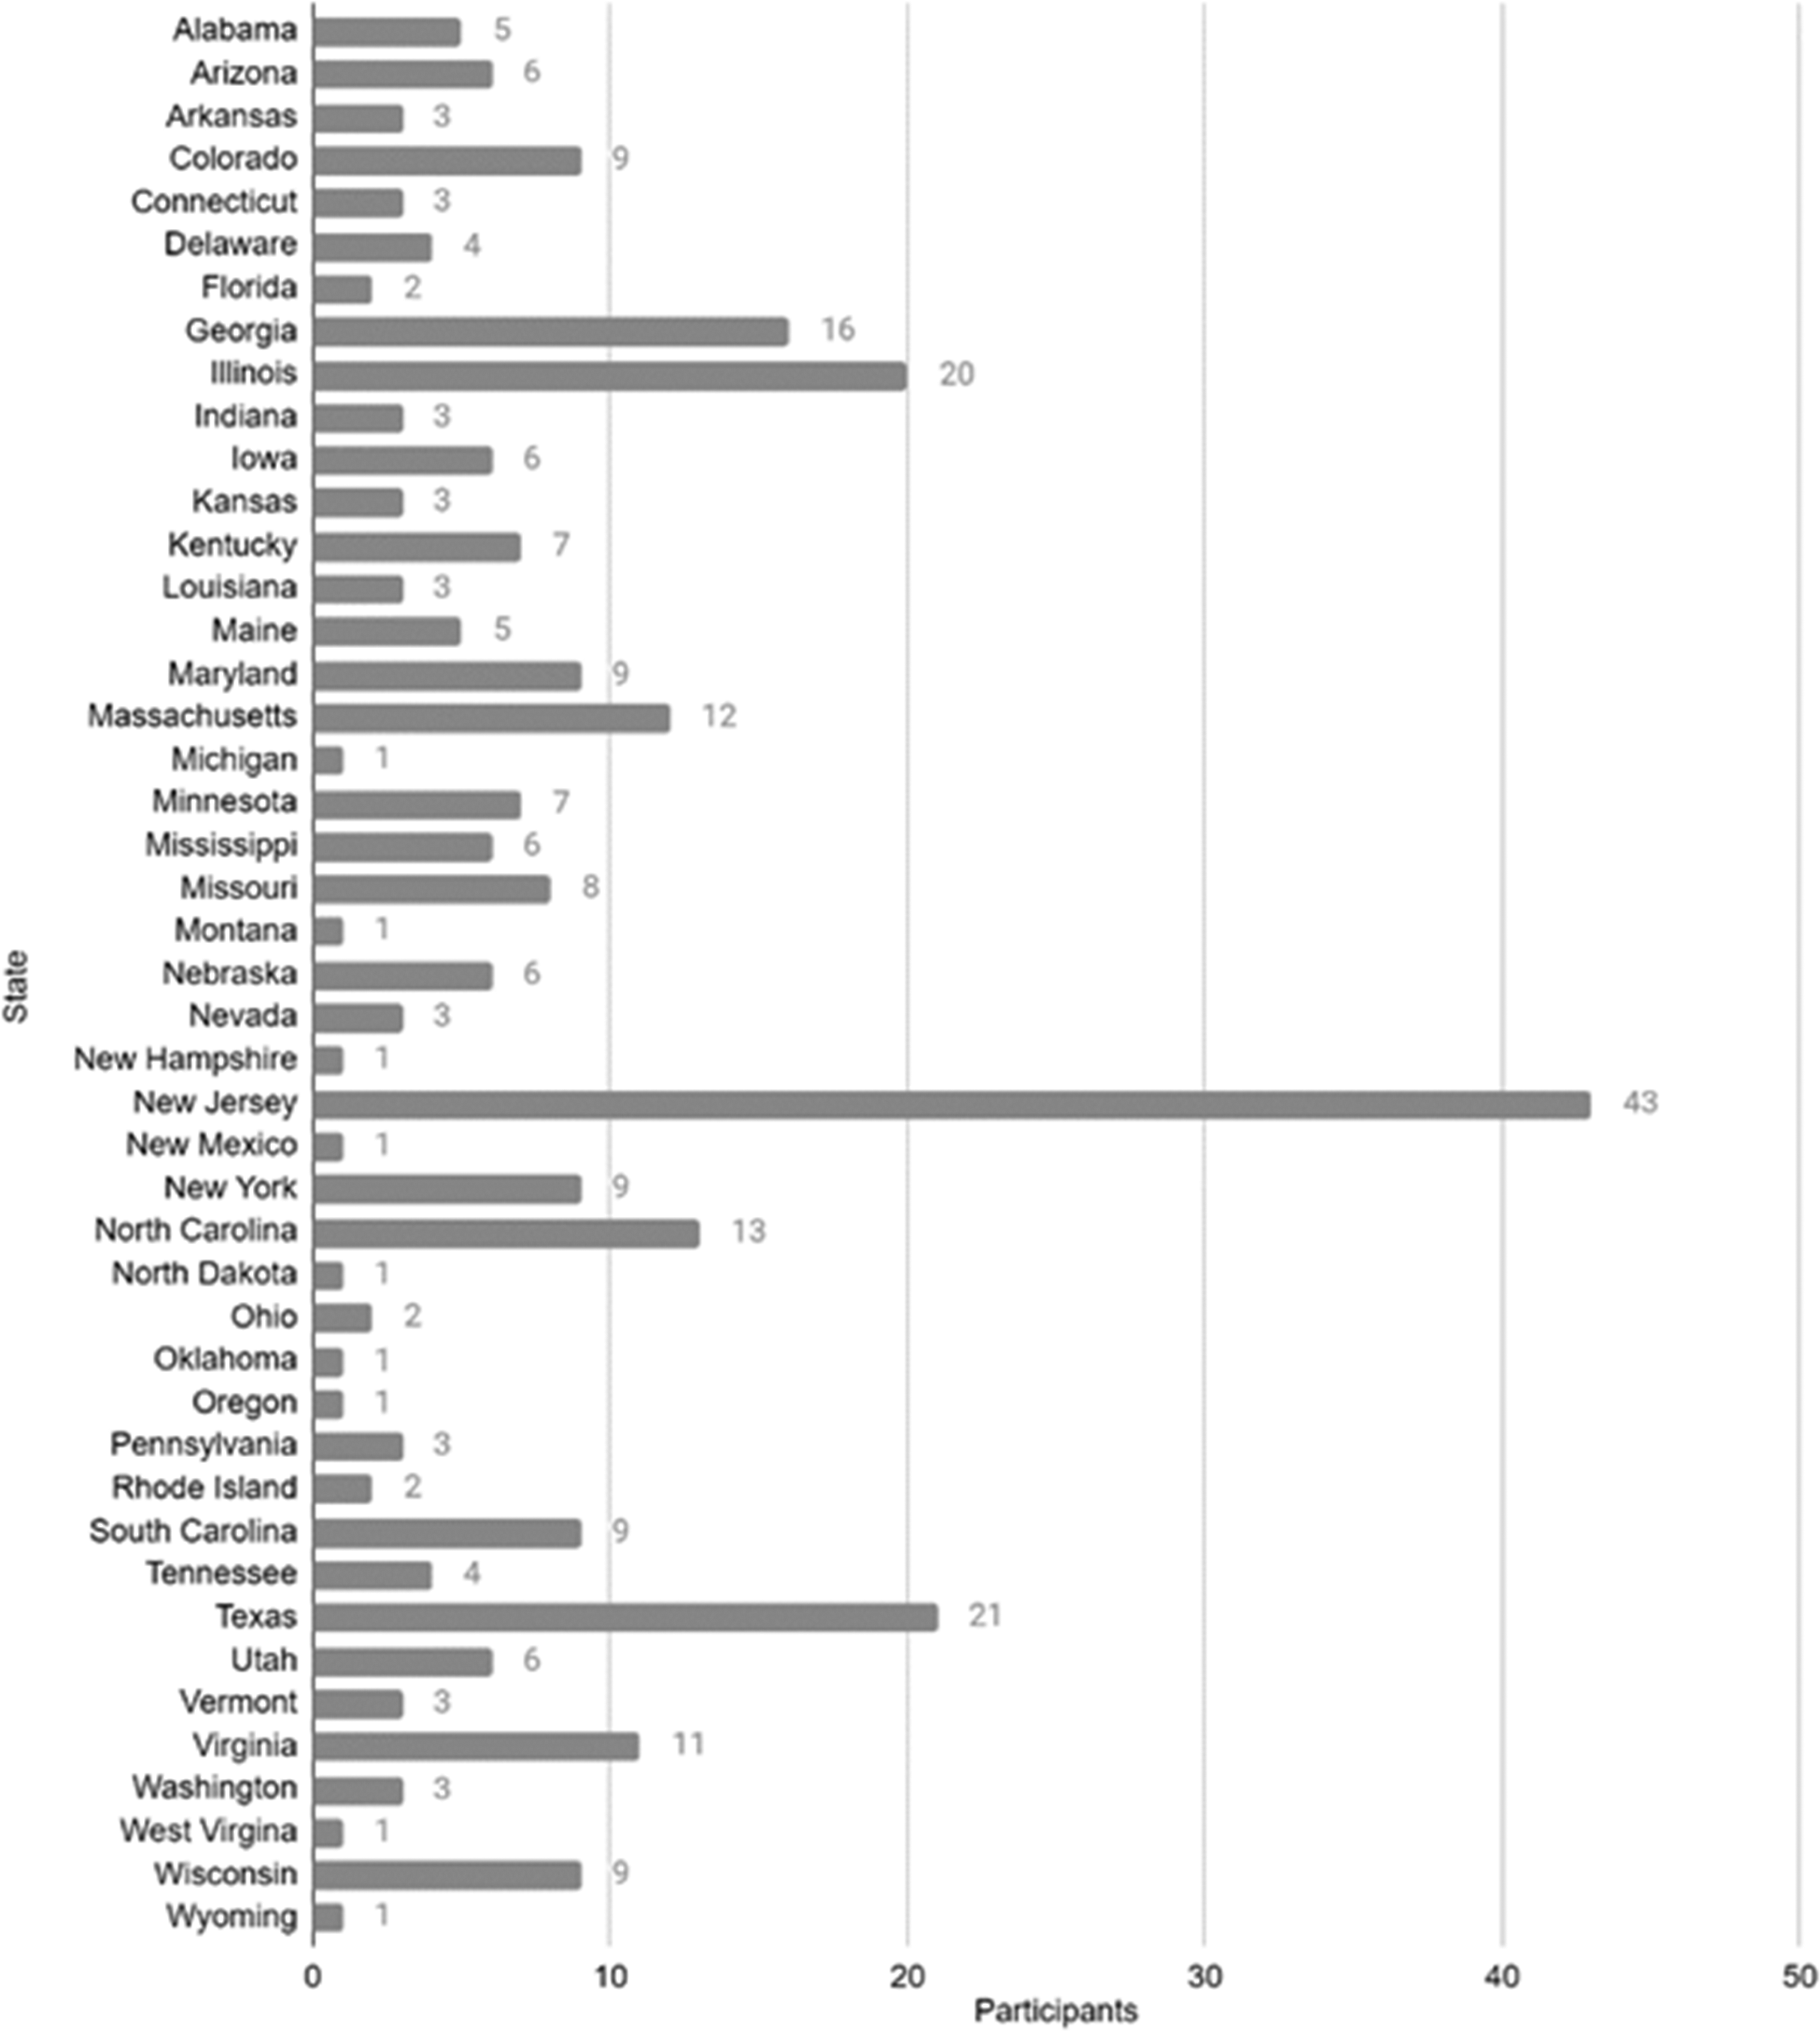
There were more participants who worked at the secondary level in grades six through 12, as opposed to the elementary school in pre-kindergarten through fifth grade. Participants could select multiple grade-levels within the survey to show that they were co-teaching in more than one grade. Figure 3 shows a breakdown of the grade levels that were taught by each co-teacher participant. Grade level demographics for participants.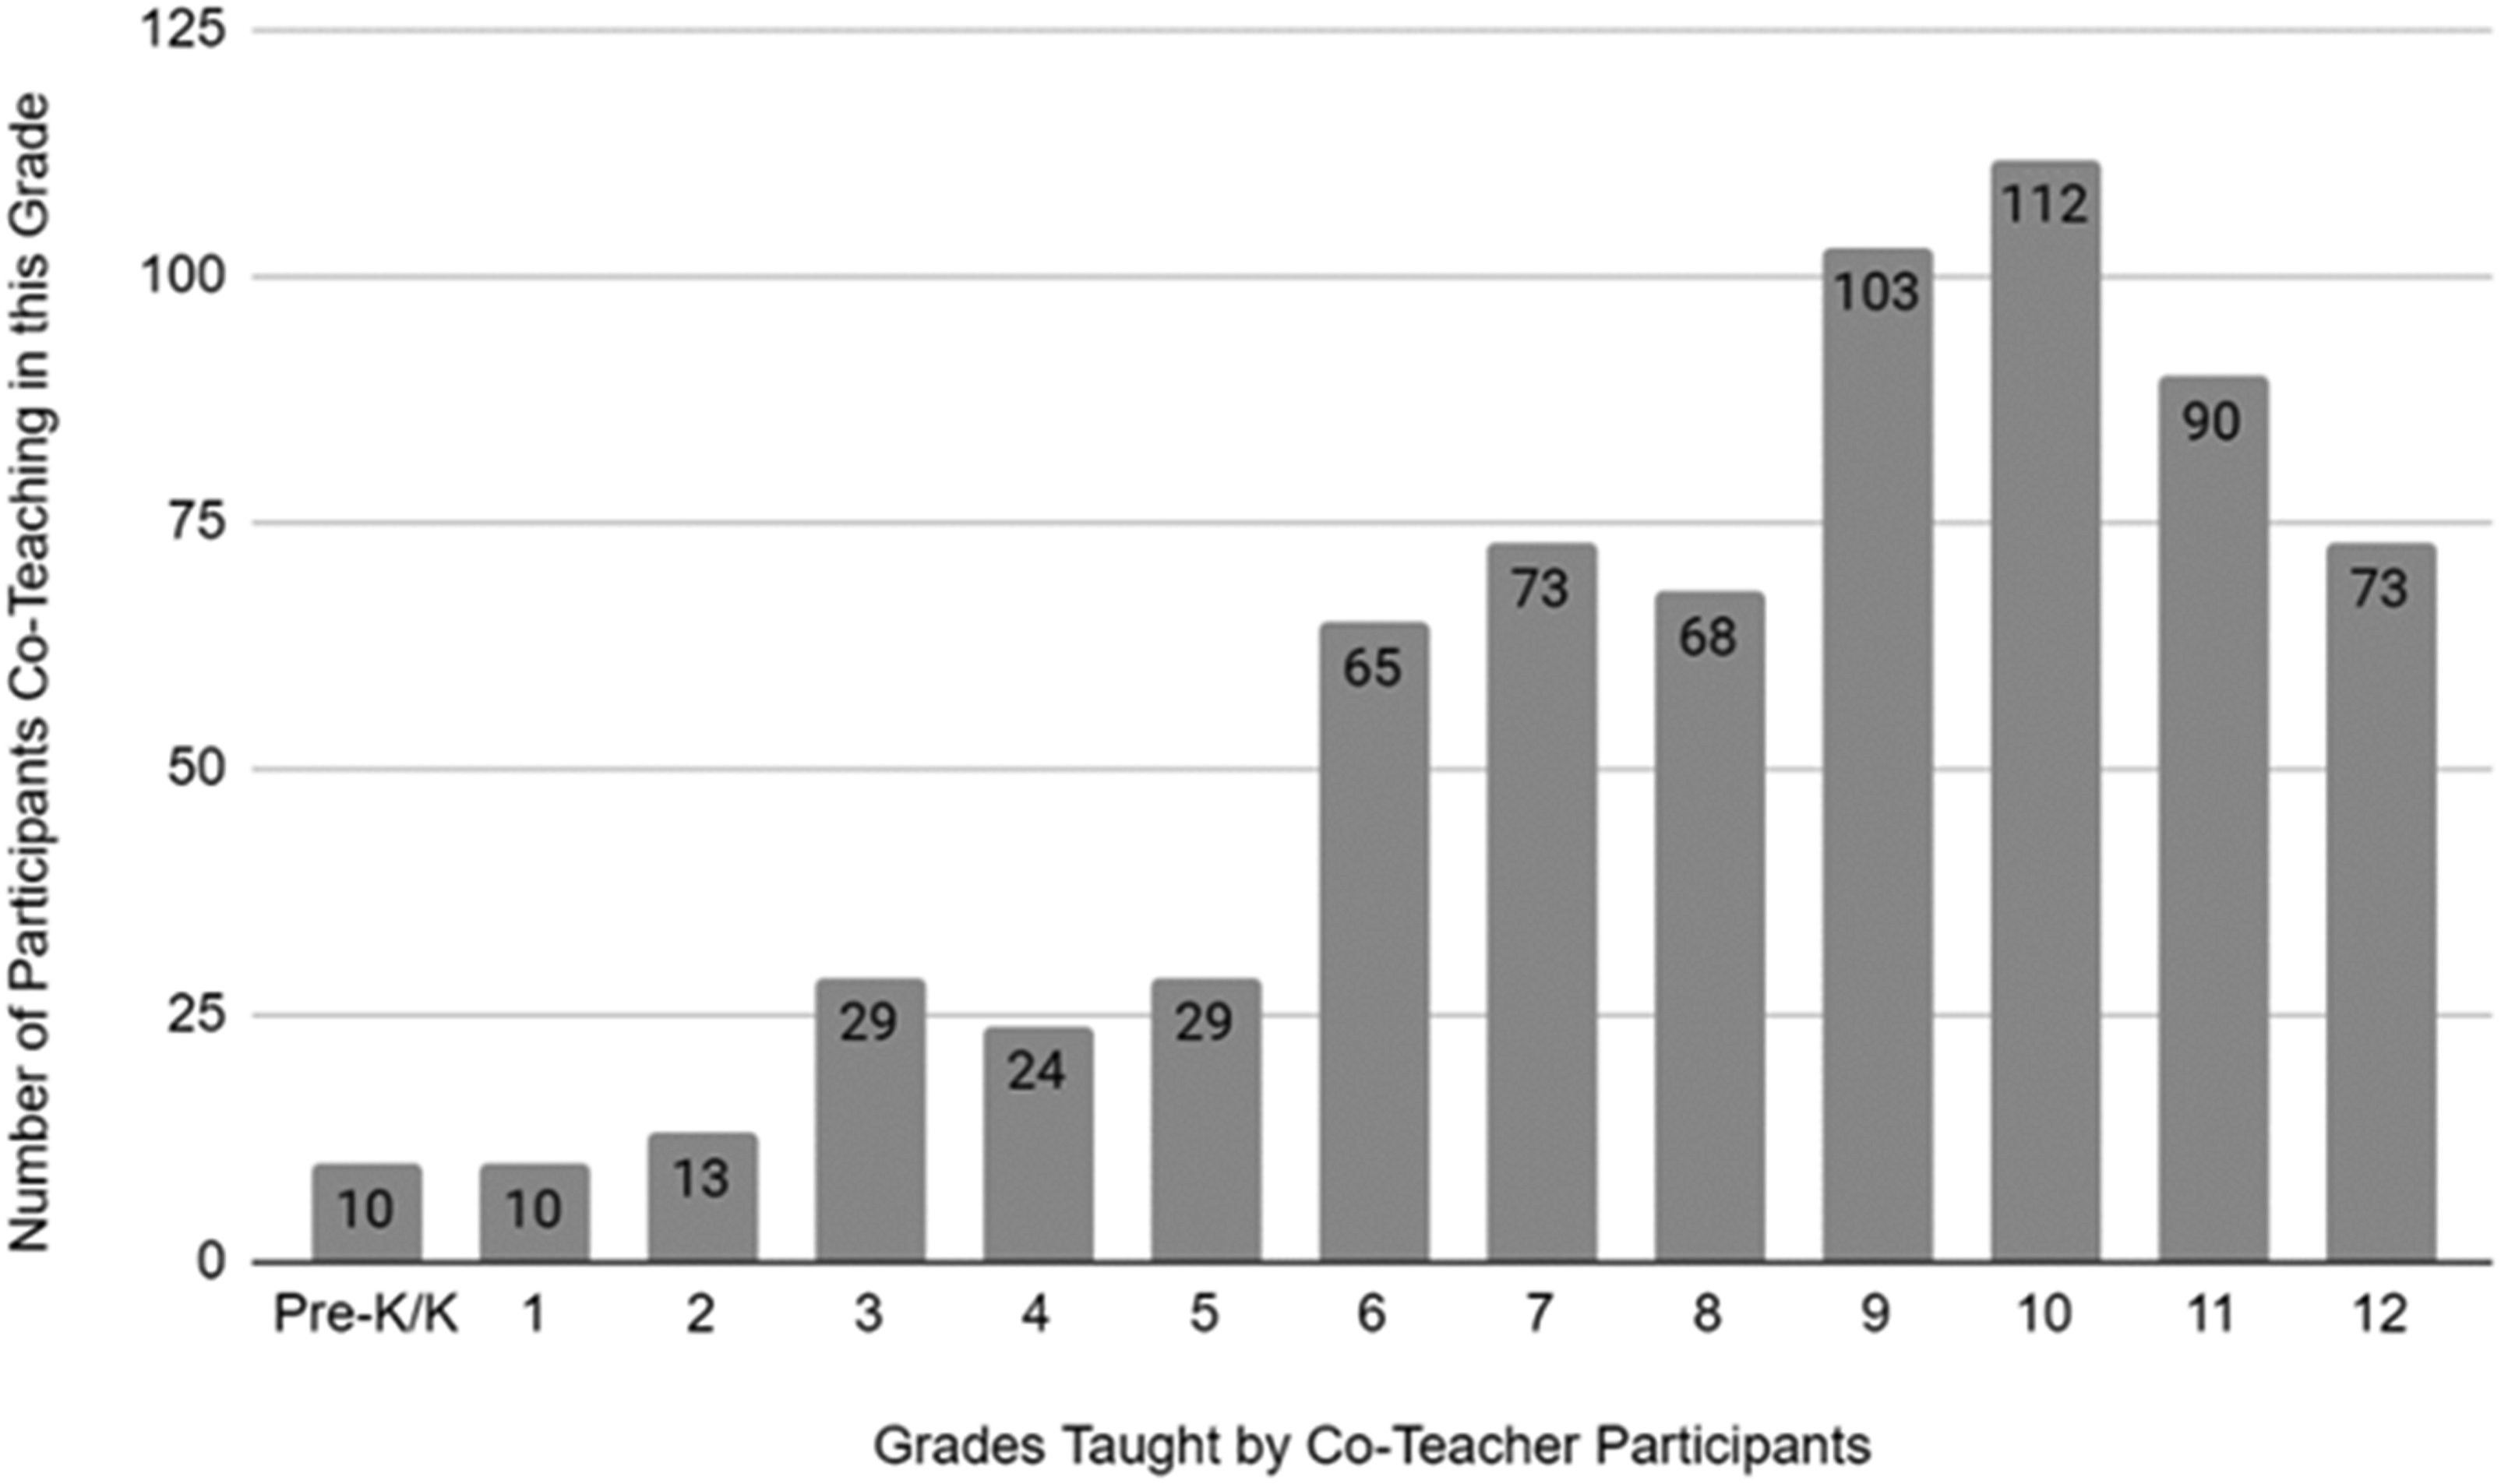
Similarly, participants could select multiple subjects to show the content area they were teaching this year in their inclusion classes. Math and Language Arts/English were the most popular subjects represented in this study. There were 154 co-teachers working in the language arts/English co-taught classroom and 154 co-teachers working in the math classroom. Science had 62 participants, while social studies or history classroom had 59 participants. There were 45 working at the elementary level within all core subject areas, 17 participants who selected “other” and worked in courses such as social skills, consumer education, and finance, while three worked in electives and two worked in world language. Because participants could choose more than one answer to represent the different co-taught classes during their workday, the total number of responses is higher than the 300 participant count.
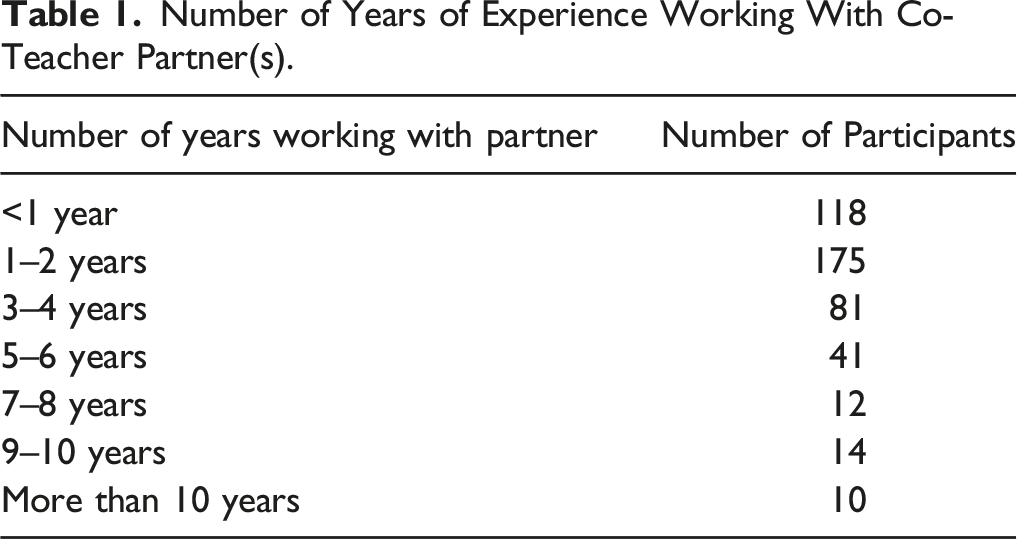
Number of Years of Experience Working With Co-Teacher Partner(s).
Survey Instrument
The design of the survey instrument was modeled after the Technology Uses and Perceptions Survey (TUPS) created by the Florida Center for Instructional Technology. The questions were modified to meet the needs of this study, but the structure was inspired by this instrument. The survey in this study contained three parts: demographic questions, co-teacher technology integration attitudes and perceptions, and co-teacher technology usage. The demographic questions addressed the participant’s location by state, years in education, years of experience as a co-teacher, number of co-teaching partners for this year, and the number of past years that have been spent working with that co-teacher. Technology demographic questions were also included, such as the way students access their devices in the inclusion classroom. The options included Bring Your Own Device (BYOD), 1:1 computing devices, computer carts, or computer labs.
The second part of the survey included co-teaching integration attitudes using a five-point Likert scale, ranging from “strongly agree (5)” to “strongly disagree (1).” The questions had participants reflect on their feelings about using technology tools in relation to their co-teaching responsibilities, as well as their perceptions about technology in schools overall. The final section addressed the frequency in which special education co-teachers used specific technology tools to co-teach, co-plan, and co-assess in their inclusion classrooms. The technology tools were split into two categories: instructional and assistive technology. For each tool, participants had to indicate how frequently they used it in their classroom on a scale of “more than five times per week” to “0 times per week.” This process was repeated and then focused on different technology-enriched activities completed in a given week on a scale from “five times” to “zero times.”
Quantitative Procedures
Participants were contacted through a variety of recruitment methods. A survey link was shared through different public educator online communities using relevant hashtags to gain interest. Other accounts were able to re-share the post to gain further attention. The survey was also shared with the executive board of each Council of Exceptional Children (CEC) state affiliate. Of the 50 state affiliates, six states shared the survey with their membership base through their social media channels. Finally, online search engines were utilized to find public school directories that listed co-teachers. These searches uncovered publicly available teacher websites, which detailed their 2021–2022 school year schedule. If a teacher was determined to be co-teaching during this academic year, they were contacted with the link to the survey.
Based on an initial pilot of the survey, the questions were estimated to take less than 10 min. After consenting to participation, each co-teacher was introduced to the three sections of questions. Following the survey completion, the results were analyzed using SPSS software. For the technology frequency sections, where participants indicated how often different instructional and assistive technologies were used and how often they conducted technology-enriched activities, their scores were totaled and divided by the total number of survey items. This number provided an average of how frequently each participant was using technology within their co-teacher role.
Each participant was assigned an individual identification number for this study. Participants who were classified as extreme cases or outliers were invited to participate in the qualitative phase of the study. The highest and lowest ten percent of technology integration averages were sent emails with an invitation to participate to gain a better understanding of their experiences with technology as a co-teacher in the inclusion setting.
Reliability and Validity
Internal consistency tests were conducted on the survey instrument used in this study. Before distributing the survey to potential participants, the survey was piloted with a group of 25 teachers. These participants were special education teachers who worked as co-teachers during the 2020–2021 school year but were no longer working in this setting for the 2021–2022 school year. Consequently, the pilot group had enough expertise and experience to answer the questions but were not eligible for participation in the study itself. The participants in the pilot group volunteered to participate in the survey, using their prior year’s experience to answer the questions.
After collecting the data from the pilot group, the scores were placed in a spreadsheet, and Cronbach’s alpha was used to assess the internal consistency of the survey instrument items. The internal consistency for this survey was .819 for the Likert scale questions. Since the value fell between .7 and .9, which is considered ideal for a survey instrument (Creswell & Creswell, 2018), the internal consistency was found to be sufficient. Aside from this calculation, the pilot group also provided an approximate timeframe for survey completion. This information was given to active participants in the study so they could estimate the time commitment for survey participation.
The pilot group also provided opportunities to validate the survey, including determining if there were interpretation problems with the survey questions. This group allowed for the questions to be refined prior to distribution to potential study participants. The same group of 25 special education teachers were invited to share if there were any questions, statements, or technology tool categories that require revision. One recommendation was to include the names of popular technology tools to go with each technology category. For example, some participants felt like they were using popular accessibility features, but having examples of these different tools would help them recall whether or not they were actively used in class. As a result, names of popular technology tools were included for each item in those sections of the survey.
Qualitative Phase
Demographic Information for the Special Education Co-Teacher Interview Participants.
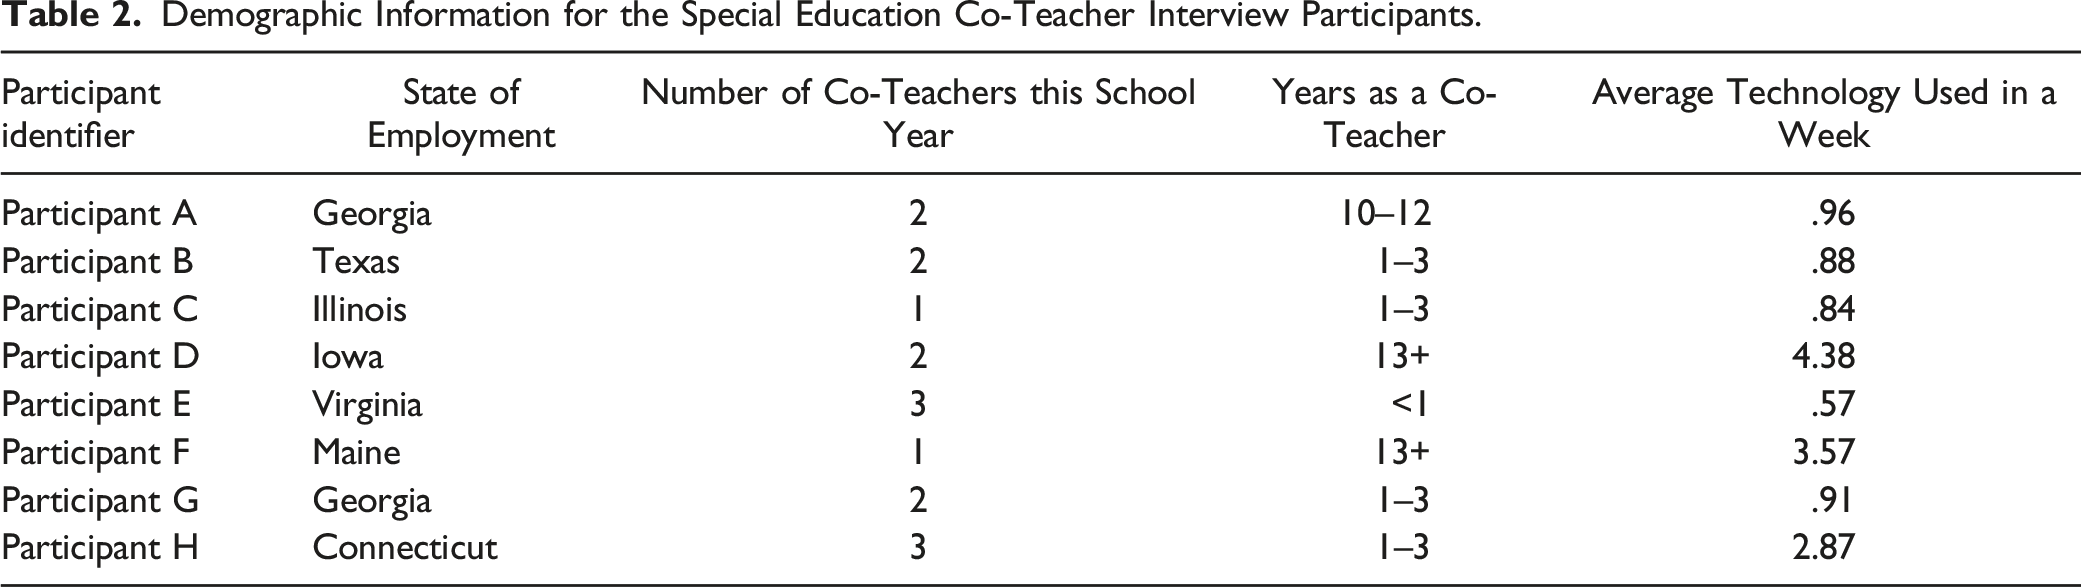
There were eight participants who scheduled and completed the qualitative interview portion of this study. Each participant was assigned a unique letter identifier, ranging from A to H. Of the eight participants, three were in the top outlier of the quantitative phase, which indicated that they were in the top ten percent in technology integration frequency. The remaining five participants were in the bottom ten percent with how frequently they used technology in the classroom. The demographic information for each of the eight participants can be found in Table 2.
For the qualitative phase, purposeful sampling was used. Participants were selected for participation based on their average score in the technology frequency sections of the survey. To complete this calculation, data was used from the quantitative portion of the study. The highest and lowest 10% of survey participants were invited to be interviewed on their technology integration practices. There were a total of eight participants who completed the entire process of scheduling, interviewing, and verifying their transcripts.
The interviews were conducted via Zoom and recorded. The participants were asked six questions about their current technology integration practices. Each question was connected to one or more of the knowledge bases or hybrid bases of the TPACK framework. The questions focused on the participant’s role in their inclusion classroom, as well as the different co-teaching models used within their classes and how technology factors into those models. Participants were also asked about if and how technology was used to support individual students and co-plan with their partner. They were also asked about the obstacles and benefits of technology integration within their co-taught classroom. There were opportunities for follow-up questions or prompting questions based on participant responses during the interview.
Once the interview was completed, it was transcribed using an artificial intelligence platform, Otter.ai, and checked for accuracy. Member checking was used to ensure validity within the qualitative research phase. Participants were given the opportunity to verify their transcripts for accuracy. A week after each interview, the participant was emailed their transcript in a Google Doc. The participant was given an additional week to review the document and notify the researcher of any inaccuracies. The participant had suggestion rights to the document, allowing them to delete phrases or make comments to the researcher directly. Of the eight qualitative phase participants, no one had any changes to make within their interview transcript aside from minor spelling errors, such as the spelling of a co-teacher’s last name. Those changes ended up being redacted from the transcript prior to analysis to maintain the privacy and anonymity of the participants.
Following an initial read-through of the verified data, the transcripts were uploaded into Atlas.ti for coding. First, sections of information were bracketed, sentence-by-sentence, and marked with one of the knowledge bases from the TPACK framework. For example, if the sentence was only talking about technology, it was labeled with that marker. If a sentence was a discussion of technology and content area knowledge, the TCK marker was used. As a result, there were seven possible markers: technology (T), pedagogy (P), content knowledge (C), PCK, TPK, TCK, and, in the event that technology, instructional strategies, and subject expertise were paired in a single sentence, TPACK was used as the marker. In addition to the coding of the transcripts, optional open-ended responses from the survey were also included in this thematic coding and analysis process.
Once the transcripts were initially coded by sentence, each marker was examined individually. Within each TPACK marker, additional coding was used to determine themes within those knowledge bases. Each sentence was given an additional single word phrase to summarize the statement. At the end, codes were merged and combined until a single codebook was created for each individual knowledge base. The results from this analysis were used to address the second research question and further explain the findings from the quantitative phase.
Results
Research Question One
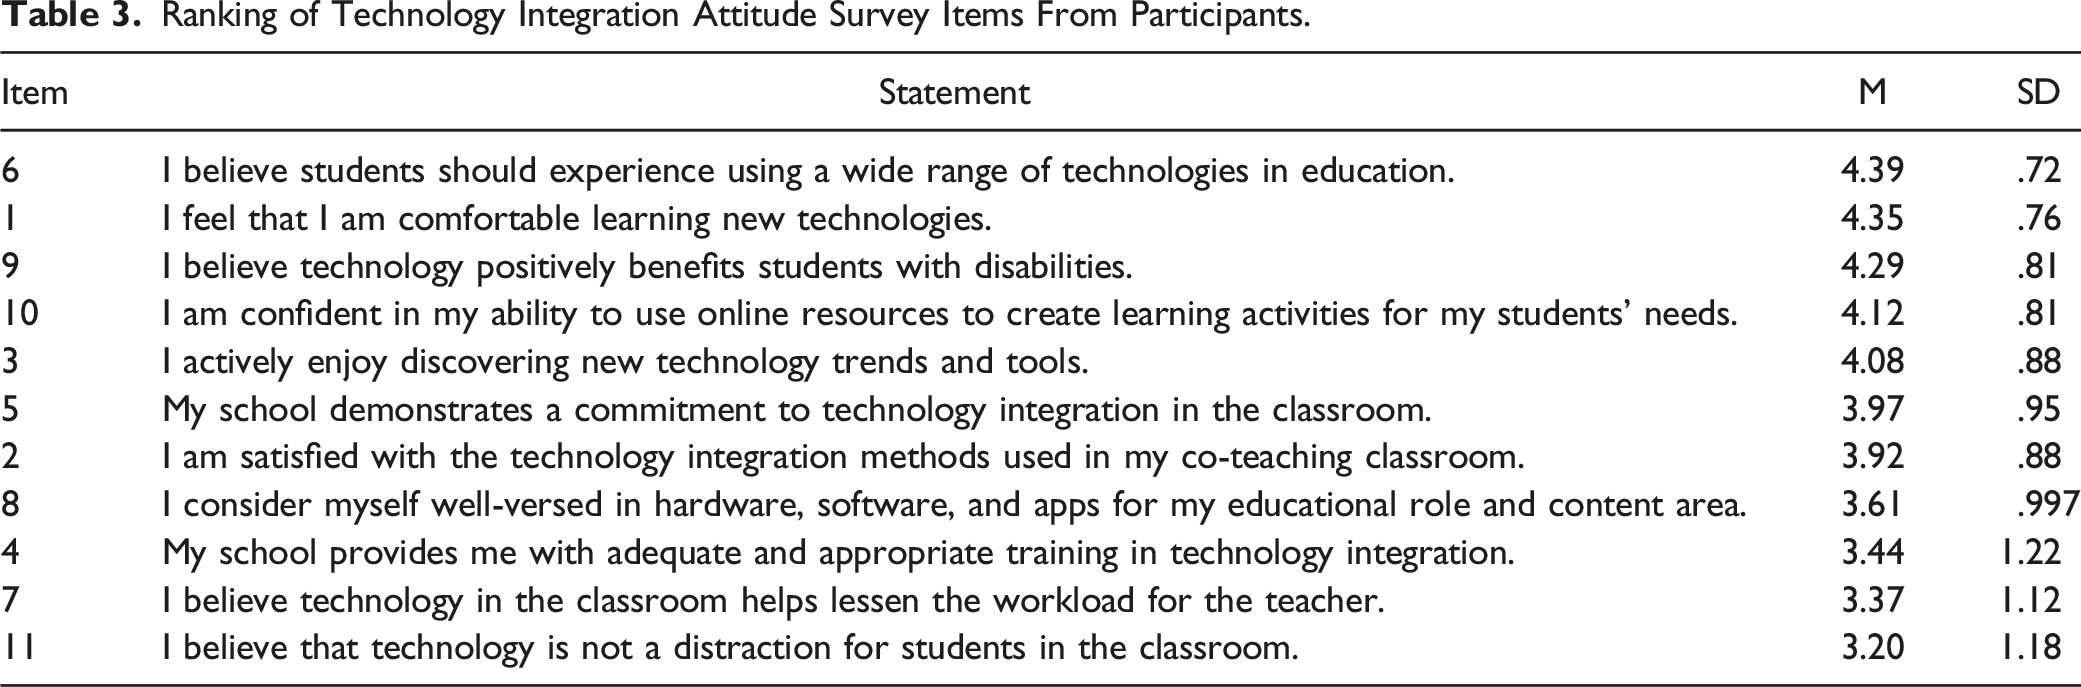
Ranking of Technology Integration Attitude Survey Items From Participants.
Instructional and Assistive Technology Tools Used Most Frequently by Participants.
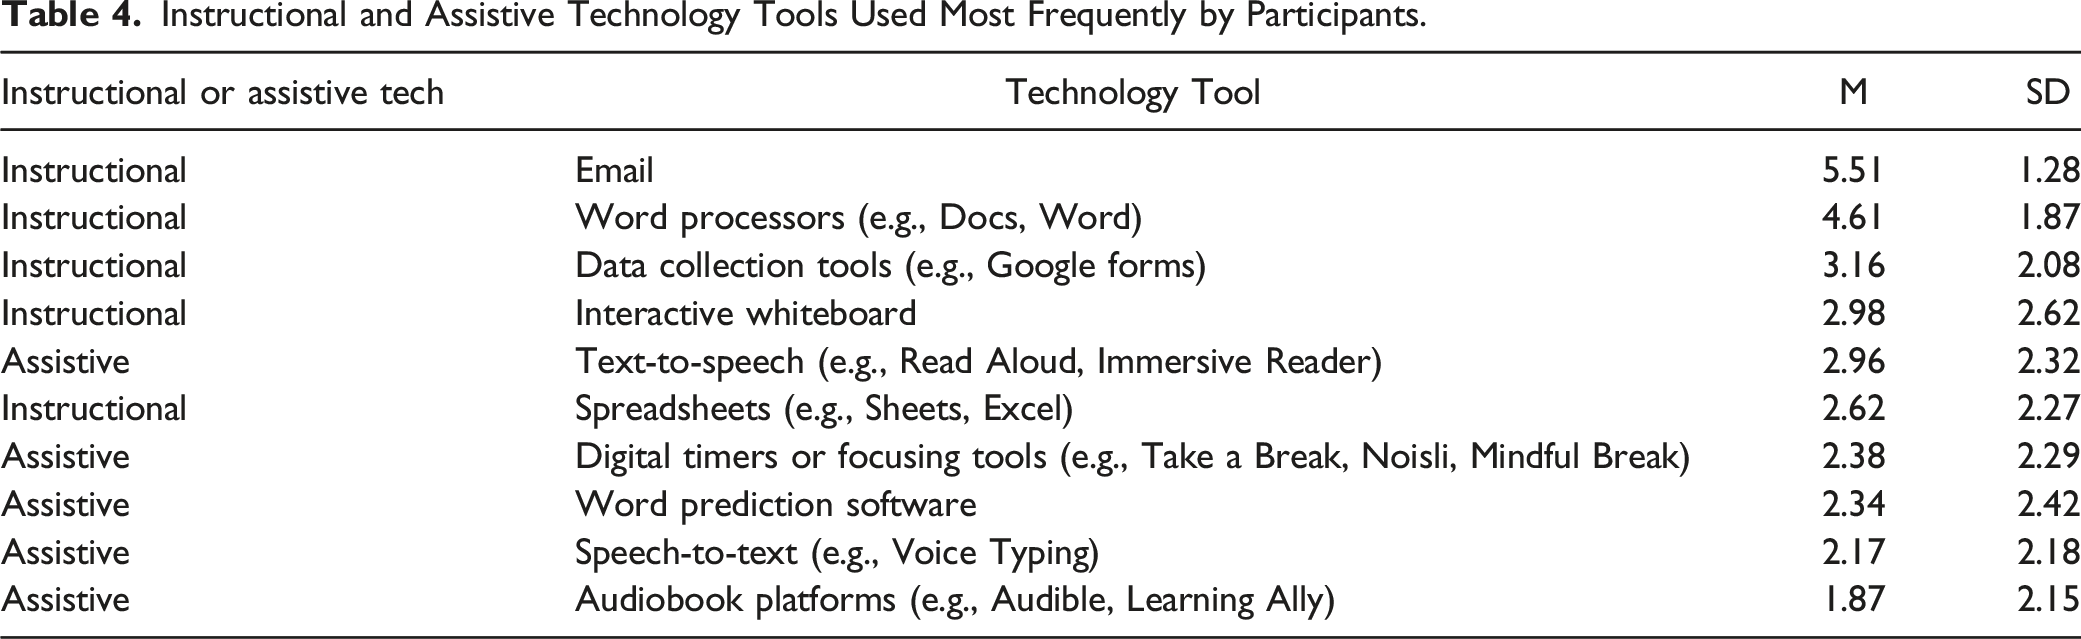
Within these results, email, word processing tools, data collection tools, interactive whiteboards, and spreadsheets were the most common instructional technologies used by the special education co-teacher participants. Each of these tools were used approximately three times a week to either co-plan, co-instruct, or co-assess students. For the assistive technologies or accessibility features, text-to-speech, digital timer or focusing tools, word prediction software, proofreading tools, and speech-to-text were the most commonly used tools within the inclusion classroom. The least commonly used instructional technology tools, according to the co-teacher participants, were breakout rooms for Google Meet and Zoom, peer collaboration tools, such as FlipGrid, and Multimedia Tools for Video Creation, such as WeVideo or iMovie. The least common assistive technology tools were hardware, such as adaptive keyboards and switch access technologies. Summarizing tools, where the technology automatically summarizes a text for the learner, were also used infrequently according to the participants.
In the final part of the survey, participants listed how frequently they completed specific technology-enriched activities in a given week with their co-teacher partner. The tasks that were integrated with the most frequency included assigning personalized work based on individual student needs, collaboration between peers, and engaging in self-paced work or activities. The least common technology activities included flipped or blended learning, video creation, and global collaboration. Similar to the frequency of instructional and assistive technology usage in a given week, the technology-enriched activity SDs were also higher, indicating variation between survey respondents.
Research Question Two
The interview transcripts from the eight participants and the optional open-ended responses from the survey were used to answer the second research question. The coding process revealed how common each of the TPACK knowledge bases was addressed by participants. The TPK Base, the Technological Knowledge Base (TK), and the PK Base were discussed most frequently by participants. Figure 4 contains a breakdown of the frequency of the TPACK knowledge bases within the coding of the transcripts and qualitative data. Frequency of TPACK knowledge bases in the coding process.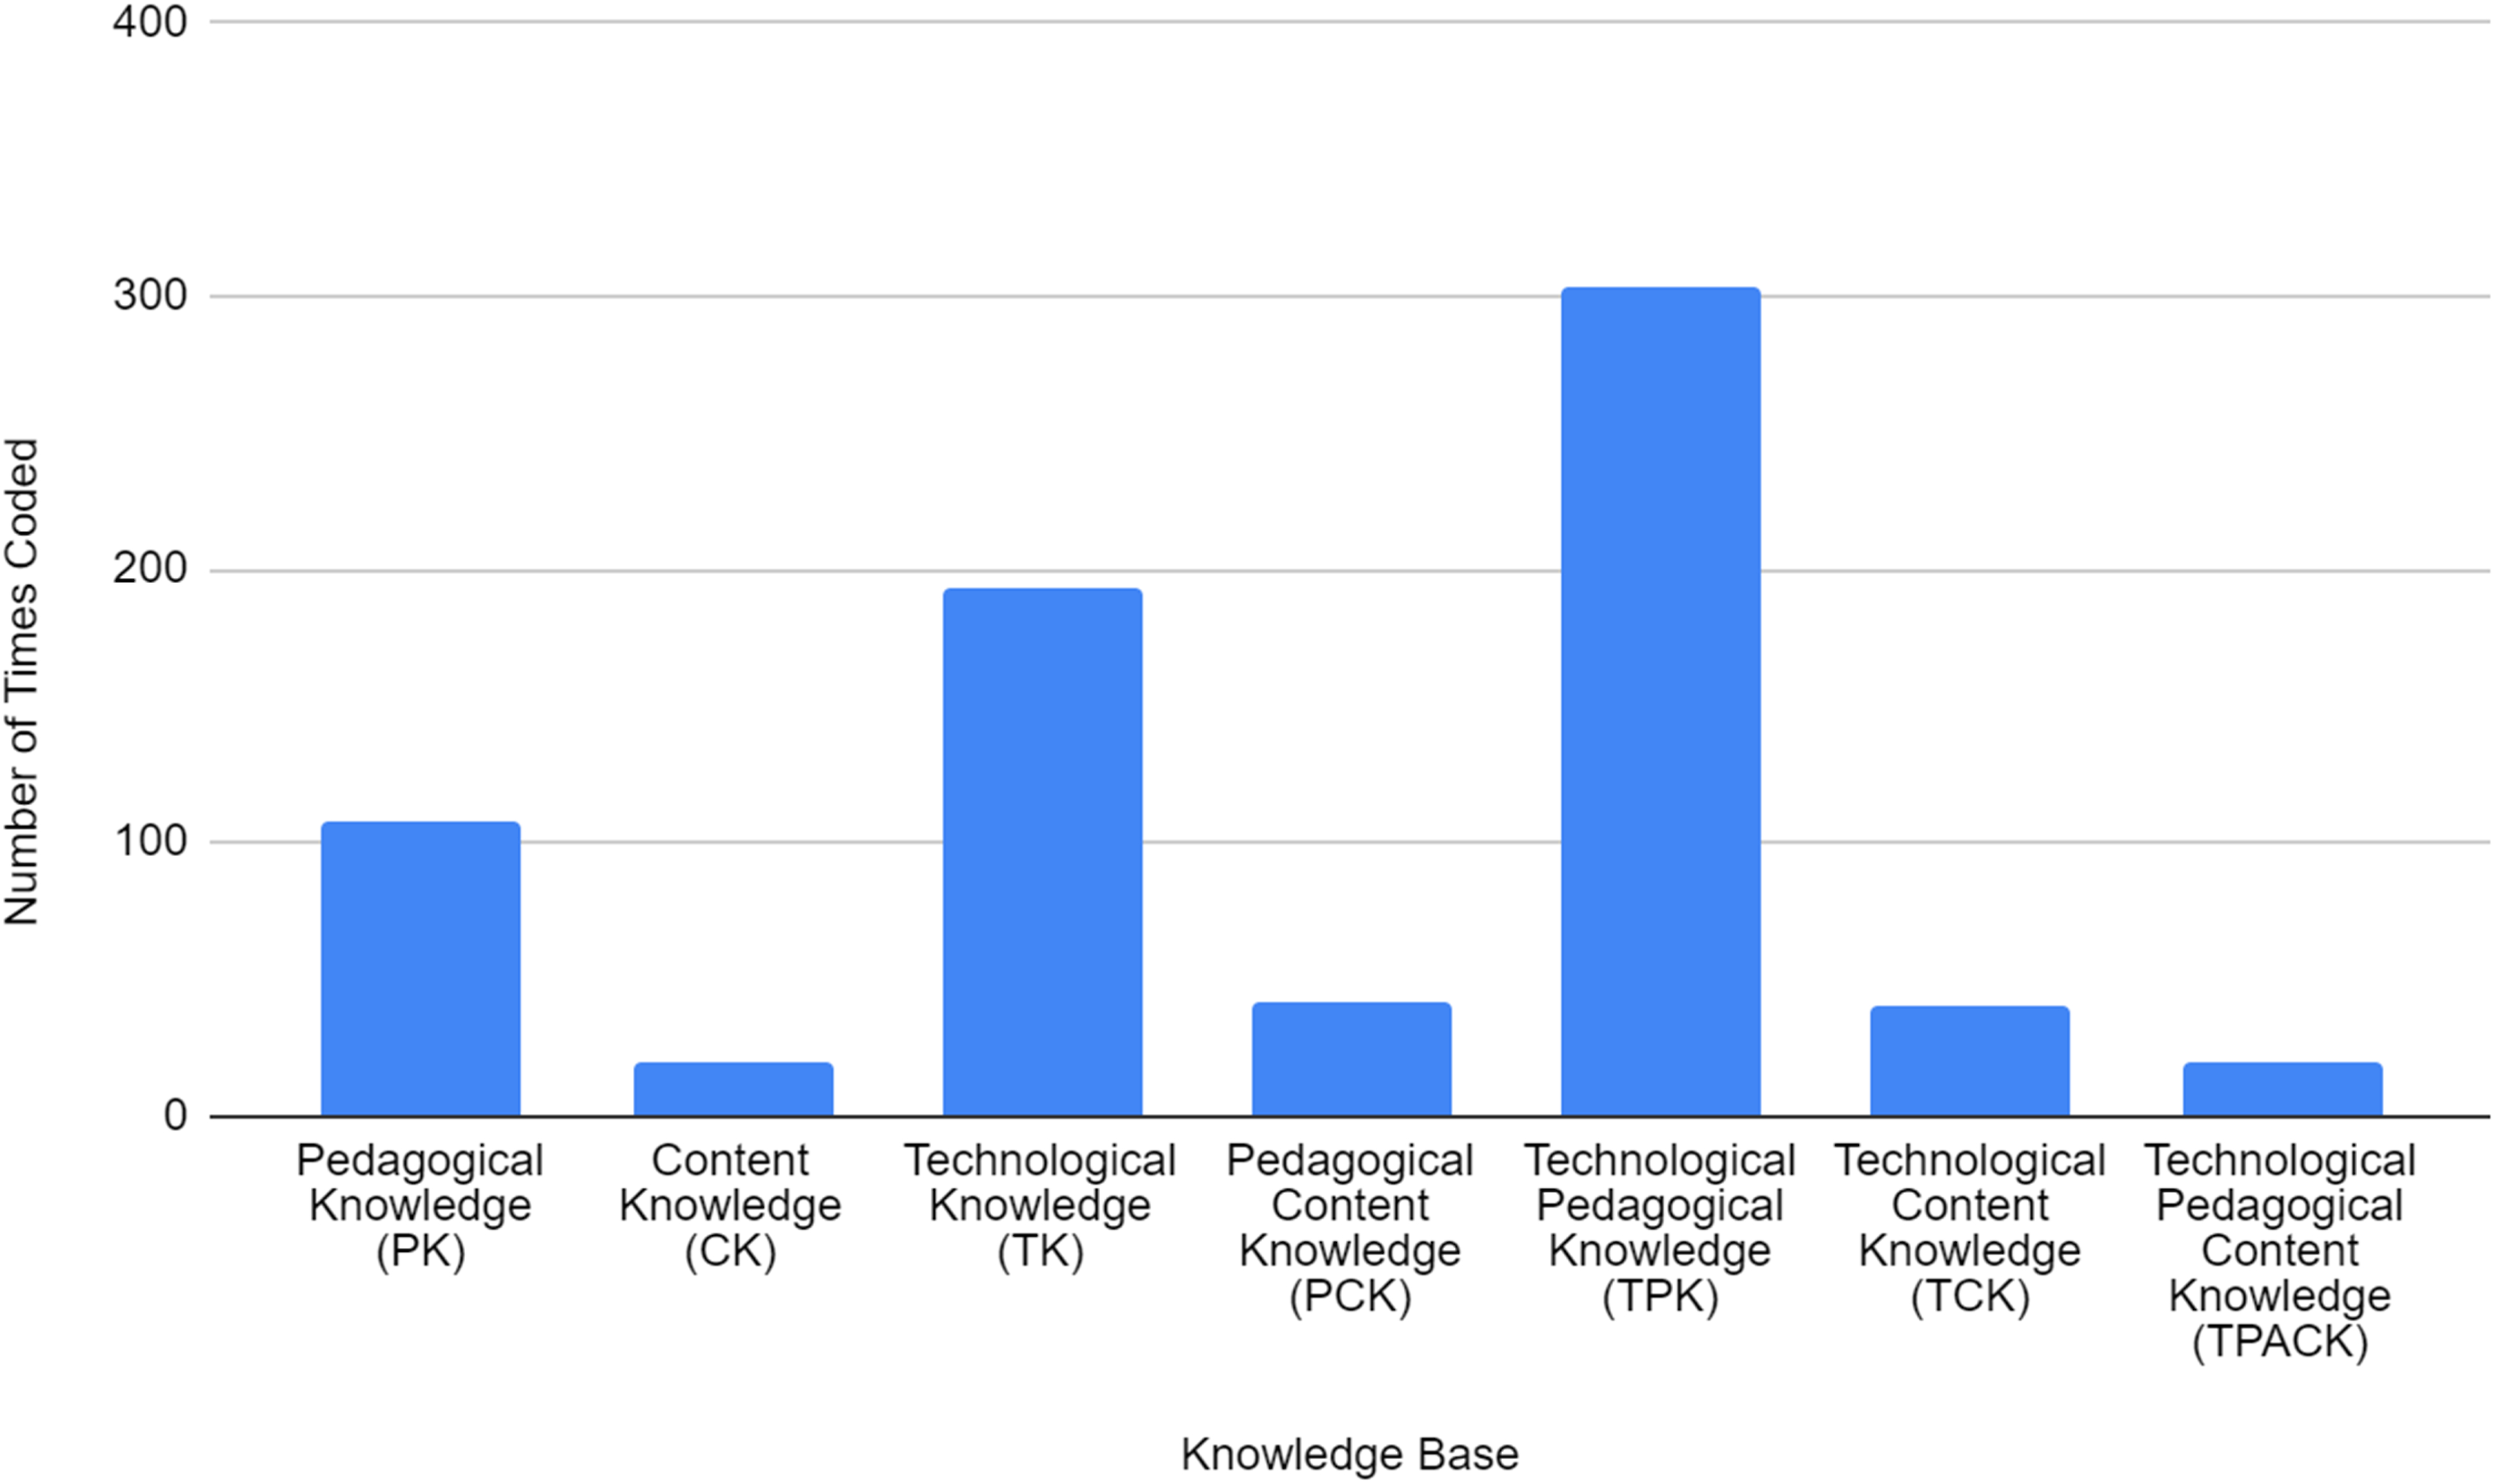
Joint Display of Quantitative Variables and Qualitative Themes and Quotations.
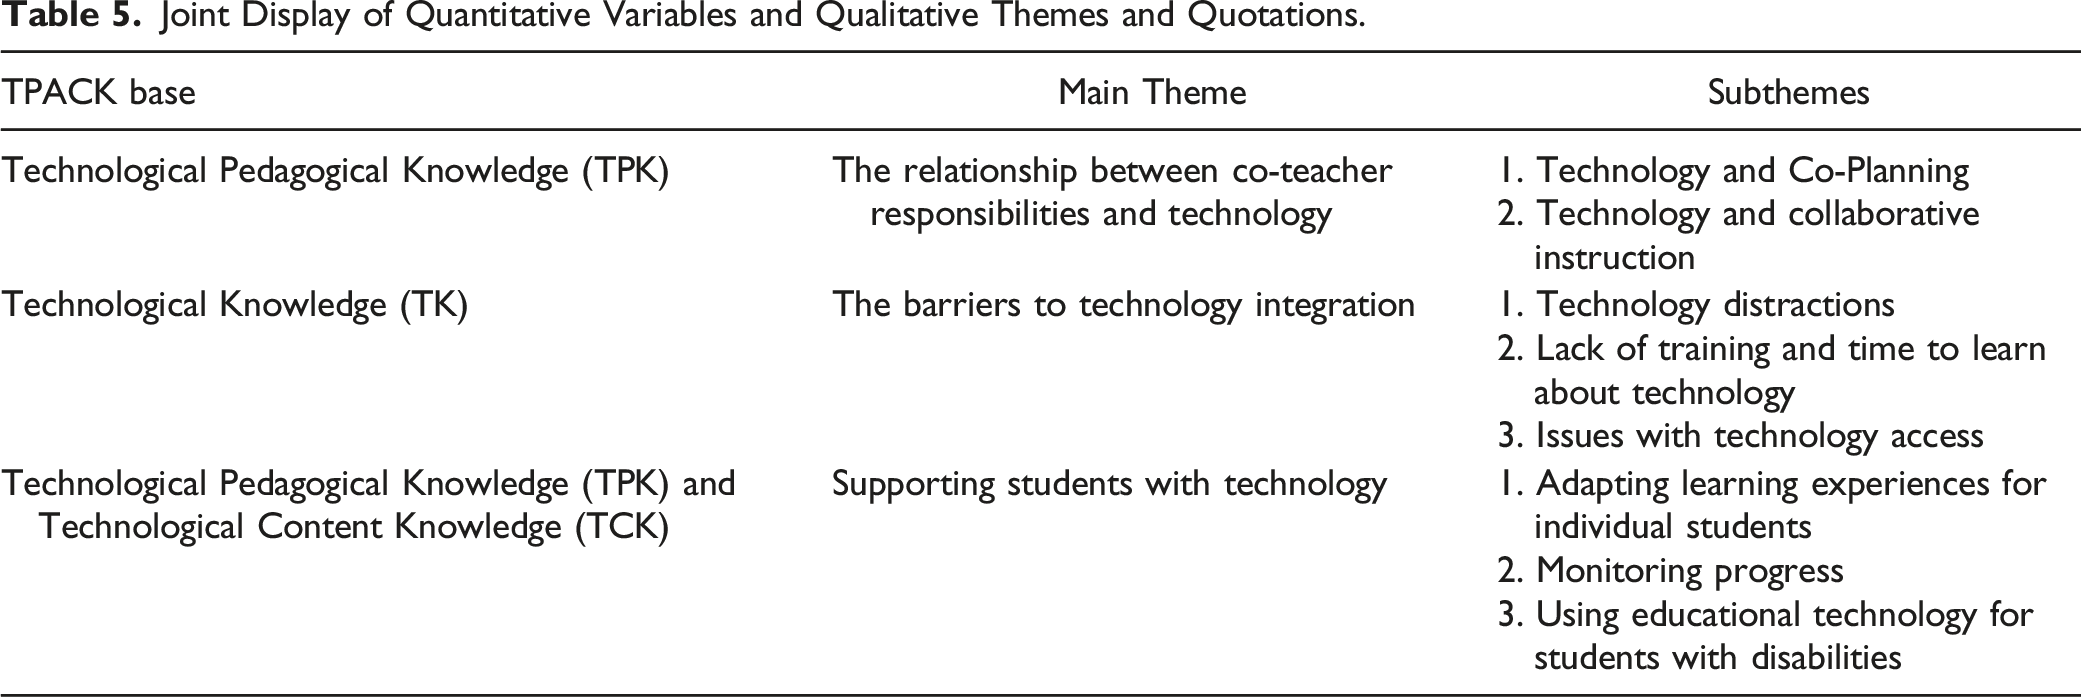
One of the themes was the relationship between co-teacher responsibilities and technology and included the sub-themes focusing on technology and co-planning and technology and collaborative instruction. With regard to co-planning, participants listed a variety of ways that technology was utilized in the instructional planning process. Participants discussed having access to their partner’s lessons and resources, including slide presentations, their Google Drive folders and files, and the artifacts on their learning management system. Several participants described using a collaborative document, such as a Google Doc, to document their daily and weekly plans. Within the models of co-teaching, participants each admitted that the level of technology usage varied depending on the model that was being used. For example, team teaching at the interactive board used more technology than when a teacher would do parallel teaching or alternative teaching.
The second theme was barriers to effective technology integration. More specifically, the co-teachers frequently mentioned barriers such as technology distraction, lack of training and time to learn about technology and issues with technology access. There was a large variation in the discussion of technology as a distraction, including several discussions of students with IEPs being distracted by their district-provided devices. Additionally, the ability to easily access and play games was a well-documented distraction. Some co-teachers discussed the advantage of using device monitoring software to support their students who may be distracted by outside websites during digital lessons. Many participants shared that they would like to learn to use technology but have minimal time to engage in professional development. Finally, there were a variety of discussions regarding bandwidth and Wi-Fi issues related to technology usage in their inclusion classes.
The final theme focused on supporting students with technology, including adapting learning experiences for individual students, monitoring progress, and reimagining instructional technologies as assistive technology. Co-teachers discussed using adaptive technologies, such as Achieve 3000, CK-12, No Red Ink, and IXL to assign individual work to support a student’s specific needs. These tools were also used to track and monitor student progress in real-time by the co-teacher, which helped provide data points when reporting on IEP goals. Another discussion was how instructional technologies were being used to support students with disabilities in the inclusion classroom. For example, several teachers said that all students in the inclusion class receive assistive technology, such as text-to-speech, as opposed to just allowing students with an IEP to access that support. Device monitoring tools, such as GoGuardian, were being used as more than just a way to watch student activity on their 1:1 device. Teachers reported using this platform to provide individualized, discrete support to students through the teacher-to-student chat feature, and to keep the student on task during independent work.
Research Question Three
Joint Display of Quantitative Technology Attitudes Variables and Qualitative Quotations.
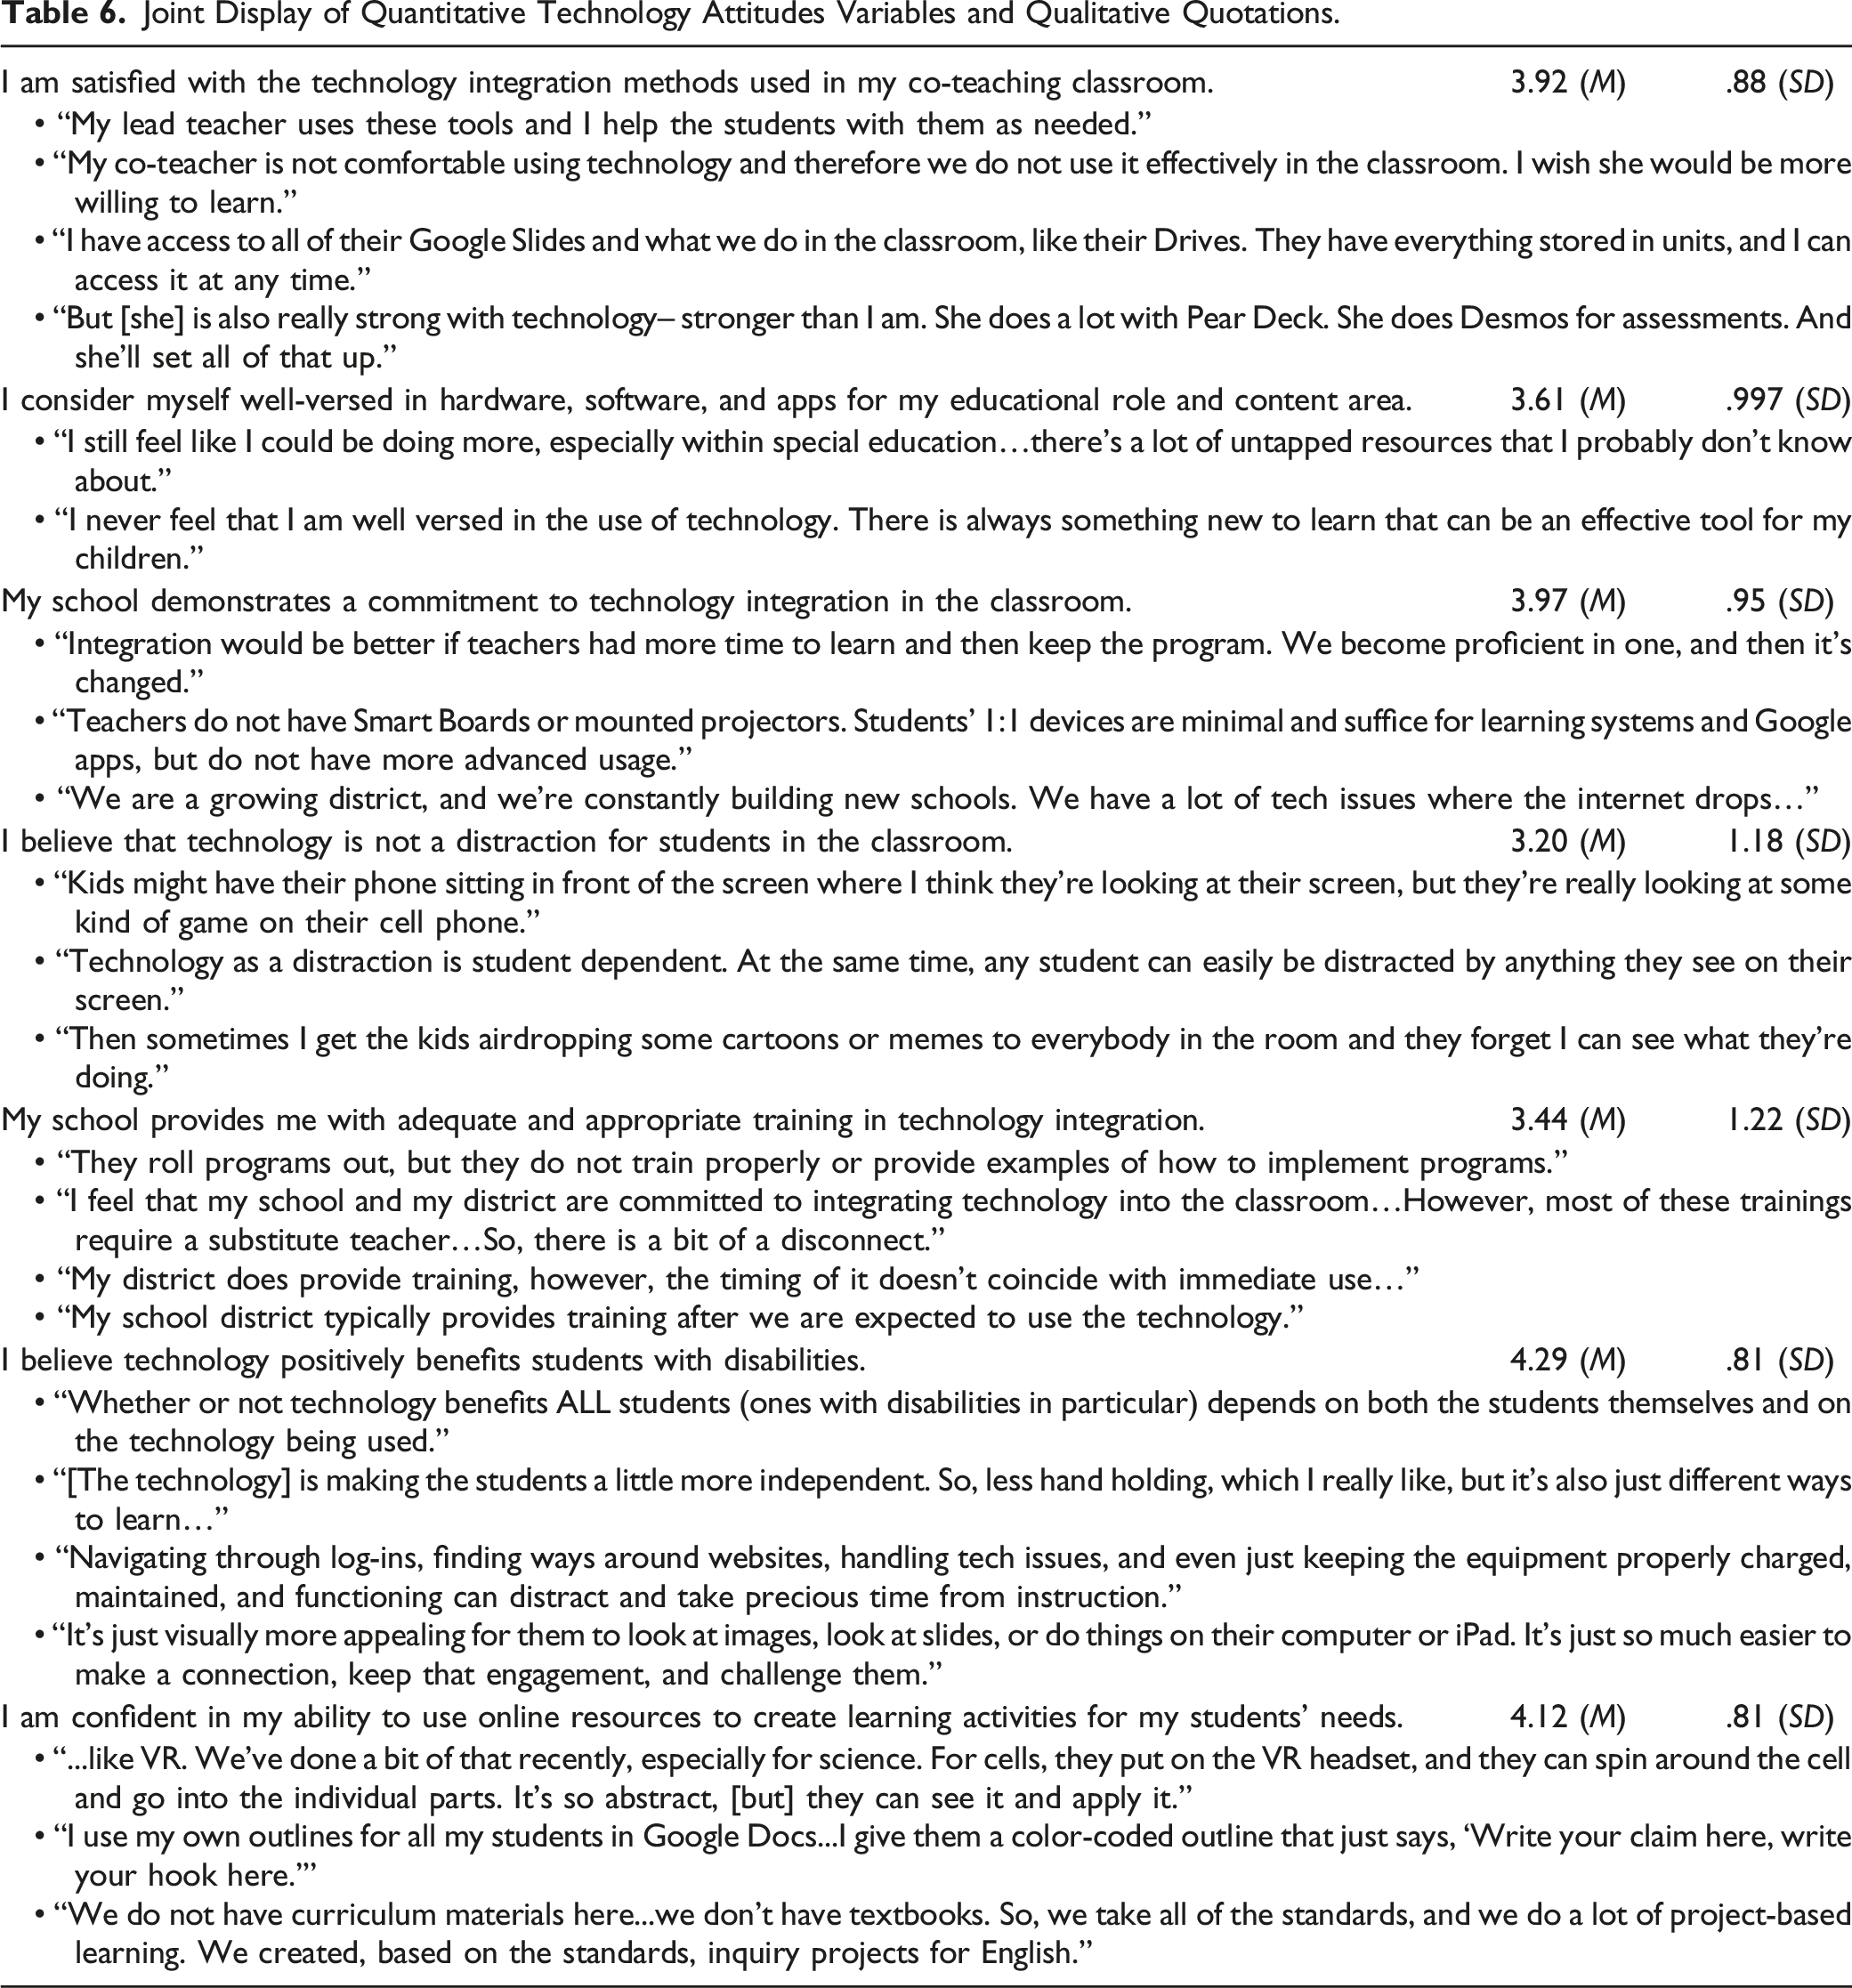
There were several survey items that connected to the qualitative theme of the relationship between co-teacher responsibilities and technology. The item “I am satisfied with the technology integration methods used in my co-teaching classroom” averaged 3.92, with a .88 SD. This level of satisfaction can be explained by the qualitative responses, where participants provided examples of how they were using technology to co-plan and co-instruct with their general education partner. For the most part, the qualitative responses seemed to be content with the technology usage. The examples provided oftentimes fell within the TPK knowledge base, combining pedagogy with technology integration.
There were several survey items regarding technology barriers that could be explained by participant responses. For the item about self-awareness of hardware, software, and apps for educational role, the average score was 3.61. Within the responses, participants explained that they had a strong foundation, but there was always more they could learn about technology to support their students. When considering the level of distraction within technology, the corresponding survey item received a 3.20 average with a 1.18 SD. The participant responses show the discrepancy within the responses, with some teachers explaining the ways students are distracted by their devices and others suggesting that this issue can be overcome.
The survey item about the benefits of technology on students with disabilities received a high level of agreement with a 4.29 average. The responses within the qualitative phase helped to explain this high score, with participants providing a variety of examples of how their students have had positive outcomes from technology usage including increased independence and engagement. Similarly, the survey statement about the participant’s ability to use online resources and create activities for student needs received a high average of 4.12 and a .81 SD. The qualitative responses included examples of adapting technology tools to make learning more hands-on, accessible, and adaptive for learner variability.
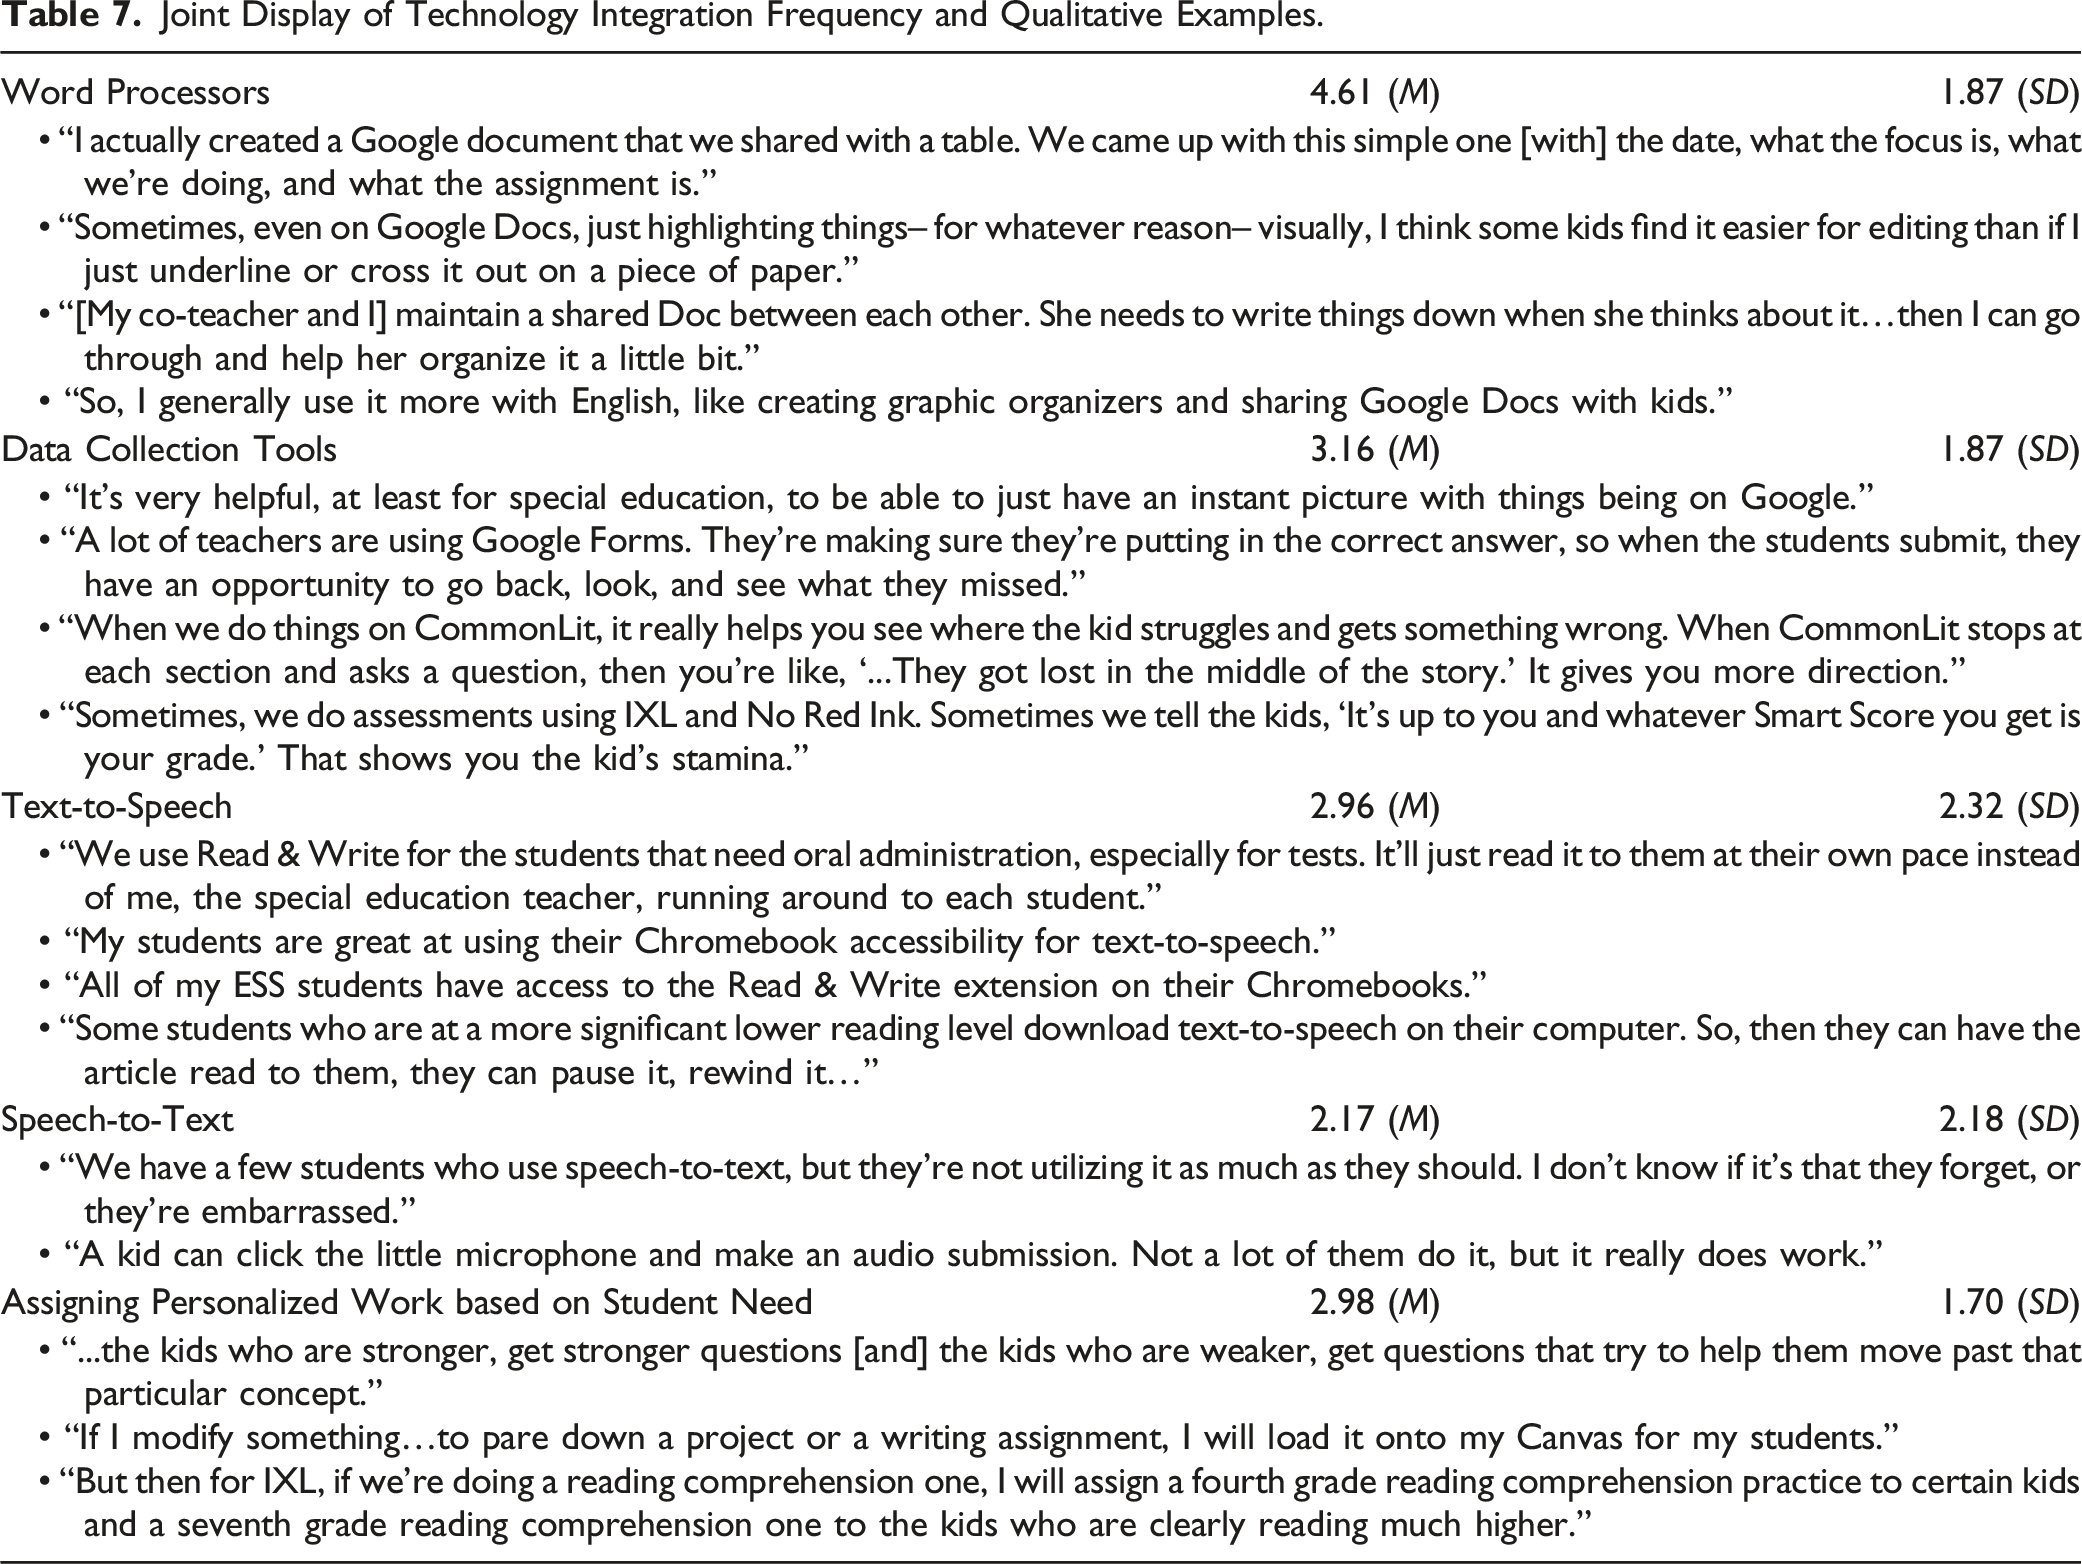
Joint Display of Technology Integration Frequency and Qualitative Examples.
Discussion
Within the quantitative phase of the study, participants revealed higher scores in the statements related to the teacher’s desire to learn and their comfort with new technology trends, with each statement receiving over a 4.00 average. These results demonstrated consistency with previous studies, where special education co-teachers were reported to have positive feelings related to technology usage (Mohamed, 2018; Satsangi et al., 2019). Participants were found to use word processors and email most commonly on average in a given week. This result connects to the frequently cited recommendation of using collaborative documents and email correspondences for planning among co-teaching partners (Brown et al., 2013; Scruggs & Mastropieri, 2017; Villa et al., 2013).
In the qualitative phase, the lived experiences of the interview participants produced several themes. In discussing how they use technology with their partners, the special education co-teachers described how the technology integration changed depending upon the co-teaching model they were using in a particular lesson. This finding is consistent with the conclusion that co-teaching models should vary based on the grade level, learning or lesson objectives, and instructional activities (Vӓyrynen & Paksuniemi, 2020). Additionally, participants explained how their level of technical knowledge, or that of their co-teacher, was a potential barrier to technology integration. According to Anderson and Putman (2020), when a teacher or student does not have the technical understanding of how to use a digital tool or resource, the level of usage in the classroom is impacted.
Within the coding for the qualitative data, the TPACK framework was used, including using the knowledge bases and hybrid bases to tag specific words and phrases from the interviews and open-ended responses. During the coding process, the statements were more frequently aligned with the TPK base, which focuses on having an understanding of how to use technology within the context of specific and appropriate instructional activities. This result suggests that special education co-teachers more frequently refer to technology usage with regard to instruction, as opposed to content area or in isolation. Previous research suggests that special education teachers commonly discuss technology regarding student performance and learning goal progress, whereas their general education partners more frequently connect technology to their content area (Courduff et al., 2016).
The juxtaposition of the two phases of the study allowed for clarification and explanation of the quantitative results. For example, within the quantitative scores, the teachers had low levels of agreement with the statement about their school providing adequate professional development for technology. However, there was higher variability within this response, showing that participants varied in their feelings about district-provided training. Co-teachers have often reported feeling underprepared regarding technology training and preparation (Okolo & Diedrich, 2014). The qualitative responses explained that participants wanted to learn more about technology, but had no opportunities to do so, or their district provided training sessions, but the timing was not appropriate.
There were some discrepancies between the quantitative results and qualitative statements. For example, participants in the survey averaged a 4.29 on the statement that focused on technology as being beneficial for students with disabilities. However, the qualitative transcripts and responses showed a range of disagreement with that statement with several participants arguing that technology is not beneficial for all students with disabilities. This discrepancy is consistent with the study by Kennedy and Boyle (2017), which concluded that while technology is advantageous, it is not a universal solution for all students.
Word processors and text-to-speech software both received high levels of integration from the survey participants. Word processing programs were used 4.61 times per week, on average, and text-to-speech was used 2.96 times per week, making it the most frequently used assistive technology tool. In the qualitative responses, participants described using word processors to collaboratively plan with their partner and create modified assessments and instructional materials for their students. This use was suggested by Scruggs and Mastropieri (2017), who recommended that co-teachers use a shared digital document to take notes, plan, and communicate. For text-to-speech, qualitative responses frequently referred to using this accessibility feature, stating that it allowed students with disabilities to complete the same or a similar task to their peers. Nordström et al. (2018) produced a study with similar results, finding that text-to-speech tools allowed students with disabilities to effectively work on the same assignment as their classmates.
Limitations and Future Research
One of the limitations of this study was the focus on special education co-teachers. General education co-teachers might have additional perspectives to consider within technology integration. As a result, a future area of consideration for research would be to focus on both general and special education co-teachers, or specifically work with current co-teaching pairs within a classroom. This study could also be examined at the experience level. There were participants who had been co-teaching for over a decade, as well as co-teachers who were in their first year within this inclusion model. Additional analysis could be conducted to determine whether years of experience have an impact on technology integration attitudes and practices.
Another limitation of this study was the timing. The study was conducted during the second full year of the COVID-19 pandemic. While many schools in the United States were functioning in-person during this time, there were some schools that transitioned back to hybrid or fully virtual learning. This shift could have impacted the frequency numbers within the survey since a hybrid or virtual co-taught classroom will require more technology. There was also a difference between the level of technology integration indicated on the survey and the actual technology use in the classroom. For example, in the qualitative phase, the participants who were in the lower outlier of technology usage still described ways they were using digital tools and resources in the classroom. There was a difference between the number of times they used technology in a given week versus their usage described in the interviews. This area may offer an opportunity for future exploration.
Conclusion
The creation of the joint display containing both quantitative and qualitative data allowed for several themes to emerge. By using the qualitative data to explain the quantitative survey results, four conclusions can be drawn from this study. The first conclusion is that special education co-teachers would be interested in more timely and appropriate technology professional development. This conclusion can be explained by the lower level of agreement with the statement about schools providing appropriate technology integration training, which also had a higher SD. Within the qualitative response, participants expressed their desire for additional training that both meets their schedule and their needs. This conclusion can be connected to the TK base of the TPACK framework.
The second conclusion is that special education co-teachers are asynchronously co-planning with their partner. Co-planning is often a barrier to successful co-teaching, as partners do not have adequate time to plan together. Participants in this study shared this sentiment, expressing minimal to no collaboration time with their partners during the school day. Google Docs, spreadsheets, slide presentations and shared Google Drives and calendars were some of the asynchronous, digital alternatives completed by co-teachers to overcome this barrier. This conclusion relates to the TPK knowledge base of the TPACK framework because it connects technology integration with instructional practice, in this case, planning.
Finally, the third conclusion is that special education co-teachers tend to focus their technology integration on student needs. Instead of emphasizing the subject matter, the participants’ responses more frequently fell within the TPK base of the TPACK framework. This result can be seen through how frequently TPK was coded within the qualitative results. When the participants described their lived experiences, their examples connected back to specific instructional practices, as opposed to content area skills.
Since many districts continue to adopt a co-teaching model of inclusion within their classrooms, it is essential to study the experiences of special education teachers working within this model. With technology becoming more commonplace in the classroom, studying technology within the co-teaching model is also necessary. The results from this study have the potential to provide guidance on potential training topics and strategies for teacher training, as well as recommendations to better support co-teaching partnerships.
Footnotes
Declaration of Conflicting Interests
The author(s) declared no potential conflicts of interest with respect to the research, authorship, and/or publication of this article.
Funding
The author(s) received no financial support for the research, authorship, and/or publication of this article.