



Abstract
We propose a method for creating groups against which outcomes of local pretest–posttest evaluations of evidence-based programs can be judged. This involves assessing pretest markers for new and previously conducted evaluations to identify groups that have high pretest similarity. A database of 802 prior local evaluations provided six summary measures for analysis. The proximity of all groups using these variables is calculated as standardized proximities having values between 0 and 1. Five methods for creating standardized proximities are demonstrated. The approach allows proximity limits to be adjusted to find sufficient numbers of synthetic comparators. Several index cases are examined to assess the numbers of groups available to serve as comparators. Results show that most local evaluations would have sufficient numbers of comparators available for estimating program effects. This method holds promise as a tool for local evaluations to estimate relative effectiveness.
Keywords
Classical randomized control trials have served as the gold standard for assessing efficacy and effectiveness of preventive interventions (Flay et al., 2005). These are characterized by comparing sufficient numbers of randomized treatment and control cases that are pretested using standardized measures and then followed longitudinally over time. Randomized control trials are expensive to conduct and, among other challenges, require that sufficient untreated cases be recruited for randomization to occur. Nonetheless, designs that include randomization, when well executed, are a preferred method for drawing causal inferences.
In contrast, many local evaluations of substance use prevention interventions are characterized by small-scale implementations. Randomization to condition is preferred if it is possible and for some local evaluations, it is entirely feasible and should be pursued. However, for many local evaluations, randomization to condition is typically not an option either because of limits to funding, availability of untreated units, or lack of expertise. When control or comparison groups are available, they are typically small samples for which the assumption of pretest similarity is tenuous and the power to detect treatment effects is limited. Moreover, both formal and informal substance use prevention services are arguably ubiquitous, and it is likely the comparison group is also receiving an intervention.
In a recent nationally representative survey, 85.2% of schools reported implementing a substance use or school crime prevention program (U.S. Department of Education, 2011). Relatively few of the programs adopted (7.8%) are supported by research-based evidence of effectiveness. Of these, fewer than half meet minimal standards for fidelity of implementation (U.S. Department of Education, 2011). Finally, long-term tracking of participants is usually not included in evaluation plans of disseminated programs due to expense and logistical challenge that are beyond the capability of local evaluation teams.
There is no doubt that when compared to randomized control trials, any approach to evaluating local implementations will suffer a decrease in internal validity. Nonetheless, in the dissemination environment, the emphasis on accountability requires that for those evaluations where randomization is not feasible and control or comparison groups are not available, new methodologies for assessing relative effectiveness need to be developed and tested. It is not expected that such methods would ever replace randomized control trials as a source of evidence about efficacy, but they may provide an additional source of evidence about effectiveness. The need for methods to document effectiveness will only increase as dissemination expands.
To address these challenges, we propose a design adapted from economic and policy research that will allow local evaluators and prevention program implementers who do not have access to control or comparison groups to assess local program effectiveness. We propose both the development of specific methods and an infrastructure that will meet these needs. The study that follows describes our approach and, using data from a summary database of over 800 pretest–posttest trials of the All Stars substance use prevention program, provides results demonstrating how appropriate comparison groups can be identified and how synthetic comparison results may be interpreted.
The term synthetic controls has been used in economic and policy research and is often referred to in the context of difference-in-differences designs (Slaughter, 2001). For example, Abadie and Gardeazabal (2003) used what they referred to as synthetic controls to study the economic cost of social and political conflict. In their study, they used per capita gross domestic product to compare the Basque region of Spain characterized by high levels of terrorist activity with weighted averages from other regions of Spain that had no such activity to estimate the relative cost of terrorism on local economies. In a more recent report, Abadie, Diamond, and Hainmueller (2010), estimated the effects of California’s tobacco control program using synthetic controls as comparisons. They created a synthetic control that mirrored the values of predictors of cigarette consumption in California prior to the passage of Proposition 99. To do this, they provided weighted averages of five alternative states.
Our immediate goal is to develop methods applicable to the local evaluation of evidence-based drug prevention programs. There have been numerous randomized control trials conducted evaluating these programs. One option is to use control group performance from these prior research studies to serve as the basis of comparison. Unfortunately, the characteristics of participants in research trials may not be sufficiently similar to participants in local implementations to warrant comparison. For example, there may be sample or setting differences that make some comparisons inappropriate. There can be historical differences in rates of behavior (Johnston, Bachman, O’Malley, & Schulenberg, 2009). Further, posttests in most local evaluations typically occur immediately after implementation while intact groups of participants are still assembled, whereas many research-based studies may delay posttest surveys between 6 and 9 months postintervention, further complicating such comparisons (Tobler et al., 2000).
In the current and future environment of widespread dissemination, local program implementers need not ask, “Is the program efficacious when compared to no program?” Rather, the more appropriate questions are, “Are my results better, worse, or about the same when compared to other implementations of the same program with similar students?” and ultimately, “How do results for this program compare to alternative programs when applied to groups similar to mine?” There is currently a dearth of data answering these questions; dissemination trials are rare and alternative methods for answering these questions have yet to be developed and tested.
The synthetic comparator strategy, which we introduce for assessing the effectiveness of local prevention programs, posits that measurably similar comparison groups can be created for evaluators using summary data from other local evaluations. It should be realized at the outset that relying on only summary data obviates many interesting analysis opportunities, but it creates others. Most social programs already collect performance data; however, methods to exploit these data for estimating effectiveness are rare. By focusing on these performance data and metadata describing the sample, setting, and intervention, several issues inherent in using multisite individual-level data are avoided. Chief among these are that data accretion is simplified (local evaluators need to provide only summary values to a central data repository) and the data are de-identified prior to submission (student and agency identifiers are stripped). The cost of collecting these data may also be reduced as only performance data require student-level reporting.
Three requirements need to be satisfied for this method to be reasonably employed. First, there needs to be access to relatively large numbers of groups from which synthetic comparators can be drawn. (“Group” in this article refers to summary data from an intact group in a single setting receiving the same intervention.) Second, similar (but not identical) outcome measures need to have been employed. Third, there needs to be a reasonable method by which pretest equivalence is establish or estimated.
The first and second criteria, having a large number of groups from which counterfactuals can be drawn and having common measures, require a systematic approach to the collection of local evaluation data. Many states and funding programs require the collection and reporting of such data. Outcome data from multiple previously completed local evaluations can thus serve as a source of counterfactual data against which a given evaluation’s data can be compared. What may be lacking is a supportive infrastructure that allows easy access to data that are organized for comparative assessment.
The third criterion requires that groups selected to serve as synthetic comparators be similar to the index group in measurable and important ways. In randomized control trials, the purpose of randomization is to create balance by eliminating inequality between conditions. After randomization, equality is assumed for both measured and unmeasured qualities (Campbell, 1969; Cook & Campbell, 1979). To increase the chances of pretest equivalence being achieved, many randomized control trials have used a stratified assignment procedure in which groups are initially paired on known demographic characteristics, such as age, ethnicity, or socioeconomic status first, and then randomized so that one pair is entered into the treatment condition and one into the control or comparison condition (Graham, Flay, Johnson, Hansen, & Collins, 1984). Other approaches, such as propensity scoring (D’Agostino, 1998) and, more recently, doubly robust estimation (Bang & Robins, 2005) have been shown to be very effective in creating balanced samples when extensive covariate data at the individual level are available and the purpose is creating balance between the two groups. These methods increase confidence that the treatment effects observed can be attributed to the delivery of the treatment and are not a result of the assignment to condition (Stuart, 2010).
In contrast with the above approaches, our purpose for matching is not inferential, but descriptive. Since all groups have received an intervention, our purpose in matching is to identify that subset of groups, which share similar measured attributes to the index group to examine the index group’s results with reference to the distribution of comparator’s results. Moreover, we begin with the assumption that only relatively simple data will be available (pretest and posttest summary measures and metadata). Therefore, this approach satisfies the third criterion by establishing markers of pretest similarity and selecting only those groups that fall within defined proximity limits. Specifically, a method is proposed to identify groups, known as synthetic comparators that are measurably similar to the index group and that can thereby serve as counterfactuals against which local performance can be judged.
It has been shown that substance use differs based on sample characteristics. Demographics are measures of convenience and may not be optimal for matching (Shadish, Clark, & Steiner, 2008). However, they are often related to substance use and, compared with other sample attributes, are broadly available. For example, among students, age is clearly related to drug use onset with prevalence increasing with each year of maturation during adolescence (Johnston et al., 2009). Males are more likely to use marijuana and drink heavily than females, but not more likely to smoke cigarettes or use inhalants (Wallace et al., 2003). This study also revealed that drug use is related to ethnicity–race, with lower rates of alcohol and other drug use among African American and Asian youth, and more common among White and Hispanic youth, with the greatest prevalence found among Native American youth. Thus, at a minimum, the age, gender, and ethnicity–racial background of samples should be known. However, beyond these general demographic predictors of substance use, the prevalence of drug use at pretest can also vary. Thus, in addition to background characteristics, pretest drug use and any other pretest predictors of drug use are important characteristics that are ideally accounted for in considering what groups to include and exclude as synthetic comparators.
There are two primary goals for the present study. First, we document how pretest proximity can be established using a variety of pretest measures in an existing database. Second, we use proximity data to demonstrate how synthetic comparator groups can be constructed. To show how these results might be used by a local evaluator, we also include a sample descriptive outcome analyses. The data assembled by these methods are amenable to more sophisticated analytic approaches; however, our focus for the current study is limited to demonstrating a method of creating proximity data and a strategy for creating proximally similar groups from group summary data.
Our approach is to use pretest proximity data to construct synthetic comparators against which index cases may be compared. The proposed strategy uses multiple dimensions for establishing proximity that can be both jointly and independently examined. Knowing the degree to which limits will apply is crucial in understanding constraints that may be required. For example, we will demonstrate how characteristics of the group (age, gender, ethnicity–race, drug use, and socioeconomic status) can be used as markers of proximity and how they can be combined and weighted to increase the known similarity between an index group and groups selected for comparison.
Method
Sources of Data
To complete this study, we use data from the Evaluation Lizard database (Hansen et al., 2006), an ongoing proprietary commercial service that accumulates data primarily (but not exclusively) from local evaluations of All Stars, an evidence-based middle school drug prevention program (Harrington, Giles, Hoyle, Feeney, &Yungbluth, 2001). Evaluation Lizard provides surveys either in paper or in online formats. Surveys are tailored to the intervention being tested and typically include demographic data (age, gender, and ethnicity–race), mediating variables targeted by the intervention (Hansen, Dusenbury, Bishop, & Derzon, 2007), and behavioral outcome measures, typically recent alcohol, tobacco, marijuana, and inhalant use. Data are stored in a database in which demographics, behaviors, and mediators targeted by the program being evaluated are coded so that general classes of measures share common coding characteristics. In the simplest example, when assessing gender, previously administered surveys have used a variety of questions and have worded responses for male and female in multiple ways; however, coding across all surveys has been standardized so that male and female equivalents are always coded using the same numeric values. Information about what program is being delivered and the setting in which it is delivered is also recorded. Thus, whether a program is delivered in a school or after-school context is known. The dates of data entry are recorded as surveys are scanned or completed online. There is an option to provide self-report and observer–report information about fidelity and quality of delivery. Clients receive online reports that summarize pretest, posttest, and pretest–posttest changes in mediators and behaviors. Clients can download their own data for further analysis.
In consultation with their Institutional Review Board (IRB) and clients of the Evaluation Lizard agree or decline to share data under an end user license agreement. The default option is for data sharing. This agreement specifies that all agency and personal identifying information is stripped when data are shared. Further, when data are used for analyses such as those proposed here, no individual-level data are used; only group-level summary data for all variables are considered. This approach was approved for this study by both the IRB with local oversight and the Initial Review Group (IRG) that reviewed the grant application.
Clients that use this system are typically school systems and community service agencies. The accumulation of surveys through local evaluation projects since 2003 provides us with access to a large, growing, and relevant database for demonstrating this method. Data from 1,416 distinguishable groups involved in local evaluations of drug prevention programs were available at the time of analysis. The number of student surveys collected for each group varied between 1 and 2,999 with a mean of 26.2 students per group. Groups with fewer than 10 students accounted for 18.1% of groups; those with more than 50 students accounted for 7.2% of groups. Thus, approximately 75% of groups have between 10 and 50 students. After dropping groups because of missing data (the absence of measures of gender, age, ethnicity–race, targeted mediating variables, or drug use), lack of pretest–posttest student matching, small Ns, and data on interventions other than All-Stars, 802 groups were retained for the current analysis. These data all reflect pretests that were collected just prior to program implementation and posttests collected just after program completion. No distinction between school and after-school setting has been imposed.
Proximity Analysis
Student responses to pretest surveys and institutional data were used to create six group-level variables: (1) gender, (2) age, (3) ethnicity–race, (4) targeted mediating variables, (5) drug use, and (6) free and reduced lunch.
Gender was calculated to be the proportion of females in each group. Overall, 50.5% of students within groups were female (SD = 19.1%).
Age included the proportion of students for each year of age. Thus, the proportion of 11- to 14-year-olds, and so on, was calculated for each group. The mean age of groups was 11.4 years (SD = 1.31) with a range between 10.0 and 15.6 years.
Ethnicity–race reflected the proportion of students in each group who represented themselves on surveys as being African American or Black, White, Native American, Hispanic, Asian, Pacific Islander, or other. It was possible for Hispanic students to have also been of another race. All other classifications were superseded by coding these students as Hispanic. Thus, for each group, ethnicity–race was the proportion of students in each group who reported each classification. Overall, 26.8% of participants were Black, 39.6% were White, 16.3% were Hispanic, and smaller percentages were Native American (2.4%), Asian (2.3%), Pacific Islander (0.7%), or other.
Targeted mediating variables included five pretest measures commonly used to evaluate All-Stars (McNeal, Hansen, Harrington, & Giles, 2004). These included multiple item scales that assessed (1) bonding to school or the community group in which the program was implemented, (2) commitment to avoid drug use, (3) normative beliefs (perceived prevalence and acceptability to the peer group), (4) lifestyle incongruence, and (5) parental monitoring and communication. Responses for all measures were standardized and a principal component factor analysis revealed that all mediators loaded on a single factor explaining 69.6% of the variance with weights of .713 for bonding, .936 for commitment, .829 for normative beliefs, .857 for lifestyle incongruence, and .819 for parental monitoring and communication. For the purposes of this study, all mediators were combined into one scale.
Pretest drug use included the proportion of students in each group who said they (1) used alcohol, (2) experienced drunkenness, (3) smoked cigarettes, (4) used smokeless tobacco, (5) used marijuana, or (6) used inhalants on dichotomous measures of recent (past 30-day) use. Thus, for each group, there were six drug use indicators that each varied between 0 and 1. On average, 8.9% of students in groups reported consuming alcohol, 5.0% reported recent drunkenness, 5.6% reported smoking cigarettes, 1.8% reported using smokeless tobacco, 3.8% reported using marijuana, and 4.0% reported using inhalants.
Free and reduced lunch was calculated using information about location associated with the zip code in which the intervention was delivered. Using 2010 Census data, these values were then transformed into proportion of children within the zip code who were eligible for free or reduced lunch, which was then ascribed to the group. On average, 52.5% of students (SD = 18.5%) in zip codes associated with groups in this study were enrolled in free and reduced lunch programs.
Proximity was calculated for all pairs of groups for each of the five group-level variables. All analyses were completed using Statistical Package for the Social Sciences 20.0. Using output generated with the hierarchical cluster analysis subroutine, Euclidean proximity matrices were calculated, one for each of the group-level variables. With 802 groups, each matrix contained 321,202 [(802 × (802 − 1))/2] pairs of groups.
Standardized Proximity (P)
The goal of calculating proximity values is to create a standardized metric that will allow comparison across variables. Thus, calculations of standardized proximity are designed to produce values between 0 and 1 for all variables, with 0 representing an identical group and 1 representing the greatest observed difference. We introduce standardized proximity (P) as a metric that can be applied to a wide variety of measures. The variables included in this analysis demonstrate this variety in terms of the adjustments needed to standardize proximities. Specifically, five types of variables for which a different method of calculating P is required have been identified. Examples of each follow.
Type 1: single indicator proportions
For variables that have only one marker and that are expressed as proportions, standardized proximities, P gender and P lunch, are calculated as the absolute difference between proportions for each pair of groups. For example, the Euclidean distance for two groups with proportions of females of 0.4 and 0.5 is 0.1. Because proportions vary between 0 and 1, the maximum distance between pairs of groups for proportions of gender and for proportions of students receiving free and reduced lunch is 1, which meets our requirement for standardization.
Type 2: single indicator scaled values
For variables that can be reduced to values with minima of 0 and maxima of 1, P can be calculated by arithmetic adjustment. For example, each of the measures that were combined to create the target mediator score was originally scored from 0 to 10, with higher values being thought of as more desirable. Thus, while not a proportion, when divided by the maximum value (10), this variable could be treated as were P gender and P lunch with a natural minimum of 0 and maximum of 1. Standardized proximities for pretest mediators (P mediator) were therefore calculated to be the absolute difference between pairs once the original scale score had been divided by 10.
Type 3: multiple indicator proportions that sum to 1 and have no interpretable mean
For ethnicity–race, each group had multiple indicators that summed to 1. For ethnicity–race, P is the square root of the sum of squared differences between each element that contributed to the variable. For example, within a group, the proportion of Black (B), White (W), Hispanic (H), Asian (A), Native American (N), Pacific Islander (P), and other (O) students always sums to 1. The equation for calculating the proximity of ethnicity–race, Peth , for each of the 321,202 pairs of groups is therefore:

Because the value for any single indicator ranges between 0 and 1, the maximum distance between pairs of groups is the square root of the maximum observed distance. For example, between an all-Black group and an all-White group, the Euclidean distance is equal to
Type 4: multiple indicator proportions that sum to 1 and have an interpretable mean
Age consisted of the distribution within each group of multiple age groups. Each group also had an overall average age. Thus, there were two components that were considered in calculating the standardized proximity for this variable: distribution and mean. The distribution component for age was calculated in a parallel manner to the proximity calculation for ethnicity–race. That is, for each pair of groups, the distance between each was calculated using Euclidean distance divided by
Type 5: multiple indicator proportions that sum to values greater than 1
In our data, drug use presents a situation for which a different approach to standardizing proximity is required. The Euclidean distance of pairs of groups’ drug use is calculated by summing the squared differences between pairs for all drug use indicators:

Because each indicator itself could vary from 0 to 1, the maximum theoretical distance between pairs based on pretest drug use could be
Results
Distribution of Proximities
The distribution of proximities for gender (P gender) among groups was positively skewed with an average distance between pairs of .206 (SD = .175; see Figure 1). Among groups, the overall pattern of distribution when examining the balance between genders was for most groups to fit one of three patterns: (1) groups were balanced in terms of males and females or, less frequently, they were (2) all male or (3) all female in their composition. Thus, groups had many relatively close matches that could be drawn upon to create synthetic comparators with a high degree of similarity.

Distribution of standardized proximities for all pairs of classes based on the proportion of females in each class.
The distribution of age among groups (P age) had a similar distribution (see Figure 2). Indeed, if anything, there was closer proximity among groups on average (mean = .121; SD = .120), meaning that the similarity among groups would make it generally easy to find close matches that could be used as synthetic comparators. This homogeneity reflects the fact that data from the 802 groups (mean age = 11.42; SD = 1.31) were primarily garnered from evaluations of the first year of a middle school program.
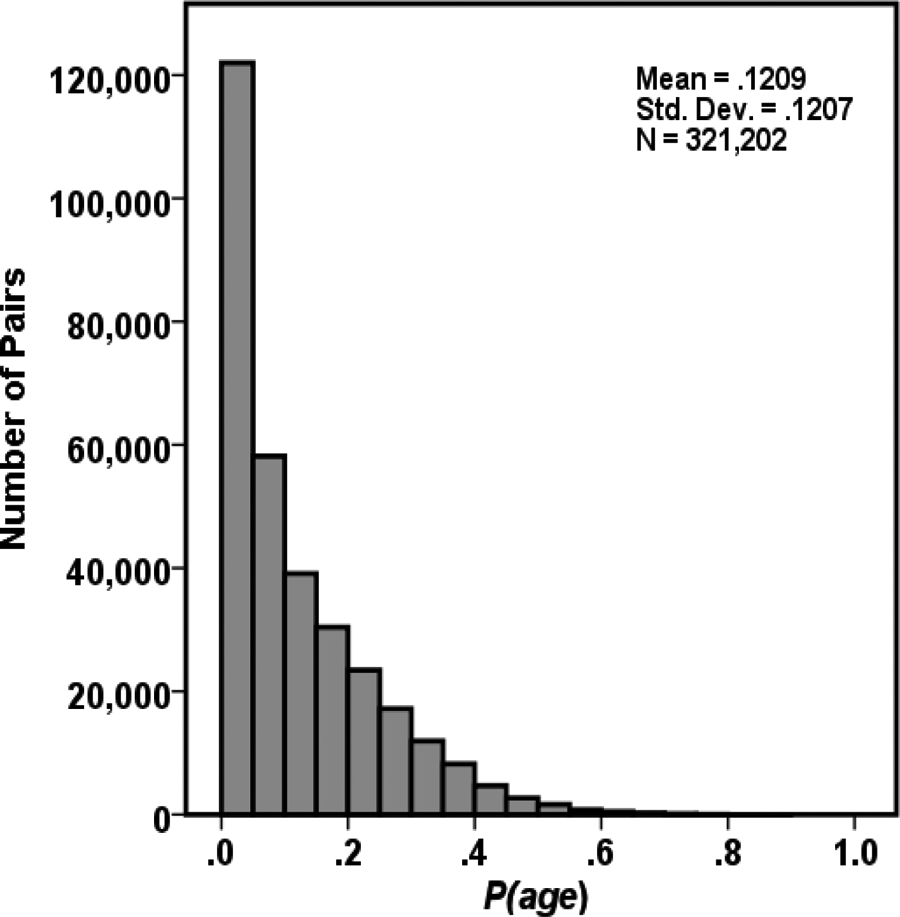
Distribution of standardized proximities for all pairs of classes based on average age × distribution of age categories in each class.
The analysis of distributions of Peth (ethnicity–race) yielded a bimodal distribution (see Figure 3). For about half of the groups, there were a fairly large number of possible comparators that were similar. On the other hand, there were also many groups for which a comparison would involve using dissimilar ethnic or racial groups.

Distribution of standardized proximities for all pairs of classes based on the distribution of ethnicity–race categories in each class.
For this analysis, mediator values were transformed to a 0 to 1 scale. In the transformed scale, 1 represents the most desirable outcome. Overall, combined mediators had a mean of .756 and an SD of .096. The proximity for pairs of groups for their scores on targeted pretest mediators (P mediators) suggested groups were generally similar (mean = .100; SD = .090; see Figure 4).

Distribution of standardized proximities for all pairs of classes based on the distribution of pretest mediators in each class.
Pretest drug use (P drugs) had low overall proximity (mean = .131; SD = .144; see Figure 5). This reflects the fact that the overall prevalence of any drug use among students who completed pretest surveys was relatively rare. Only few groups reported high prevalence of substance use and would thus not likely be comparable to the majority of groups.

Distribution of standardized proximities for all pairs of classes based on the distribution of pretest drug use in each class.
Many groups were proximal to each other when the proportion of students who were eligible for free and reduced lunch was assessed (mean = .203; SD = .166; see Figure 6). Because these data were drawn from an external source, they may not represent the actual socioeconomic status of program participants. They do, however, capture the socioeconomic context in which local evaluations were implemented.

Distribution of standardized proximities for all pairs of classes based on estimated proportion of students eligible for free and reduced lunch in each class.
Number of Groups Available for Analysis
To assess the degree to which it would be possible to find groups to serve as synthetic comparators against which performance on pretest–posttest change might be compared, we identified five groups (see Table 1). Groups A, B, C, D, and E, respectively represent the group with the closest average proximity across all six measures (A), the 25th percentile group (B), the median group (C), the 75th percentile group (D), and the group with the least observed average proximity (E). The question to be answered was, “If this group is used as the index group, how many groups would be available to serve as synthetic comparators given a specific requirement for proximity?”
Number of Groups of 802 That Are Available to Serve as Synthetic Comparators.
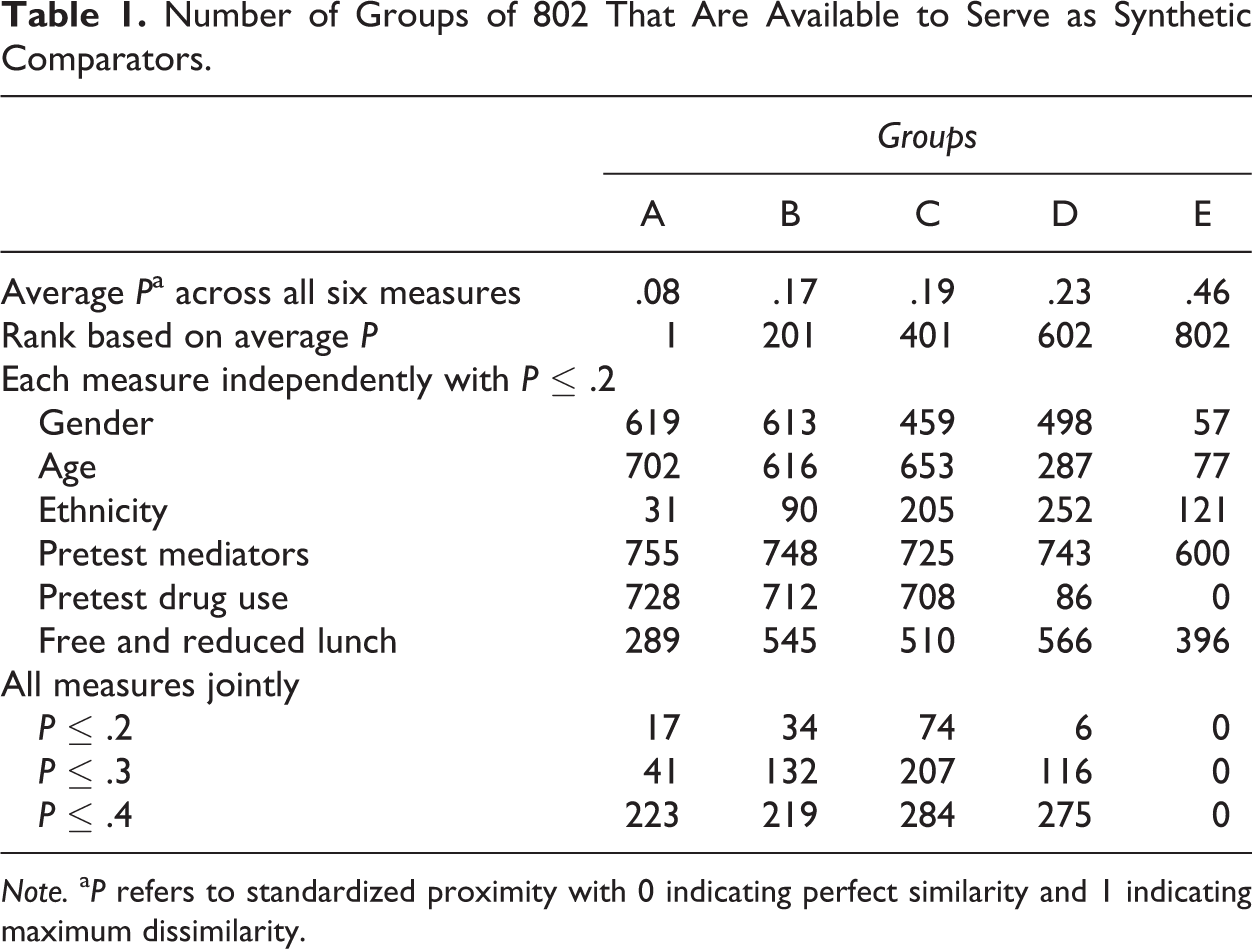
Note. a P refers to standardized proximity with 0 indicating perfect similarity and 1 indicating maximum dissimilarity.
There are a number of plausible methods that can be used for making this assessment; three are provided. First, the proximity limit for examining each measure independently was set at .2 (see Table 1). Thus, for example, if the distance for any proximity indicator was less than or equal to .2, the group was counted among the counterfactuals available for further analysis. A proximity limit of .2 is thought to represent a reasonable, albeit arbitrary, initial limit for selecting synthetic comparators. Second, proximity limits of .2, .3, and .4 were set using all six measures jointly. In this approach, only groups that qualify as being equal or less than each of these limits for all variables are counted. The third approach sets proximity limits independently for each indicator allowing us to vary each proximity limit as necessary to identify groups similar on some, but not necessarily all, measures. Because there are a near infinite number of adjustments possible, this third approach is not represented in Table 1.
As portrayed in Table 1, Group A is similar to many possible synthetic comparators when each criterion (age, gender, ethnicity–race, drug use, and free and reduced lunch) is considered separately. Over three quarters of possible comparison groups are similar to Group A in gender distribution and pretest drug use. Over half of the available groups are similar in terms of the proxy measure of socioeconomic status. However, less than a quarter of the available groups are highly similar in terms of age distribution and only about 7% of groups share a similar distribution of ethnicities and races. This latter finding is directly predictable, given the overall distribution of similarity among all groups when ethnicity–race was considered (see Figure 3). Seventeen groups met our arbitrary criterion of similarity when the joint proximity limit was set to .2.
As noted above, the third approach to identifying synthetic comparators is to set proximity limits independently for each of the indicators. For Group A, there were fewest matches on ethnicity–race, which limited the number of qualified counterfactuals to 17 when the proximity limit for all variables was set to be less than or equal to .2. Holding gender, age, pretest drug use, and free and reduced lunch constant at .2 and relaxing the proximity of ethnicity–race to .3 returns 34 counterfactual groups to serve as synthetic comparators.
Group B is similar to Group A in many respects, with slightly more groups qualifying for ethnicity–race and free and reduced lunch. Because of this greater similarity, when measures are considered jointly with limits of .2 and .3, there are more groups available to serve as synthetic comparators for Group B than are available for Group A.
Group C has the largest pool of potential synthetic comparators. Group D likewise fares well, although the number of potential synthetic comparators diminishes markedly for the jointly applied limit of .2 (N = 6). This drop is primarily attributable to only a few groups reporting similar pretest drug use. As with Group A, we held the proximity limits for gender, age, ethnicity, pretest mediators, and free and reduced lunch constant at .2 and increased the proximity limit for pretest drug use for Group D. At .25, there are 19 groups available to serve as synthetic comparators, at .3, there are 30 groups, and at .35 there are 39 groups.
It was only for Group E, which had the greatest overall distance from all other groups, that the availability of synthetic comparators became sparse. There are no groups at the limit of .2 that were similar in pretest drug use and it also appeared that this group is dissimilar to most other groups in terms of its gender and age distribution. In other words, Group E is unique in many ways that would require an expansion of several limits in order to find a suitable number of synthetic comparators.
Sample Local Evaluation Outcomes
The goal of using these methods is to select groups that can serve as counterfactuals for assessing a locally implemented program’s relative effectiveness. All groups included in these examples had received All Stars. Table 2 presents two groups, X and Y, for which reasonably proximal synthetic comparators were identified. For Group X, proximity was set to be .3, which resulted in 37 comparison groups. For Group Y, the joint proximity limit was set to be .275, which resulted in 30 comparison groups. Setting the proximity for Group Y to be .3 resulted in 80 comparison groups, which was deemed to be more than necessary.
Comparison of Percentage of Students Who Remained Nonusers From Pretest to Posttest for Two Local Evaluations.

Note. aNumber of synthetic comparison groups proximally similar to the index group.
bMean percentage of students not initiating use in synthetic comparison groups.
cMean percentage of synthetic comparison groups in which 100% of pretest nonuse remained nonusers.
As can be seen in Table 2, both Group X and Y had overall similar rates of abstaining from alcohol among pretest nonusing students (85.7 and 84.4%, respectively), and each index group reported higher initiation rates than other similar groups. On average, 95.3% of comparison students for Group X did not initiate alcohol use and 48.6% of Group X’s synthetic comparison groups reported no students initiating alcohol use (100% abstinence). Group Y, while similar to the performance of Group X, was not as successful when compared to their counterfactuals’ alcohol use. Among groups most similar to Group Y, fully 98.2% of students, on average, continued to not use alcohol and 62.5% of the groups reported no initiation.
Group X reported no initiation of substance use for the remaining behavioral outcomes, a marginal improvement over the total average percent of students not initiating substance use and much better performance than many of the groups with which it is compared. In contrast, the 32 synthetic comparators for Group Y reported that an even smaller percentage of students initiated substance use, with many of the groups reporting zero initiation by the group. For every behavioral outcome except smokeless tobacco (in which 100% of Group Y’s students remained nonusers), Group Y reported a smaller percentage of abstainers than their synthetic comparators.
Discussion
In the era of dissemination and accountability, having an alternative to randomized control trials is important for local evaluation. We propose a new strategy for evaluating the results of local implementations of interventions that relies on the use of summary data from previously conducted studies, which serve as synthetic comparators. We demonstrated that it was possible to meet the three criteria required for such an approach to function.
First, we found that there were sufficient numbers of groups to supply synthetic comparators in the Evaluation Lizard database for many (but not all) index groups. There are, as yet, no standards for determining how proximal synthetic comparators need to be. One strategy might be to establish a minimum number of counterfactuals and to increase the proximity limit until sufficient numbers of synthetic comparators are identified. Another might be to conduct analyses using multiple limits and then examine the degree to which consistency is obtained.
Several possibilities exist for groups for which few or no synthetic comparators are available. One strategy may be to select from among fewer proximity indicators. Another may be to weigh some indicators more heavily than others by varying the proximity limits on individual measures. There may be theoretical or empirical reasons for determining which indicators deserve more or less weight. In contrast with Mahalanobis matching, in which all interactions are considered equally important (Stuart, 2010), specifying proximity limits for each measure provides the user an empirical indicator of just how their sample is similar to, and differs from, the identified counterfactual groups. Ultimately, expanding available databases to include increasing numbers of groups may alleviate this issue. For example, multiple databases might be combined to increase the number of available proximal groups.
Second, because age, gender, ethnicity–race, and drug use had been systematically collected using similar metrics, synthetic comparators could be successfully examined for proximity. In order to allow data from multiple surveys to be comparable, we established standards for coding that greatly aided in the use of disparate measures. Free and reduced lunch was estimated from clients’ zip code information. It is only one of the several archived measures of socioeconomic status that can be used. Other indices, such as median household income, may also be used.
The third requirement we sought to satisfy was to develop a method for defining the proximity of potential synthetic comparator groups with the index group. In our case, we used Euclidean distance based on a standardized method whereby all indicators varied between 0 and 1. As depicted in Figures 1 –6, each of these indicators had a unique distribution. Our findings show that it is inherently easier to find close proximity among groups when gender and drug use are examined than when ethnicity and age are examined.
We proposed that basic demographic and behavioral measures that exist in archived databases can serve as a means of selecting synthetic comparators that will have a measurable degree of assurance. These measures are often used in randomized control trials as markers of pretest equivalence (Graham et al., 1984). These are also among the measures that are most often used in studies that apply matching methods (Stuart, 2010). It is therefore reasonable that these measures should also be used as the primary focus of selecting appropriate synthetic comparator groups. In our database, we were able to identify a large number of groups against which future local evaluations can compare results. Moreover, proximity can be readily calculated and does not rely on statistical tests of equivalence. The measured proximity of synthetic comparators provides a relative index of similarity, one not relying on theoretical distributions and estimated sampling error.
We introduced five methods for calculating the standardized proximity (P) for pairs of groups. There may be other methods for making these calculations that may emerge with varying types of data. The goal is to provide reasonable estimates of proximity that share a common metric so that, among variables considered, there is comparability. Perfect comparability is, of course, not possible as the variables included are often inherently dissimilar. For example, we included demographic (gender, age, and ethnicity–race), social psychological (targeted mediators), behavioral (drug use), and contextual (estimates of free and reduced lunch) variables in our analysis. There is no claim that a standardized proximity score of .2 to serve as a boundary for inclusion has equal meaning for each of these variables. Our goal was simply to provide an initial heuristic on which subsequent studies might shed increased understanding.
A criterion for selecting groups needs to go beyond the availability of appropriate demographic data to include appropriate mediators and behavioral measures. Thus, finding pretest proximity is only the first of several concerns that need to be addressed in developing a methodology for using synthetic comparators. In our example, we are able to identify multiple groups proximally similar to an index group on pretest mediators and on pretest behavioral measures of alcohol, tobacco, marijuana, and inhalant use.
One feature not examined was the fact that groups in the database were themselves local evaluations of evidence-based interventions. All data for this analysis compared local evaluations of All Stars. Data from other programs are included in Evaluation Lizard and are expected to become increasingly represented over time. Program and context are indicators that are coded in the Evaluation Lizard database. It will ultimately be incumbent upon the field to consider how to interpret findings when the outcomes of a diverse set of interventions are available for comparison using synthetic data. Comparing the relative effectiveness of different programs will require further careful consideration of methods.
Our analysis of the pretest–posttest maintenance of nonuse in our sample groups demonstrated one possible strategy for this method to aid evaluators in interpreting local evaluation results when comparison data are not otherwise available. In one case (Group X), with the exception of the onset of alcohol use by a sizable group, drug use onset outcomes revealed the program to be as effective as possible, and demonstrated that those very positive results are by no means assured in other similar groups receiving the same intervention. In the other case (Group Y), the group exhibited a relatively extensive onset of all drugs. Armed with only these data, local program stakeholders would likely conclude that the program does not prevent substance use. They may then seek to replace it with another program. However, it is clear from the comparison data assembled for other groups similar to Group Y, that the program is typically successful when delivered to similar populations and that perhaps the results represent a failure of implementation or substandard delivery. Rather than replacing the program, a time-consuming and expensive proposition, given this counterfactual evidence for other similar groups, program providers may, for example, decide to seek additional training, improve adherence to the written curriculum, and provide more administrative and other support to increase their program’s effectiveness. On the other hand, program providers may take the opportunity to look for another evidence-based program that better meets their needs, although guidance about how to do this is beyond the scope of what has been proposed here.
In randomized control trials, the question that is often answered has to do with whether or not an intervention can be considered to be effective relative to receiving no formal intervention services. However, in the case of prevention, an assumption of no preventive intervention for maladaptive behavior is probably unwarranted (Derzon, Springer, Sale, & Brounstein, 2005). Both formal and informal activities abound and are ubiquitous in modern society. In contrast, using synthetic comparators assesses the degree to which a specific local implementation of an evidence-based program is more or less effective when compared to prior implementations of the same program. If extended to examine results from different programs, proximally similar samples could be identified for each program, which could then be compared using meta-analytic techniques (Cooper, Hedges, & Valentine, 2009; Hedges & Olkin, 1985).
The chief limitation to this approach is that full implementation requires building a repository of findings and metadata surrounding these findings. Evaluation Lizard provided a convenient but limited database, to test approaches to constructing synthetic comparator data. The vast majority of data currently included in the Evaluation Lizard are from implementations of a single evidence-based intervention, All Stars, which limits but does not preclude many of the uses we can envision for this method. The current study simply tests a method for identifying proximally similar groups for comparison. In the future, we hope to expand the database to include groupwise results from local implementations of many other substance abuse preventive interventions that will allow us to examine the performance of these interventions relative to one another using proximally similar samples. Although our data are limited to substance abuse prevention, we believe the method can be applied in other fields in which local performance is assessed. This approach may also be useful for researchers who wish to study effective dissemination practices. For example, outcomes from proximally similar groups who received alternative training protocols can be compared or the results for multiple groups based on different proximal characteristics can be compared to assess generalizability.
This approach has several definable advantages. Among these are that it is relatively inexpensive to implement, has the potential to rapidly grow the evidence base for interventions, and that it assesses the relative effectiveness of interventions that are in actual use. Because we rely on groupwise data, many of the concerns surrounding confidentiality are obviated and data management is simplified. We believe results from synthetic comparator studies will eventually be useful to local program evaluators, program service providers, policy makers, program developers, and funders.
Footnotes
Declaration of Conflicting Interests
The authors declared the following potential conflicts of interest with respect to the research, authorship, and/or publication of this article: Dr. Hansen has a financial interest in Tanglewood Research that markets student survey and fidelity assessment services through the Evaluation Lizard service, which was used in this research.
Funding
The authors disclosed receipt of the following financial support for the research, authorship, and/or publication of this article: This project was funded by a grant from the National Institute on Drug Abuse, Grant Number R44DA026219.