
Abstract
This article shows how to compute statistical power for testing the main effect of treatment in three-arm cluster randomized trials. Using orthogonal coding, we derive the exact test statistic of the treatment effect and its non-central distribution. The non-centrality parameter in the omnibus test is found to be related to the non-centrality parameters in the contrast tests. A study of physician and pharmacist comanagement of patients’ blood pressure is used as an example to show the power computation in a three-arm cluster randomized trial.
Cluster randomized trials have become very popular in medical research because individual patients often cannot be randomly assigned due to ethical and logistical concerns. It is especially true when the intervention is administered at different clinics and hospitals. For instance, different patient care management strategies can only be implemented at the hospital level rather than at the level of individual physicians working at the same hospital.
However, cluster randomized trials tend to lack sufficient statistical power for testing the treatment effect when compared to the designs that randomly assign individual subjects. The design effect or the intraclass correlation can inflate the standard error of the treatment effect estimate in cluster randomized trials. As a result, the cluster randomized trial may suffer insufficient statistical power (Donner & Klar, 2010; Murrary, 1998). It is, therefore, crucial to conduct power analysis in planning a cluster randomized trial. The previous literature has provided approximate formulas for statistical power and sample size in a two-arm cluster randomized trial (Hsieh, 1988). Sometimes, the cluster randomized trial involves three arms, say, two treatment arms and one control arm (Perria et al., 2007; Zwar et al., 2010). The literature does not provide the formulas for computing statistical power in three-arm cluster randomized trials.
The existing software packages for statistical power in multilevel designs (i.e., PinT and Optimal Design program) do not accommodate more than two study conditions in cluster randomized trials. The overall test of any treatment differences among more than two study conditions is more difficult to compute than the test of two study conditions. The overall test requires special coding (i.e., orthogonal coding) to test multiple parameters in the relevant multilevel model. When there are three study conditions in the cluster randomized trial, the overall test corresponds to two parameters of two orthogonal contrasts among the three study conditions. The current software for multilevel modeling uses a Wald statistic to test multiple parameters, which is a chi-square statistic based on large sample approximation. However, such large sample approximation may not be appropriate when cluster randomized trials involve limited number of clusters. Further, it is difficult to estimate the overall effect size among more than two study conditions for power analysis. There is no standard way to relate the pairwise treatment effects to the overall effect size among more than two study conditions, which is required for computing power in the overall test.
In this article, we will use Helmert coding to relate treatment mean differences to the overall effect size for more than two study conditions. We will use an F statistic for the overall test instead of the Wald statistic. The F statistic is an exact test, and it is more accurate than the Wald statistic. We will then use an example to show the power computation in a three-arm cluster randomized trial.
Statistical Power in Cluster Randomized Trials
We can analyze the data in cluster randomized trials, using linear mixed models. The linear mixed model for a cluster randomized trial with three arms in matrix notation is given by:

where the vector

where
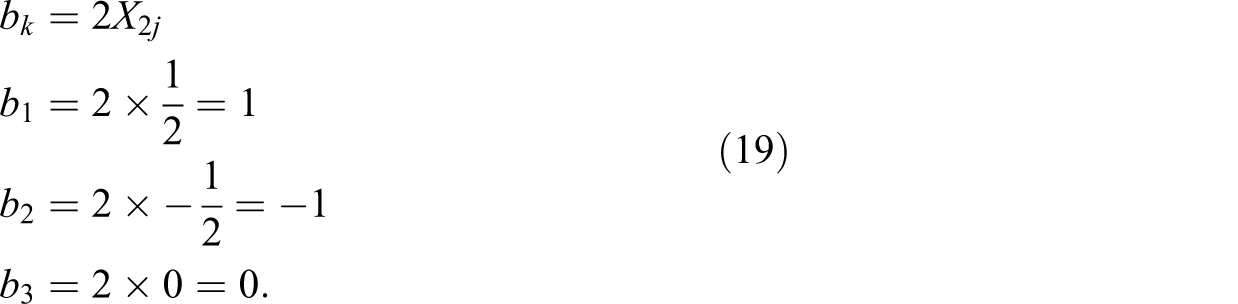
The first indicator

where

The intercept β0 is the grand mean. It is easy to see why the three coefficients correspond to the grand mean and the mean differences.
Taking expectation on both sides of Equation 2 produces the mean for each arm, that is,


The above formulas are useful for power analysis because the mean differences between the treatment conditions are straightforward and intuitive. Researchers naturally think about mean differences when they attempt to estimate the effect size in comparing different treatments.
The statistical test and power can be derived from the aggregated model based on cluster means. For planning purposes, we assume that the clusters are of equal size. The proposed approach also works when cluster sizes are not drastically different from each other. We therefore use a balanced design for the cluster randomized trial with equal cluster sizes. We can use one random term

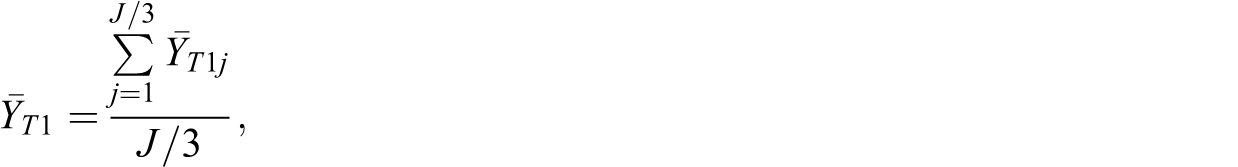
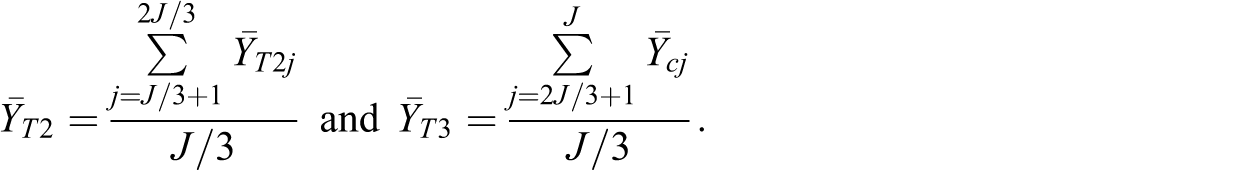
The cluster mean
The complex error variance

The estimate of the variance

The term SSW represents the within-arm sum of squares of the cluster means
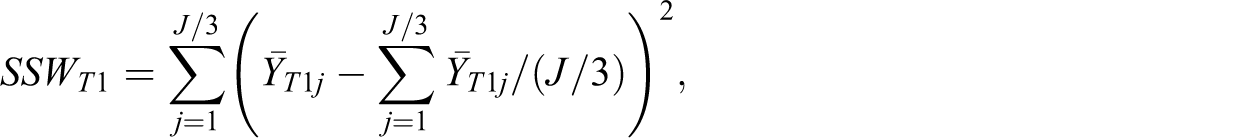
where
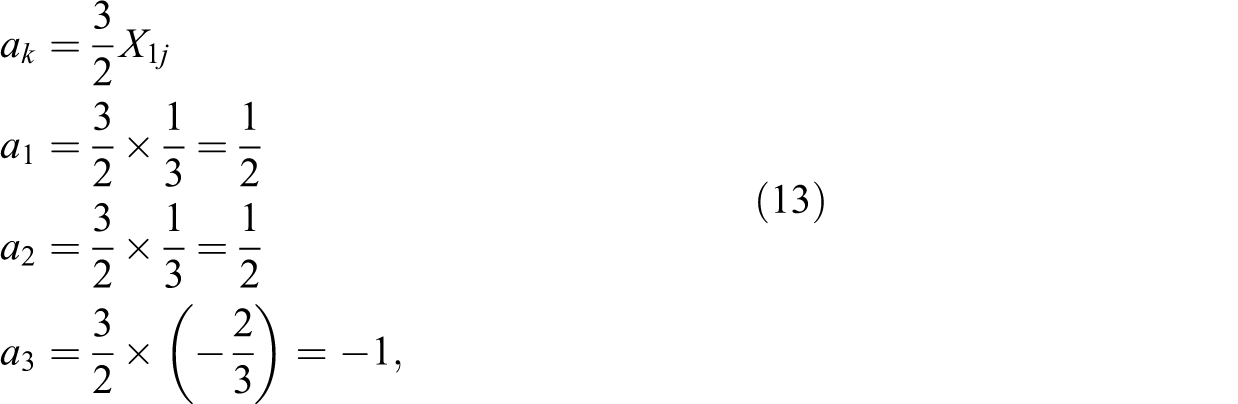
The estimate of the treatment contrast β1 is the weighted sum of the outcome means for the three treatment arms with weights being

where
where
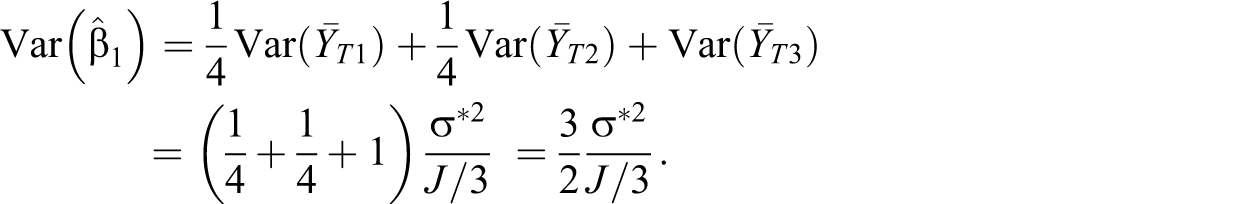
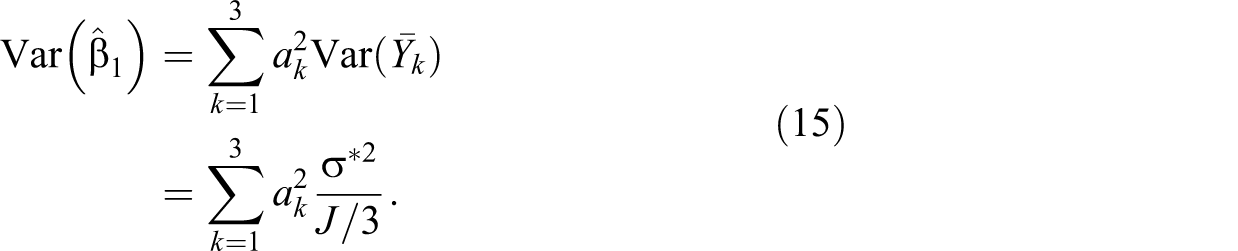
The average of the cluster means for each treatment arm has a common variance,

The variance of
Substituting

In general, we can write
where the multiplier

where
The estimated variance is

The test for the first Helmert contrast can be based on a t statistic with a degrees of freedom
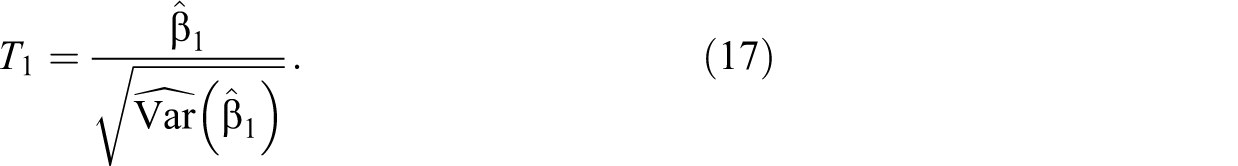
When the null hypothesis is true (
We can write the test for the second Helmert contrast
The estimate of the second Helmert contrast is

Its variance is

The estimated variance of

The test for the second contrast also uses a t statistic with the degrees of freedom

It has a central t distribution when the null hypothesis
It should be noted that the non-centrality parameter for a pairwise comparison between any two treatment arms takes the same form as
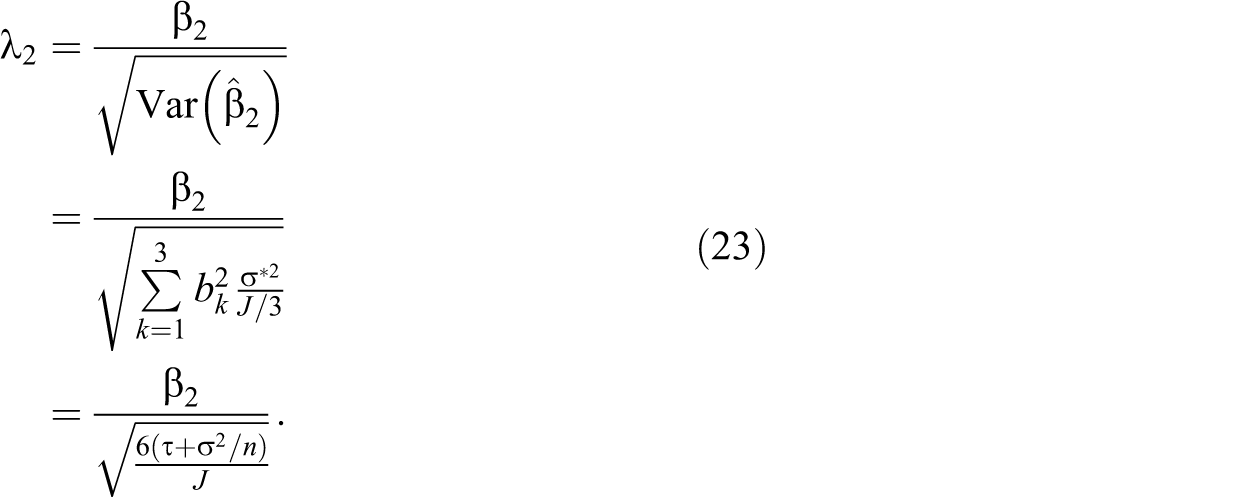
Statistical power for testing the contrasts can be formulated in one equation with subscript
where
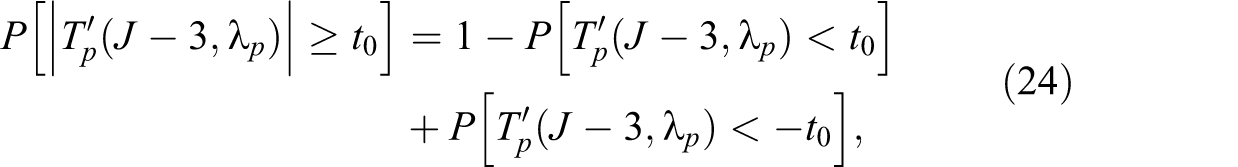
The omnibus F test examines the null hypothesis that the means of the three treatment arms are all equal

The F statistic has 2 degrees of freedom in the numerator and
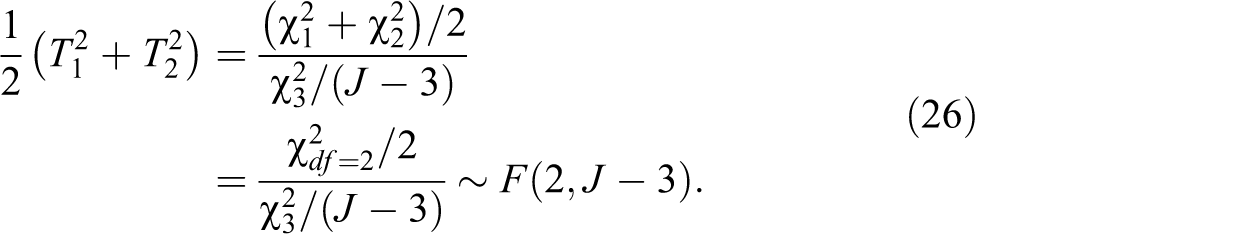
It is intuitive to see why the two squared t statistics add up to an F statistic. Squaring

Likewise,

Note that the two squared T tests share a common
The F statistic is more appropriate than the Wald statistic in testing multiple parameters in cluster randomized trials using multilevel modeling. The Wald statistic is a chi-square test based on large sample approximation (Raudenbush & Bryk, 2002). If the number of clusters
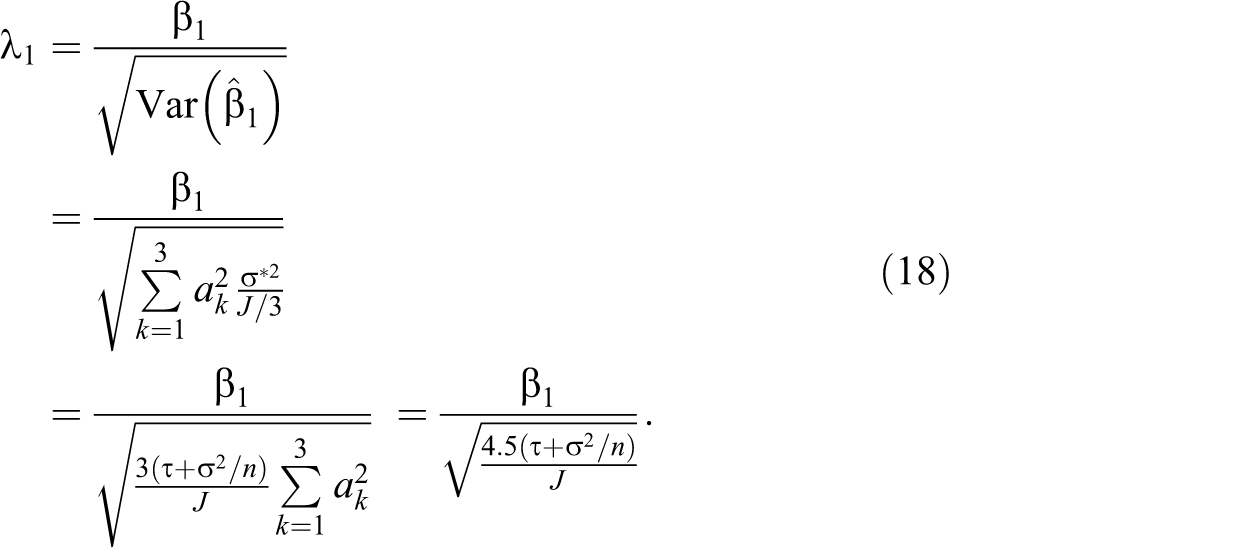
When the means of the three treatment arms are not equal, it suggests that

Under

where
In estimating the values for β1 and β2, we can start with simple effects between the treatment arms and the control arm,

We can then use the following relationship to convert the simple effects to the parameter values of β1 and β2:


Example
We use a study on physician and pharmacist cooperation in managing patients’ health care as an example. The intervention involves physicians and pharmacists following different protocols in managing systolic blood pressure among patients who suffer chronic kidney disease. Effective management of chronic kidney disease emphasizes strict blood pressure control to lower cardiovascular risk and slow the progression of the disease (DeLusignan et al., 2009). All the physicians and pharmacists affiliated with the same clinic will use the same approach to managing patients’ care. In this case, it is not feasible to randomly assign individual physicians and pharmacists to different interventions. Clinics are, therefore, randomly assigned to use different kinds of physician and pharmacist management. The study forms a cluster randomized trial. The first treatment,
The medical researcher hypothesizes that the first treatment arm reduces the mean systolic blood pressure by 5 mmHg (
Table 1 lists statistical power for the omnibus F test and the two contrast tests. It is easy to see that statistical power is not evenly distributed among the omnibus test and the contrast tests. The omnibus F tends to have sufficient power. The power for the contrast test depends on the mean difference between the contrasted treatment arms. The contrast

Statistical Power and Number of Cluster J.
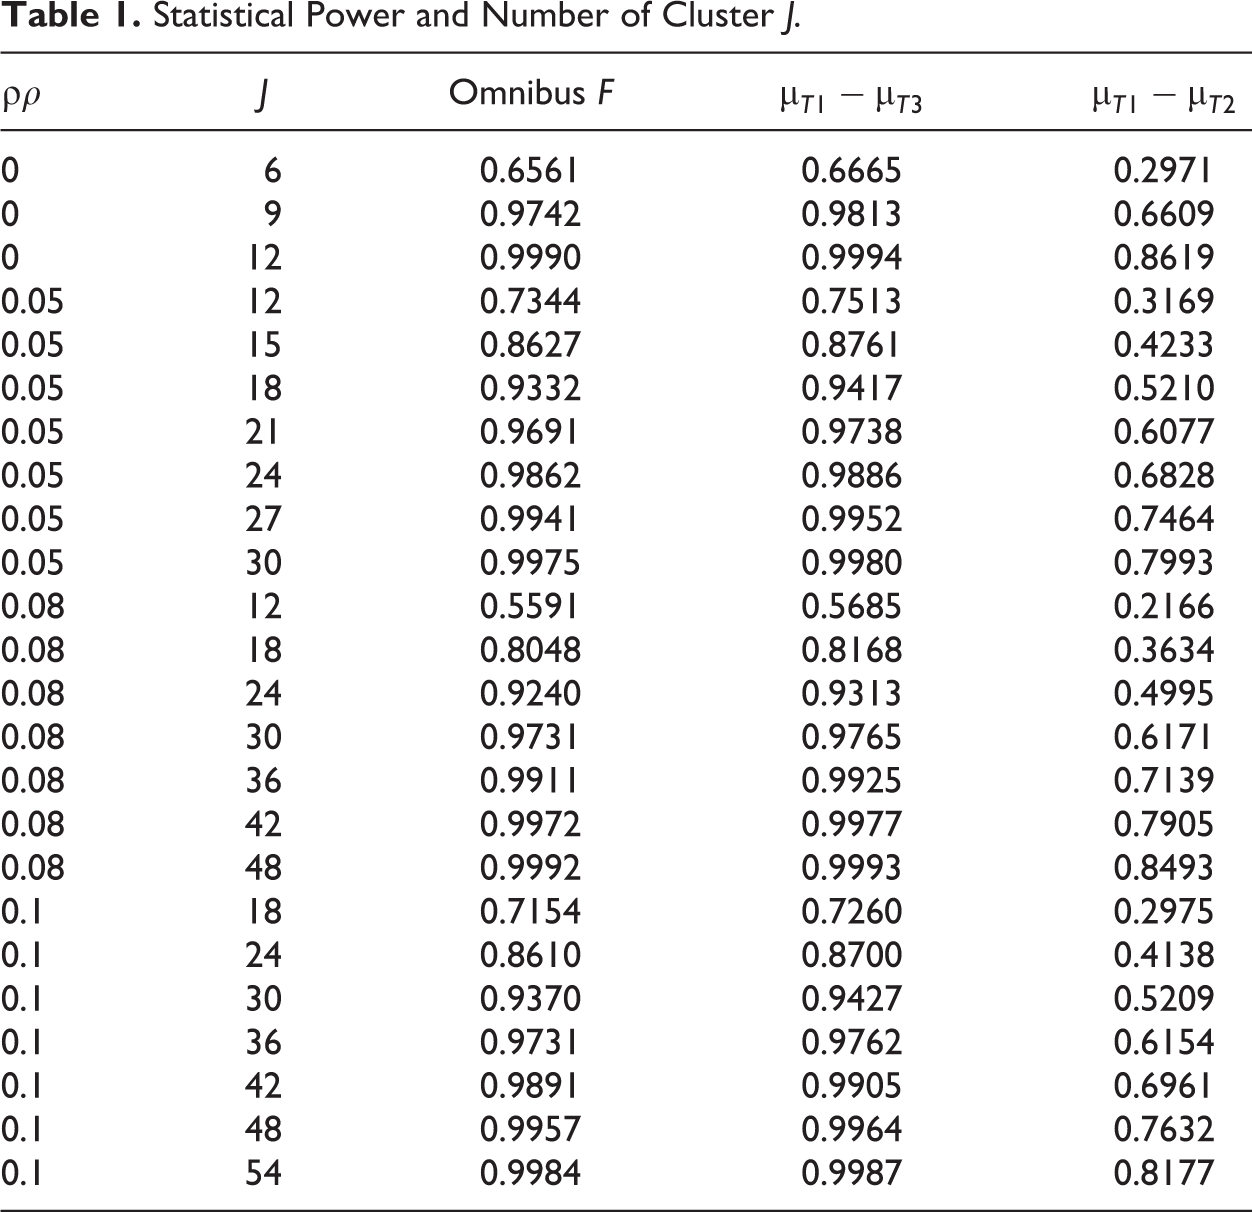
Therefore, statistical power for testing
For comparison purpose, we can plot the power for the overall test in the three-arm cluster randomized trial and the power for the test in the two-arm cluster randomized trial (Figure 1). We use the effect sizes −5 and −3 in the two-arm cluster randomized trial. The number of clusters J is held equal between the two-arm and three-arm cluster randomized trial. The dashed line at the top of the figure is for the larger effect size −5; the dashed line at the bottom is for the smaller effect size −3. The solid line represents the statistical power for the overall test in the three cluster randomized trial. The power in the three-arm cluster randomized trial is less than that for testing the larger pairwise effect size −5 but higher than that for testing the smaller pairwise effect size −3. The power for the overall test in the three-arm cluster randomized trial is between the powers of two separate cluster randomized trials with two arms. However, it requires more resources to run a two-arm cluster randomized trial twice to study more than two treatment conditions. If we add up the number of clusters in the two separate cluster randomized trials with two arms, the total number of clusters will be larger than those in the three-arm cluster randomized trial. In the former scenario, each two-arm cluster randomized trial includes a control arm. Overall, it is economical to combine the two-arm cluster randomized trials into one three-arm cluster randomized trial, as this can significantly reduce the study cost and time.
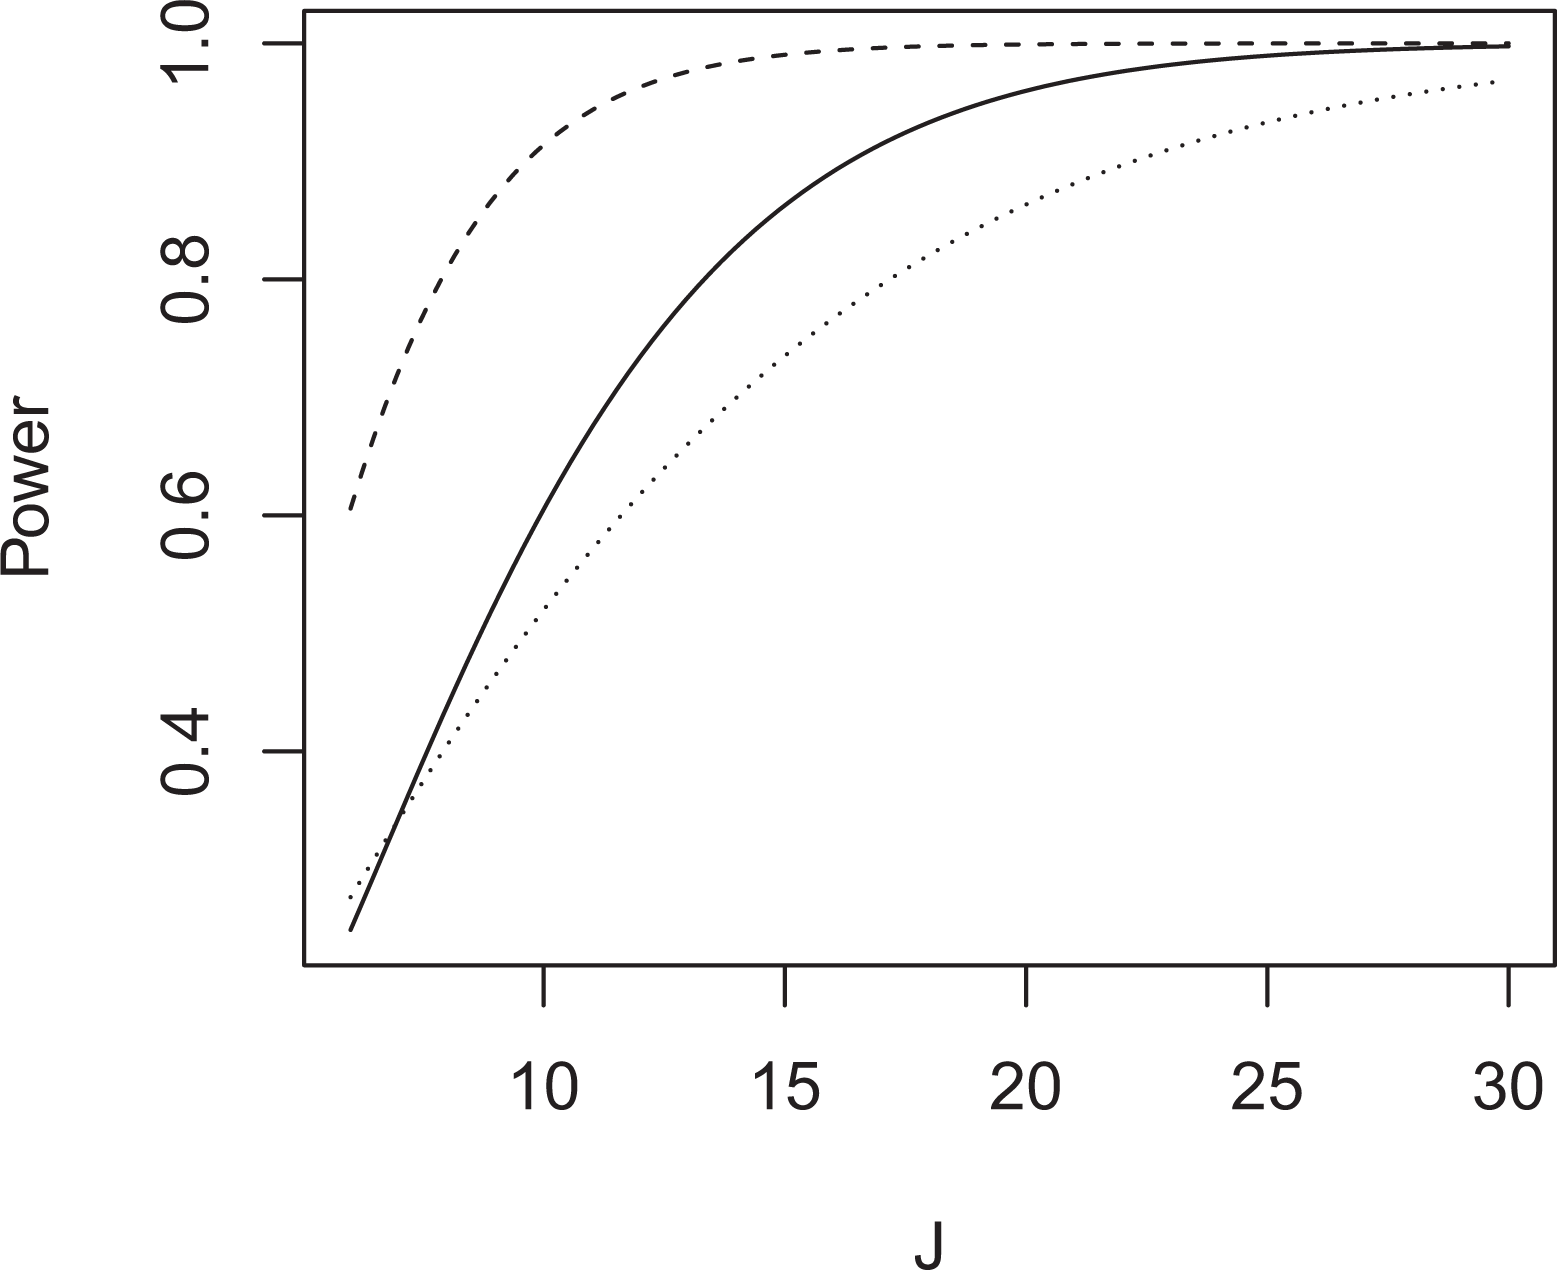
Statistical power in two-arm and three-arm cluster randomized trial.
Discussion
Cluster randomized trials have been increasingly used in health and medical fields because intact social settings need to be randomly assigned to treatment conditions due to ethical and logistical concerns. Treatment interventions are directly given to the entire social units, emulating how the treatment is actually implemented in practice. In pharmacotherapy studies, clinics and hospitals are often randomly assigned to the treatment and control arm. Occasionally, there are two treatment arms and one control in a cluster randomized trial. It is essential to calculate statistical power for testing the main effect of treatment in a three-arm cluster randomized trial because the design often lacks statistical power. The previous literature provides a method to compute statistical power in a two-arm cluster randomized trial based on normal approximation.
The current article shows the exact statistics for the overall test, and the contrast tests, and their statistical power based on the non-central F and t distribution. The F statistic is an exact test, and it is proven to be more conservative than the Wald statistic in testing the overall effect of treatment among more than two study conditions. Using orthogonal coding, we demonstrate an easy way to relate treatment mean differences to the overall effect size among more than two study conditions. The overall effect size can be decomposed into simple effect sizes, which are always meaningful in the research context (Lenth, 2001). Researchers can think about the treatment mean differences among the study conditions and calculate the overall effect size for the omnibus test. This facilitates statistical power analysis in planning a three-arm cluster randomized trial. Although the example does not include any covariates, the described method can be adapted easily to accommodate covariates in the cluster randomized trials. To account for covariates, we can reduce the variances by a certain percentage based on the correlation between the covariates and the outcome (Raudenbush, Martinez, & Spybrook, 2007).
The current article is limited to a single design in multilevel modeling, although future research can include other designs in multilevel modeling. For example, longitudinal studies have been increasingly analyzed as random coefficients model. In clinical studies, patients are often randomly assigned to the treatment and control at different sites and they are followed over an extended period of time. Such a design will call for more complex power analysis because the design not only involves sample size choice but also duration and frequency of the study (Raudenbush & Liu, 2001). Additionally, future research can be extended to power analysis for dichotomous outcomes in cluster randomized trials. The data analysis with binary outcomes typically uses a different estimation strategy than that with continuous variables. Statistical power for continuous variables cannot be directly applied. Power analysis for binary outcomes requires a completely different paradigm from the start. Although there has been tremendous progress in estimation theory of binary outcomes, little has been done on the relevant power analysis for binary outcomes in multilevel modeling. More research is needed to understand statistical power in testing binary outcomes in multilevel modeling.
Footnotes
Appendix
Declaration of Conflicting Interests
The author(s) declared no conflicts of interest with respect to the research, authorship, and/or publication of this article.
Funding
The author(s) received no financial support for the research, authorship, and/or publication of this article.