




Abstract
The Patient Reported Outcomes Measurement Information System (PROMIS) initiative aims to provide reliable and precise item banks measuring patient-reported outcomes in different health domains. The aim of the present work was to provide a German translation of the PROMIS item banks for satisfaction with participation and to psychometrically test these German versions. Cognitive interviews followed a forward–backward translation. Distribution characteristics, unidimensionality, Rasch model fit, reliability, construct validity, and internal responsiveness were tested in 262 patients with chronic low back pain undergoing rehabilitation. Results for the final 13- and 10-item German static scales (Satisfaction with
Introduction
The use of patient-reported outcomes (PROs) has recently become more and more important in clinical research and practice, especially for assessing the health status of patients with chronic conditions (Ader, 2007). According to international reviews on future PRO trends, there are two major approaches trying to overcome limitations of current instruments regarding precision, standardization, and data comparability: computer adaptive testing (CAT), and the development of item banks based on item response theory (IRT; Jette & Haley, 2005). Both approaches help keeping patients from having to answer questions that do not correspond to their particular level of disability. They also seek to ensure that patients only fill out a minimum number of questions, while meeting demands of precision (Cella, Gershon, Lai, & Choi, 2007).
The Patient Reported Outcomes Measurement Information System (PROMIS; http://www.nihpromis.org) is one of the most ambitious efforts to take both approaches into account. The aim of this National Institute of Health initiative is to provide a resource for precise and efficient measurements of patient-reported symptoms, functioning, and health-related quality of life that are appropriate for a broad variety of chronic conditions and for use in clinical research and practice evaluation (Cella et al., 2010). Calibrated item banks—developed following the IRT model—entail PRO measures that are reliable, valid, and easily administered and interpreted. They are also available for CAT. The PROMIS item banks are organized in a domain framework covering social, mental, and physical health domains (Cella, Yount, et al., 2007; Cella et al., 2010). The framework thus covers all key concepts of “health” which is defined as “a state of complete physical, mental and social well-being, and not merely the absence of disease or infirmity” according to the International Classification of Functioning, Disability and Health (ICF; DIMDI—Homepage ICF, 2013). Cella et al. (2010) provide an overview of the framework up to March 2010, consisting of 11 item banks so far (PROMIS® Version 1.0 item banks): physical function, fatigue, pain interference, pain behavior, sleep disturbance, sleep-related impairment, anxiety, depression, anger, satisfaction with participation in social roles and satisfaction with participation in discretionary social activities. While physical and mental health are widely acknowledged concepts of health, social health is a less commonly used concept (Dijkers, Whiteneck, & El-Jaroudi, 2000; Magasi & Post, 2010). Nevertheless, it is a concept that plays an important role in the context of treatments for chronically ill patients and is one of the key aspects (e.g., participation in daily life) that should be considered when measuring treatment outcomes (Haley et al., 2008; Jette, Keysor, Coster, Ni, & Haley, 2005; Salter, Foley, Jutai, & Teasell, 2007).
The item banks measuring satisfaction with participation are components of the PROMIS social health domain framework (Bode, Hahn, DeVellis, & Cella, 2010; Hahn et al., 2010). In this framework, social health is defined as “perceived well-being regarding social activities and relationships” (Bode et al., 2010, p. 2). The social health domain consists of a social function and a social relationship subdomain. The social function subdomain can be further broken down into the ability to participate and satisfaction with participation, the latter consisting of two subscales: Satisfaction with Participation in Social Roles and Satisfaction with Participation in Discretionary Social Activities (for a systematic description of the PROMS framework, see Cella et al., 2010).
While the PROMIS network failed to develop unidimensional and IRT-calibrated item banks for the ability-to-participate part of the framework in the first wave of data collection, the item banks for satisfaction with participation are now ready for use in English and Spanish language. To the best of our knowledge, no item bank has been fully translated into other languages thus far, except for short forms, profile items, or partial item banks (for more information see http://www.nihpromis.org/measures/translations).
The aim of this study was to translate the PROMIS item bank for satisfaction with participation (Version 1.0) into the German language (including a cross-cultural adaptation if necessary) and to test the psychometric properties of these German versions in a sample of patients with chronic low back pain undergoing inpatient rehabilitation. We examined the distribution characteristics, response rates, unidimensionality, IRT model fit, and reliability of the two scales. We also conducted sensitivity analyses and first analyses of construct validity. We decided to psychometrically test our German version in a clinical sample to follow the PROMIS network’s advice (Cella et al., 2010). We chose a sample of patients with chronic low back pain because of the epidemiological and economic significance of this chronic condition for the German health service system. In the year 2010, chronic low back pain was the second most common reason for inpatient rehabilitation in men and the fourth most common reason for women (Statistisches Bundesamt [Federal Statististical Office], https://www.destatis.de).
Method
Instruments
PROMIS Item Banks for Satisfaction With Participation
The PROMIS item banks for satisfaction with participation Version 1.0 were developed based on PROMIS Wave 1 data collected between 2005 and 2007. A group of experts developed items for each domain following a six-phase procedure: (1) identification of existing items, (2) item selection, (3) item review and revision, (4) focus group input, (5) cognitive interviews, and (6) final revision (Cella et al., 2010; DeWalt, Rothrock, Yount, & Stone, 2007).
Items covering satisfaction with participation in social roles include marital relationships, parental responsibilities, work responsibilities, and daily routines (e.g., “I am satisfied with the amount of time I spend performing my daily routines,” “I am satisfied with my ability to meet the needs of those who depend on me”). Items covering satisfaction with participation in discretionary social activities include activities with family or friends, leisure activities, or community activities (e.g., “I am satisfied with the amount of time I spend doing leisure activities,” “I am satisfied with my ability to do things for my friends”). Items for both subscales include response scales with five options ranging from not at all to very much and refer to a time frame of the last 7 days. Of the original 56 items measuring satisfaction with participation, 26 showed good psychometric properties in a study with general population members and were included in the item banks: 14 items measuring satisfaction with participation in social roles and 12 items measuring satisfaction with participation in discretionary social activities (Bode et al., 2010; Hahn et al., 2010). It is of note that, in a supplemental wave of data collection (2009–2010) with revised item pools, the PROMIS group created a new overall item bank Satisfaction with Social Roles and Activities (Version 2.0), which is no longer subdivided into a social role and an activity subdomain. This item bank was, however, not available when our research group received permission for the translation.
Pain, Anxiety and Depression, Quality of Life
In addition to a questionnaire on sociodemographics and the aforementioned PROMIS scales, participants were given disease-specific and generic instruments to complete. To assess pain intensity over the last 7 days, we used a 0–100 visual analog scale (VAS, 0 = no pain, 100 = extremely severe pain). Pain-related disability was assessed via the Pain Disability Index (PDI; Tait, Chibnall, & Krause, 1990, German version: Dillmann, Nilges, Saile, & Gerbershagen, 1994). The Hospital Anxiety and Depression Scale (HADS; Zigmond & Snaith, 1983, German version: Hermann, Buss, & Snaith, 1995) was used to assess anxiety and depression levels. Health-related quality of life was recorded via the SF-36 (Ware & Sherbourne, 1992, German version: Bullinger, Kirchberger, & Ware, 1995). All instruments were used to provide a description of clinical characteristics of our sample. The PDI was also used for the assessment of construct validity.
Translation Procedure
In 2008, our research group received permission by the PROMIS network to translate the Satisfaction with Participation item banks into German language. The item-translation procedure followed the Functional Assessment of Chronic Illness Therapy Translation Procedures and Guidelines (FACIT; Eremenco, Cella, & Arnold, 2005) proposed by the PROMIS initiative. This procedure is based on a strict forward–backward translation rationale consisting of six steps. In the first step, two native German-speaking project members independently made a forward translation of the 26 items. In the second step, another native German-speaking project member reviewed these translations and approved a preliminary German version. A native English speaker then translated this preliminary version back into English (Step 3). In Steps 4 and 5, the PROMIS network and some bilingual experts reviewed the translated items. In the final step (Step 6), a bilingual expert reviewed the items orthographically. All items were translated without any general problems because the scales do not contain any strictly culture-specific concepts as item banks for physical function do (cf. Oude Voshaar, ten Klooster, Taal, Krishnan, & van de Laar, 2012).
Cognitive Interviews
We conducted cognitive interviews using this first German version with 10 patients (mean age 48.7 years, 70% women) being treated for chronic low back pain in one rehabilitation center in Germany. Following the procedure described for the psychometric evaluation of the English original version, we used the thinking aloud and verbal probing techniques (Collins, 2003; DeWalt et al., 2007). These approaches enable a realistic presentation of the items and preclude a possible shift of answers to the following questions due to discussion of the previous items. Although some patients reported having some difficulty with abstract terms like “social activities” or “daily routines,” we observed no further comprehension problems associated with the items. Patients’ comments from these interviews were used to improve the item formulations and thus the instrument’s content validity.
Study Sample
Data were collected between 2009 and 2011. Due to some recruiting problems, data were collected in two waves in a total of seven orthopedic inpatient rehabilitation centers in Germany at the beginning and 2 weeks after rehab. Only patients suffering from chronic low back pain for at least 6 months were included in the study. Patients with “specific” back pain due to tumors or inflammatory diseases were excluded. The questionnaires were only given to patients able and willing to fill them out (after having provided informed consent). Of the 374 eligible patients asked to participate in the study, 266 (71.1%) agreed. The most frequent reason for nonparticipation in the study was unwillingness (43.5%), followed by physical or cognitive impairment (9.3%), and a lack of adequate German skills (6.5%). Of the nonparticipating patients, 40.7% provided no reason for nonparticipation. Due to inconsistent data regarding age and sex, some cases were excluded from the data analysis, resulting in a data set covering 262 patients. Table 1 provides an overview of some characteristics of our study sample.
Respondent Characteristics.
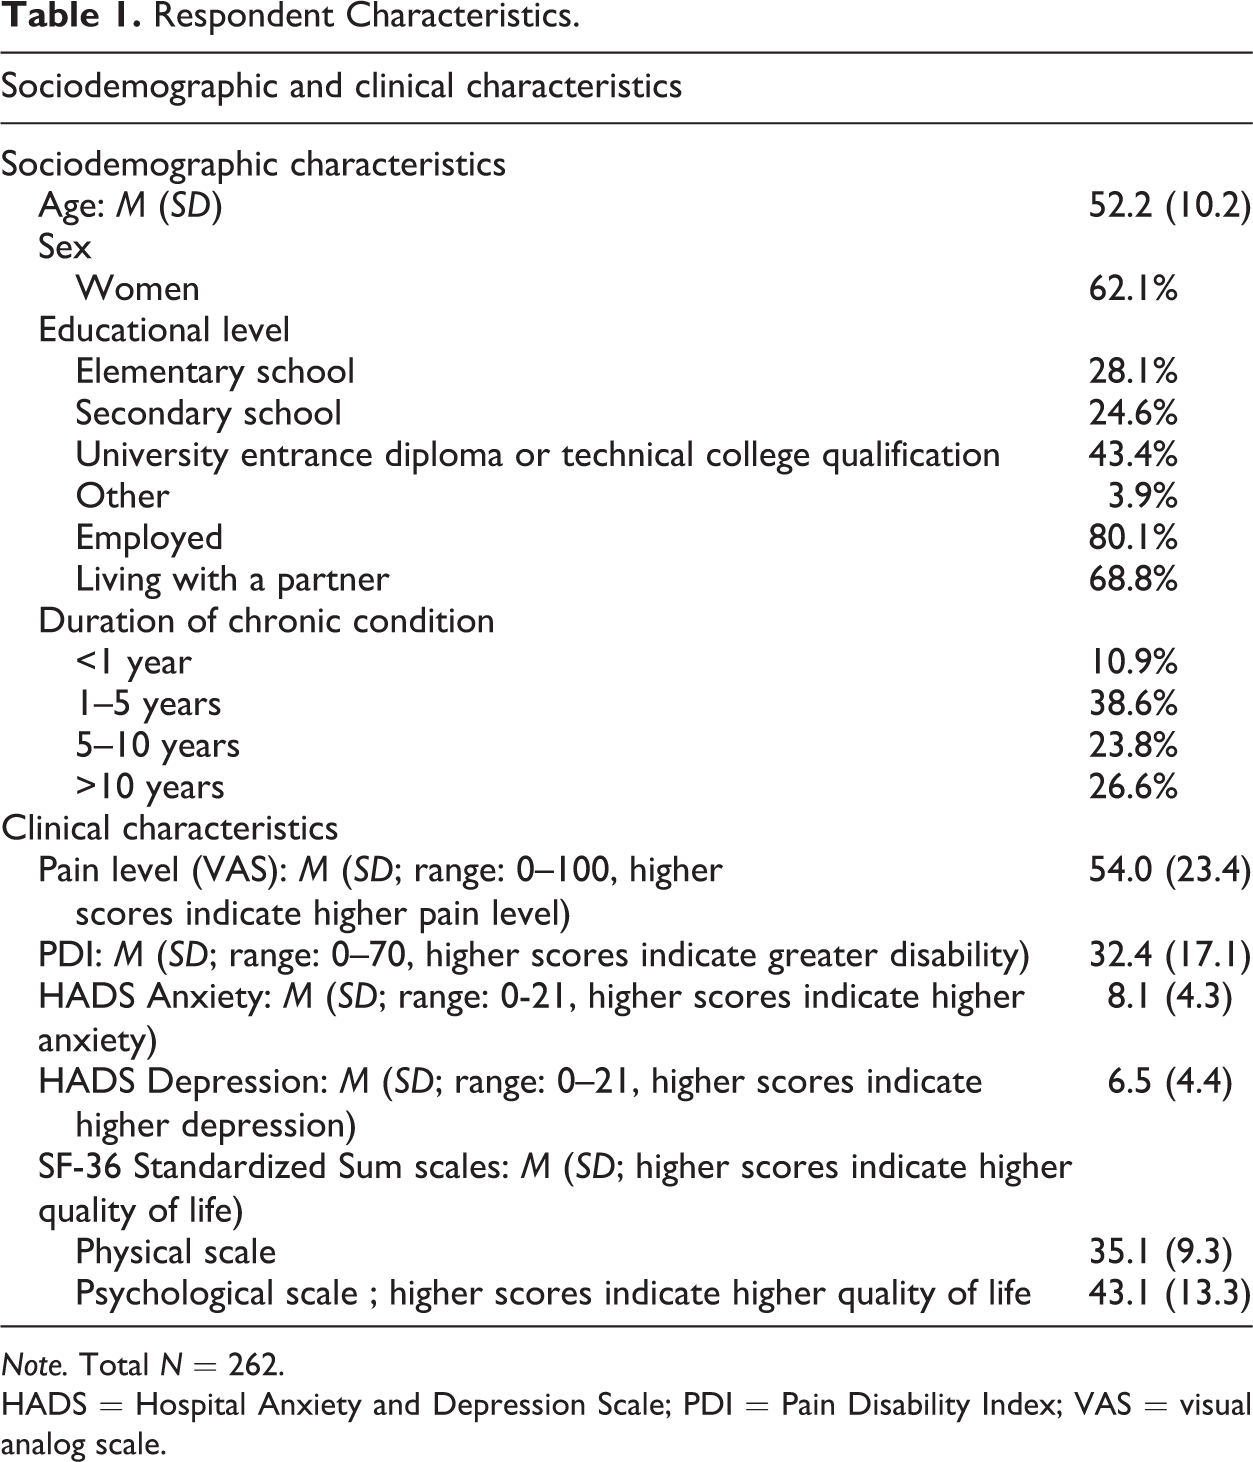
Note. Total N = 262.
HADS = Hospital Anxiety and Depression Scale; PDI = Pain Disability Index; VAS = visual analog scale.
Analyses
The analyses were conducted following the PROMIS guidelines (Bode et al., 2010; Hahn et al., 2010; Reeve et al., 2007). Response frequency and ceiling/floor effects were examined using the original data set described above. As we did not impute for missing data, we excluded cases with missing data for any of the PROMIS items from further analyses (cf. Rose, Bjorner, Becker, Fries, & Ware, 2008). This resulted in a data set of 233 patients (≈89% of the original sample). If not otherwise specified, data analysis was done using the IBM Statistical Package for the Social Sciences (SPSS 20.0). We used data from the beginning-of-rehab measurement occasion for all psychometric analyses and data from the after-rehab measurement occasion only in the unidimensionality and responsiveness analyses. A dropout analysis is presented in the Results section.
Response Frequency and Ceiling or Floor Effects
We examined the response frequency, proportion of missing values, and ceiling/floor effects for every item to evaluate the items’ distribution characteristics. Items were removed if the proportion of missing values exceeded 10% or if more than 50% of the values were in extreme categories (e.g., not at all, very much).
Unidimensionality
As unidimensionality is a central assumption in the IRT, we tested each subdomain separately to check whether it measured a single latent dimension (Bond & Fox, 2004). We conducted single-factor confirmatory factor analyses (CFAs), 2011 using IBM SPSS AMOS 20 software (AMOS Development Corporation). Close model fit was indicated via the Comparative Fit Index (CFI; Hu & Bentler, 1999), Tucker–Lewis Index (TLI; Tucker & Lewis, 1973), and the root mean square error of approximation (RMSEA). CFI and TLI values ≥.90 and RMSEA values ≤.05 indicate a good model fit. RMSEA values ≤.10 indicate a moderate fit (Hu & Bentler, 1999). We assumed the models to be acceptably undimensional if at least two of the three values indicated a good fit. Following the suggestions by Hahn et al. (2010) and Bode, Hahn, DeVellis, and Cella (2010), we also examined a hierarchical bifactor model containing one general factor and two specific factors. Data were considered to be essentially unidimensional if the fit was also acceptable for this bifactor model.
IRT Analyses
We applied one-parameter IRT models to check whether the items fulfill the requirements of the IRT. We considered a one-parameter IRT model more appropriate than the models suggested by the PROMIS network because one-parameter models lead to results that are clinically better interpreted (Coster et al., 2004) and provide stable parameters for smaller data sets (Conrad & Smith, 2004). Goodness of fit was evaluated by the infit and outfit mean square statistics (infit MNQS, outfit MNQS). Infit or outfit values <0.60 or >1.40 were defined as poor item fit. Items with a poor infit and outfit were eliminated. If an item showed poor values for only one of the two (infit or outfit), we decided to keep it in the item pool. We additionally tested every item to see whether threshold parameters for different response categories increased monotonically. IRT analyses were performed using WINSTEPS software (Linacre, 2005).
Reliability
Reliability was determined via Cronbach’s α and the person separation (PSEP) index. Cronbach α values >.70 indicate acceptable reliability. The PSEP index is an indicator for the number of performance levels a test measures in a particular sample. It is closely related to the concept of person reliability. A PSEP value >1.52 indicates a level of reliability of at least .70 (Prieto, Alonso, & Lamarca, 2003).
Internal Responsiveness Analyses
Internal responsiveness refers to the ability of an instrument to depict clinical changes over a particular time frame (Husted, Cook, Farewell, & Gladman, 2000). Following the recommendations by Norman, Wyrwich, and Patrick (2007), we calculated Cohen’s (1988) d and standardized response means (SRMs) for both scales using the data from the before- and after-rehab measurement occasions (time frame: about 5 weeks). Cohen’s d was calculated by dividing the scales’ mean change by the standard deviation of the first measurement occasion. For the SRMs, the mean change was divided by the standard deviation of the change scores (before rehab vs. 2 weeks after rehab). Results of a previous study examining the effects on pain-related disability using the Oswestry Disability Index and the PDI in the same sample suggested that we should expect small to moderate effects (Farin, Nagl, Gramm, Heyduck, & Glattacker, under review).
Construct Validity
As the PDI measures pain-related disability in terms of various daily activities (family, home responsibilities, recreation, social activities, work, sexual behavior, self-care, life-support activities; cf. Tait et al., 1990), we assumed the PDI to be a suitable measure for the assessment of construct validity of the Satisfaction with Participation scales. Therefore, we calculated bivariate Pearson correlations, assuming both scales and the PDI to be strongly negatively related (the higher satisfaction with participation, the lower pain-related disability with r < −.50). It is also plausible that satisfaction with participation in social roles and satisfaction with participation in discretionary social activities are positively associated (r > .50).
Results
Dropout Analyses
About 84% of the patients answering questionnaires at the beginning of rehab also provided data 2 weeks after rehab. The dropout rate 2 weeks after rehab was 16.4%. T-tests and chi-square tests revealed no differences between patients who completed the study on schedule and those who dropped out prematurely in terms of relevant sociodemographics (age, sex, education, profession, and the duration of chronic disease).
Response Frequency and Ceiling or Floor Effects
No item revealed ceiling or floor effects. The response frequency was very high. Response rates varied between 97.3% and 99.2%. Missing value rates were <2.0% for most of the items. There was no need to remove any of the items in this first step of the analyses.
Unidimensionality
The upper part of Table 2 summarizes the results of the CFAs for both item banks and a bifactor model. “Original” models with uncorrelated residual variances showed unsatisfactory TLI and RMSEA values in both subscales. The model fit improved slightly by allowing for correlated error variances for few items guided by modification indices. These correlations were permitted only when it was contextually plausible that the items would display a common variance that could not be attributed to the latent variable, for example, if items were based on a similar content (e.g., “I feel good about my ability to do things for my family,” “I am happy with how much I do for my family”) or similar formulations (e.g., “I am satisfied with my ability to do regular personal and household responsibilities,” “I am satisfied with my ability to perform my daily routines”). Modifications led to satisfactory CFI and TLI values in both subscales. RMSEA values were still unsatisfactory. For the bifactor model, all fit values can be considered satisfactory after allowing for correlated error variances for 3 items.
Unidimensionality.
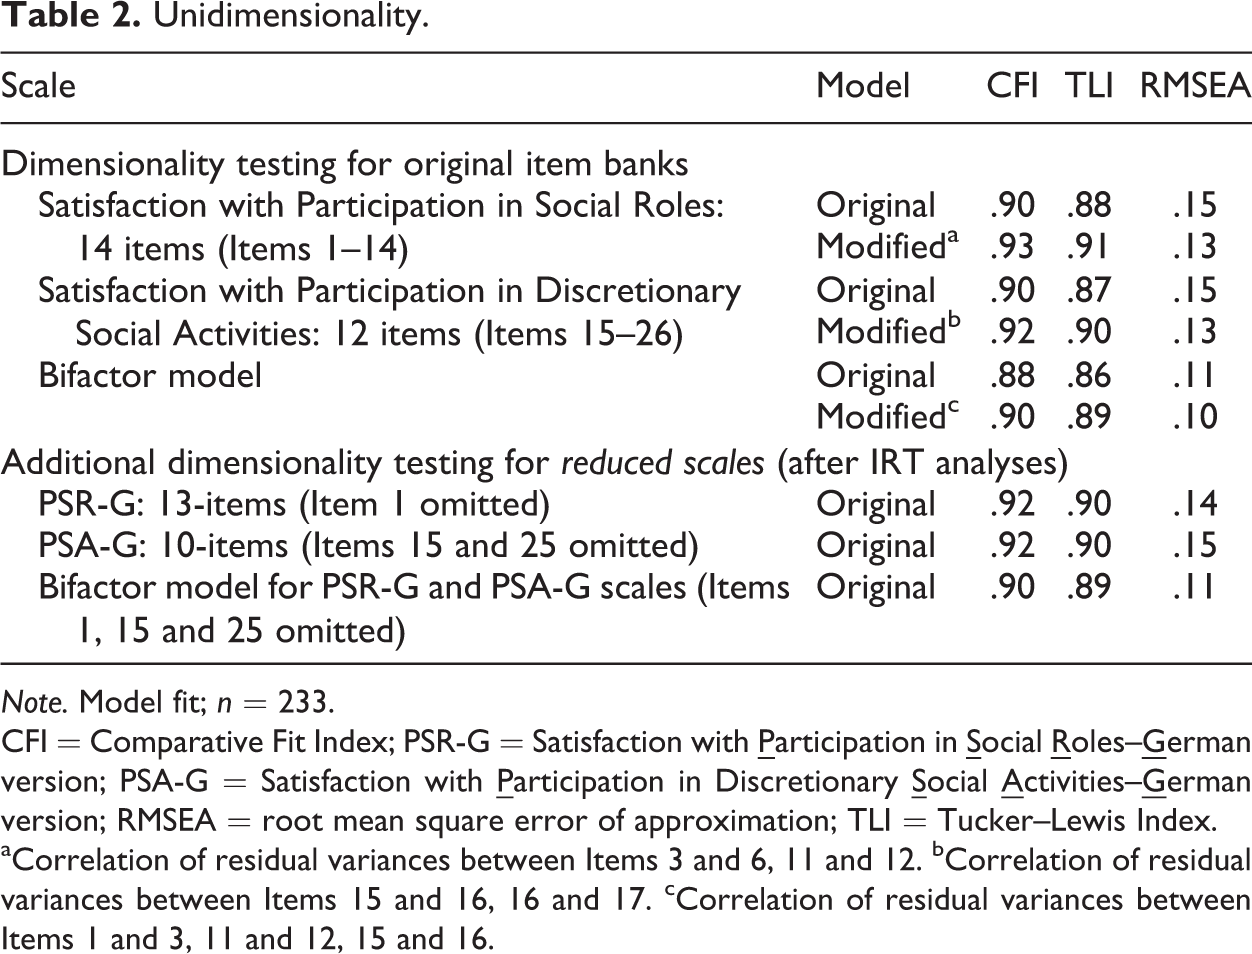
Note. Model fit; n = 233.
CFI = Comparative Fit Index; PSR-G = Satisfaction with
aCorrelation of residual variances between Items 3 and 6, 11 and 12. bCorrelation of residual variances between Items 15 and 16, 16 and 17. cCorrelation of residual variances between Items 1 and 3, 11 and 12, 15 and 16.
To check whether our results for the modified models are specific for the data set before rehab, we performed a quasi cross-validation with data from those patients who also completed the after-rehab measurement occasion (n = 211 without missing values). Considering CLI and TLI, both scales’ model fit was good. Just like for the first measurement occasion, RMSEA exceeded the acceptable range (Satisfaction with Participation in Social Roles: CFI = .95, TLI = .94, RMSEA = .12; Satisfaction with Participation in Discre-tionary Social Activities: CFI = .92, TLI = .90, RMSEA = .13). The fit of the bifactor model was good to moderate (CFI = .93, TLI = .92, RMSEA = .10).
IRT Analyses and the Development of Reduced Static Scales
As some items in the German version of the PROMIS item banks for satisfaction with participation failed to fit to the IRT model, the results from IRT analyses led us to the development of reduced static scales: “Satisfaction with
For the PROMIS Satisfaction with Participation in Social Roles scale, Item 1 revealed poor infit and outfit scores and was therefore eliminated from the item pool. However, infit and outfit values of the remaining 13 items lie between 0.61 and 1.27, apart from Items 5 and 8, whose outfit values were 1.43 and 1.55. As the infit values of those two items fell in the required range (1.37, 1.27), they were considered acceptable. For the PROMIS Satisfaction with Participation in Discre-tionary Social Activites scale, Items 15 and 25 had to be eliminated because of poor infit and outfit values. Infit and outfit values of the remaining 10 items fell within the required range, except for Item 26, whose outfit value was 1.48. As the infit value of Item 26 was acceptable (1.25), we decided not to eliminate it. The PSR-G scale thus still contains 13 of the 14 items from the PROMIS Satisfaction with Participation in Social Roles item bank, and the PSA-G scale still contains 10 of the 12 items from the original item bank. Table 3 provides an overview of which items were considered in the PSR-G and the PSA-G scales. The threshold parameters for both scales increased monotonically. As stated by Linacre (2002), the distance between threshold parameters was >1.4 and <5 logits for our data set.
Overview of the Patient Reported Outcomes Measurement Information System (PROMIS)® Satisfaction With Participation Item Banks.
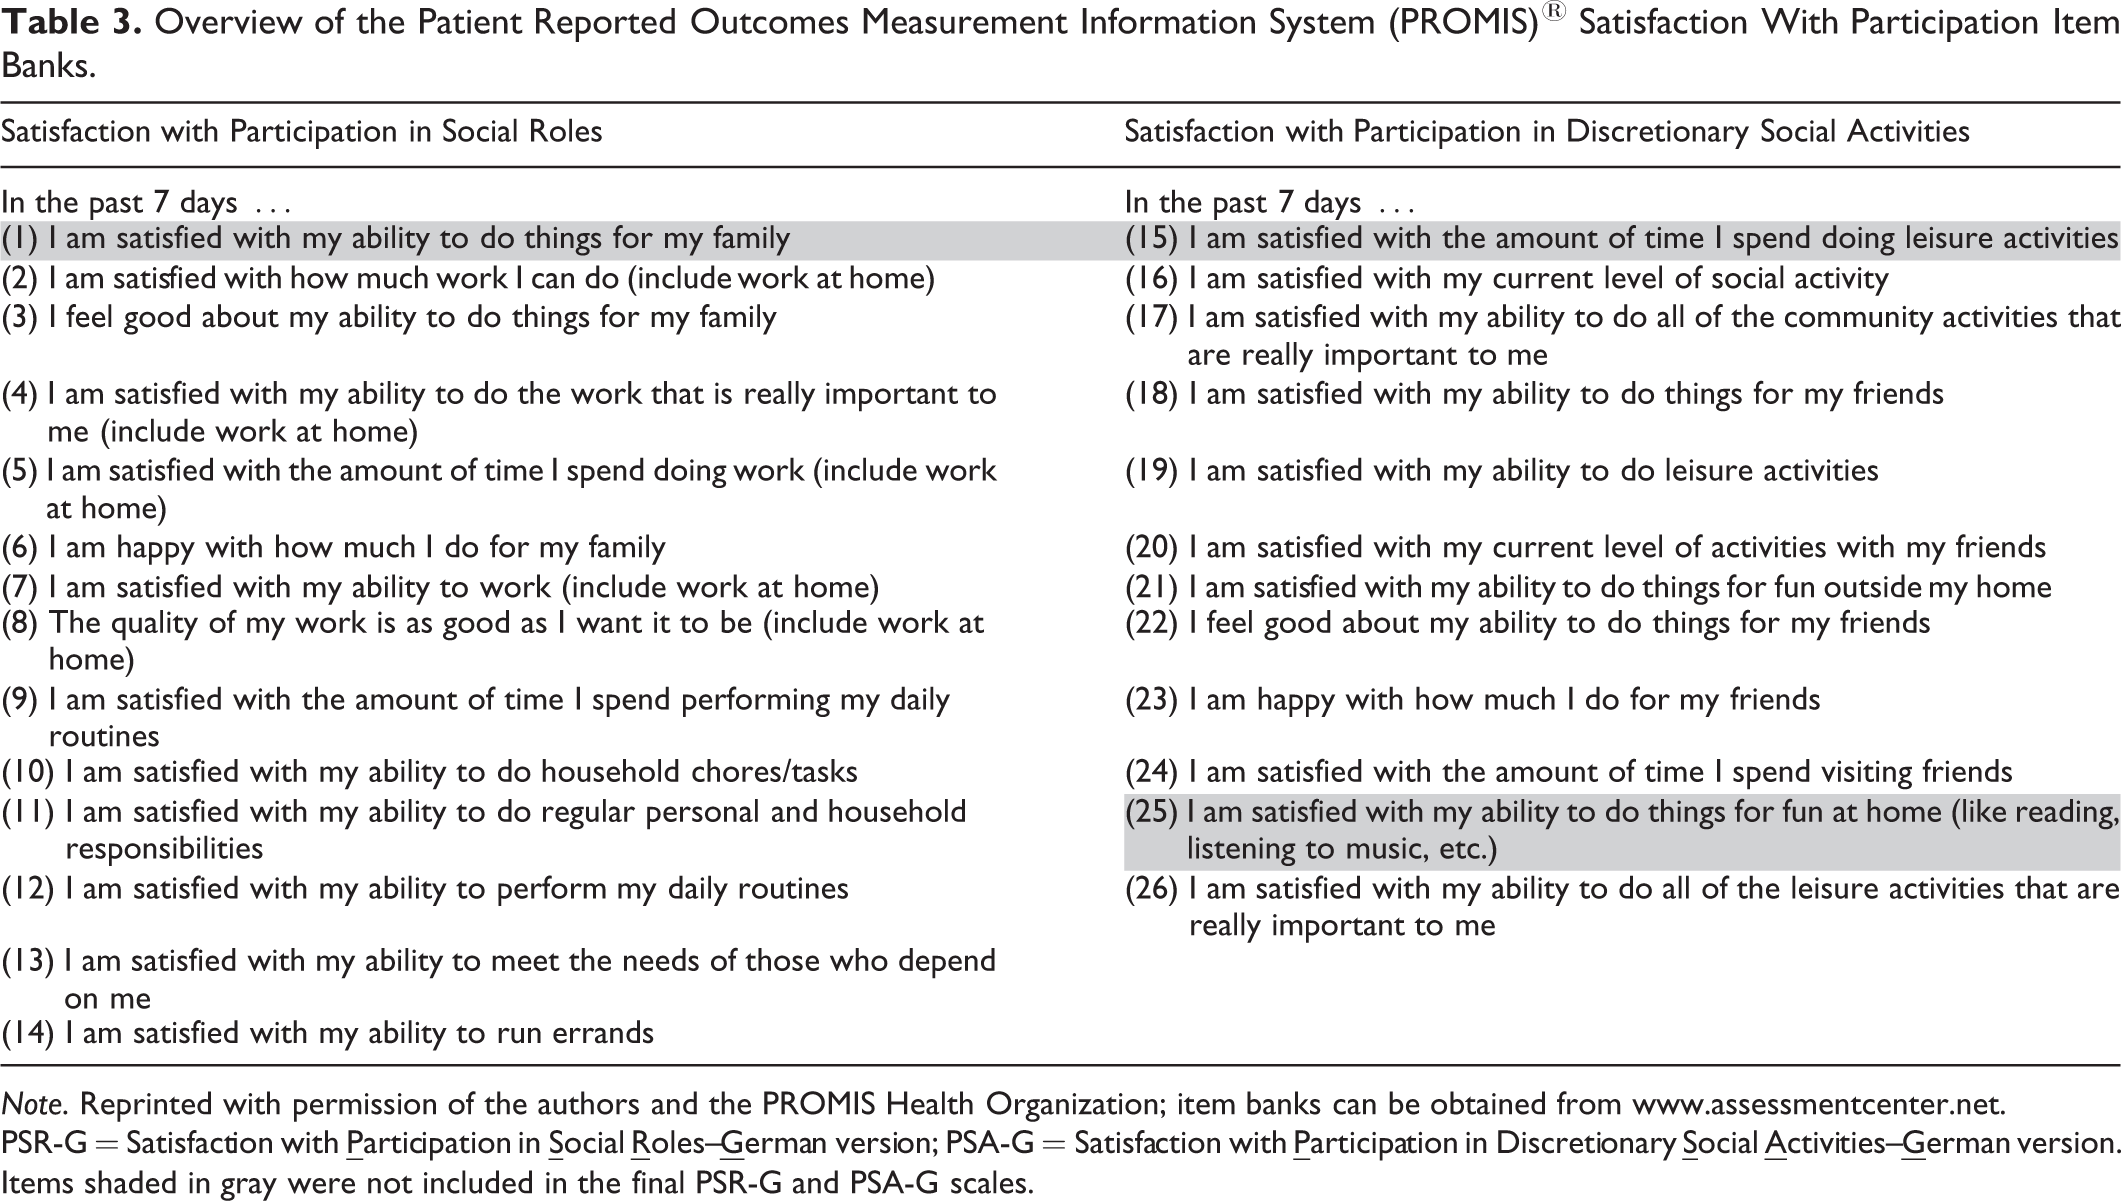
Note. Reprinted with permission of the authors and the PROMIS Health Organization; item banks can be obtained from www.assessmentcenter.net.
PSR-G = Satisfaction with
Items shaded in gray were not included in the final PSR-G and PSA-G scales.
Additional Dimensionality Testing of the Newly Developed PSR-G and PSA-G Scales
To ensure a good fit to the Rasch model, we had to eliminate 1 item from the German version of the PROMIS Satisfaction with Participation in Social Roles item bank and 2 items from the Satisfaction with Participation in Discretionary Social Activities item bank leading to the PSR-G and PSA-G scales. After selecting the items, we tested again our newly developed static scales for unidimensionality. The lower part of Table 2 shows the results from both scales and a bifactor model. Considering TLI and CLI, the original models with uncorrelated residual variances displayed good fit. Although RMSEA values for the single-factor models were hardly acceptable, we found an almost moderate value for the RMSEA in the bifactor model.
Reliability
Cronbach’s α for the PSR-G and the PSA-G scales substantially exceeded the critical value of .70. PSEP values also demonstrate the high reliability of both scales. PSEP values can be translated into reliability indices (person reliability index) which also reveal highly satisfactory values. Table 4 illustrates all values in detail.
Results From Reliability, Responsiveness, and Validity Analyses for the PSR-G and PSA-G Scales.
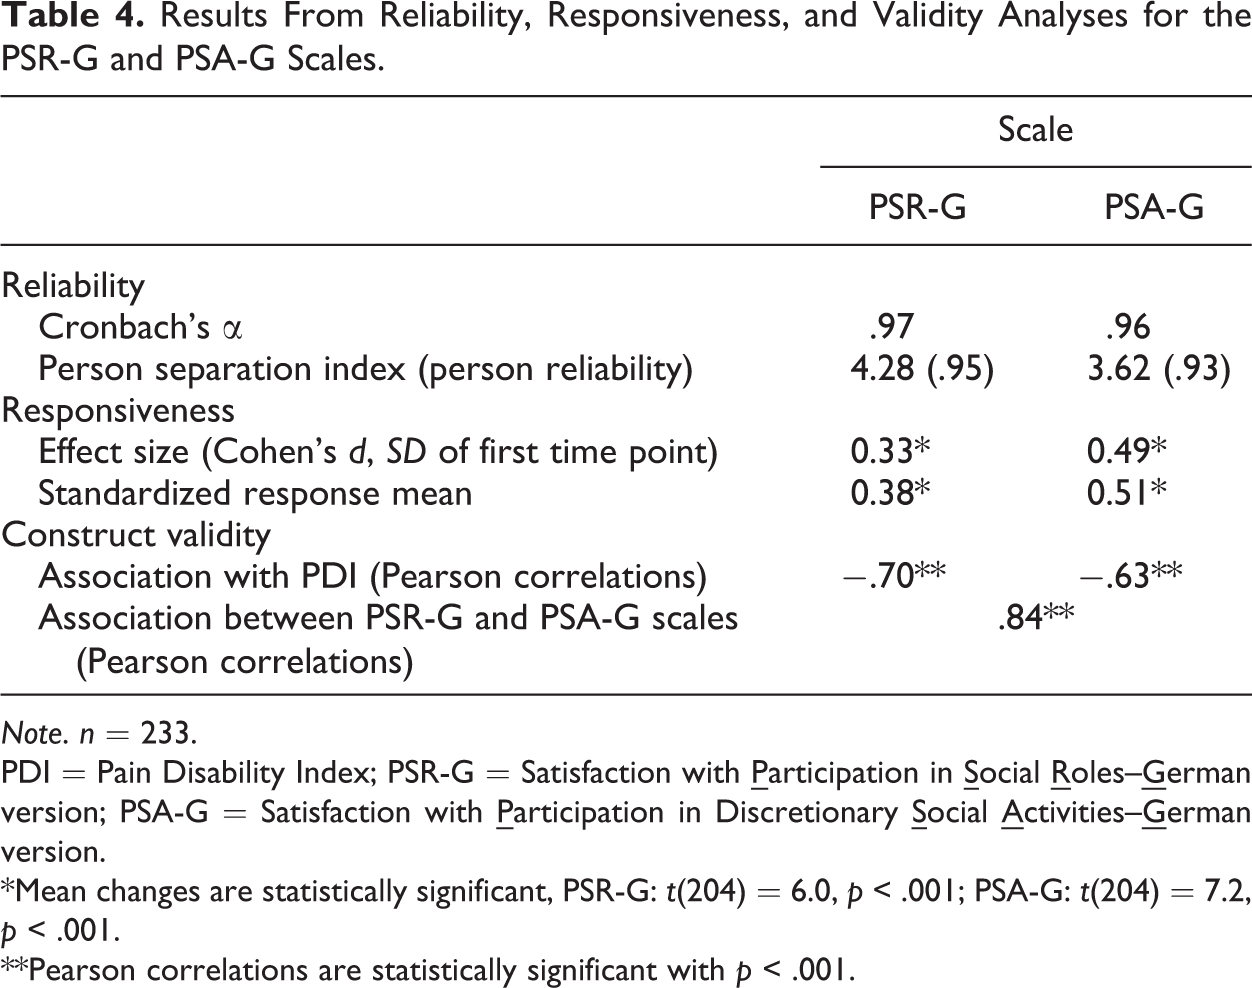
Note. n = 233.
PDI = Pain Disability Index; PSR-G = Satisfaction with
*Mean changes are statistically significant, PSR-G: t(204) = 6.0, p < .001; PSA-G: t(204) = 7.2, p < .001.
**Pearson correlations are statistically significant with p < .001.
Responsiveness Analyses
The results of our responsiveness analyses are presented in Table 4. Cohen’sd and SRM ranged from small to moderate effects. Cohen’s d was generally smaller than the SRM. Considering the sum scores of the PSR-G and PSA-G scales, we observed a mean improvement of about 5 points (SD range: 10.2–12.2) for both scales between the start and 2 weeks after rehab, PSR-G: M beforerehab = 36.6 (SD = 14.1), M aftererehab = 41.7 (SD = 14.5), scale range: 13–65; PSA-G: M beforerehab = 26.8 (SD = 10.5), M aftererehab = 31.9 (SD = 10.5), scale range: 10–50. Improvements on both scales were statistically significant in paired t-tests. The responsiveness of other instruments measuring pain-related disability used in the study was slightly higher but also ranged between small to moderate effects. For the PDI, we found a Cohen’sd of 0.4 and an SRM of 0.6.
Construct Validity
As hypothesized, we observed strong correlations between both scales (PSA-R and PSA-G) and the PDI, and strong intercorrelations between both scales. Detailed results are presented in Table 4.
Discussion
It was the aim of the present study to develop and psychometrically test a German version of the PROMIS item banks for satisfaction with participation.
Acceptability and distribution characteristics were assessed via the response rate, the number of missing values, and ceiling and floor effects. The results for the translated version of the item banks can be considered as very good. The response rate was very high and the percentage of missing values correspondingly low. This finding indicates a good acceptability of the items. It also resembles our impression from the cognitive interviews, as patients did not report having serious problems responding to the items. Moreover, we detected no ceiling or floor effects. This supports the results from Hahn et al. (2010) who also examined the distribution characteristics in a general population and in several clinical samples for the original English version.
The problems while testing the German version of the PROMIS item banks for unidimensionality and IRT model fit in the first run might be due to some aspects also described by Hahn et al. (2010) and Bode et al. (2010). High correlations between error variances of manifest variables in CFA suggest that these variables, in addition to measuring aspects of the assumed latent factor, represent manifest variables for another latent concept which is not investigated in this model. Sometimes the communality between the items is based on a similar content or similar formulations. The latter may have led to correlations in our study. The correlated items’ wording was occasionally very similar. We therefore argue that the correlations between error terms in our study were theoretically plausible and kept to a minimum (Hittner, 2007).
Slightly modified item banks leading to our newly developed static 13-item PSR-G and 10-item PSA-G scales, show, however, satisfactory unidimensionality results and can be assumed essentially unidimensional (with at least two fit values showing good fit). The IRT model fit was good and the scales also reveal high reliability. They can thus serve as a basis for CAT applications. Strong associations between both scales and the PDI, and strong intercorrelations between the two scales are an indication of the construct validity of the scales. Effect sizes in our responsiveness analyses ranged from small to moderate. The responsiveness of our PSR-G and PSA-G scales is slightly lower than that of other instruments measuring pain-related disability used in the same sample (e.g., PDI, Oswestry Disability Index, further results are presented in Farin et al., under review) and the responsiveness of the PSR-G scale is slightly lower compared to the PSA-G scale. But this may be plausible, as short-term effects of inpatient rehabilitation may be higher with regard to pain-reduction and discretionary activities compared to social roles. As we used data from 2 weeks after the end of the rehab, we were not able to record longer term effects. Longer term effects may be higher with regard to social roles when the patient is back in his usual social environment for more than 2 weeks after an inpatient rehab. The scales show, however, higher than or at least similar responsiveness to other participation measures that were also tested in patients with chronic pain in a rehab context (cf. van der Zee, Kap, Mishre, Schouten, & Post, 2011). In the study by van der Zee, Kap, Mishre, Schouten, and Post (2011), SRM for four different participation measures ranged from 0.21 to 0.54. The original English version’s responsiveness has not been reported yet.
Having psychometrically tested scales based on the German version of the PROMIS Satisfaction with Participation item banks helps to enhance the comparability of study results. It also helps to overcome shortcomings of other approaches to measuring participation or social health, for example, assumptions for IRT scaling (for an overview of contemporary participation measures and psychometric properties, see Magasi & Post, 2010). For four of the eight participation measures reviewed by Magasi and Post (2010), the authors did not find any information on IRT model fit, and for only two, information was reported with regard to responsiveness.
The fact that the modified scales also demonstrate a satisfactory model fit in bivariate hierarchical models can be taken as a sort of validation for the PROMIS theoretical framework, which subdivides social health into various subdomains and distinguishes between participation in social roles and participation in discretionary social activities (Bode et al., 2010; Hahn et al., 2010). Our results provide evidence that this conceptual distinction also applies to our data from a clinical sample of patients with chronic low back pain being treated in inpatient rehabilitation centers in Germany. But with the recently developed overall item bank Satisfaction with Social Roles and Activities, the PROMIS group gave up this subdivision into social roles and social activities. It is of note that participation is conceptualized here as ratings of satisfaction. Psychometrically tested item banks for the ability to participate as part of the PROMIS social health framework were not available in the first wave (Version 1.0 banks).
Limitations
Our translation and the development of the static PSR-G and PSA-G scales were based on the PROMIS 1.0 item banks. The comparability to the recently developed overall item bank Satisfaction with Social Roles and Activities (Version 2.0) is limited because the underlying item pool and framework are different. Further limitations to our study pertain to the number of nonresponders at the beginning of the study, which limits the representativity of our results. The influence of the nonresponder rate on the representativity of the sample is, however, difficult to estimate, as the main reason for all nonparticipating patients was their unwillingness. We have no access to sociodemographic information on nonparticipating patients. Another limitation is that we only included patients with chronic low back pain in our study, which means that our results cannot be automatically applied to other patient groups with chronic conditions.
Conclusion
Our study revealed positive results for the German Satisfaction with Participation item banks regarding acceptance and distribution characteristics. As the original item banks revealed problems with unidimensionality and IRT model fit, we decided to develop modified static scales based on the item banks. The unidimensionality results from the final 13- and 10-item PSR-G and PSA-G scales were satisfactory. Both scales show good IRT model fit, they are reliable and sensitive to small to moderate clinical changes over time. We have hereby provided initial proof for the scales’ construct validity.
The newly developed PSR-G and PSA-G scales presented herein are psychometrically tested instruments that we can recommend to assess participation in a clinical context. As the scales do not contain any pain-specific concepts, one can assume their applicability in a generic context as well. This needs, however, to be examined in future studies. The use of these scales enables comparisons, with data stemming from international studies of the PROMIS network and thereby enhances the significance of studies conducted in German-speaking regions.
Further research should focus on testing further psychometric characteristics (e.g., sensitivity, retest–reliability) and the item banks’ applicability in other clinical samples. Our research group is currently testing their applicability in the context of mental diseases.
The German version of the item banks for satisfaction with participation can be obtained from the PROMIS assessment center (www.assessmentcenter.net).
Footnotes
Acknowledgments
We thank the PROMIS network for reviewing our translation and for its technical support during the project. We also thank Ms Desiree Kosiol and Ms Milena Meder for their support during the translation process and data acquisition. Finally, we thank the participating rehabilitation centers, their staff, and all participating patients: Klinik am Brunnenberg, Bad Elster; Thermalbad Wiesenbad, Wiesa/OT Wiesenbad; Ziegelfeld-Klinik St. Blasien, m&I Fachklinik Hohenurach, Bad Urach; Marcus-Klinik, Bad Driburg; RehaKlinikum Bad Säckingen GmbH, Bad Säckingen; Weserland-Klinik Bad Seebruch, Vlotho; Klinik Dr. Muschinsky, Bad Lauterberg.
Declaration of Conflicting Interests
The author(s) declared no potential conflicts of interest with respect to the research, authorship, and/or publication of this article.
Funding
The author(s) received no financial support for the research, authorship, and/or publication of this article.