
Abstract
The System for Evaluation of Teaching Qualities (SETQ) was developed as a formative system for the continuous evaluation and development of physicians’ teaching performance in graduate medical training. It has been seven years since the introduction and initial exploratory psychometric analysis of the SETQ questionnaires. This study investigates the validity and reliability of the SETQ questionnaires across hospitals and medical specialties using confirmatory factor analyses (CFAs), reliability analysis, and generalizability analysis. The SETQ questionnaires were tested in a sample of 3,025 physicians and 2,848 trainees in 46 hospitals. The CFA revealed acceptable fit of the data to the previously identified five-factor model. The high internal consistency estimates suggest satisfactory reliability of the subscales. These results provide robust evidence for the validity and reliability of the SETQ questionnaires for evaluating physicians’ teaching performance.
Keywords
Introduction
In teaching hospitals, a core task of most physicians is to provide specialty-specific training to physicians-in-training (trainees). Graduate medical education (GME) primarily consists of clinical training within a hospital setting under supervision of staff physicians, who act as supervisors. High-quality GME is very important for providing high-quality patient care now and in the future (van der Leeuw, Lombarts, Arah, & Heineman, 2012). Therefore, there has been a continuous increase in the awareness about and attention toward the professional performance of GME supervisors during the last decades.
Gaining insight into the strengths and weaknesses of supervisors’ teaching performance is crucial for maintenance and enhancement of performance. While supervisors can self-evaluate their performance to enhance their self-awareness, the feedback of trainees is generally seen as an important feedback source to provide an external view on supervisors’ performance (Sargeant et al., 2010). A combination of self- and external evaluations is necessary to provide sufficient input for good reflection (Stalmeijer et al., 2010).
Providing supervisors with feedback by trainees on their teaching performance has become more common over the last decade. Feedback systems that facilitate and guide the flow of feedback toward supervisors have been developed and both supervisors and trainees regard those systems as important tools for quality assurance in GME (Stalmeijer et al., 2010). The use of feedback systems increased rapidly and in some countries, feedback is even included in formal evaluation processes of supervisors. Therefore, it is important that the validity evidence of the data generated by any such feedback system is strong and up-to-date. Unfortunately, reviews have concluded that the validity evidence supporting feedback systems is often scarce, of low quality or poorly described (Fluit, Bolhuis, Grol, Laan, & Wensing, 2010; Wetzel, 2012).
In the Netherlands, the System for Evaluation of Teaching Qualities (SETQ) was developed to evaluate GME supervisors’ teaching performance and provide them with feedback to enhance their performance (Lombarts, Bucx, & Arah, 2009). The SETQ system gathers feedback using two questionnaires, one for supervisors’ self-evaluation, and one for trainee evaluations of their supervisors. In general, the two questionnaires contain the same items. The SETQ questionnaires were based on an extensive literature review and discussions with stakeholders (Lombarts et al., 2009). The system was successfully implemented institution-wide, later nationwide and it is currently being launched in several countries across Europe.
The validity and reliability of the SETQ questionnaires were previously studied using exploratory techniques and revealed five SETQ subscales with satisfactory psychometric properties that were labeled as creating a safe learning climate, displaying professional attitude towards trainees, communication of learning goals, evaluation of trainees’ knowledge and skills, and giving feedback to trainees (Arah, Hoekstra, Bos, & Lombarts, 2011; Boerebach, Arah, Busch, & Lombarts, 2012; Lombarts et al., 2009; van der Leeuw, Lombarts, Heineman, & Arah, 2011). However, the results of such exploratory analyses can sometimes not be reproduced by advanced confirmatory analytical techniques (De Vriendt et al., 2011; Reichenheim, Moraes, Oliveira, & Lobato, 2011). Therefore, we applied confirmatory factor analysis (CFA) and strong data-driven generalizability analysis to investigate and further strengthen the evidence on the validity and reliability of the SETQ questionnaires.
Method
Setting and Study Population
In the Netherlands, GME training is a joint responsibility of all supervisors who form an educational team within a hospital department. In most teaching hospitals, trainees follow a modular schedule to cover the various subspecialties of their main specialty. Depending on the specialty, GME training lasts 4 to 6 years.
Data collection occurred in phases. An evaluation period at a training program lasted about a month and was usually repeated annually. Data for this study included evaluations of 215 GME training programs of 46 teaching hospitals in the Netherlands between February 2012 and October 2013. These were all GME training programs in the Netherlands that participated in SETQ evaluations during that time. If a training program participated twice during the data collection period, only data of the most recent evaluation period were included.
Participants were invited to participate in the SETQ via e-mail. The invitation e-mail stressed the formative purpose and use of the evaluations and the confidential and voluntary character of participation. To encourage participation, automatic e-mail reminders were sent and in most departments the GME program director further encouraged participation. Trainees could choose which and how many supervisors to evaluate, based on whose teaching performance the trainee felt he or she was able to evaluate accurately. Supervisors could only complete a self-evaluation. After closure of an evaluation period, supervisors received a feedback report, summarizing trainees’ feedback along with their self-evaluation. The trainees completed the questionnaires anonymously. Waiver of ethical approval for this study was provided by the institutional review board of the Academic Medical Center of the University of Amsterdam, Amsterdam, the Netherlands. Waiver was provided because ethical approval for this study was not required under Dutch law.
SETQ Feedback Questionnaires
The two SETQ questionnaires (for supervisors’ self-evaluation and for trainee evaluations of supervisors) contain the same 20 generic items. For some specialties, a few specialty-specific items were added to yield specialty-specific feedback. These specialty-specific items were not studied in this article. The five subscales of the SETQ questionnaires contained 3–6 items that could be rated on a 5-point Likert-type scale: 1 = strongly disagree, 2 = disagree, 3 = neutral, 4 = agree, 5 = strongly agree, and there was an additional option I cannot judge. In addition to the quantitative items, trainees could provide qualitative comments; however, this study focuses on the quantitative items only. After the initial validation, studies of the SETQ questionnaires were published and before data collection for current study started, items that had shown lower validity in the initial validation studies had been discussed with several stakeholders including trainees, supervisors, and researchers. Subsequently, the low validity items that had been prioritized as low by supervisors and trainees had been excluded from the questionnaires.
Analyses
First, we described the study participants and data using appropriate statistical measures such as means and their standard deviation. Missing data values were imputed using expectation maximization (EM) algorithms (Van Buuren & Groothuis-Oudshoorn, 2011). Second, we conducted an exploratory factor analysis (EFA, i.e., principal axis factoring with direct oblimin rotation) on a random sample of 20% of trainee and supervisor (self-) evaluations. This sample was later excluded from the CFA. If the structure identified by the EFA supported the PCA structure identified in previous validation studies, this structure would be carried forward and tested using a CFA. Next, a variance–covariance matrix for the CFA was specified. Because both robust maximum likelihood (robust ML) and robust generalized least squares (robust GLSs) were considered appropriate estimation techniques considering our data distribution, we estimated two equivalent CFA models, one estimated with robust ML and one estimated with robust GLS (Min, 2008; Olsson, Foss, Troye, & Howell, 2000). Based on previous studies, correlation parameters were added between all SETQ subscales. The CFA was performed on 80% of the trainee and supervisor (self-) evaluations.
The CFA models were evaluated using three criteria: (1) overall goodness-of-fit parameters, (2) the presence or absence of localized areas of strain in the solution, and (3) the interpretability and size of model parameter estimates. We prespecified conventional cutoff values for model goodness of fit (Brown, 2006). In particular, we assessed the overall goodness of fit using the model chi-square (χ2), standardized root mean square residual (SRMR, where values <0.08 indicate good fit and <0.12 would indicate acceptable fit), the root mean square error of approximation (RMSEA, where values <0.06 indicate good fit and <0.10 acceptable fit), the comparative fit index (CFI, where values >0.95 indicated good fit and >0.90 acceptable fit), and the Tucker–Lewis index (TLI, where values >0.95 indicated good fit and >0.90 acceptable fit). When an individual goodness-of-fit statistic was beyond the cutoff value for acceptable fit, this statistic was considered combined with another statistic, as suggested by Hu and Bentler (1999). The localized areas of strain statistics were the standardized residuals (SR, where z-values <1.96 indicated good fit) and the expected parameter changes (EPC). Third, the unstandardized parameter estimates and their standard errors were calculated. For good fitting models, unstandardized model parameters are usually high (at least >0.40) and smaller standard errors generally indicate more precision. To check the internal consistency of the subscales, we calculated the internal consistency reliability coefficient, Cronbach’s α. An α of at least .70 is generally considered a satisfactory indicator for a scale (Streiner & Norman, 2008). To check for overlap between the different scales, the inter-scale correlations were calculated. An inter-scale correlation below .70 (<50% overlap) was seen as an indication for a moderate to small degree of overlap, and thus considered satisfactory (Streiner& Norman, 2008). The CFA, internal consistency analysis, and inter-scale correlations were performed for (1) supervisors’ self-evaluations, (2) individual trainee evaluations, and (3) trainees’ evaluations aggregated on supervisor’s level, separately. This was done because both for research and practical purposes, data can be used on these three levels.
Generalizability analysis was performed to estimate the numbers of trainee evaluations needed for reliable measures of supervisors’ teaching performance. For different numbers of trainee evaluations per supervisor (2–3, 4–5, 6–7, 8–9, and 10+), the reliability coefficient (α) was calculated. The CFA was performed using the sem package (Fox, 2006) in the statistical software R version 3.0.2. All other analyses were performed using SPSS, version 20 (IBM SPSS Inc, 2012).
Results
Participants and Data
In total, 2,021 trainees (71.0% response rate) completed 15,639 evaluations on the teaching performance of 2,835 supervisors (94.1% of all supervisors who could be evaluated) comprising 81 GME programs in academic and 134 programs in generic teaching hospitals (Table S1 in the online appendix provides more detailed participant characteristics). Self-evaluations were completed by 2,226 supervisors (73.6% response rate). Missing data (including items rated by residents as “cannot judge”) exceeded 50% for 891 trainee evaluations (5.7% of all the trainee evaluations) and for 44 self-evaluations (2.0% of all self-evaluations). These evaluations were excluded from the analysis. The missing data for the remaining evaluations were imputed. A summary of the data before and after imputation showed that the distribution of the data after EM imputation was comparable to the nonimputed data (Table S2 in the online appendix). Since the results of the complete case analysis (that was performed as a sensitivity analysis for the imputation process) revealed comparable results as the imputed case analysis for all analyses, only the results from the EM imputed data are shown subsequently.
Psychometrics
The results of the EFA revealed the same five-factor structure that was identified in previous studies (Table S3 in the online appendix). The five factors of the trainee questionnaire explained 69.8% of the variance, while the five factors of the self-evaluation explained 59.0% of the variance across supervisors.
The identified five-factor structure of the questionnaires was tested using CFA techniques. The global fit parameters indicated acceptable to good fit for both the trainee questionnaires (individual questionnaire and aggregated on supervisor level) and the self-evaluation questionnaire (Table 1). However, the results of the CFA models estimated using the robust ML and robust GLS technique differed somewhat. For instance, the goodness-of-fit indices (CFI and TLI) of the robust GLS models suggested good fit for all models, while these indices of the robust ML models suggest acceptable fit for all models. In contrast, the lack of fit indices (especially the SRMR) of the robust ML models indicate minor lack of fit, while the SRMR results of the robust GLS models indicate higher lack of—albeit acceptable—fit. The localized area of strain statistics of the CFA models indicated no substantial strains in the models. All SRs had z-values below 1.96 and the EPCs were small. Further, the unstandardized model parameters were high, and the standard errors were small (Table S4 in the online appendix). For the individual trainee questionnaire, all parameters were above .40; for trainees’ questionnaire aggregated on supervisor level, 2 items had parameter estimates slightly below .40 (.39 and .38, respectively); and for the self-evaluation questionnaire, 4 items had lower parameter estimates (ranging from .27 to .39).
Global Fit Parameter Estimates From the CFA.
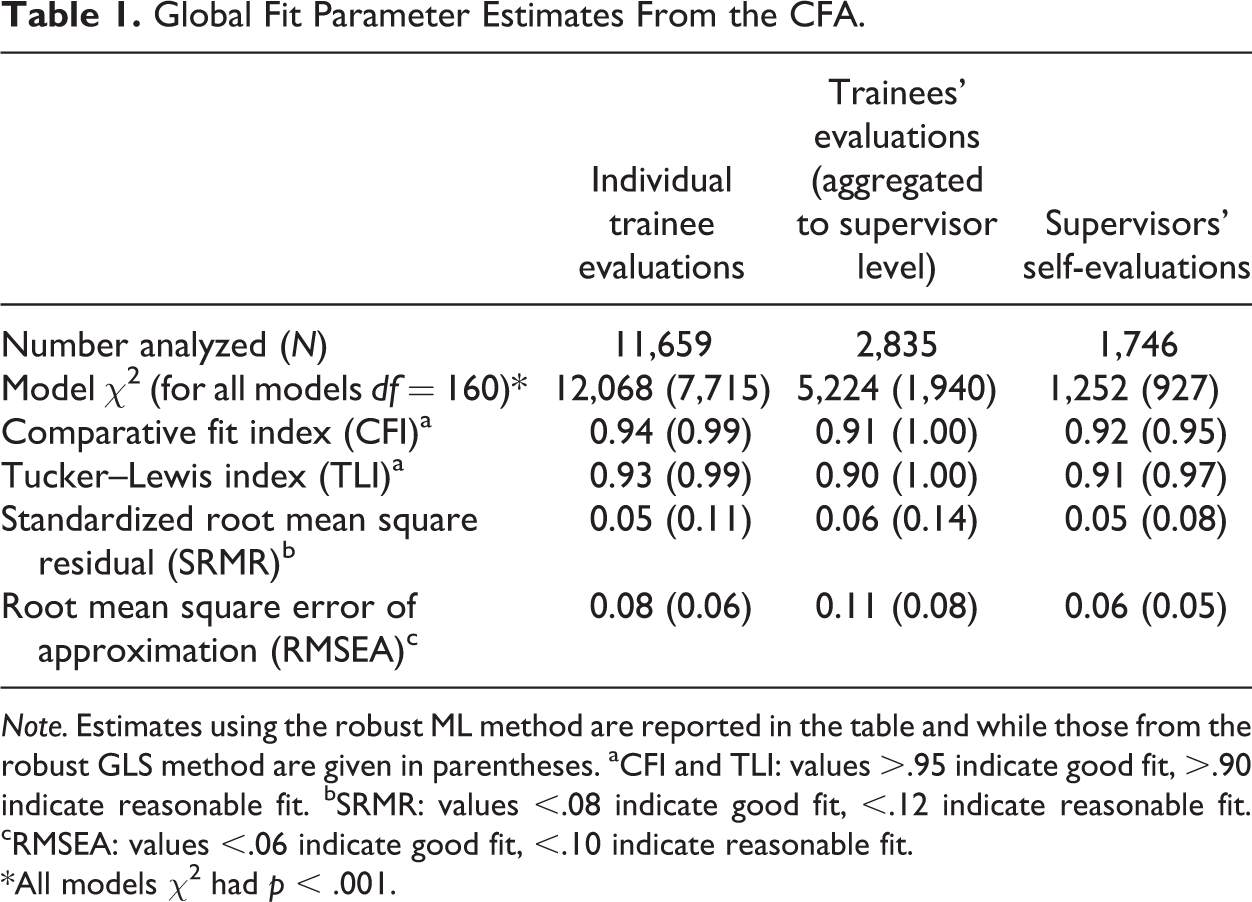
Note. Estimates using the robust ML method are reported in the table and while those from the robust GLS method are given in parentheses. aCFI and TLI: values >.95 indicate good fit, >.90 indicate reasonable fit. bSRMR: values <.08 indicate good fit, <.12 indicate reasonable fit. cRMSEA: values <.06 indicate good fit, <.10 indicate reasonable fit.
*All models χ2 had p < .001.
The reliability coefficients were high for all subscales of the trainee questionnaire and the self-evaluation questionnaire (Table S5 in the online appendix). Internal consistency coefficients (α) ranged from .85 to .91 for the individual trainee questionnaire, from .89 to .93 for trainees’ questionnaire aggregated on supervisor level, and from .73 to .84 for the self-evaluation questionnaire. The inter-scale correlations were all below .71 for the individual trainee questionnaire and the self-evaluation questionnaire (Table S6 in the online appendix). For trainees’ questionnaire aggregated across supervisors, higher inter-scale correlations were found for the scale communication of goals (.73 with learning climate, .72 with evaluation of trainees and .72 with feedback), and between the scales learning climate and evaluation of trainees (.77). The generalizability analysis, that was conducted to reveal if the trainee evaluations, aggregated on supervisor level, had high α levels even if just a few trainees completed an evaluation for a specific supervisor, revealed that if only two or three trainees completed an evaluation, α > .89 for all subscales. In general, as expected, reliability levels were higher when more trainees completed an evaluation for a specific supervisor (Table S7 in the online appendix).
Discussion
This study provides strong evidence for a sufficient validity and reliability of the SETQ questionnaires in a large and diverse sample population. By completing only 20 items, five subscales of supervisors’ teaching performance can be reliably measured. The generalizability analysis showed that trainee evaluations of supervisors had high reliability levels, even when only two or three trainees completed an evaluation of their supervisor.
The SETQ subscales tested in this study were based on generic educational and psychological theories about learning and empirical observations of clinical teaching (Litzelman, Stratos, Marriott, & Skeff, 1998; Litzelman, Westmoreland, Skeff, & Stratos, 1999; Lombarts et al., 2009). After the introduction of competency-based GME and the implementation of competency frameworks by the Accreditation Council for Graduate Medical Education (ACGME) and the Royal College’s Canadian Medical Education Directives for Specialists (CanMEDS), the desired competencies for medical educators were updated by Srinivasan et al. (2011). Although sometimes labeled somewhat differently, all SETQ domains were identified by the updated set of competencies as highly relevant for competency-based GME. In addition to the SETQ domains, some competencies were identified that are currently not captured by the SETQ; no other instrument captures all the proposed domains nor is any likely to given the necessary trade-off between measurement length (or feasibility) and completeness (Srinivasan et al., 2011).
This study uses confirmatory techniques to strengthen the theoretically driven factor structure and provides strong validity and reliability (Arah et al., 2011; Boerebach et al., 2012; Lombarts et al., 2009; van der Leeuw et al., 2012). Strong evidence supporting the validity of evaluation instruments may help the many supervisors using SETQ in taking the feedback generated by those instruments seriously. Also, the evidence is important for the scientific research using the SETQ questionnaires to measure supervisors’ teaching performance and may even further enhance the use of the SETQ for research purposes.
Choosing an appropriate estimation technique to estimate the CFA model is not a straightforward procedure since there is disagreement about which estimator (e.g., ML, GLS, WLS, and ULS) should be used for data that deviates from a perfect normal distribution (Brown, 2006; Kline, 2005; Min, 2008; Olsson et al., 2000). Based on the recommendations of the literature and given the distribution of our data, we choose to estimate two equivalent models for the CFAs, using two different estimators (i.e., robust GLS and robust ML). Surprisingly, some of the goodness-of-fit statistics differed considerably between two equivalent models. The TLI, CFI, and SRMR were consistently higher for the GLS estimated models, while the RMSEA was consistently higher for the ML estimated model. For the trainee evaluations on supervisor level, for instance, CFI and TLI statistics of the GLS estimated model suggest perfect fit of the model (values of 1.00), while these statistics estimated with the ML estimator just reach acceptable fit (values of .90 and .91, respectively). When the goodness-of-fit statistics are considered combined, as suggested by Hu and Bentler (1999), all equivalent models lead to similar conclusions regarding acceptance or rejection of the model.
We split the sample to conduct the EFA and CFA, but eventually they were derived from the same sample population. Ideally, we would have tested the EFA and CFA on different population samples, but given the diversity and size of our sample population, we think our approach is reasonable here. Further, although our models were not fully hierarchical to account for clustering by program or hospital, our results compare well to more complicated cross-classified multilevel CFA models, since the vast majority of the variance is at the supervisor level. The large multicenter setting and the high response rates of this study ensure sufficient generalizability of the results for GME training in the Netherlands. Although the SETQ constructs were largely based on research from the United States (Litzelman et al., 1998, 1999), the results of this study cannot be generalized to GME training programs in other countries without some caution.
Although this study provides strong evidence supporting the psychometric qualities of the SETQ, we must underscore the importance of viewing validation as an ongoing process. Measurement instruments need to be validated and updated over time for their continued relevant and appropriate use in various contexts and groups. The validation process will include (but will not be limited to) regularly interviewing stakeholders; updating the SETQ items in response to scientific, practical, and psychometric findings; and relating performance scores to outcomes that they are expected to correlate with. Such outcomes should reflect teaching and clinical performance, including patient outcomes following care delivered by residents in-training and attending physicians. In future work, we will continue to address these validation issues.
Footnotes
Acknowledgments
Authors’ Note
Declaration of Conflicting Interests
The author(s) declared no potential conflicts of interest with respect to the research, authorship, and/or publication of this article.
Funding
The author(s) disclosed receipt of the following financial support for the research, authorship and/or publication of this article: This project has been supported by the foundation “De Drie Lichten” in The Netherlands. Further, this study is part of the project “Quality of clinical teachers and residency training programs,” which is cofinanced by the Dutch Ministry of Health; The Academic Medical Center, Amsterdam; and the Faculty of Health and Life Sciences of the University of Maastricht.