




Abstract
The Flourishing Scale (FS), created by Diener et al., is a brief subjective perception measurement which assesses flourishing and provides a single score across 8 items. The aim of this study was to assess the psychometric properties of the Spanish version of the FS. Participants were 1,502 university students from different faculties and fields of knowledge. The results reveal good internal consistency. The single factor structure of the FS was supported by the multigroup confirmatory factor analysis, which also provided evidence of the invariant structure of the scale across two subsamples. The scale’s convergent validity with another measure of psychological well-being and its discriminant validity with the depression, anxiety, and stress symptom scale were demonstrated through the significant correlations observed with said measures. The FS was found to be apt for use in evaluating general well-being in the Spanish population and may be considered a reliable measure in future well-being studies. It can also be used as an instrument for planning, executing, and/or assessing practical interventions in social, care, and health-related programs.
Keywords
Interest in well-being has given rise to numerous theoretical and empirical studies over recent decades (Diener, Suh, Lucas, & Smith, 1999; Keyes, Shmotkin, & Ryff, 2002; Ryan & Deci, 2001; Silva & Caetano, 2013), prompting researchers to focus their attention on how this construct can be measured. The term “flourishing” is a relatively recent concept that refers to people’s subjective evaluation of how they feel and how they believe they are functioning in their lives (Huppert, 2009). This way of conceptualizing well-being requires systematic evaluation using reliable, valid, and sensitive measures. This study aims to validate the Flourishing Scale (FS) developed by Diener (Diener et al., 2010) in Spain, in order to have an assessment instrument for well-being that can be applied to a Spanish-speaking population both for research purposes and as part of care-based, community or health interventions.
There are two main conceptual perspectives which define well-being: the hedonic approach and the eudaimonic approach (Ryan & Deci, 2001). The components of the hedonic tradition of well-being, known in scientific literature as subjective well-being, include subjective happiness, positive affectivity related to the experience of pleasure, cognitive judgments about one’s own current life, and the individual value attached to one’s goals. In other words, according to this approach, well-being encompasses both the cognitive and affective assessments people make of all the different elements of their lives (Diener & Lucas, 1999; Diener, Sapyta, & Suh, 1998). In the eudaimonic tradition, well-being is conceptualized as psychological well-being (Keyes et al., 2002). According to this conceptualization, the components of well-being are assessed in accordance with one’s purpose in life, human potential, and personal growth, which are the principal indicators of positive psychosocial functioning.
Authors such as Seligman (2011), Keyes (2002), Huppert and So (2013), and Diener et al. (2010) have tried to integrate these two perspectives, considering that the hedonic and eudaimonic approaches denote different yet equally important aspects of the general well-being construct. Thus, the term flourishing was proposed to describe the desirable state individuals find themselves in when both the hedonic and eudaimonic components of well-being are present at the same time. Flourishing therefore refers to the individual’s perceived feeling that their life is going well. It is the combination in a single construct of feeling good and functioning effectively in one’s life (Huppert, 2009; Huppert & So, 2013; Keyes, 2002; Ryff & Singer, 1998).
The concept of feeling good encompasses not just positive emotions of happiness and satisfaction but also emotions such as interest in and a commitment to the activities of daily living, self-confidence, and affect (Huppert, 2009). For its part, the concept of functioning effectively implies realizing one’s true potential and feeling in control of the course of one’s life. It also involves having a purpose, such as, for example, working to achieve valuable goals and establishing and maintaining positive relationships with others.
An individual who “flourishes” unites both perspectives and consequently feels that their life is going well, learns effectively, works productively, is more likely to contribute to their community, is healthier, and has a longer life expectancy and better social relations (Diener et al., 2010; Huppert, 2009). Flourishing is synonymous with a high level of mental well-being and reflects good mental health and positive development (Huppert & So, 2013).
For many years, psychological research and practice has been focused on the treatment and prevention of pathologies such as depression and anxiety. There was a tacit assumption that general well-being prevailed in the absence of pathology. Now, however, a growing body of scientific evidence suggests that flourishing is much more than the simple absence of pathology (Keyes, 2002). It should therefore be researched as a concept in its own right. Moreover, it has been shown that high levels of flourishing are positive not only for individuals but for society also (Huppert & So, 2013). This is consistent with that advocated by the World Health Organization (2004) which, in its 2004 report, defined health as “a state of well-being in which the individual realizes his or her own abilities, can cope with the normal stresses of life, can work productively and fruitfully, and is able to make a contribution to his or her community” (p. 12).
The FS
The first systematic attempt to measure psychological well-being was made at the end of the 1980s by Ryff (1989), who suggested a multidimensional model of this concept. Ryff’s model comprised six dimensions: self-acceptance, relationships, autonomy, mastery, growth, and purpose in life. To measure these theoretical dimensions of psychological well-being, Ryff developed the “Scale of Psychological Well-Being” (SPWB). New versions of this scale were later proposed, although all retained this six-factor structure (Díaz et al., 2006; Ryff & Keyes, 1995; Ryff, Lee, Essex, & Schmutte, 1994; Van Dierendonck, 2004).
Subsequent to Ryff’s work, authors in the field of humanist theories of positive functioning proposed new instruments for measuring the main aspects of human flourishing. Diener et al. (2010) developed a scale called the FS. The items included in the scale reflect the key components of psychosocial well-being, namely, purpose in life, positive relationships, commitment, competence, self-esteem, optimism, and contribution to others’ well-being. All these aspects form part of a unidimensional construct called flourishing. Various authors have defended the inclusion of these elements in the assessment of this type of general well-being, culminating in the development of Diener’s FS (2010). Thus, Csikszentmihalyi (1990) argued that commitment and flow are the basic components of well-being and psychological capital (Csikszentmihalyi, 1990; Diener et al., 2010). For his part, Seligman (2004) suggested that well-being is made up by both feelings of commitment and interest and by a perception of meaning and purpose in life. Peterson, Seligman, and Vaillant (1988) added optimism as an important element of successful functioning and therefore a necessary factor for measuring flourishing. In the design of the scale, Diener highlighted the social aspect of human mental prosperity, adding elements such as “feeling respected” and “contributing to others’ well-being and happiness.” This view of well-being is linked to health (Brown, Nesse, Vinokur, & Smith, 2003; Diener et al., 2009), insofar as helping other people is more important for one’s own health than receiving help from others.
Thus, the FS encompasses, in a single dimension, both the satisfaction of human needs and an appreciation of the positive things in life. It combines the key elements of different theories of well-being and assesses different aspects of psychosocial functioning. It is an adequate general measure of well-being and is particularly recommended due to its brevity (Diener et al., 2010).
The FS consists of 8 items (which together constitute a single factor) and has good psychometric properties (Diener et al., 2010). In the original study, it was found to have good internal reliability (α = .87) and adequate test–retest reliability (rxy = .71). No significant differences have been observed between the scores obtained by men and women. In regard to convergent validity with other well-being measures, in Diener’s original study, the FS was found to correlate significantly with the summed scores of Ryff’s Psychological Well-Being Scale and Ryan and Deci’s Basic Need Satisfaction Scale (.78 and .73, respectively; Ryan & Deci, 2000).
The FS has been validated for use in a number of different samples, including from Portugal (Silva & Caetano, 2013), Japan (Sumi, 2013), Germany (Esch, Jose, Gimpel, Von Scheidt, & Michalsen, 2013), New Zealand (Hone, Jarden, & Shofield, 2014), China (Tang, Duan, Wang, & Liu, 2014), Canada (Howell & Buro, 2015), and France (Villieux, Sovet, Jung, & Guilbert, 2016). In all validations, some of which were done using confirmatory factor analysis (CFA) while others used Exploratory Factor Analysis (EFA), the data corroborated those reported in Diener’s original study (2010): the single-factor structure of the scale and its good internal reliability (αs = .78 and .83/.95/.85/.91/.90/.89 and .82, respectively). In all studies, both the convergent validity with other well-being measures and the discriminant validity with psychological maladjustment measures (such as, e.g., depression and anxiety measures) were significant. Previous studies have also confirmed the adequacy of the scale’s psychometric properties in different social–cultural samples (Esch et al., 2013; Hone et al., 2014; Howell & Buro, 2015; Silva & Caetano, 2013; Sumi, 2013; Tang et al., 2014; Villieux et al., 2016).
The aim of this study is to validate a Spanish language translation of the FS in a Spanish population (Spanish being the second-most widely spoken language in the world), using a multigroup factor invariance analysis (MGCFA). The factor invariance analysis is an indicator of the quality of the measure, since it ensures its comparability across two different samples. Following Jöreskog (1971) and Elosúa’s (2005) recommendations, we analyze configural invariance, metric invariance, scale invariance, and residual invariance as well as both convergent and discriminant validity.
Method
Participants
The sample was comprised of 1,502 university students. This number was achieved by collecting two subsamples. Sample I was collected from a Public University located in the north of Spain, the University of the Basque Country (UPV/EHU; 65.2% females, mean age = 19.95, SD age = 1.97, age range = 18–29, n = 747). Sample II was collected from a Public University located in the south of Spain, the University of Seville (US; 55.1% females, mean age = 20.69, SD age = 2.21, age range = 18–29, n = 755). An effort was made to recruit participants from different fields of knowledge in a representative distribution (Ministry of Education, Culture and Sports [MECD], 2015): arts and humanities (8.5% in our sample and 9.5% in Spanish universities), social sciences and legal studies (32.2% and 46.6%), engineering and architecture (23.5% and 20.2%), health sciences (29.2% and 17%), and sciences (6.7% and 5.7%). Data were collected by the research team during a 1-hr class.
Instruments
Students were asked to complete an anonymous demographic questionnaire, the FS, the Spanish adaptation of Ryff’s SPWBs (Díaz et al., 2006), and the Spanish adaptation of the Depression Anxiety Stress Scales (DASS-21; Bados, Solanas, & Andrés, 2005; Daza, Novy, Stanley, & Averill, 2002). The sociodemographic questionnaire included data about participants’ age, sex, university, and university field of knowledge.
FS
This scale is an 8-item scale of positive human functioning (Diener et al., 2010). An example of an item is: “I lead a purposeful and meaningful life.” Participants respond to each item on a 7-point Likert-type scale ranging from 1 (strongly disagree) to 7 (strongly agree). Total scores range between 8 and 56. High scores on the scale indicate a high level of flourishing.
SPWBs
The Spanish adaptation of the reduced scale was administered (Díaz et al., 2006; Ryff et al., 1994). This version consists of 29 items and assesses psychological well-being in six dimensions: self-acceptance, positive relationships, autonomy, environmental mastery, purpose in life, and personal growth. Participants respond to each item on a Likert-type scale ranging from 1 (completely disagree) to 6 (completely agree). High scores on this scale indicate a high level of psychological well-being (α = .86).
DASS
The Spanish version of the reduced DASS-21 was administered (Bados et al., 2005; Lovibond & Lovibond, 1995). This scale comprises 21 items which assess the presence of depression, anxiety, and stress over the last 7 days in the general population. A higher order factor is also obtained: “general affective distress” (Daza et al., 2002), which is calculated by adding all the item scores together. Participants respond on a Likert-type scale ranging from 0 (did not apply to me at all) to 3 (applied to me very much, or most of the time). High scores on the three subscales or for the general psychological distress factor indicate the presence of symptoms (α = .89).
Procedure
An official translator translated the English version of FS into Spanish. The research team then compared the original version and the Spanish version to ensure that the meaning of each item was maintained.
The data collection process took place throughout the second semester of the 2014–2015 academic year. During the initial phase, faculty staff from different knowledge areas within the US and the UPV/EHU were contacted in order to request their consent and to gather the data during class time. Specially trained members of the research team then collected the data from the university students. All participants were informed of the aim of the study, and assurances were given that the survey was both anonymous and confidential. All students participated voluntarily, without receiving anything in exchange. The study was approved by the Andalusia Biomedical Research Ethics Committee.
Statistical Analysis
A multigroup confirmatory factor analysis (MGCFA) was performed to assess the factor invariance of the FS in the two Spanish subsamples (US and UPV/EHU), in a cross-validation procedure (Veronese & Pepe, 2016). The aim of this procedure was to confirm the original factor structure proposed by Diener et al. (2010), namely, a unidimensional scale made up by 8 items.
The MGCFA is a hierarchical ordering of nested models, in which constraints are added to each model. The progressive estimation of invariance begins with the configural invariance model, in which all the parameters to be estimated are permitted to vary freely between both samples (unconstrained model). If this model is accepted, it means that the unidimensional factor structure of the FS appears in both samples and that both the sample from southern Spain (US) and the one from northern Spain (UPV/EHU) conceptualize flourishing in the same way. The second model, called the metric invariance model, is obtained by adding constraints on the factor loadings to the base model. In other words, it requires all the factor loadings to be the same across groups. If this model is accepted, it means that in both the southern and northern samples, there is equality in the FS’s measurement intervals. The third model evaluated, the scalar invariance model, analyzes equality between intercepts (the intercept values are fixed). Scalar invariance implies that both samples share origins, which enables the comparison of raw scores. Finally, the fourth model, the error variance invariance model, is achieved by adding the residual equality constraint to the previous model. If this model is accepted, this means that the flourishing measure is completely similar in both samples, since the variance observed in the FS is a combination of the total scores for explained variance and residual variance.
The MGCFA is a specific application of the CFA. Due to the ordinal scaling of all indicators, the estimation method chosen was the robust maximum likelihood estimation (Satorra & Bentler, 2001) implemented in the Lisrel 8.80 program. The fit of four nested models was analyzed, with constraints being added as the parameters to be compared between samples were increased. The fit of the models was evaluated using the most common indicators in CFAs: the Satorra–Bentler scaled chi-squared (SB − χ2) test, the comparative fit index (CFI), the goodness-of-fit index (GFI), and the root mean square error of approximation (RMSEA). The fit of the models was deemed acceptable when CFI and GFI values were equal to or higher than .95 and the RMSEA value was equal to or lower than .08 (Hu & Bentler, 1999). In addition to studying each model separately, the comparative fit of two nested models was assessed. The procedure usually used for accepting invariance is to measure statistical differences in fit indexes (▴) in order to establish the highest level of invariance attained by the data. The cutoff point in the ▴CFI index for rejecting the hypothesis of invariance is ▴ CFI > .01, which corresponds to a p level of .01 (Veronese & Pepe, 2016).
The internal consistency of the scales was analyzed with the SPSS 23.0 statistical package, using Cronbach’s α coefficient. Convergent validity was tested through correlations with six psychological well-being (SPWB) subscales, and discriminant validity was tested through correlations with measures of depression, anxiety, stress, and general affective distress (DASS-21).
Results
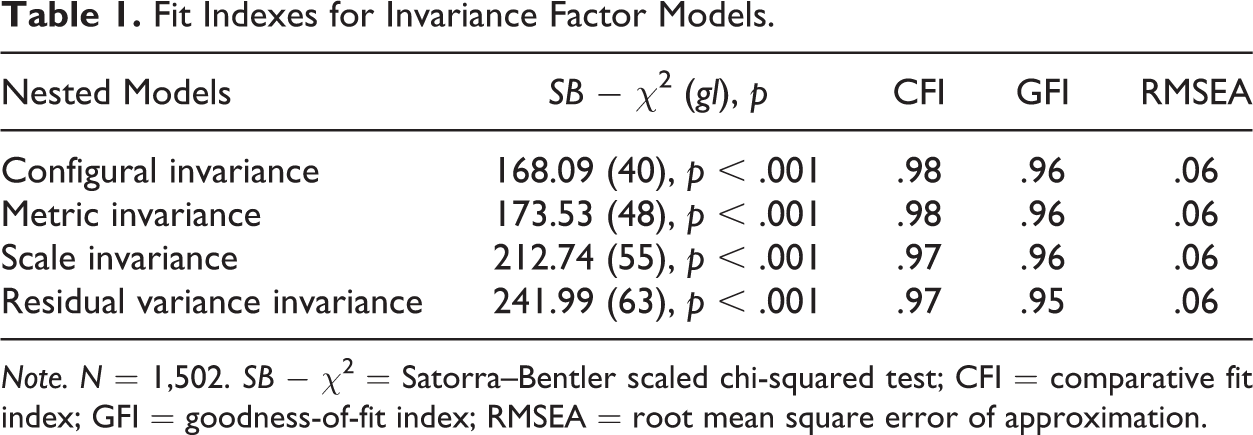
The MGCFA was conducted to assess the fit of the theoretical model proposed by Diener et al. (2010), that is, the FS as a single dimension made up of 8 items. The progressive estimation of invariance began with the configural invariance model, in which all estimated parameters were permitted to vary freely between the two samples (unconstrained model). The indexes of fit obtained confirmed the equivalence of the basic measurement models in both populations (see Table 1). Although the SB − χ2 value was over that required for accepting the invariance hypothesis (p < .05), all other indexes contradicted that conclusion: CFI > .95, GFI > .95, and RMSEA < .08. All the factor loadings (Table 2) were significantly different from zero according to the Wald test (p < .001), and their standardized values were between .46 and .72 in the subsample from southern Spain (US) and between .52 and .65 in the subsample from the UPV/EHU.
Fit Indexes for Invariance Factor Models.
Note. N = 1,502. SB − χ2 = Satorra–Bentler scaled chi-squared test; CFI = comparative fit index; GFI = goodness-of-fit index; RMSEA = root mean square error of approximation.
Standardized Factor Loadings (λ) for Invariance Models, Corrected Item-Total Correlations, and Cronbach’s α If the Element Is Eliminated.

Note. CI = configural invariance; MI = metric invariance; SC = scale invariance; RI = residual variance invariance; US = University of Seville; UPV/EHU = University of the Basque Country.
The metric invariance model was configured over the basic model by adding constraints to the factor loadings. This model consists of equaling the factor loads (Table 2) in both samples. Although the SB − χ2 value was statistically significant (p < .05), the model’s fit was deemed acceptable due to the results obtained in the alternative indexes used (Table 1). Moreover, this level of invariance was accepted, since upon comparing this model with the basic one, no statistically significant differences were found in the SB − χ2 test, ▴ SB − χ2 (8) = 5.44, p = .710, and the difference between the two CFI indexes did not exceed .01.
After demonstrating the metric invariance of both samples, the equality of the intercepts was assessed with the aim of evaluating scale invariance. This model was found to have a good fit, both when assessed separately and when evaluated in relation to its nesting with the metric invariance model. As with the previous models, although the χ2 value was significant, all other indexes indicated an acceptable fit of the model (Table 1). Also, when the SB − χ2 values were compared, a significant discrepancy was observed between scale and metric invariance models, ▴ SB − χ2 (7) = 39.21, p < .001, but since their respective CFIs did not exceed 0.01, the model was accepted.
Finally, a further constraint was added (residual variance invariance) to the scale invariance model in order to assess residual invariance. Despite the fact that the χ2 value was once again significant (p < .001), all other indexes indicated an acceptable fit (Table 1). Moreover, since the discrepancy between the CFIs of the scale invariance and residual invariance models never exceeded .01, the residual invariance model was finally accepted.
Table 2 shows standardized factor loadings for the four invariance models and the internal consistency of the scale. The internal consistency of the 8-item scale was adequate in both the sample from the US (α = .82) and in the sample from the UPV/EHU (α = .81). In both populations, all the questionnaire items were maintained, since all the corrected item-total correlations were positive and over .30, and no increases were observed in the α coefficient when any item was excluded (Table 2).
When scores on the FS were compared (students from Seville, mean = 46.8, and students from the Basque Country, mean = 46.5), no statistically significant differences were observed between the two subsamples, F(1, 1500) = 1.68, p = .19). The level of flourishing in both groups of university students was therefore similar.
Convergent and discriminant validity were explored by calculating the correlations between the FS and the SPWBs and DASS-21. Table 3 shows the positive and significant correlations observed between the FS and all the subscales of the SPWB. The correlation was higher with the self-acceptance and purpose in life subscales and lower with the autonomy subscale. As expected, the FS correlated negatively and significantly with all the subscales of the DASS-21 (Table 3).
Correlations Between Flourishing (FS), Psychological Well-Being (SPWB) and Depression, Anxiety, Stress Scales (DASS-21).
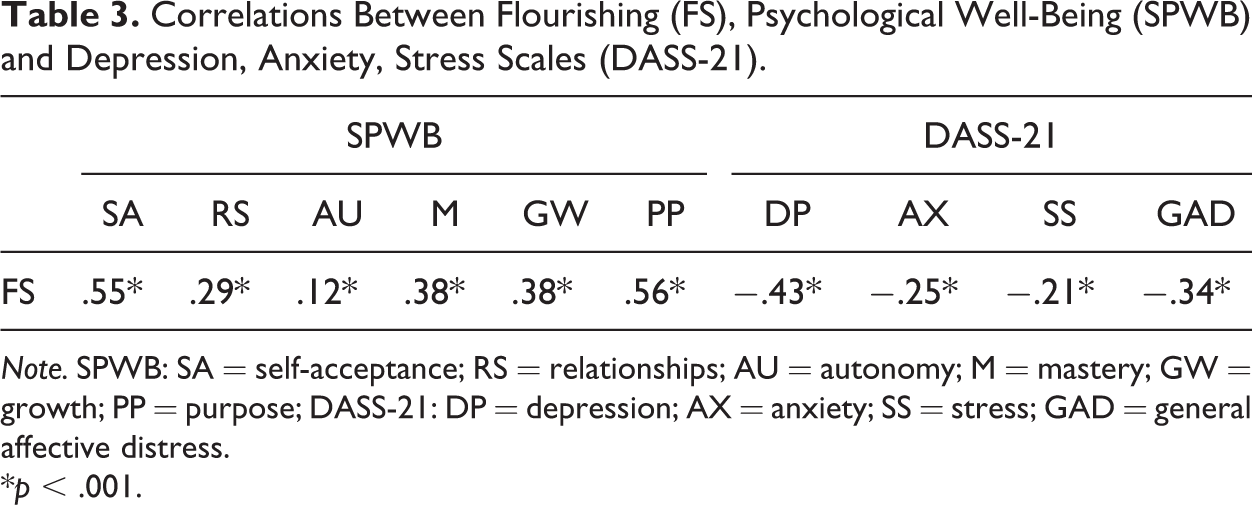
Note. SPWB: SA = self-acceptance; RS = relationships; AU = autonomy; M = mastery; GW = growth; PP = purpose; DASS-21: DP = depression; AX = anxiety; SS = stress; GAD = general affective distress.
*p < .001.
Discussion
The main aim of this study was to explore the psychometric properties of the Spanish version of Diener et al.’s FS (2010) in a sample of Spanish university students. The factor analysis confirmed the unidimensionality of the FS and provided evidence of its invariant structure across the two subsamples. Thus, the FS was found to be a robust measure of subjective well-being. These results are consistent with those reported by the original study (Diener et al., 2010), which were in turn corroborated in subsequent studies with different social–cultural samples (Esch et al., 2013; Hone et al., 2014; Howell & Buro, 2015; Silva & Caetano, 2013; Sumi, 2013; Tang et al., 2014; Villieux et al., 2016). Our data provide further evidence of the scale’s reliability (α = .81).
The scale’s convergent validity was analyzed by comparing it with a scale measuring psychological well-being (SPWB). FS scores were found to correlate positively with the SPWB, although the correlation with the autonomy subscale was lower. This is consistent with that found by Diener (2010) in the original study. One possible explanation may be that Ryff defined the autonomy dimension of her well-being scale as the need for self-determination and independence, highlighting autonomous functioning and resistance to enculturation. This aspect of well-being is less closely related to the social facet of human prosperity that Diener highlights in the FS, expressed as the need to feel supported and to contribute to others’ happiness. For its part, the scale’s discriminant validity was determined in relation to the DASS-21 scale, which measures depression, anxiety, and stress. The FS was found to correlate negatively with this scale. The results therefore verify both the convergent and discriminant validity of the FS. We consider the scale to be an adequate instrument for evaluating well-being, with the added advantage of being a brief scale comprising only 8 items.
Our results found no significant differences between the flourishing levels of students at the US and those at the UPV/EHU, with both subsamples having similar levels to those found in other Western countries. Thus, in this study, the mean score for flourishing was 46.65, while in the original study by Diener (2010), the mean score for flourishing was 44.97; in the validation study for Portugal (Silva & Caetano, 2013), it was 43.71; in the French validation study (Villieux et al., 2016), it was 42.63; and in the Canadian one (Howell & Buro, 2015), it was 46.69. This similarity in flourishing levels reported in different studies may be explained by the similarity of the samples, since all were made up of university students. In this sense, we agree with other authors who argue that it is vital for the FS to be tested in representative samples of the population (Diener et al., 2009; Hone et al., 2014) as well as in diverse social–cultural contexts.
This study attests to the internal consistency and validity of the FS construct in two large, independent samples. Nevertheless, one limitation of these findings, which is shared with other previous validation studies, is that the sample group is comprised exclusively of university students. We believe additional research should be carried out in other groups in order to extend and broaden the validity of the instrument to include other sectors of the Spanish population.
In sum, in relation to the aim of the present study, we can state that our results show that the Spanish version of the FS has similar psychometric properties to those reported in the original study (Diener et al., 2010). Furthermore, the study attests to the scale’s reliability, factor validity, and convergent and discriminant validity.
We can now say that we have a brief, easy-to-administer scale in Spanish for measuring flourishing that can be used not only for research purposes but may also help orient professional practice in both the social field and in relation to mental health. Scientific evidence to date suggests that flourishing is a key element of global mental health. Indeed, as Keyes states (2002, p. 210): “Adults with complete mental health are flourishing in life with high levels of well-being. To be flourishing, then, is to be filled with positive emotion and to be functioning well psychologically and socially.” Flourishing is also a desirable condition in any community, corporation, or government aiming to protect or foster the mental health of its members/citizens (Keyes, 2005). In this sense, the FS may be a useful instrument for planning, executing, and assessing practical interventions in social, care-bared, and general health-oriented programs, since it enables quick and easy identification of particularly vulnerable population segments who score poorly for flourishing and who would benefit from specific intervention programs designed to improve their health and well-being.
Footnotes
Declaration of Conflicting Interests
The author(s) declared no potential conflicts of interest with respect to the research, authorship, and/or publication of this article.
Funding
The author(s) disclosed receipt of the following financial support for the research, authorship, and/or publication of this article: This research was supported by Grant EDU2013-45687-R provided by Spain’s Ministry of Economy and Competitivity.