
Abstract
The promotion of competency of nurses and other health-care professionals is a goal shared by many stakeholders. In nursing, observation-based assessments are often better suited than paper-and-pencil tests for assessing many clinical abilities. Unfortunately, few instruments for simulation-based assessment of competency have been published that have undergone stringent reliability and validity evaluation. Reliability analyses typically involve some measure of rater agreement, but other sources of measurement error that affect reliability should also be considered. The purpose of this study is three-fold. First, using extant data collected from 18 nurses evaluated on 3 Scenarios by 3 Raters, we utilize generalizability (G) theory to examine the psychometric characteristics of the Nursing Performance Profile, a simulation-based instrument for assessing nursing competency. Results corroborated findings of previous studies of simulation-based assessments showing that obtaining desired score reliability requires substantially greater numbers of scenarios and/or raters. Second, we provide an illustrative exemplar of how G theory can be used to understand the relative magnitudes of sources of error variance—such as scenarios, raters, and items—and their interactions. Finally, we offer general recommendations for the design and psychometric study of simulation-based assessments in health-care contexts.
Regulatory boards, educational institutions, and health-care facilities are tasked with ensuring newly graduated health-care professionals are ready to care for patients safely, effectively, and efficiently. These entities invest large amounts of time, resources, and money in the process of competency evaluation of health-care professionals. In addition, maintaining and improving the competency of nurses and other health-care professionals are critical to keeping pace with changes in practice standards and technology.
Those leading efforts to assess competency in the health-care professions face various challenges. Many types of clinical knowledge and applications as well as the demonstration of professionalism and skilled communication cannot be adequately assessed by paper-and-pencil tests (Boulet et al., 2003; Goodstone & Goodstone, 2013; Katz, Peifer, & Armstrong, 2010; Swanson & Stillman, 1990). Alternatively, observation-based forms of assessment may be used to measure competency in professional practice contexts that require the simultaneous use of critical thinking and psychomotor skills. Still, clinical opportunities to evaluate high-risk skills are not readily available, and ensuring patient safety prevents the assessment of many skills in the clinical environment.
The need for clinical competency measures has led to the use of simulation as a safe, objective method to assess the performance of health-care professionals. In simulation, standardized patients or human patient simulators (HPSs) replace actual patients, allowing for the assessment of a variety of skills and knowledge in realistic clinical situations. Alinier and Platt (2013) defined simulation as being a technique that recreates a situation or environment to allow learners (in the widest sense of the term) to experience an event or situation for the purpose of assimilating knowledge, developing or acquiring cognitive and psychomotor skills, practicing, testing, or to gain understanding of systems or human actions and behaviors (p. 1).
The purpose of this article is three-fold. First, we utilize generalizability (G) theory to examine the psychometric characteristics of the Nursing Performance Profile (NPP), an instrument that measures nursing competency using simulation (Hinton et al., 2012; Randolph et al., 2012). Reliability evidence is critical because the NPP is used to provide supporting evidence during regulatory investigations. Second, we provide through our analysis an illustrative exemplar of how G theory can be used to understand the relative magnitudes of sources of error variance—such as scenarios, raters, and items—and their interactions. Generalizability (G) and decision (D) studies supported estimation of the reliability of designs that vary by the numbers of raters and scenarios, using all 41 items from the NPP, informing designs that reduced sources of error variance while optimizing reliability coefficients. Finally, we offer general recommendations for the design and psychometric study of simulation-based assessments in health-care contexts.
Literature Review
Measuring Competence
One area of concern for educational institutions, health-care facilities, and regulatory boards is the gap between newly graduated nurses’ knowledge base and the minimum level needed to practice independently, a gap that appears to be widening (Hughes, Smith, Sheffield, & Wier, 2013). As the Nursing Executive Center (2008) reported, almost 90% of academic leaders were confident their graduates were ready to care for patients safely and effectively, but only 10% of hospital leaders agreed (Ashcraft et al., 2013). Experienced nurses have reported their concerns about new graduate nurses’ clinical competence, particularly in the areas of critical thinking, clinical/technical skills, communication skills, and general readiness to practice (Missen, McKenna, & Beauchamp, 2016). Unfortunately, the lack of evidence-based performance measures has made it difficult to prescribe solutions for assuring that nursing graduates attain clinical competence and maintain it over the course of a career.
Establishing processes for measuring competency is critical. Both the National Board of Osteopathic Medical Examiners and the National Board of Medical Examiners successfully implemented clinical performance exams for medical students after extensive development and piloting of cases and measurement instruments. However, the National Council of State Boards of Nursing [NCSBN] has not yet implemented a clinical performance examination for licensure, and nursing is reportedly the only health profession that does not require one in the United States (Kardong-Edgren, Hanberg, Keenan, Ackerman, & Chambers, 2011). Reports issued by the Carnegie Foundation for the Advancement of Teaching, the NCSBN, and the Joint Commission on Accreditation of Hospitals have indicated the need for nurses to be better prepared for clinical practice (Meyer, Connors, Hou, & Gajewski, 2011). Recommendations stemming from the Carnegie Foundation Report on Nursing Education have been made to the NCSBN to pursue the development of a set of three national, simulation-based examinations of nursing performance, the first to begin before students graduate from nursing school and the third test finalizing licensure after 1 year of a proposed residency program (Kardong-Edgren et al., 2011).
State boards of nursing and nursing schools are increasing efforts to develop performance-based assessments. However, in a review of the literature to identify simulation-based assessment in the regulation of health-care professionals, Holmboe, Rizzolo, Sachdeva, Rosenberg, and Ziv (2011) found that no states have thus far required a clinical exam for graduating nurses. Further, while research focused on Clinical Simulation in Nursing has increased over the last decade, the development of instruments to measure the learning that takes place or the level of competency attained has not kept pace (Manz, Hercinger, Todd, Hawkins, & Parsons, 2013). Systematic reviews on simulation in nursing and other health sciences have reported a lack of measurement tools to evaluate competency using high-fidelity simulation (Harder, 2010; Yuan, Williams, & Fang, 2011), and the majority of the instruments available have not undergone systematic psychometric testing (Elfrink Cordi, Leighton, Ryan-Wenger, Doyle, & Ravert, 2012; Kardong-Edgren, Adamson, & Fitzgerald, 2010; Prion & Adamson, 2012).
Problems with observation-based assessment in education are well-documented (Waters, 2011). The provision of accurate and meaningful assessment data requires the development of reliable and valid measurement. Even after an instrument has undergone rigorous validation, many sources of error can affect reliability, including issues involving raters and the scenarios used in the assessment process. For example, rater subjectivity may result in bias, and although standardization of scoring may be improved through careful rater training, often rater scoring still results in suboptimal reliability scores. Scenarios used in simulations may be perceived as more or less difficult by participants. A thorough analysis of the variables that impact reliability is critical before assessment data are used for high-stakes decisions such as graduation, licensure, employment, or disciplinary action.
Generalizability Theory
Traditionally, classical test theory (CTT) is often used as a framework to examine reliability and measurement error (Boulet, 2005). A major limitation of this method is that sources of error are undifferentiated. As an alternative to CTT, G theory may be used to evaluate observational systems and improve the estimation of reliability (Bewley & O’Neil, 2013; Briesch, Swaminathan, Welsh, & Chafouleas, 2014). In G theory, analysis of variance (ANOVA) is used to identify the various sources and magnitudes of error. Rather than emphasizing tests of statistical significance (Boulet, 2005) or F tests (Brennan, 2011) as in ANOVA, G theory focuses on the estimation of variance components (Brennan, 2001), which are partitioned sources of variability in scores on an assessment. In a simulation-based assessment, for example, score variation will result from differences in skills among persons being assessed but may also be attributable, in part, to facets of the assessment design—such as items, scenarios, and raters—as well as their interactions.
Two types of studies are utilized within the conceptual framework of G theory to inform the optimal assessment design in terms of numbers of conditions within each of the facets (e.g., items, scenarios, and raters): G and D studies (e.g., Boulet, 2005; Brennan, 2001). First, a G study is typically conducted to estimate the variance components and relative magnitudes of sources of measurement error for participants and each facet, along with their interactions, based on data collected using a specified set of conditions for each facet. Then, to better understand how the assessment design might impact reliability of scores, the information about the sources of measurement error gained from the G study is utilized to conduct one or more D studies. In D studies, the number of conditions in a facet is systematically varied to determine how many conditions (e.g., number of scenarios or number of raters) are required to achieve the desired reliability.
Although attention to reliability and validity is increasingly being reported in the literature, often only coefficient α or interrater reliability statistics are provided to satisfy reliability testing, and usually only vague references are made to experts ensuring content validity. To our knowledge, only one article has described the use of G theory to identify a minimum number of scenarios or minimum number of raters to achieve high reliability in observation-based assessment in nursing (Prion, Gilbert, & Haerling, 2016). On the other hand, studies conducted in medical education using standardized patients and HPSs have successfully utilized G theory to determine the number of scenarios and number of raters needed for reasonable reliability estimates (Boulet & Murray, 2010; Boulet et al., 2003).
NPP
The NPP instrument was developed through a collaboration of three entities: the Arizona State Board of Nursing (ASBN), the Arizona State University, and Scottsdale Community College (Hinton et al., 2012; Randolph et al., 2012; Randolph & Ridenour, 2015). Funding from the NCSBN Center for Regulatory Excellence supported the development of an instrument that measures nine categories of clinical competence: professional responsibility, client advocacy, attentiveness, clinical reasoning (noticing), clinical reasoning (understanding), communication, prevention, procedural competency, and documentation (Randolph et al., 2012). The nine categories were developed from modifications of the Taxonomy of Error Root Cause Analysis and Practice Responsibility (TERCAP) categories (Benner et al., 2006) and the NCSBN survey tool, the Clinical Competency Assessment of Newly Licensed Nurses (CCANLN; as cited in NCSBN, 2007; Randolph et al., 2012), a 35-item survey tool used to measure clinical competency, practice errors, and practice breakdown risk (Randolph et al., 2012). The authors of the NPP received permission to categorize CCANLN items into the modified TERCAP-based categories. Items and categories were added and edited, resulting in the final nine-category NPP instrument consisting of 41 items, with 4–8 items per category. Raters completed a dichotomous scale of safe versus unsafe behaviors (Randolph et al., 2012).
The authors of the NPP instrument developed scenarios that involve common adult health situations and require nursing actions and behaviors involved in the care of a patient. A sample of 21 registered nurse (RN) volunteers each performed nursing care in three high-fidelity simulation scenarios, resulting in 63 videos. Three raters, blinded to participant ability and scenario order to prevent bias, viewed each video independently.
The NPP instrument has subsequently been used to provide objective data in assessing nurses referred for evaluation from the ASBN in identifying unsafe nursing practices (Randolph & Ridenour, 2015). Based upon available research, the NPP instrument is one of the few nursing performance instruments that has undergone validity and reliability testing (Hinton et al., 2012; Randolph et al., 2012), and it is the only one used to evaluate postlicensure nursing competency at the state level. Building upon the research and analysis already conducted on the NPP instrument and the accompanying scenarios, the current study was intended to provide a deeper analysis of the reliability of data obtained by the instrument and provide guidance for decision-making to ensure a psychometrically sound rating process.
During Measuring Competency With Simulation (MCWS) Phase I, reliability was examined using interrater agreement, intrarater reliability, and internal consistency of items (Hinton et al., 2012). Interrater agreement was measured by the percentage of agreement by at least two of the three raters on each item, and internal consistency of items on the NPP was estimated using Cronbach’s α. As noted by Boulet and Murray (2010), interrater reliability is important to examining the overall reliability of data obtained by observation-based assessment instruments, but an examination of other sources of error is also critical to achieve a more complete understanding of an assessment’s reliability. Prior to the present study, measurement error associated with the scenarios had not been analyzed, and the optimum numbers of raters and scenarios to achieve high reliability had not been identified.
Method
In the following analysis, we conducted G and D studies to inform the optimal assessment design in terms of numbers of scenarios and raters used in the NPP. First, a G study was conducted to estimate the variance components and relative magnitudes of sources of measurement error for scenarios, raters, items, and nurse participants, as well as their interactions, based on the current simulation-based NPP implemented using three scenarios and three raters. A series of D studies were then conducted to estimate the impact on reliability of the 41-item NPP when varying the numbers of scenarios and raters from one to nine.
Participants
Nurse participants
The MCWS study (Hinton et al., 2012; Randolph et al., 2012) and this secondary analysis were approved by the appropriate institutional review boards. The MCWS Phase I project included 21 participants. Of these, 18 participants’ recorded performances were rated by the same three raters and were included in the G and D studies. All participants were practicing RNs working in either academic or professional settings. The mean age of the 16 participants who provided demographic data was 31.81 years, SD = 8.90, and all were female. The racial/ethnic distribution of participants was 56.25% White, 25% Hispanic, and 18.75% Black. The majority of participants had associate’s degrees (75%) and 25% had bachelor’s degrees. Ten of the 16 participants reported more than 1 year of experience as an RN, whereas six had been licensed less than 1 year (M = 1.35, SD = .74). No simulation experience was reported by 18.75%, some experience was reported by 68.75%, and frequent simulation experience was reported by 12.50% of nurses.
Raters
Three subject matter experts independently evaluated the videos from each of the three simulation scenarios completed by all 18 participants included in this study; data from a fourth rater who had only assessed videos for three additional participants were not included in order to utilize a fully crossed design. Raters were blinded to order of scenarios. The three raters whose data were used in this secondary analysis had between 3 and 22 years of nursing experience (M = 9.67 years, SD = 10.69), a bachelor’s degree, and experience evaluating nursing performance. They were White, female, and ranged in age from 32 to 51 years.
Measure and Scenarios
The NPP instrument
Researchers from the MCWS Phase I Study reported the reliability of the NPP was initially evaluated using a pilot scenario. Volunteer nursing students were rated by five expert raters over two measurement occasions (Randolph et al., 2012). The mean percentage of agreement across the five raters over all items was reported at 92%. Cronbach’s α internal consistency estimate of reliability was .93, and intrarater reliability ranged from 85% to 97%, with a mean of 92% across all raters (Randolph et al., 2012).
Scenarios
Three adult health, acute care scenarios were designed in the initial study by a team of expert nurses for use with the NPP tool (Hinton et al., 2012). “Scenarios were intended to measure basic competency with broad applicability and to provide opportunities for individual nurses to exhibit competency on all nursing performance items” (Randolph et al., 2012, p. 544).
Three forms of each scenario were developed that included name changes for the patients in each scenario as well as surface changes in the content (e.g., a phone call from a friend vs. a parent during the scenario) that did not affect substantive components. Data from the three forms of each acute care scenario were combined for the current study.
Procedure
Each nurse participant engaged in a randomly selected form of each of the three scenarios in a randomized order. No order effect on ratings was found in previous studies (Hinton et al., 2012). A simulation nurse specialist was trained to conduct the simulations using standardized cues and responses. Participants were oriented to the simulation environment, and the simulation was recorded using either Meti LearningSpace (CAE Healthcare, 2012), an audiovisual and center management system that provides recording and tracking services integrated with simulation at one facility or a customized system at a second facility.
Raters attended a 3.5-hr training session. During the session, two researchers described the project, provided resources (such as nursing scope of practice regulatory documents), and explained the rating forms. The raters viewed recordings of simulation performances representing a range of safe and unsafe nursing behaviors. After viewing each recording, raters independently completed ratings and documented details to support those ratings. The raters then discussed their rationales with the other raters and the training facilitators before viewing the next performance. Raters were reminded to assign scores based on their judgments of safety rather than a judgment of optimal performance. Further discussion and clarification about specific language such as “conflict” and “delegation” also led to improved rater agreement. After viewing three recorded performances and discussing their rationales for ratings, the raters tended to rate the training videos similarly. After raters completed the training session, they were scheduled for independent rating sessions.
During the research project rating session, videos were organized for rating in random order by participant and by scenario. Raters independently viewed each video and scored performance using the 41-item NPP. Raters had the choice of scoring each item as 1 (safe performance), 0 (unsafe performance), or “NA” (not applicable; no opportunity to observe behavior in the scenario).
Data Analysis
Descriptive statistics
Item and category means and standard deviations were calculated across scenarios and raters. Means and standard deviations were also calculated for each item and category, by scenario across raters, and by scenario for each rater. In addition, scenario means and standard deviations were calculated for each rater across items and across items and raters.
Missing data
Of the 6,642 possible ratings, 12 (.18%) ratings were missing. An additional 70 ratings marked “NA” (1.05%) were treated as missing data after rater reasons for using the “NA” option were reviewed. The 82 missing data points (1.23% of the 6,642 possible observations) were handled using multiple imputation in SPSS Version 21. Five replicate data sets were imputed and imputed values were not rounded (Enders, 2010). Each data set was used to run separate G studies using GENeralized analysis Of VAriance (GENOVA) (Brennan, 2001; Center for Advanced Studies in Measurement and Assessment, 2013; Crick & Brennan, 1983), and the resulting estimated variance components were then combined using Rubin’s (1987) rules (Enders, 2010; Wayman, 2003).
G study
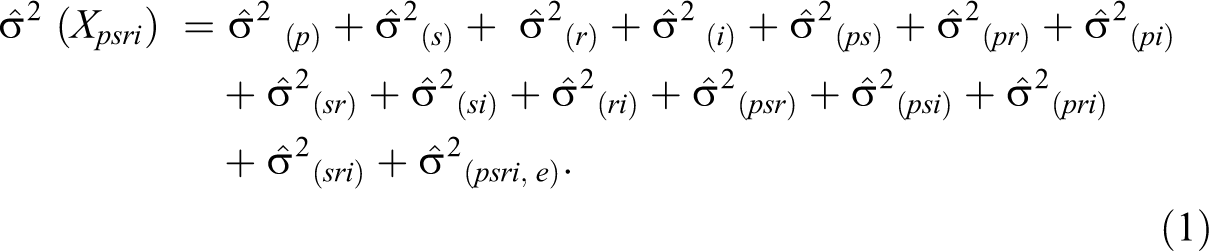
The design for the G study included a three-facet universe, representing three conditions of measurement: raters, scenarios, and items. Since all raters evaluated all scenarios and all participants using all 41 items on the NPP instrument, raters were crossed with scenarios and items, resulting in a p × s × r × i design, where p = nurse participants, s = scenarios, r = raters, and i = items. The sample of scenarios, raters, and items used was considered to be exchangeable with any other sample of scenarios, raters, and items in the defined universes for these facets, so the design is classified as random. We included items as a facet because we wanted to examine in our G study the percentage of total variance attributed to items, given that the variance component for the item effect captures how much items differ from each other in difficulty. The RNs who participated and were evaluated by raters in the study were the participants, or objects of measurement.
Using the software program GENOVA (Brennan, 2001; Center for Advanced Studies in Measurement and Assessment, 2013; Crick & Brennan, 1983), 15 sources of variability were explored for this three-facet design, including the universe score variability and 14 sources associated with the three facets. They were the main effects for scenario (s), rater (r), and item (i); 6 two-way interactions; 4 three-way interactions; and the residual for the rater–scenario–participant–item interaction. Variances were estimated for each effect. Total estimated variance,
D studies
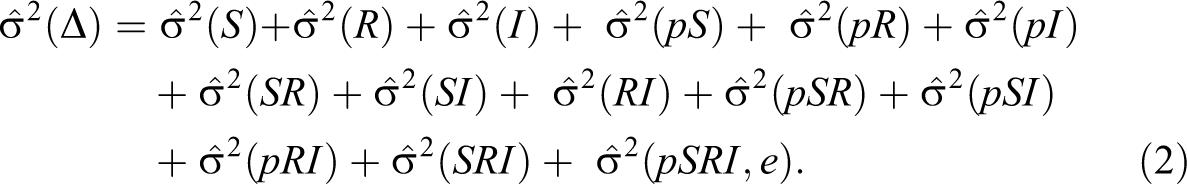
D studies were conducted to generalize scores based on the specific scenarios, raters, and items in the current measurement procedure to all scores for a universe of generalization that involves many other scenarios, raters, and items. This resulted in a random model with the random facets of scenario, rater, and items. The D study design was p × S × R × I.
The variance components estimated in the G study were used to obtain estimated D study variance components. In the D study, the variance of the absolute errors,
The absolute error variance was estimated for one to nine raters across numbers of scenarios ranging from one to nine.
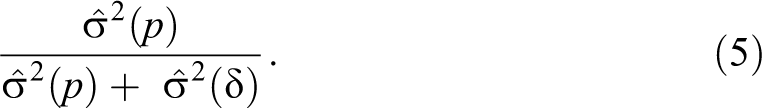
The variance of the relative errors,
Two reliability-like coefficients were estimated for each D study design. The index of dependability, phi (
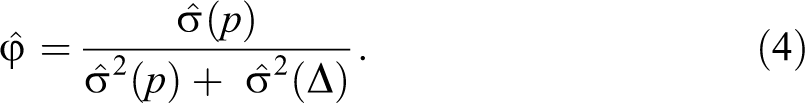
The G coefficient,
G and dependability coefficients are considered analogous to reliability coefficients. Although no universal standard exists to define adequate reliability, some researchers have suggested minimum levels based upon how the measure is being used (Briesch et al., 2014). For example, Ram et al. (1999) proposed a minimum coefficient of .80 for high-stakes exams, while Johnson, Penny, and Gordon (2009) reported minimum levels of .70 have been accepted for research studies and low-stakes assessments and .85 to .90 for high-stakes exams (Briesch et al., 2014). The literature does not distinguish between G and dependability coefficients in G theory when minimum levels of reliability are recommended. However, Shavelson and Webb (1991) report that the G coefficient is considered analogous to the reliability coefficient in CTT, so it is logical to infer these minimum levels may be applied to values of the G coefficient.
The effect of varying the sample sizes for raters and scenarios while keeping items constant at 41 (the number of items on the NPP instrument) on
Results
Descriptive Statistics
Category mean scores, which are the average proportion correct (i.e., proportion of “1” or “safe practice” ratings) across items within each category and all participants, along with standard deviations and numbers of missing responses, are shown in Table 1 for each scenario and rater. In the interest of brevity, item-level statistics are summarized below and are available by request from the first author.
Category Means and Standard Deviations by Scenario and Rater: M (SD).
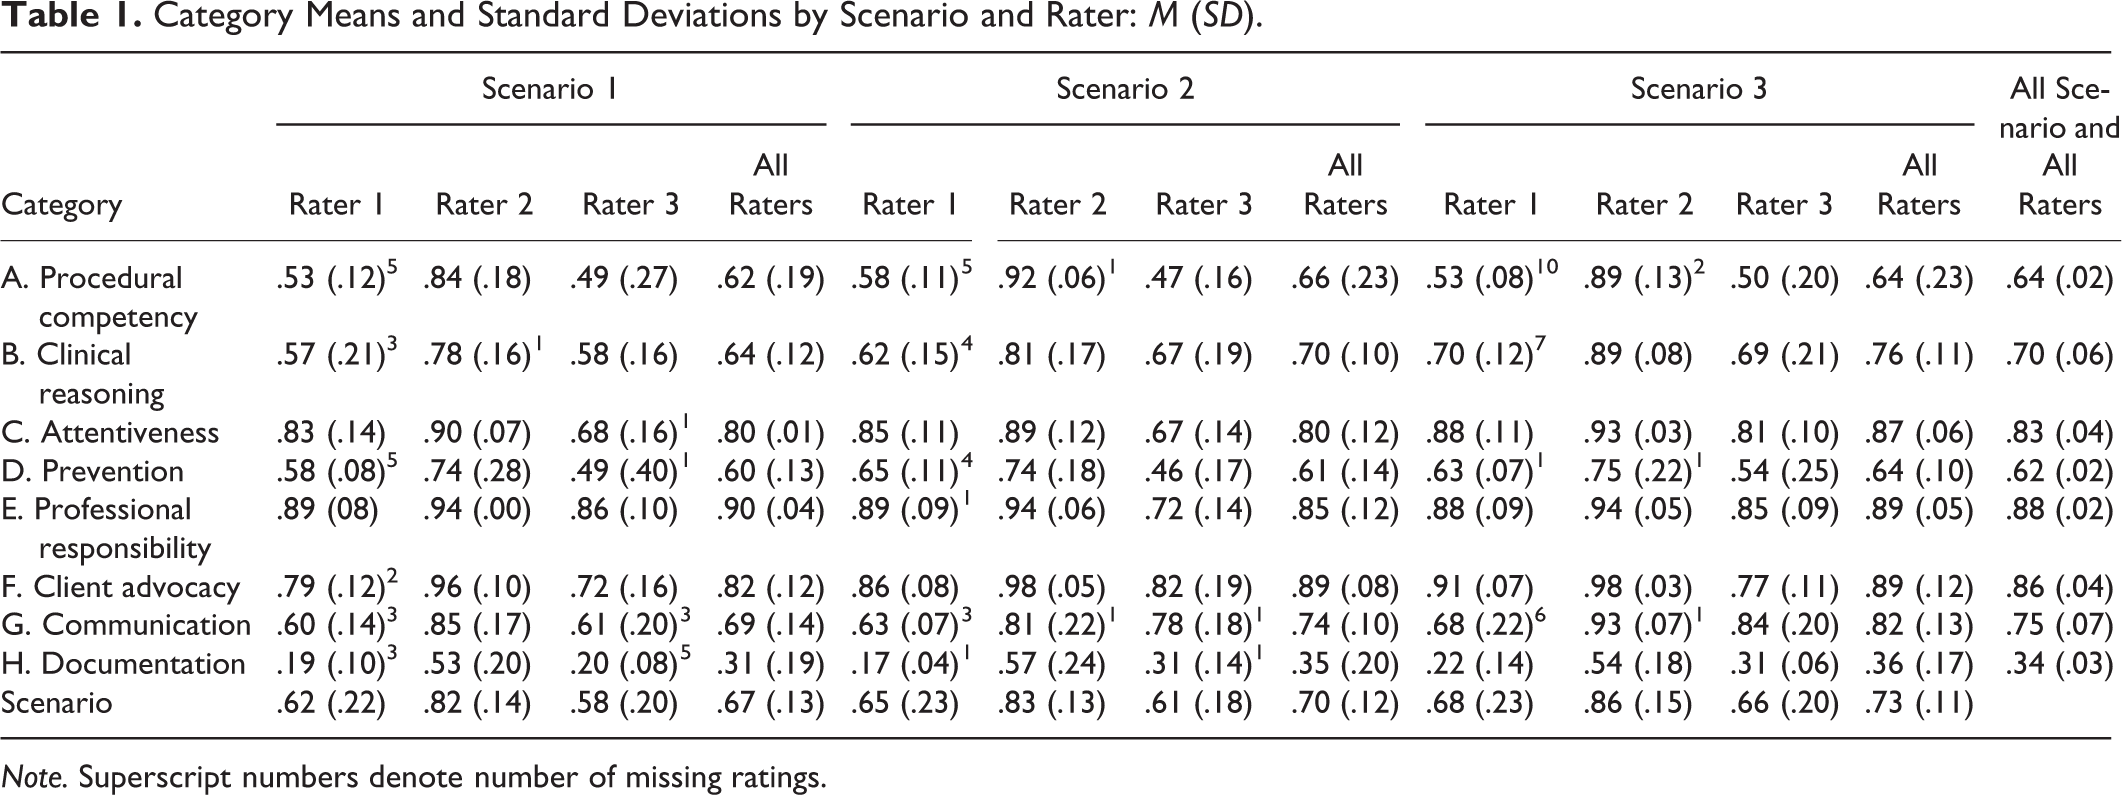
Note. Superscript numbers denote number of missing ratings.
Mean scores varied among raters, with Rater 3 scoring lowest and Rater 2 scoring highest. All three raters’ mean ores were lowest for Scenario 1 (a patient with diabetes) and highest for Scenario 3 (a patient with a fracture). The category mean scores averaged over all scenarios and raters were lowest for documentation and highest for professional responsibility.
G Study
A G study was conducted (see Table 2). Score variances were estimated for each effect along with the percentage of variance attributed to each effect. The variance components in the G study describe all sources of variation based on sampling a single scenario, a single rater, and a single item from the scenario, rater, and item universes. The components responsible for the largest proportions of total variance were items (11.86%) and raters (6.29%). The object of measurement, nurse participant, contributed 5.45% of the total variance. Variance attributed to scenarios was responsible for only .17% of total variance.
G Study Variance Component Estimates and Percentage of Total Variance for p × s × r × i Design.
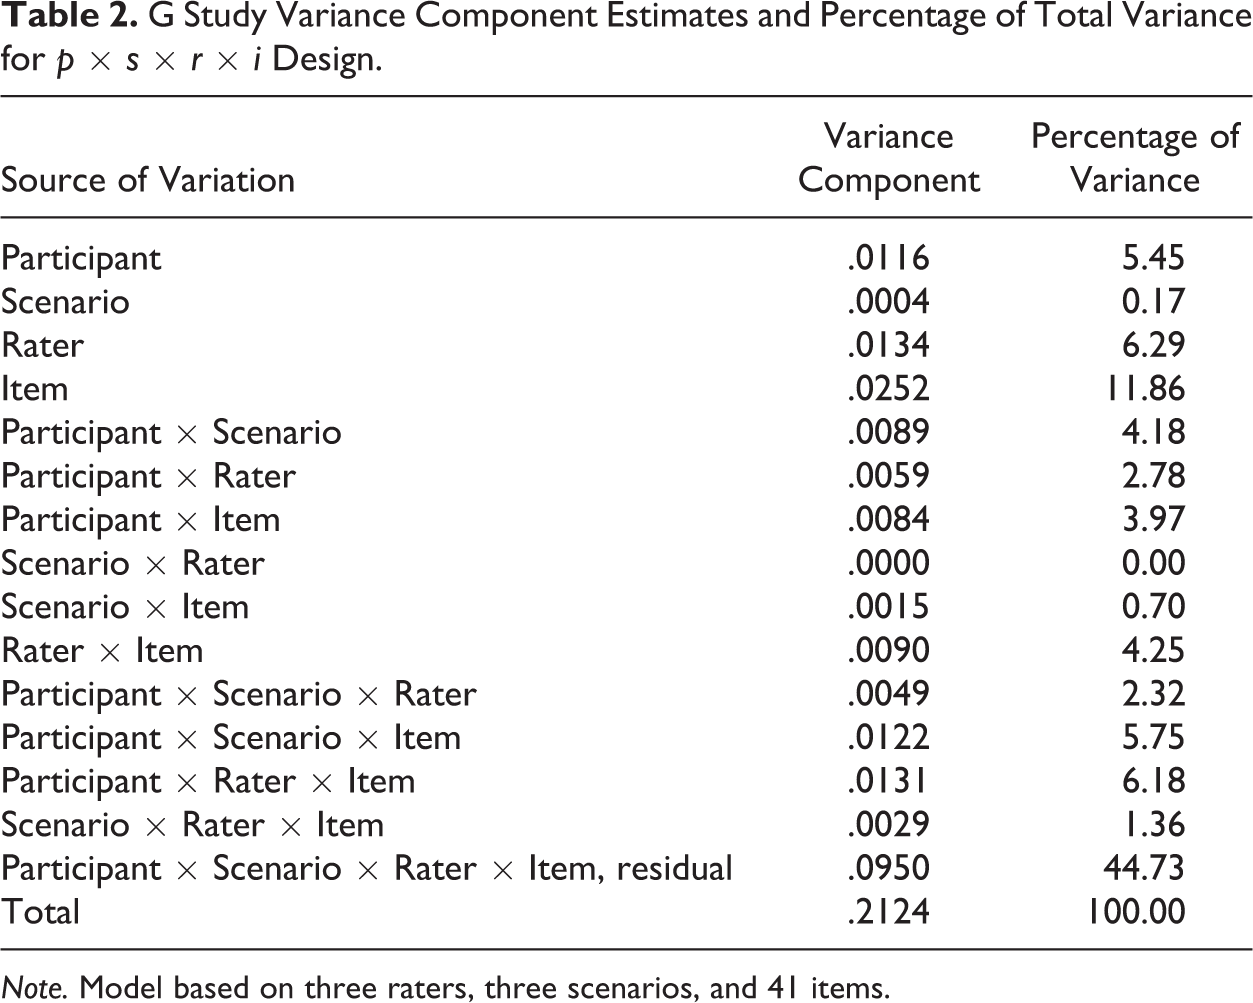
Note. Model based on three raters, three scenarios, and 41 items.
D Studies
Nineteen sets of D studies were conducted using the fully crossed random effects model p × S × R × I. Nurse participant scores on the NPP instrument for three scenarios scored by three raters on 41 items were generalized to all nurse participant scores for universes of generalization that includes many other scenarios, raters, and items.
In the first set of D studies, where both the number of raters and the number of scenarios were increased together, the G coefficient,
D Studies Variance Components Estimates for Fully Crossed, Random Facets p × S × R × I Designs—Sample D Study Results.
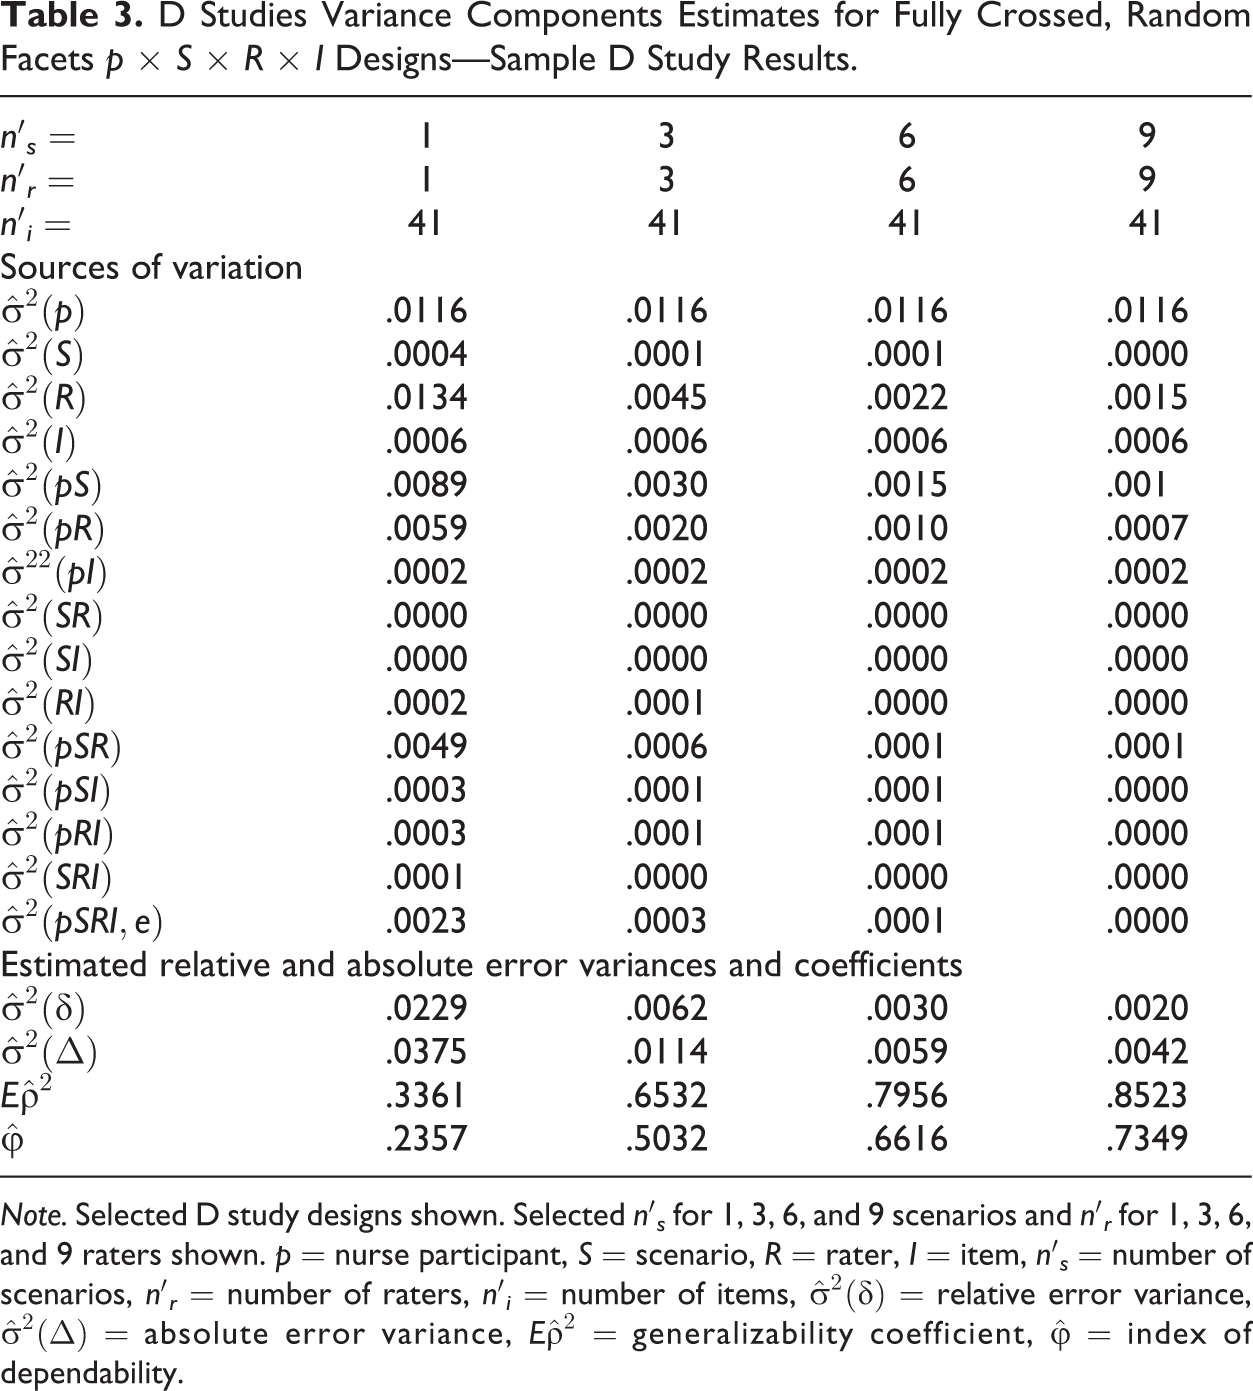
Note. Selected D study designs shown. Selected n′s for 1, 3, 6, and 9 scenarios and n′r for 1, 3, 6, and 9 raters shown. p = nurse participant, S = scenario, R = rater, I = item, n′
s
= number of scenarios, n′
r
= number of raters, n′
i
= number of items,
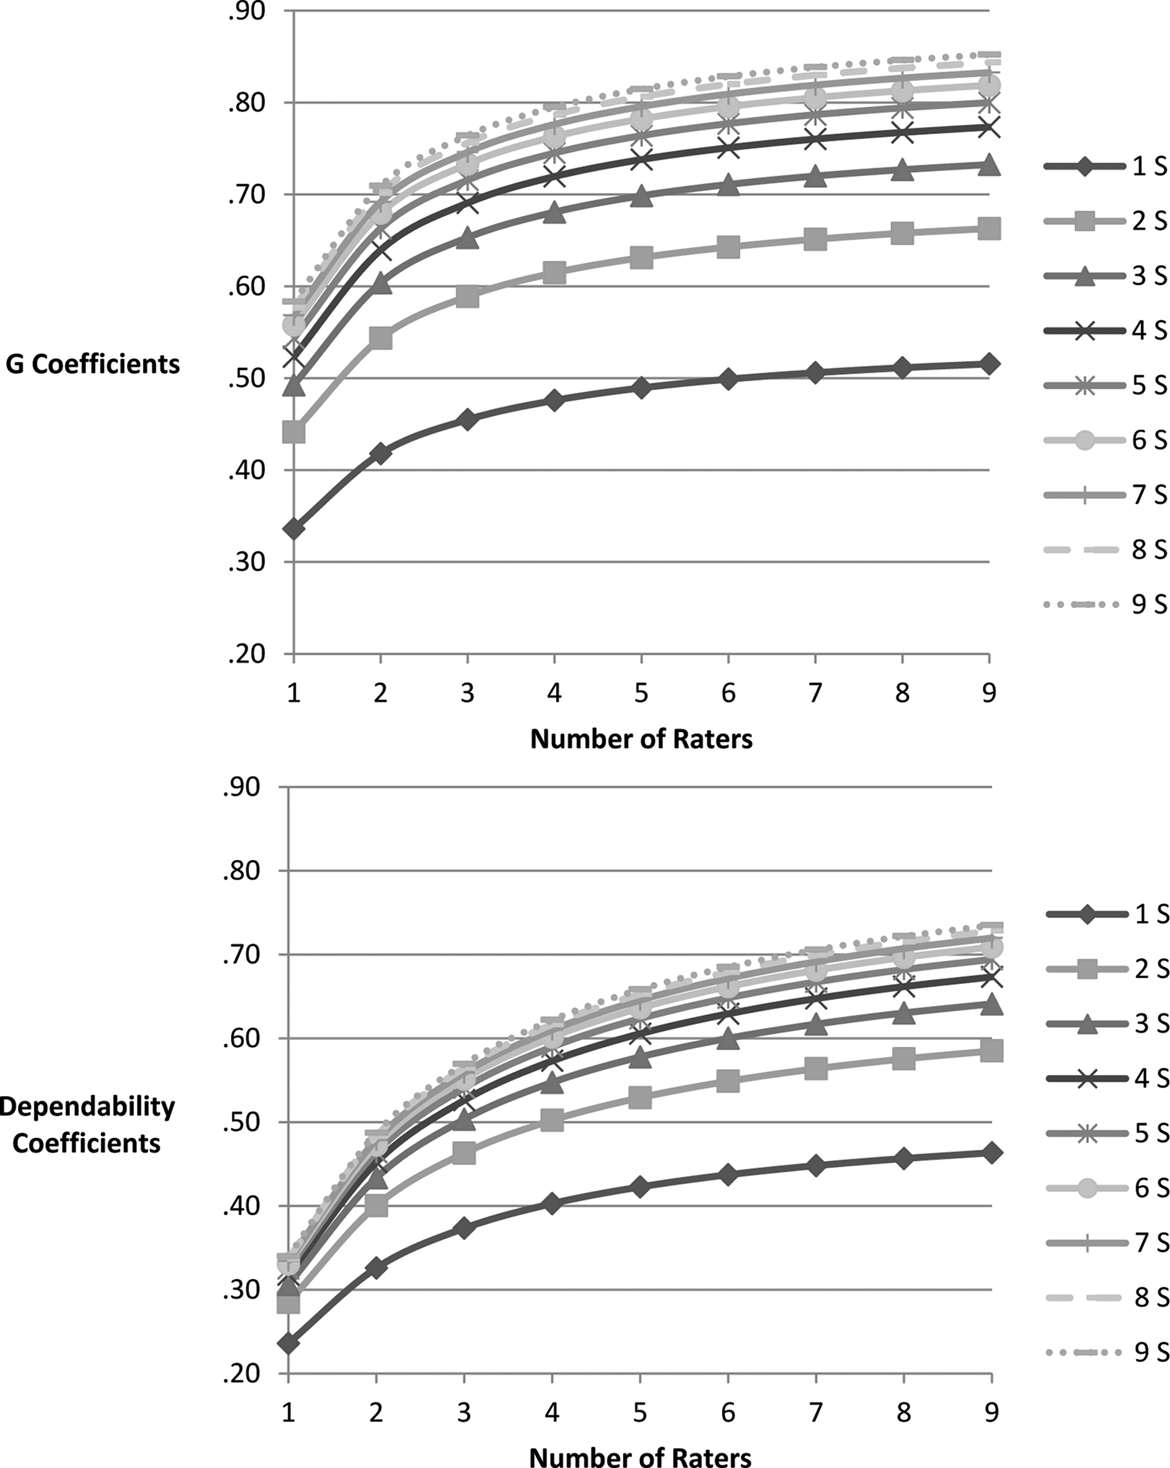
Estimated G coefficients and dependability coefficients for p × S × R × I D studies. Each line represents a different number of scenarios (1–9). For all D studies, the number of items was 41. S = scenarios.
In all D studies, increasing the number of scenarios and/or the number of raters improved reliability. As the number of scenarios or raters increased, the G coefficient and index of dependability increased and estimated variance components and SEMs decreased. Figure 1 illustrates, however, that the incremental degrees of improvement in the reliability coefficients diminished progressively as the number of raters increased beyond two to three raters, as observed by looking at the rate of change in slopes of curves for each fixed number of scenarios. For example, with one scenario, increasing the number of raters from one to two resulted in the G coefficient increasing by .08 (from .34 to .42) and increasing the number of raters from two to three resulted in an increase of .03 (from .42 to .45). Each incremental increase of one rater beyond four raters resulted in a maximum increase of .01. When more scenarios were included in the design, the rate of increase of the G coefficient evidenced a similar pattern. For example, with two scenarios, the G coefficient increased by .10 when the number of raters increased from one to two (from .44 to .54). However, it only increased by .05 when raters increased from two to three and it increased by .02 when raters increased from three to four.
Similarly, as the number of scenarios increased, incremental gains in reliability coefficients diminished, holding the number of raters constant, as is illustrated by the decreasing distance between the trajectories in Figure 1. Distance between the trajectories noticeably decreased between two and three scenarios and from three to four scenarios, signifying diminishing improvement in reliability for both the generalizability coefficient and the dependability coefficient. However, increasing the number of scenarios while holding the number of raters constant resulted in greater increases in the generalizability coefficient when more than one rater was included in the design. With one rater, increasing the number of scenarios from one to two resulted in the G coefficient increasing by .10 (from .34 to .44) and increasing the number of scenarios from two to three resulted in an increase of .05 (from .44 to .49). Each incremental increase of one scenario beyond four scenarios resulted in a maximum increase of .01. With greater numbers of raters, though, the incremental increase with each scenario was slightly improved. For example, with three raters, the G coefficient increased by .14 when number of scenarios increased from one to two (from .45 to .59) and by .06 when the number of scenarios increased from two to three; the gain continued to diminish when more than three scenarios were included.
Similar changes in the rate of increase of the dependability coefficient were seen both when the number of scenarios was held constant and raters were increased and also when the number of raters was held constant and scenarios were increased. For example, when the number of scenarios was held constant at two, the dependability coefficient increased by .12 when the number of raters increased from one to two (from .31 to .43). However, when the number of raters was increased from two to three, the dependability coefficient only increased by .07 (from .50 to .55).
Among the D studies conducted was a D study with the same random effects design as the G study, including three scenarios, three raters, and 41 items. The resulting generalizability coefficient,
As expected, the estimated generalizability coefficient,
The effect of increasing raters contrasted with the effect of increasing scenarios is seen when one facet is held constant, while the other facet is increased. At all levels, increasing scenarios was slightly more effective at improving the G coefficient than increasing raters. For example, in a D study with two scenarios and two raters, adding a third scenario increased the G coefficient from .54 to .60, whereas adding a third rater instead of a third scenario increased the G coefficient to .59. In contrast, increasing raters was more effective than increasing scenarios at improving the dependability coefficient. In the same D study with two scenarios and two raters, adding a third scenario increased the dependability coefficient from .40 to .43, while adding a third rater increased it to .46. Differences between the G coefficient and the dependability coefficient are attributed to how each coefficient is calculated using different variance components.
In D study designs intended to minimize the number of raters while maximizing reliability coefficients, G coefficients of .70 or greater were calculated for a D study including two raters and a minimum of nine scenarios (
The minimum number of scenarios needed to reach a generalizability coefficient of .70 in the current D study designs was three. As mentioned, five raters were required for this level of reliability. Additionally, the minimum number of scenarios required to reach a generalizability coefficient of .80 in the current D study designs was five, with nine raters.
The highest dependability coefficient estimated in the current set of D studies was .73. A minimum of six scenarios and nine raters or seven raters and nine scenarios were required to achieve a dependability coefficient of .70 or higher.
Discussion
The variance components in the G study were based on sampling a single scenario, a single rater, and a single item from the universes of all possible scenarios, raters, and items. In the G study, the relative magnitude of each facet’s contribution to measurement error was estimated, and then, in subsequent D studies, designs were explored with the intent of minimizing unwanted sources of error attributed to the facets. As levels of facets that were responsible for larger proportions of total variance in the G study were increased in the D studies, the percentage of total variance attributable to nurse participants increased (as expected), since the absolute magnitude of the estimated variance component for nurse participants did not change.
G Study
It is desirable for the proportion of variance attributed to the object of measurement, in this case, the nurse participant, to be maximized in a G or D study. In the current G study, the nurse participant component (5.45%) attributed less to total variance than either raters or items. A large main effect variance component for nurse participants would signify a wide variability in nurse competency. One possible explanation for these results is that the experience levels of nurses in this analysis sample varied minimally, with all nurse participants having 2.5 years or less of experience as an RN.
The relatively large proportion of variance attributed by items and the large range in item mean scores indicates varying difficulties of items. An item mean score represents the proportion of scores that were marked “1,” signifying competent behavior, across participants, across scenarios, and across raters. Overall, nurses demonstrated higher levels of competency on items that measured professional responsibility, client advocacy, professionalism, communication, and attentiveness than on those that measured documentation, prevention, procedural competency, and clinical reasoning. The categories and items on the NPP are meant to capture specific types of unsafe behavior (Hinton et al., 2012; Randolph et al., 2012). Randolph and Ridenour (2015) report that nurses who have undergone investigation by a state board of nursing are found to have similar practice issues on the NPP, as seen on investigative reports developed from complaints filed with the board, despite the NPP staff not having access to the investigative reports. The magnitude of item variance was approximately twice as large as rater variance or nurse participant variance. Since the estimated variance components in a G study are based on the sampling of only one item, one rater, and one scenario, it is not surprising that mean scores would vary a great deal for items. Since the NPP length is 41 items and alternate instrument designs were not the focus of this study, all of our D study designs included the same number of items (41) as the NPP instrument, yielding a sufficient number of items to decrease the variability of this facet. Subsequently, in D studies, the percentage of total variance attributed to items was markedly lower than in the G study. For example, items accounted for only 2.59% of total variance in a design that included three raters, three scenarios, and 41 items.
The estimated variance component for scenarios was only .17% of total variance, indicating scenarios varied little in difficulty across raters, participants, and items. On the other hand, the interaction variance components of Participant × Scenario × Item (5.75%) and Participant × Scenario (4.18%) contributed greater proportions of variance, indicating the relative difficulty of items varied across scenarios and the relative difficulty of scenarios varied for nurse participants. Nurse participants’ abilities to exhibit safe behavior on the same type of competency varied depending on the context of the scenario, perhaps indicating familiarity with the patient situation was related to ability to display competency. This finding supports the need to include a sufficiently broad array of scenarios to fairly assess nurse competency.
The proportion of estimated variance attributed to raters was 6.29% of total variance, indicating rater stringency was more variable than nurse participant competency. Further, the Participant × Rater × Item interaction variance component (6.18%) indicated inconsistency among raters in scoring items for the same participant and the Rater × Item interaction (4.25%) indicated item ranking varied from rater to rater. On the other hand, the Participant × Rater variance component was relatively low (2.78%), showing less variability when averaged across scenarios and items. However, raters’ similarity in ranking of participants did not translate into similar scoring of individual items. Decreasing the variability attributable to raters must be a goal of any system intended to measure nursing competency, and identifying the number of raters needed to improve reliability was one of the goals of the D studies.
D Studies
A major objective of the D studies was to identify the minimum number of scenarios and raters needed to obtain sufficiently high reliability. The development of validated scenarios and the training and use of raters are resource-intensive endeavors. Additionally, the administration of the scenarios and the subsequent time needed to score the nurse participants’ performances by raters requires further use of resources in terms of facility space, technology, staff, and time. Identifying the minimum numbers of scenarios and raters needed to produce reliable data for making valid decisions is a critical component for any system of observation-based assessment involving simulation (Schuwirth & van der Vleuten, 2003).
However, many other factors influence this decision. First, as the number of raters and/or scenarios increased above three, a diminishing return was evident. Reliability coefficients increased, but at a slower rate. Certainly, a cost–benefit analysis would be helpful when making choices between increasing the number of raters used to evaluate participants and/or increasing the number of scenarios used in an assessment. The costs of increasing the number of raters include availability of qualified raters, as well as training time and additional time for raters to view participant videos. If the number of scenarios is increased, costs will include the time and expertise needed to develop validated scenarios, as well as the associated costs of administering longer assessment sessions, including space, staff, and participant time. Additional scenarios will require additional rater viewing time.
Available resources at each organization will certainly influence the allocation of those resources. In addition, the purpose and types of decisions that are made based upon assessment results will determine whether improvement of the generalizability coefficient or improvement of the dependability coefficient is more important. Norm-referenced decisions should be informed by the generalizability coefficient, and the dependability coefficient is more appropriate when considering criterion-referenced decisions. As shown, increasing the number of scenarios has a greater impact on the generalizability coefficient, whereas increasing the number of raters has a greater impact on the dependability coefficient.
Variance components for a D study design with three scenarios and three raters
G study results inform decisions regarding D study designs for the purpose of decreasing targeted estimated variance components. In the D study design including three scenarios and three raters (the design used to collect sample data in the G study), the estimated variance component (50% of total variance) that contributed the most to both relative and absolute error variances was the nurse participant. The proportion of variance contributed by scenarios remained low. However, the proportion of variance contributed by raters was 19.40%, indicating inconsistencies among raters across scenarios, participants, and items. The Participant × Rater estimated variance component was also relatively high (8.62%), showing mean nurse participant scores across scenarios were ranked differently by individual raters. Improving rater performance or collecting data from additional raters would reduce the effect of rater-related variance (Briesch et al., 2014), resulting in decreased error variances and increased coefficients.
The Participant × Scenario estimated variance component (12.93%) showed that participants were rank ordered differently for the various scenarios, meaning participants varied in how difficult they found the various scenarios. When considered with the fact that the estimated variance component for scenarios composed only .43% of total variance, this did not mean that the scenarios were widely different in difficulty level from each other, across participants and raters. Rather, participants had strengths and weaknesses that were more evident in some scenarios than in others. This has important implications for the need to include sufficient numbers of scenarios to ensure adequate opportunities for nurses to display competency.
As seen in Table 3, the generalizability coefficient for the D study design involving three scenarios, three raters, and 41 items was .65 (SEM = .0787) and the dependability coefficient was .50 (SEM = .1068). Using recommendations reported in the literature (.70 for low-stakes assessments: Johnson, Penny, & Gordon, 2009; and .80 to .90 for high-stakes exams: Briesch et al., 2014; Ram et al., 1999), the design used to collect the MCWS Phase I data resulted in lower reliability coefficients than desired for either low- or high-stakes exams. However, the NPP has not been used as a sole criterion for decisions by the ASBN. Rather, information from the NPP has been used in conjunction with other investigative data to determine remediation procedures and to assist in making decisions about licensure (Randolph, 2013).
Effect on reliability of various D study designs
In addition to estimating the reliability of data for the design used in the MCWS Phase I Study, the reliability of other designs was also examined. In various D studies, the number of scenarios and number of raters were increased simultaneously and separately in order to compare the effects on reliability.
Identifying the “best” D study design depends upon several factors. First, the type of decisions—relative or absolute—to be made is considered. This factor determines which coefficient is more interpretable—the G coefficient for relative decisions or the index of dependability for absolute decisions. If both types of decisions may be made, then both types of coefficients should be examined. Second, the minimum acceptable level for the reliability-like coefficient must be identified. Based upon current literature, for a high-stakes exam, the minimum G coefficient may need to be as high as .80 to .90. Third, increasing the levels of facets which explained a greater proportion of total variance in the G study will result in greater improvement of coefficients and decreased SEMs. Finally, availability of resources, such as raters and scenarios, must be included in practical decisions regarding increasing the number of raters versus increasing the number of scenarios.
The least number of scenarios required for a minimum G coefficient of .70 was three scenarios, combined with a minimum of five raters. Alternatively, a design with just two raters resulted in a G coefficient of .71, but only if eight or more scenarios were included. To obtain a minimum G coefficient of .80, a minimum of five scenarios and nine raters, or seven scenarios and five raters would be required. The highest G coefficient obtained in the D studies conducted for this research project was .85 for a design that included nine scenarios and eight raters. Although these results do not clearly indicate whether increasing the number of scenarios or increasing the number of raters would have a greater impact on improving reliability estimates, other researchers have reported that increasing the number of simulation scenarios typically has a greater effect on improving reliability than increasing the number of raters (Boulet & Murray, 2010; Kreiter, 2009; van der Vleuten & Swanson, 1990). Prior research in observation-based assessment in medicine has shown the need for a large number of scenarios to obtain sufficiently high reliability (Schuwirth & van der Vleuten, 2003). For example, Schuwirth and van der Vleuten found simulation sessions required a minimum of 12 scenarios with a single rater or eight cases with two raters to reach a reliability level of .80. They explained that the content knowledge and skills assessed in any one scenario can be too specific and not generalizable to participant ability in other scenarios, which is the basis for requiring a large number of scenarios or cases. In anesthesiology, as many as 12–15 scenarios have been needed to reach sufficient reliability (Boulet & Murphy, 2010; Weller et al., 2005).
For high-stakes exams, researchers should pay more attention to indices of dependability (
Limitations of the Study
The current study involved a secondary analysis of extant data. As such, sample size and design of data collection were established a priori. Although minimum sample sizes for multiple facet designs in G theory have not yet been established by researchers, a minimum of 20 persons and 2 conditions per facet has been suggested for a one-facet design (Webb, Rowley, & Shavelson, 1988). However, studies involving fewer persons in conjunction with larger numbers of conditions per facet and a larger number of facets have been successfully conducted (Briesch et al., 2014), so the current study involving 18 participants was considered sufficient, although a larger sample size would have been preferred.
Directions for Future Research
Although G theory has been used more frequently in the last 10+ years (Briesch et al., 2014) in reliability studies, it is still not commonly used in research involving the assessment of nursing competency using simulation. For example, a recent article published in Clinical Simulation in Nursing (Shelestak & Voshall, 2014) focused on validity and reliability concerns and described the use of Cronbach’s α, intraclass correlation coefficients, κ, and proportion of agreement as suggested methods of assessing reliability but did not mention G theory. The valuable contributions offered by G theory are just beginning to be realized in the measurement of nursing competency using simulation in the broader academic community (Prion et al., 2016). According to Mariani and Doolen (2016), nurses surveyed at an international simulation in nursing conference felt that research in nursing simulation lacked rigor and expressed a need for more research on evaluation methods and psychometric development of tools.
The current study provided an in-depth analysis of reliability for a simulation-based nursing competency assessment by examining multiple sources of variance. One important finding was that a greater number of scenarios and/or raters are needed to achieve sufficiently high reliability for a high-stakes assessment. Future research in this area should focus on rater training methods that would result in decreased variance attributed to raters.
Often, for practical reasons, programs do not have the luxury of having the same raters available to score all participants. Either the number of participants is too large for this to be feasible, or over time, the pool of raters changes. Research designs that include nesting raters within scenarios would provide valuable information that may support a more flexible rater configuration without sacrificing reliability.
Implications for Practice
The calibration of raters is an essential component of rater training, yet lack of faculty training to improve rating reliability is often the norm in health professions (McGaghie, Butter, & Kaye, 2009). Training to increase awareness of specific errors raters tend to make, providing a frame of reference using examples of differing levels of performance, and provision of intensive behavioral observation training through the practice of scoring and discussion among raters to reach consensus are methods used to improve rater agreement (McGaghie et al., 2009; Tekian & Yudkowsky, 2009). To prevent the subjective interpretation of rating scales, anchors must be developed that establish behaviors agreed upon by raters that constitute particular scores (Yudkowsky, 2009). Raters need sufficient preparation and continual updating to ensure high reliability and the minimization of threats to validity. Recognizing a need to increase rater agreement prior to evaluating nurses referred to the ASBN for practice violations, rater training conducted subsequent to the MCWS Phase I Study was enhanced to increase consensus among raters and standardization of item interpretation for scoring purposes (D. Hagler, personal communication, June 6, 2014).
Although improvement in reliability of the NPP is evident when additional raters and/or scenarios are included in the design, these improvements diminish for designs that expand beyond three raters or scenarios. However, unless reliability coefficients are stronger with fewer scenarios or raters, it is also clear that additional scenarios and/or raters are needed to meet suggested minimum levels of reliability for testing situations. Also, the purpose of the assessment (norm referenced vs. criterion referenced) informs choices of increasing scenarios or raters. Last, the availability and cost of resources to implement a simulation-based assessment may vary from organization to organization. Comparing the costs involved in developing and implementing new scenarios with the costs of adding raters and including additional scenarios in the testing situation involves factors unique to each organization.
Conclusion
Ensuring the safety of patients is a challenge faced by state boards of nursing, health-care facilities, and educational institutions (Scott Tilley, 2008). Confirming nurses at every level are meeting minimum levels of competency continues to be a challenge (Kardong-Edgren, Hayden, Keegan, & Smiley, 2014). When designing a system for measuring competency, stakeholders must agree on definitions of minimum competency, instruments must be developed that provide reliable and valid interpretations of data, and scenarios must be designed that provide opportunities for the nurse to demonstrate competency when assessed by trained raters using the instrument. Each component of this process involves tremendous time, work, and expertise. In the literature involving instruments used to measure nursing competency, reported methods of reliability testing have rarely included G theory. Investigation of reliability is often limited to the examination of interrater reliability, using coefficient α or percentage agreement as measurements (Adamson, Kardong-Edgren, & Willhaus, 2012; Hinton et al., 2012; Kardong-Edgren et al., 2010). Continued work is expected as state boards of nursing, accreditation boards, schools, and employers look for defensible methods to assess nursing competency.
Footnotes
Acknowledgments
The authors thank Dr. Janine Hinton and the Measuring Competency With Simulation Phase 1 Team for providing the data.
Declaration of Conflicting Interests
The author(s) declared no potential conflicts of interest with respect to the research, authorship, and/or publication of this article.
Funding
The author(s) received no financial support for the research, authorship, and/or publication of this article.