
Abstract
Poor sleep quality affects university students’ life and increases their risk of long-term health consequences. This study aimed to describe the quality of sleep among Jordanian university students, examine differences in sleep quality according to selected variables, and identify predictors of sleep quality. A cross-sectional correlational design and a multi-strategic sampling technique were used to select a sample of 1,308 university students. The Pittsburgh Sleep Quality Index, the Perceived Stress Scale, and the Sleep Hygiene Instrument were administered to the subjects. T
Introduction
Sleep is essential for the physical, mental, and emotional wellbeing of individuals (Jehan et al., 2018). Poor sleep quality affects university students’ academic achievement, daily activities, and mood. It also increases the risk of motor vehicle accidents and increases the risk for long-term health consequences (Hershner & Chervin, 2014; Spencer et al., 2017; Vargas et al., 2014). It was reported that a substantial proportion of university students experience poor sleep quality (James et al., 2011). The prevalence of poor sleep quality was found to be 48.1% among 2,854 Thai university students (Lohsoonthorn et al., 2013). In another study that included students from Tehran University, about 60% of the students were classified as poor sleepers (Rezaei et al., 2018). As well, a study at Jazan University in Saudi Arabia revealed that 64.4% of the students had poor sleep quality (Mahfouz et al., 2013). Sleep quality is a complex concept that is composed of quantitative aspects, such as sleep duration, sleep latency and arousal times, and subjective evaluation of sleep quality (Buysse et al., 1989).
Poor sleep quality is associated with multiple risk factors. Many studies reported a higher rate of poor sleep quality in females (Lohsoonthorn et al., 2013; Mallampalli & Carter, 2014). This might be because physiologically females need more time for sleep (Mallampalli & Carter, 2014). However, other studies of university students did not find a significant difference in sleep quality between male and female students (Cates et al., 2015; Rezaei et al., 2018). On the other hand, a study of university students found that males had poorer sleep quality compared to females (Yazdi et al., 2016). Cultural differences between countries may likely play a role in the differences among these results. Further studies are needed to understand the role of gender in sleep quality.
Sleep quality can be affected by some socio-demographic factors, such as socioeconomic status (SES); Low SES is associated with lower sleep quality compared to high SES (Friedman et al., 2007; Jehan et al., 2018). SES impacts the individual’s neighborhood; poor and noisy neighborhoods are associated with poor sleep quality. In addition, low SES may affect the physical and mental health status of the individual which in turn compromises sleep quality (Jehan et al., 2018). Along with SES, lifestyle and sleep environment are predictors of poor sleep quality among university students. Centre for Disease Control and Prevention (CDC) (2018) has defined sleep hygiene as good sleep habits that can help the individual get a healthy sleep quality. These habits include consistent sleep and wake-up schedules, a quite dark environment with an appropriate room temperature, not using electronic devices before sleep, and avoiding caffeinated drinks before bedtime (CDC, 2018). Poor sleep hygiene has been previously reported to be associated with poor sleep quality (Rezaei et al., 2018; Yazdi et al., 2016).
Sleep quality was found to be associated with physical activity levels (Buman et al., 2011). Lower physical activity levels were linked with poor sleep quality (Wu et al., 2015). Physical activity affects sleep quality by enhancing sleep duration (Garfield et al., 2016). Smoking also can affect sleep quality, increase sleep latency, and decrease sleep duration (Jehan et al., 2018; Lemma et al., 2012; Vail-Smith et al., 2009). Further, several studies linked poor sleep quality with increased body mass index (BMI) and the risk of developing obesity (Fatima et al., 2016; Spiegel et al., 2003; St-Onge, 2017; Taheri et al., 2004; Vioque et al., 2000). Among young populations, a negative association was found between sleep duration and BMI (Grandner et al., 2015).
Several lines of evidence pointed toward stress as a contributor to poor sleep quality in university students (Alsaggaf et al., 2016; Lund et al., 2010; Rezaei et al., 2018). It was found that perceived stress rather than sleep schedule regularity, alcohol or drug use, exercise frequency, or electronics usage provided the most explanatory power of poor sleep among university students and explained 24% of the variance in sleep quality (Lund et al., 2010). Academic requirements significantly contribute to the prevalence of stress too (Reddy et al., 2018). Students of senior years may have a relatively heavier academic load than students in the first years of study and this situation may affect their psychological distress (Reddy et al., 2018). Some studies suggested that students in the senior years experienced poor quality of sleep compared to students in earlier years (Rezaei et al., 2018). However, another study found that 1st-year students reported poorer sleep quality compared to students in senior years (Corrêa et al., 2017). Studies are needed to better understand the nature of the relationship of sleep quality with academic level and stress.
Research Problem
In Jordan, research on sleep quality problems among the university student population is scarce and no studies have been conducted to the knowledge of the authors to address these problems. Although there is a well-established body of evidence that has evaluated sleep among adults and children, few have investigated the prevalence and factors influencing poor sleep among university students. This study aimed to evaluate sleep quality among a nationally representative sample of university students in Jordan. The specific objectives were to describe the quality of sleep; to examine differences in sleep quality according to gender, employment status, family income, residency, academic level, academic achievement, smoking status, BMI, and physical activity level; and to identify predictors of sleep quality in this population.
Methods
Study Design
The study used a cross-sectional correlational design.
Sample and Data Collection
The target population was university students. Power analysis was based on the F test, using an alpha level of 0.05, a low medium effect size of 0.20, and a high power of 0.95 (Faul et al., 2007) version 3.1.9.7. The estimated required sample size was at least 470 students. A multi-strategic sampling technique was used to select the sample at two levels. In the first level, stratified random sampling was used to select the three public universities from the three major governorates in the country (north, center, and south). At the second level, students within universities were selected using convenience sampling. The inclusion criteria were Jordanian students, who were not disabled nor had acute medical conditions affecting sleep such as cancer. Data were collected in the period from January until May 2019.
Data collectors contacted school departments of each selected university. After that, they contacted teachers in these departments to take their permission to meet students in their classes for 10 minutes. The data collectors explained the purpose of the study and answered students’ questions about the study. Students who were willing to participate arranged with data collectors to fill out the self-administered questionnaire in a classroom on campus. They took 15–20 minutes to complete the survey and returned the questionnaire in a sealed envelope. The researchers avoided examination periods to not influence the study results. Two female nursing research assistants collected the data. They received training about research ethics and the study survey administration protocol and tools.
Ethical Consideration
The researchers obtained ethical approval including the Institutional Review Board (IRB) from The University of Jordan. The consent form was obtained from students who agreed to participate in the study. It illustrated the purpose of the study, that participation in the study was voluntary, and students’ right to withdraw from the study at any time. Students did not receive any incentives in return for their participation.
Measures
Demographic and lifestyle characteristics
This questionnaire included information about students’ age, gender, marital status, employment status, academic level in years, monthly family income in Jordanian Dinar (JD), residency, smoking status, physical activity level, self-reported height and weight, and academic performance. Academic performance was assessed by asking participants about their cumulative grade point average (CGPA). Participants provided their CGPA of the last semester before the study period; the CGPA ranged from 1 to 4 points. Students’ GPA was classified into five groups to assess differences between these groups using ANOVA test. According to the official office of the registrar at the selected universities, GPA less than 2 points was classified as weak, 2 to 2.45: accepted, 2.5 to 2.99: good, 3 to 3.64: very good, and 3.65 to 4 was classified as excellent.
Sleep quality
The Pittsburgh Sleep Quality Index (PSQI) was used to measure sleep quality. The instrument is composed of 19 questions that measure subjective sleep quality retrospectively for the past month period. The PSQI contains seven equally-weighted components and each component ranges from 0 to 3. A higher score indicates severe difficulty. These components include subjective sleep quality (1 item), sleep latency (2 items), sleep duration (1 item), habitual sleep efficiency (3 items), sleep disturbances (9 items), use of sleep medication (1 item), and daytime dysfunction (2 items). A global score for the PSQI can be obtained by adding up all the seven sleep components scores. The score ranges from 0 to 21, with a cut-off score of 5. Based on the PSQI global score, individuals can be classified as good sleepers (< 5) and poor sleepers (> 5). The PSQI has a high internal consistency (Cronbach’s α = 0.83) and has a high test-retest reliability with the global score Pearson product-moment correlation between T1 and T2 is 0.85 (P < 0.001) (Buysse et al., 1989). The Arabic version of the PSQI was tested on a group of Arabic-speaking participants (19- to 58-year-old). It showed high internal consistency reliability (α = 0.74). Component to component correlations were moderate to high ranging between 0.36 and 0.84. The Arabic version of the PSQI showed high convergent validity with the insomnia severity index (Suleiman et al., 2010). The Arabic version of PSQI was used in this study. Cronbach’s α reliability for the PSQI in the current study was 0.72.
Perceived stress
Perceived stress was measured using the Perceived Stress Scale (PSS) by Sheldon Cohen. The scale is a 10-item self-report instrument with a 5-point scale (0 = never, 1 = almost never, 2 = sometimes, 3 = fairly often, 4 = very often). A higher score indicates a higher degree and longer duration of self-perceived stress. The instrument has established reliability and validity (r = 0.85) (Cohen & Williamson, 1988). The Arabic version of PSS showed adequate reliability and validity (Almadi et al., 2012), and this version was used in this study. Cronbach’s α reliability for the PSS in the current study was 0.66.
Sleep hygiene
Sleep hygiene was measured using the Sleep Hygiene Instrument (SHI). It is composed of 13 items to assess sleep hygiene behavior. Each item is rated on a 5-point scale ranging from 0 (never) to 4 (always). The total score ranges from 0 to 52, with a higher score representing poorer sleep hygiene. SHI has shown adequate reliability and validity (Mastin et al., 2006). The SHI was translated to the Arabic language using the World Health Organization guidelines on forward-translations and back-ward translations (World Health Organization, 2020). Cronbach’s α reliability for the SHI in the current study was 0.71.
Data Analysis
Data were analyzed using the Statistical Package for Social Science (SPSS) version 23 (IBM Corporation, 2012). Descriptive statistics (i.e. mean, percentage, and standard deviation) were calculated to describe demographic, lifestyle characteristics, and the PSQI components. The total score for each component was first calculated. Then, a total score was obtained for all the components and named PSQI global score. The PSQI global score was then categorized into two categories. Scores from 0 to 5 indicated good sleep quality while scores from 6 to 21 indicated poor sleep quality (Buysse et al., 1989). University students were categorized into two groups according to their physical activity level: physically inactive students who performed physical activity once or less per week and physically active students who performed physical activity twice or more per week. BMI was calculated using students’ reported height and weight. Calculated BMI was categorized into four groups of underweight, normal body weight, overweight, and obese (Center for Disease Control and Prevention, 2017). T
Results
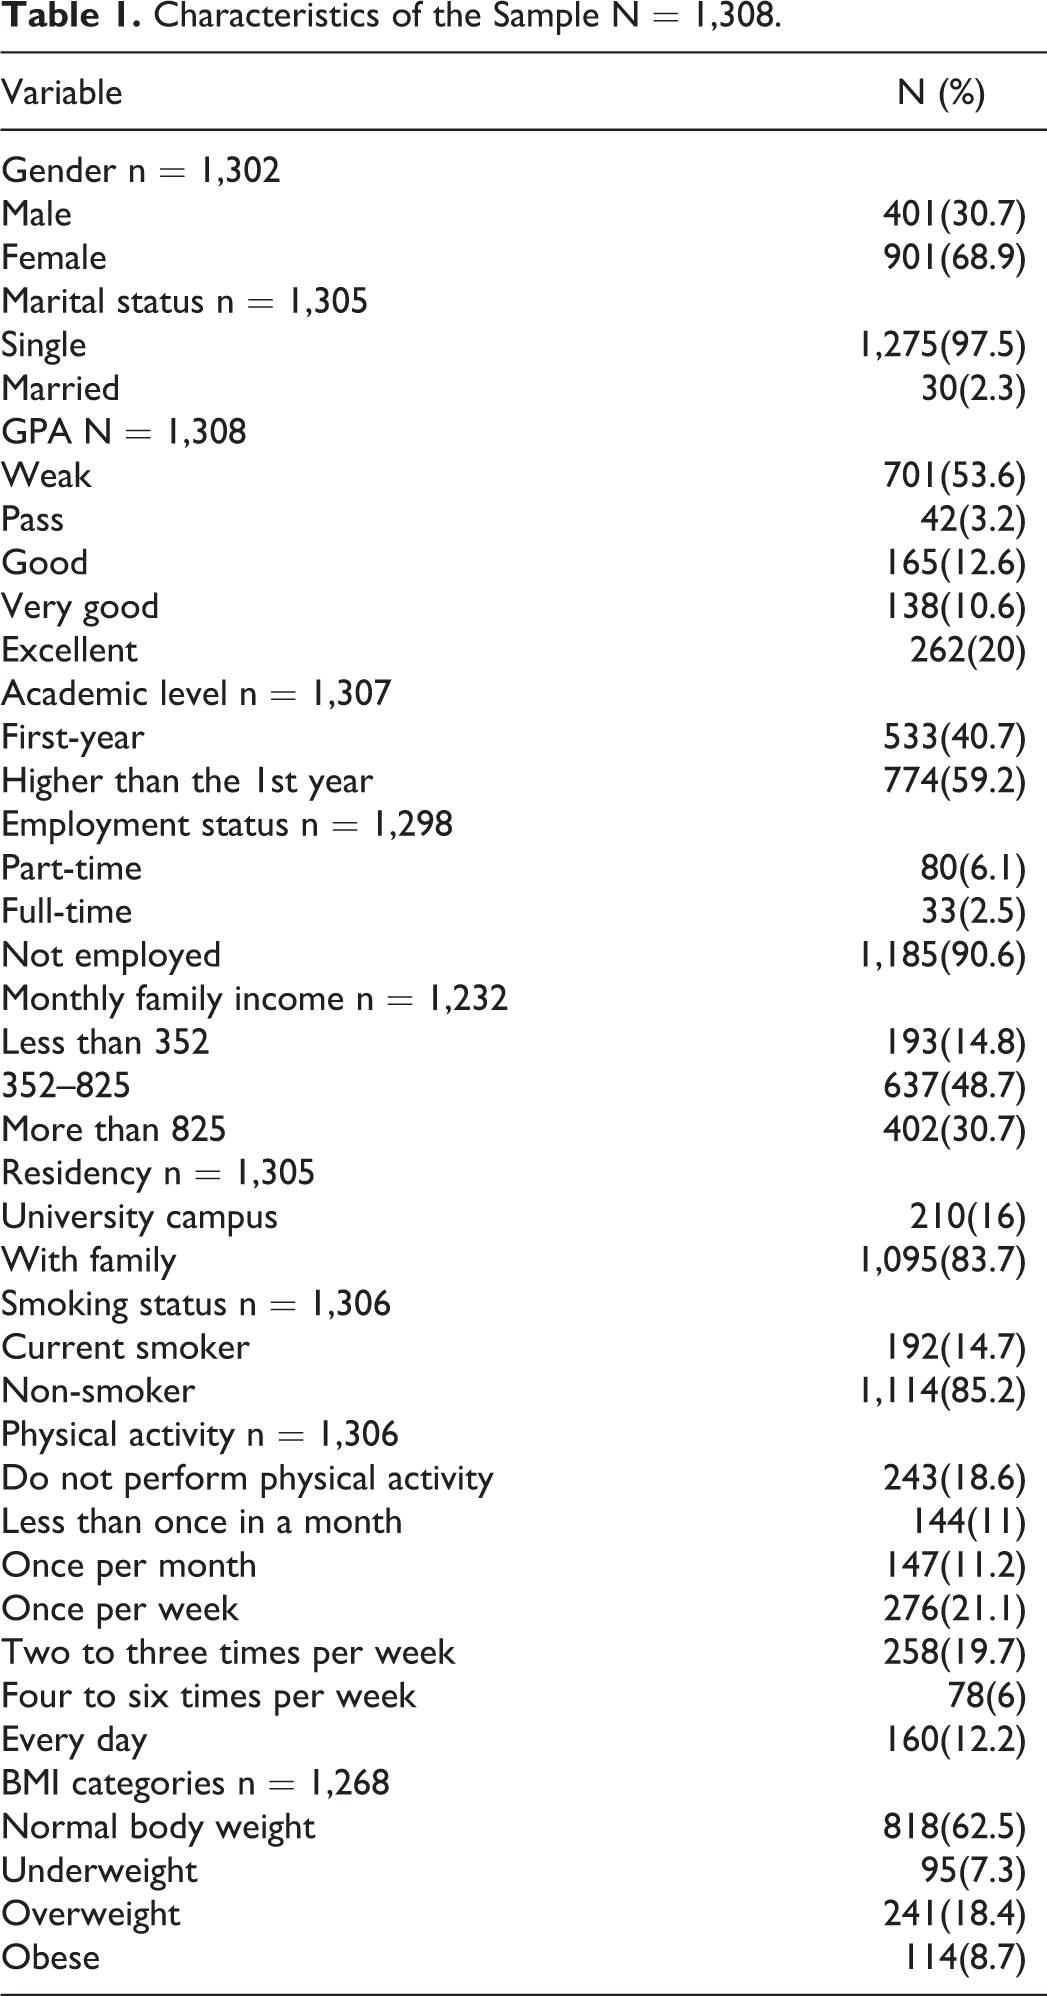
The sample consisted of 1,308 students. The number of invited students was 1,500 with a response rate of 87%. The sample consisted of 901 females (68.9%) and 401 males (30.7%). Only 30 students were married (2.3%). Regarding students’ GPA the mean was 2.4 (SD = 1.65), 701 of the students had a weak GPA (53.6%), while 262 of the students had an excellent GPA (20%). More than half of the students (774) were at a higher than 1st-year academic levels (59.2%) see Table 1.
Characteristics of the Sample N = 1,308.
Description of Sleep Quality
Table 2 describes the PSQI components and the global score. The global score ranged from 2 to 19, the mean global score was 8.04 (SD = 2.33). Most students were classified as poor sleepers (87.1%), and only 12.8% had good sleep quality. Among the PSQI components, subjective sleep quality (m = 1.90, SD = 0.89) and daytime dysfunction (m = 1.72, SD = 0.67) had the highest means, while sleep efficiency (m = 0.50, SD = 0.91) and the use of sleep medications (m = 0.23, SD = 0.73) had the lowest means.
Description of PSQI Component and Global Score N = 1,308.
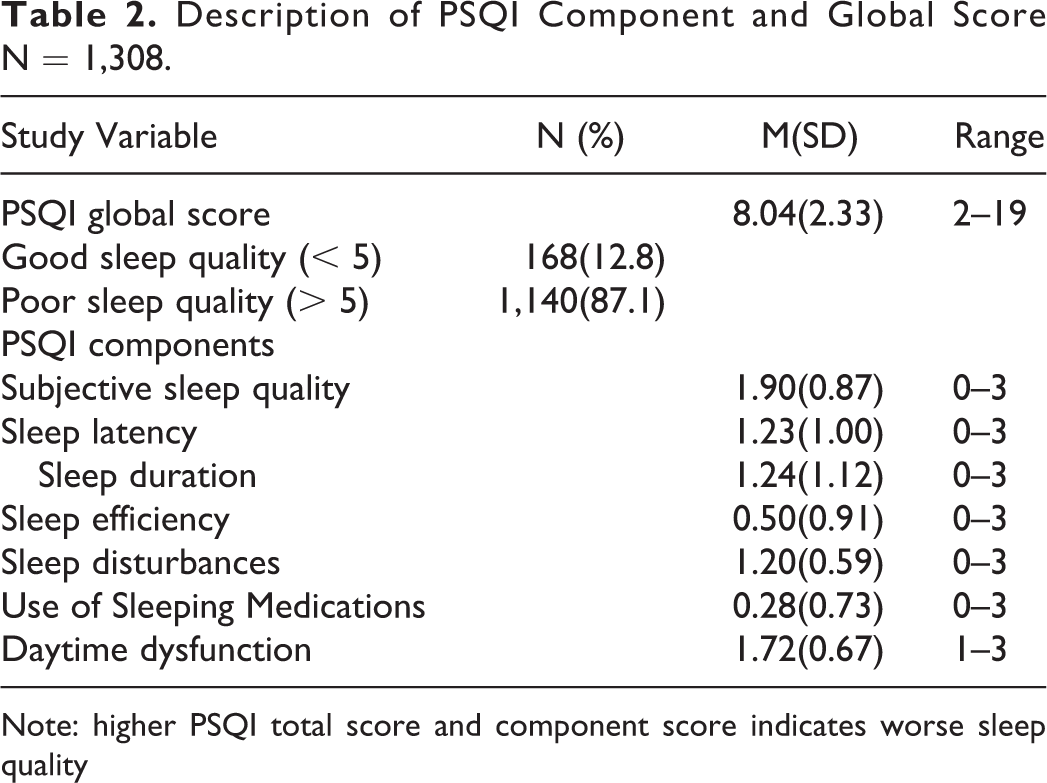
Note: higher PSQI total score and component score indicates worse sleep quality
Differences in the PSQI Global Score
The results of the t-test indicated that there was a statistically significant difference in the PSQI global score in relation to residency (t (1307) = 2.08, p = 0.038); students who lived in university housing had poorer sleep quality (m = 8.46, SEM = 0.193) compared to students lived with their families (m = 7.99, SEM = 0.085). In addition, the PSQI global score differed significantly according to the academic level (t (1307) = −2.15, p = 0.032); 1st-year students had better sleep quality (m = 7.85, SEM = 0.118) than students at higher academic levels (m = 8.19, SEM = 0.100).
ANOVA test showed a statistically significant difference in PSQI global score in relation to students’ GPA (F (4, 1304) = 3.74, p = 0.005); Scheffe post hoc test of comparison showed that students who reported having a pass GPA had worse sleep quality (m = 8.98, SE = 0.434) than students with a weak GPA (m = 7.87, SE = 0.088). There was also a significant difference in PSQI global score in relation to students’ family income (F (2, 1306) = 2.60, p = 0.05); students with a family income less than 352 had worse sleep quality (m = 8.37, SE = 0.185) than students with family income more than 825 (m = 7.92, SE = 0.113). No significant differences were found in the PSQI global score in relation to gender, employment status, smoking status, BMI, and physical activity level.
Predictors of Sleep Quality Among University Students
Eleven variables entered the linear regression model. The overall model was significant (F (11, 1297) = 17.33, R2 = 0.15, Adjusted R2 = 0.14, p < 0.001), and the model predicted 15% of the variance of sleep quality. Significant predictors of sleep quality were gender, employment status, SHI, and PSS. There was no violation of the multicollinearity, normality, and homoscedasticity assumptions. Table 3 shows the results of the regression model.
Predictors of Sleep Quality Among University Students N = 1,308.

PSS = Perceived Stress Scale, SHI = Sleep Hygiene Index, BMI = body Mass Index.
Discussion
This study described sleep quality, examined differences in sleep quality, and identified predictors of sleep quality among university students in Jordan. In this national sample, most of the students reported poor sleep quality and the mean score of sleep quality was higher than the cut-off point, which indicated poor sleep quality in general. Sleep quality was worse among students who lived in university housing, at a higher academic level, with a pass GPA, and with a family income less than 352. The significant predictors of poor sleep quality were being female, married, employed, having high perceived stress, and having poor sleep hygiene practices.
Some previous research on sleep quality in university students reported similar findings to this study, while some other findings of this study were different, and they require contemplation. Starting with the mean of sleep quality, consistent findings were found in a study that validated the Arabic version of the PSQI in a small sample of university students in Jordan; Suleiman et al. (2010) found a high mean score of poor sleep quality among those students. The high mean PSQI score in this study (8.04) was also comparable to another study on sleep quality in Saudi medical students (8.13) (Yazdi et al., 2016). On the other hand, the proportion of students with poor sleep quality in this study was 87.1%, while it was 77% among the Saudi students’ sample, and it was between 50/% and 60.7% among university students in western countries (Brick et al., 2010; Schlarb et al., 2017; Yazdi et al., 2016). Accordingly, sleep quality in the current study was the poorest.
For the significant differences in sleep quality, students who lived on campus reported poorer sleep quality compared to students who lived with their families. This finding was consistent with what the literature testified (Alotaibi et al., 2020; Foulkes et al., 2019). Foulkes et al. (2019) conducted interviews with students who suffered poor sleep quality on campus and the interviews revealed that there are several conditions contributed to the poor sleep quality, such as late-night socialization, staying in bed all day, noise, and uncomfortable physical environment (Foulkes et al., 2019). Another difference found in the study was the lower sleep quality among students during senior years. This finding was comparable to some previous literature (Brick et al., 2010). However, other studies showed that students at lower academic levels tend to have poorer sleep quality due to accommodation problems to the new life of college (Alotaibi et al., 2020).
Females reported significantly poorer sleep quality compared to males. A report by the Society for Women’s Health Research indicated that biological, psychological, cultural, and social-related factors increase women’s risk of poor sleep, such as hormonal changes throughout their life and the higher risk of depression (Mallampalli & Carter, 2014). Being an employed student was a factor significantly associated with poor sleep. This finding was consistent with previous literature. It was found that working students (14 to 21 years old) had poorer sleep quality that is manifested by lower sleep efficiency and greater daytime sleepiness (Teixeira et al., 2007). High perceived stress was significantly associated with poor sleep quality. It is well documented that stress is associated with an adverse effect on sleep among students (Almojali et al., 2017; Kesintha et al., 2018; Li et al., 2019). The close relationship between stress and sleep is mainly explained by the specific areas in the brain that regulate both stress response and sleep pattern simultaneously. This can be seen when sleep disturbances take place at times of increased stressors (Han et al., 2012).
Consistent with previous literature, poor sleep hygiene was a significant predictor of poor sleep quality among university students (Brick et al., 2010). This finding specifically indicates the important impact of sleep hygiene practices on changing sleep quality; this modifiable predictor can be targeted to improve university students’ sleep quality. Lastly, in the regression analysis, some variables did not show a significant effect on sleep quality among university students, such as family income, smoking, and physical activity. This indicates that in the presence of the other significant predictors, these factors did not have a strong impact on the quality of sleep.
Limitations
This study was not without limitations. Firstly, a self-administered survey was used to collect data on sleep quality, stress, sleep hygiene, GPA, family income, and BMI. This might affect the accuracy of the obtained data. However, this may be reduced by the fact that most of these subjective measures have good validity and reliability. PSQI is a subjective measure of sleep, thus, the sleep complaints measured might not be indicative of actual sleep-related disturbances. PSQI is one of the measures that scientists faced difficulties in determining its construct validity as it measures an indistinct construct “sleep quality.” However, the evidence showed that PSQI has high reliability and validity in different clinical and non-clinical samples (Mollayeva et al., 2016). The cross-sectional design of this study limited the ability to determine causality and temporality of the relationships. The study also used a convenience sample of university students which may limit the generalizability of the study results. Finally, more than two-thirds of the sample included females; this gender specifically showed more sleep problems, which might contribute to the overall poor sleep quality in this study.
Implications
The findings of this study are important in terms of improving the quality of sleep among university students. Female students, married students, employed students, and students who have a high level of stress are high-risk groups that need interventions to improve their sleep quality. Examples of these interventions can be programs at the school level by psychological counselors and community and family health nurses. These programs should focus on the special needs of these students, such as decreased sleep hours, irregular schedules, and family responsibilities. Moreover, interventions to improve sleep hygiene are highly recommended as it is an important factor affecting students’ sleep. Schools are recommended to develop programs that help students adopt sleep hygiene practices and follow up on their effectiveness and durability.
Conclusion
A large proportion of university students had poor sleep quality. Gender, marital status, living status, academic level, sleep hygiene practices, and perceived stress are factors that significantly affect university students’ sleep quality. Improving sleep hygiene practices and stress management skills of university students could improve their sleep quality.
Footnotes
Authors’ Note
I confirm that the authors meet the authorship and are in agreement with the content of the manuscript
Acknowledgments
The authors are grateful to the Deanship for Scientific Research—The University of Jordan—for funding this study.
Declaration of Conflicting Interests
The author(s) declared no potential conflicts of interest with respect to the research, authorship, and/or publication of this article.
Funding
The author(s) disclosed receipt of the following financial support for the research, authorship, and/or publication of this article: This research was funded by deanship of scientific research at The University of Jordan.