




Abstract
In studies of cancer risk, detection bias arises when risk factors are associated with screening patterns, affecting the likelihood and timing of diagnosis. To eliminate detection bias in a screened cohort, we propose modeling the latent onset of cancer and estimating the association between risk factors and onset rather than diagnosis. We apply this framework to estimate the increase in prostate cancer risk associated with black race and family history using data from the SELECT prostate cancer prevention trial, in which men were screened and biopsied according to community practices. A positive family history was associated with a hazard ratio (HR) of prostate cancer onset of 1.8, lower than the corresponding HR of prostate cancer diagnosis (HR = 2.2). This result comports with a finding that men in SELECT with a family history were more likely to be biopsied following a positive PSA test than men with no family history. For black race, the HRs for onset and diagnosis were similar, consistent with similar patterns of screening and biopsy by race. If individual screening and diagnosis histories are available, latent disease modeling can be used to decouple risk of disease from risk of disease diagnosis and reduce detection bias.
Introduction
Cancer risk prediction is growing in importance as a precursor to the identification of targeted strategies for screening and treatment. The appropriateness of cancer risk prediction tools relies on the validity of the prediction models and the representativeness of the underlying data. Most risk prediction tools are derived from observational cohorts; these include the Breast Cancer Surveillance Consortium model (Tice et al., 2008) and the BOADICEA model (Lee et al., 2014) for breast cancer and the CRC-PRO calculator for colorectal cancer (Wells et al., 2014).
When observational cohorts are screened, the resulting risk prediction tools may be subject to detection bias (Arfe & Corrao, 2015; Weiss, 2003). Detection bias occurs when the intensity of disease screening and diagnosis varies according to the risk factor or factors of interest, leading to differential detection of the underlying disease (Horwitz & Feinstein, 1978). If individuals with the risk factor are scrutinized more intensively than others for the presence of a disease, a spuriously large association between the risk factor and that disease may be observed. Cancer risk prediction models by and large fail to account for detection bias, even though it is well known that cancer diagnosis is subject to differential detection across individuals (Colmers et al., 2013; Welch & Brawley, 2018). The aim of this work is to develop a statistical approach that reduces detection bias, permitting more accurate ascertainment of the association between risk factors of interest and disease.
There are several factors that generate detection bias. First, some individuals may be screened more frequently than others due to differential access or preference. Screening access may vary by socioeconomic status, education (Willems & Bracke, 2018) race, or rural or urban location (Warren Andersen et al., 2019). Second, the sensitivity of screening tests themselves may vary according to different risk factors of interest. An example is breast density, which has been identified as a risk factor for breast cancer, but is also known to affect mammography sensitivity (Carney et al., 2003). Finally, some groups may be more likely to be biopsied following a positive screening test (Tangen et al., 2016).
A number of epidemiology studies have proposed approaches to mitigate detection bias (Bzkova & Lumley, 2007; Gilbert et al., 2016; Godley & Schell, 1999; Sakamoto et al., 1997), but few apply directly to populations in which screening takes place. Arfe and Corrao (2015) proposed a bias correction factor that is given by the ratio of the sensitivities of the screening regimen for detecting disease within groups defined by different levels of a risk factor. The sensitivity of the screening regimen refers to the probability of disease detection over the course of follow-up given the existence of underlying disease. This measure reflects both the number of tests as well as the test sensitivity. Unfortunately, the sensitivity of the screening regimen is not typically known. Thus, this correction method is primarily useful in sensitivity analyses to determine whether an observed association is plausibly explained by detection bias.
Since detection bias is a consequence of how disease is diagnosed, our method decouples the underlying disease process (latent disease onset) from the diagnostic process and uses the data to infer how the risk factors of interest affect onset. The method is applied to serial screening and diagnosis data. It is a generalization of interval-censored survival models that allow for imperfect sensitivity and specificity of screening tests. Interval-censored models have been previously developed and extensively vetted with applications in cancer (Albert et al., 1978; Walter & Day, 1983; Zelen & Feinleib, 1969) and other chronic diseases like HIV (Brookmeyer & Goedert, 1989; de Gruttola & Lagakos, 2013). The method is also similar to hidden Markov model approaches to modeling disease natural histories based on noisy, discrete observations of continuous time Markov chains that capture individual transitions through disease states (Bureau et al., 2003, Guihenneuc-Jouyaux et al., 2000, Jackson et al., 2003). Like these approaches our method seeks to estimate cancer risks that are not subject to detection bias from differential screening or biopsy.
We apply our method to study two established risk factors for prostate cancer–family history and black race. Black men in North America and Europe have roughly 1.6 times the risk of being diagnosed with prostate cancer compared to white men (Powell, 2007). Detection bias may attenuate estimated associations between race and prostate cancer incidence if black men have lower rates of prostate cancer screening or biopsy following a positive screening test. Family history is a known risk factor for prostate cancer (Tangen et al., 2016). A positive family history may also increase utilization of screening or biopsy, inflating its estimated association with risk of disease.
This study was motivated by an analysis of risk factors for prostate cancer among participants in the SELECT prostate cancer prevention trial (Tangen et al., 2016). Relative risks for factors including black race and family history were estimated in SELECT and compared with analogous estimates from the Prostate Cancer Prevention Trial (PCPT) (Thompson et al., 2005). In SELECT, men were screened and biopsied in accordance with community practices. In PCPT, annual screening was conducted within the trial, and most men underwent an end-of-study biopsy. Tangen et al. (2016) found that the relative risks associated with family history and black race in SELECT differed from the corresponding relative risks among men in the PCPT and suggested that this could be a consequence of detection bias in the SELECT trial. Their results motivated us to investigate the method described in this article, which we offer as a general framework for cancer risk prediction in screened cohorts that is not subject to detection bias.
Method
Data
SELECT (SELenium and vitamin E Cancer prevention Trial) was a phase III placebo-controlled multicenter randomized trial testing whether selenium and vitamin E alone or in combination could prevent prostate cancer. From 2001 to 2004, men were randomly assigned to one of the experimental or to a control (placebo) study arm. SELECT enrolled men age
SELECT Sample Used in Analysis.

Data from SELECT used to fit the latent disease models consist of times and results of serial PSA tests, DRE tests, and biopsies. DRE tests are either positive or negative; we classify a PSA test result as positive if it is greater than the standard cutoff of 4 ng/mL. For each exam, there is a record of whether or not a biopsy occurred following the test and the result of the biopsy (positive or negative). The risk factors of interest are family history of prostate cancer in a first-degree relative (positive or negative) at the start of the trial and black versus non-black race.
Analysis of Diagnostic Patterns
To investigate whether diagnostic patterns differed by race and family history we conducted comparative analyses of screening and biopsy frequencies. We used Poisson regression to determine if the frequency of exams during the study period was related to race and family history, adjusting for baseline age and including follow-up time as an exposure. We used logistic regression to examine if race and family history were related to the probability of biopsy following a positive PSA or DRE test, adjusting for baseline age.
Latent Disease Model Applied to SELECT Data
Suppose Ti
is the time of underlying disease onset in individual i. In the analysis of SELECT, we use 50 as the earliest age of cancer onset and set Ti
to be the time of onset in years since age 50. We assume that
Our modeling framework considers the observed data to be the series of test results at each of the screening times. In the prostate cancer example, the data are the PSA, DRE, and biopsy results. We assume the exam times are either specified in advance or they are non-informative in the sense of Gruger et al. (1991). This assumption means that the screening times are independent of latent cancer onset time, given prior screening histories and results.
The likelihood contribution for an individual i utilizes that individual’s screening and diagnosis history. The likelihood construction for an individual i is best explained with a simplified scenario in which surveillance consists of a single type of screening exam. An example of an individual’s data is shown in Figure 1. Screening exams have sensitivity a and specificity b. Conditional on screening interval in which the unobserved cancer onset time, time, ti
, occurred, the probability of observing the series of screening test results is the product of binomial trials with success probability
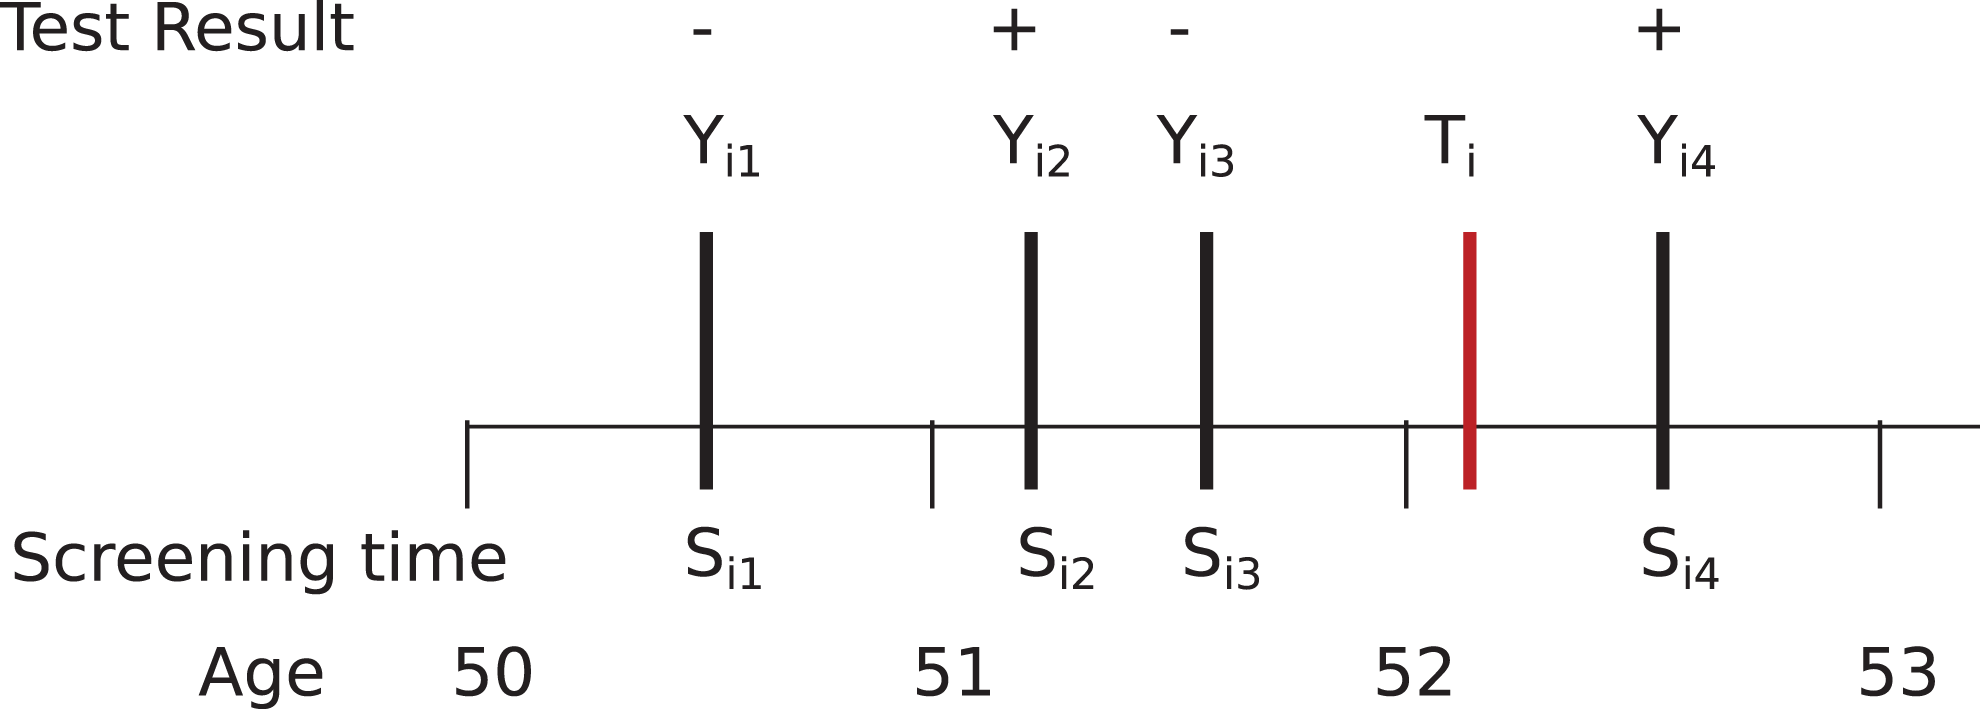
Example timeline of events within an individual the test i. The unobserved latent cancer onset time is Ti
, the cancer screening times are
The extension of the model from the simplified example to the prostate trial involves separate sensitivities and specificities for PSA and DRE tests; we assume that biopsies are perfectly sensitive and specific. In the model we used, sensitivity and specificity parameters do not depend on covariates. Although not every test is given at each exam, we assume that the receipt of tests is independent of the cancer onset time given the prior screening history. This assumption means that the likelihood is constructed very similarly to the simplified model, with the addition of multiple exams at each screening time. Full details and notation of the likelihood development of the simplified and full model are provided in Supplemental Appendix A.
Estimation Approach and Software
We use a Bayesian approach for estimation using the probabilistic programming language STAN (Carpenter et al., 2017). Bayesian methods enable incorporation of informative priors and bounds for model parameters that may not be fully identifiable by the data. Sampling-based estimation, as employed by STAN, facilitates calculation of variance estimates for model parameters and functionals of interest. Supplemental Appendix B provides example R code, using the rstan package, fit to simulated data for the interested user.
Model Fitting to SELECT Data and Assessment of Detection Bias
In order to fit the model to the SELECT data, we made a few additional assumptions to accommodate features of the data. Only a few cancers were clinically diagnosed (i.e., record of a cancer diagnosis in absence of a screening DRE or PSA); the vast majority (552/574) were screen detected. Clinically detected cases were entered into the likelihood similarly to screen-detected cases and provided similar information regarding the interval of disease onset. We assumed DRE sensitivity was known and fixed it to a literature-based value of 0.5 (Naji et al., 2018) because we were not able to identify DRE sensitivity in addition to PSA sensitivity from the data. DRE specificity was estimated.
We used diffuse
We used the estimated Weibull distributions for time to disease onset to compute hazard ratios of disease onset associated with black race and family history and compared these with the corresponding hazard ratios of disease diagnosis. We also estimated the implied odds ratios of disease onset within seven years for comparison with the corresponding odds ratios estimated by Tangen et al. (2016) using the PCPT data. The metric we cite from the PCPT study was based on the sample who had a biopsy by end of study at seven years, using a weighting approach to account for missing data.
Sensitivity Analyses and Simulation Study to Assess Magnitude of Detection Bias
We conducted analyses to assess the sensitivity of parameter estimates to both the age at cancer onset (40 versus 50) and the fixed value of the DRE sensitivity across the range
We conducted a simulation study that mimicked the SELECT trial data but varied the degree of differential surveillance by risk factor level. For illustration, we focused on family history. To capture the patterns in the observed data, differential surveillance was operationalized by difference in biopsy compliance following a positive DRE or PSA test; all other screening practices, including frequency of screens, were the same for men with and without a family history. Cancer onset times were generated for men with and with a family history according to parameters from the model fit to the SELECT cohort. Screening tests, including DREs and PSA tests, were generated to resemble the frequencies observed SELECT study. We considered several scenarios that varied the odds ratios for biopsy compliance for men with and without a family history. For each biopsy compliance setting, we simulated 100 data sets. For each data set, we fit a time-to-diagnosis model and a time-to-onset model, estimating the corresponding HRs for family history. We measured the performance of the time-to-diagnosis model by comparing the posterior medians and coverage of 95% credible intervals for the time-to-diagnosis HR in relation to the time-to-onset HR. The full details of the simulation study are provided in Supplemental Appendix C.
Results
Evidence of Differential Screening or Biopsy Intensity
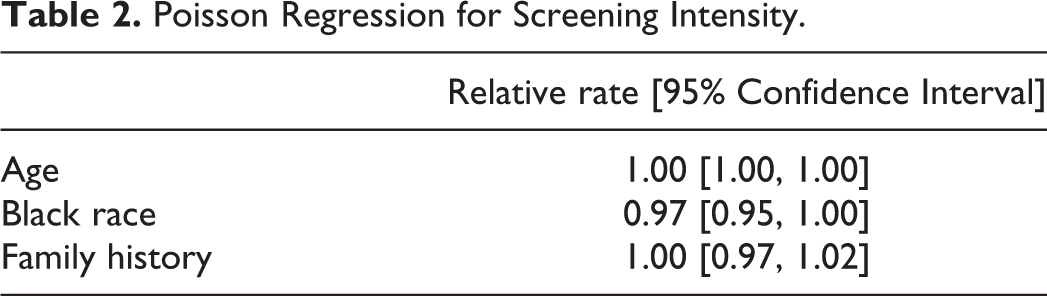
Mean counts of PSA, DRE, and biopsies by race and family history are shown in Table 1. The Poisson regression analysis of screening visit rates (Table 2) showed no evidence of differential visit rates by race (relative rate (RR) .97, 95% CI[.95,1.00]) or family history (relative rate (RR) 1.00, 95% CI[.97,1.02]) (Table 2).
Poisson Regression for Screening Intensity.
The odds of having a biopsy after a positive PSA or DRE was higher in men with a family history (OR 1.42, 95%CI [1.15, 1.75]). To a lesser degree, the odds were also higher in black versus non-black men (OR 1.17, 95%CI [.91, 1.51]) (Table 3).
Logistic Regression for Biopsy Given After Positive PSA or DRE Test.

Results From Latent Disease Onset Models in SELECT
Parameters estimated from the latent disease model are shown in Supplemental Appendix D. The latent disease model yielded a posterior median sensitivity of PSA exams of 0.70 (95% CI [.67,.73]; and specificity of 0.97 (95% CI [.97,.97]). Posterior specificity of DRE exams was .99 (95% CI [.99, .99]). Figure 2 plots the posterior median survival curves (along with

Posterior survival curves for time to latent onset, with
Based on the latent disease model in SELECT, the posterior median hazard ratio (HR) for black race was 1.60 (95% credible interval [1.31,1.94]). The HR based on a Weibull model fit to time-to-diagnosis was similar: 1.62 (95% credible interval [1.28, 2.05]). In contrast, the posterior estimate for HR for family history was reduced from 2.29 (95% credible interval [1.91,2.72]) in the time-to-diagnosis model to 1.82 (95% credible interval [1.55,2.11]) in the time-to-onset model.
Table 4. presents the 7-year odds ratios (ORs) for race and family history from the SELECT time-to-diagnosis model, the SELECT latent onset model, and the PCPT (Tangen et al., 2016). For race, the posterior median ORs were very similar for the SELECT diagnosis (1.62–1.63) and latent onset models (1.60), and both were slightly reduced from the PCPT OR of 1.82. For family history, the posterior median ORs were reduced from the SELECT diagnosis model (2.31) to the SELECT onset models (1.83–1.84). In PCPT, the OR associated with a positive family history for prostate cancer was 1.41.
Odds Ratios for Diagnosis by 7 Years (SELECT), Onset by 7 Years (SELECT), and Positive Biopsy by 7 Years in the PCPT).

Note. OR = odds ratio; CI* = credible interval, CI = confidence interval.
Sensitivity Analyses
Results from the sensitivity analyses are shown in Table 5. Choice of time origin (40 versus 50) or fixed value for DRE sensitivity had little impact on the hazard ratio estimates for race or family history.
Results of Sensitivity Analyses That Varied Earliest Age at Cancer Onset and DRE Sensitivity.
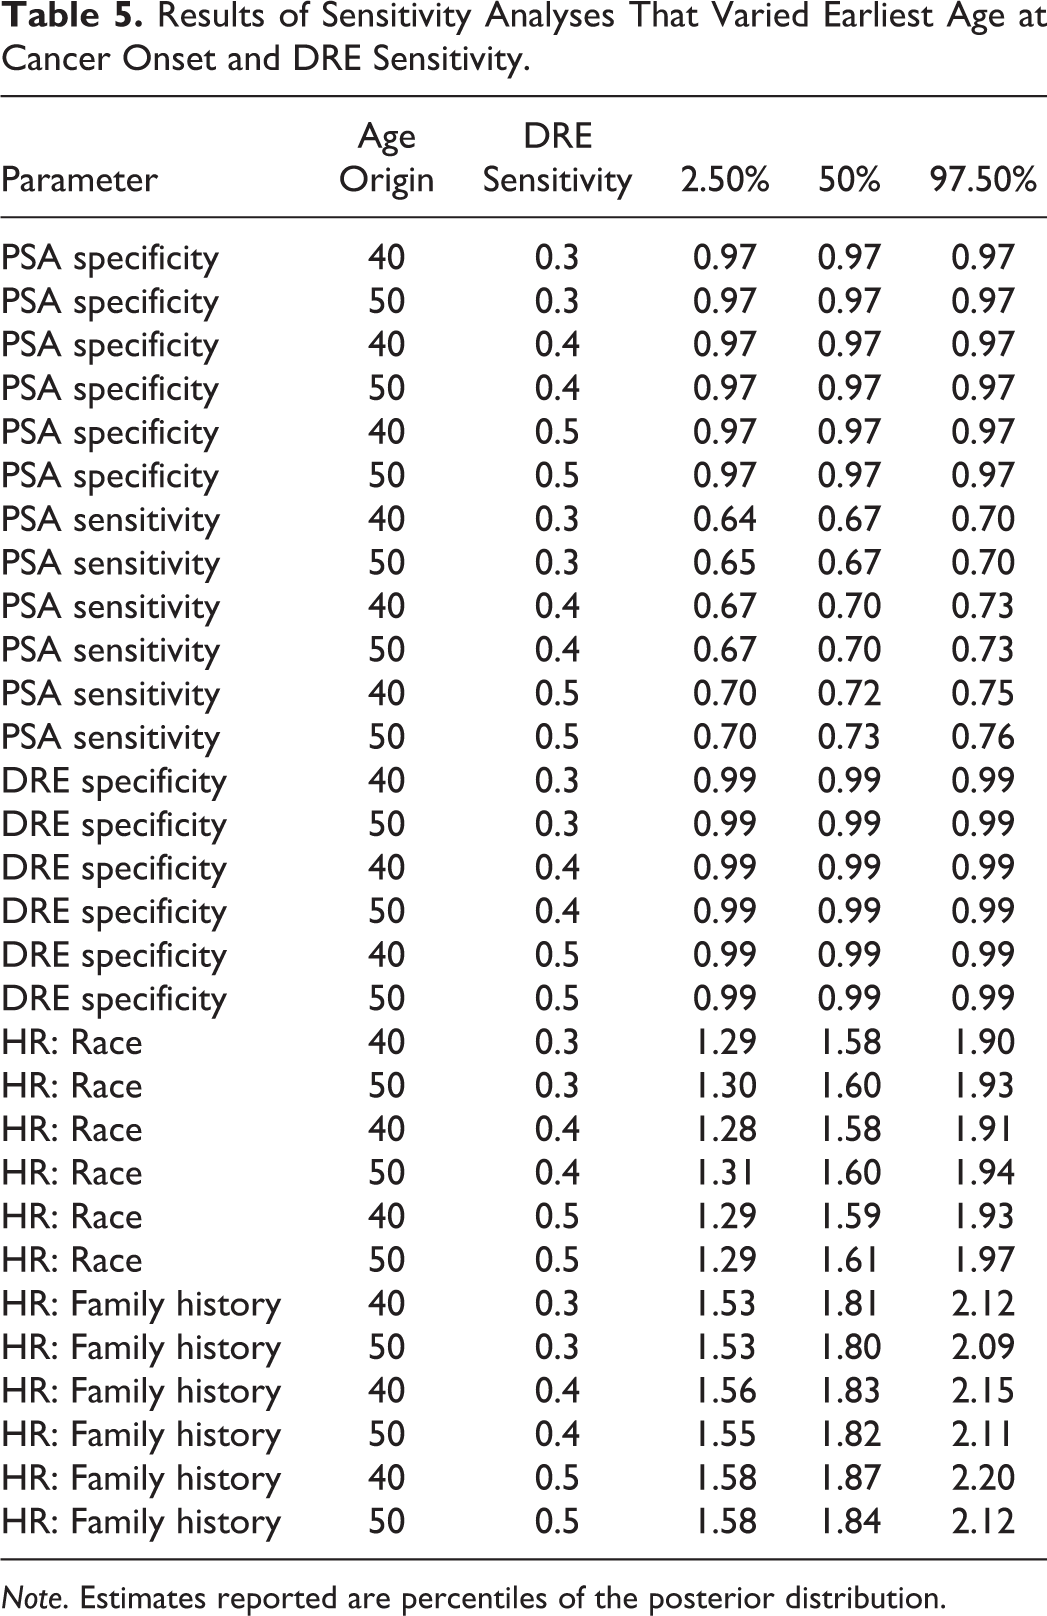
Note. Estimates reported are percentiles of the posterior distribution.
Simulation Study
The results of the simulation study are shown in Table 6. In general, the degree to which time-to-diagnosis models generate biased estimates of the HR for cancer onset by family history depends on the degree of differential surveillance. When the biopsy compliance odds ratio is 1—that is, screening practices are the same for all men—the time-to-diagnosis models show minimal bias. When the biopsy compliance odds ratio is greater than 1—that is, men with a positive family history are more likely than men without a positive family history to receive a biopsy after a positive screening event—the HR is overestimated. At the level of differential biopsy compliance observed in SELECT, the HR is overestimated by 0.28 on average and the credible interval coverage is 85%. When the OR for biopsy compliance is extreme (taking a value of 4), the bias is 0.98 and the credible interval coverage is 19%. When men with a positive family history are less likely to have a biopsy (biopsy compliance OR<1), the bias is negative. In fact, when the biopsy OR is 0.25, the estimated HR for cancer onset is less 1. Inferences from time-to-diagnosis models under this level of differential biopsy would err regarding not only the magnitude but also the direction of the effect of family history on cancer risk.
Results of Simulation Study.

Note. Data were generated to resemble the SELECT Trial, assuming a HR of 1.8 by family history for time of cancer onset. Simulated screening data sets were generated assuming varying levels of biopsy compliance by family history. Time to diagnosis model were fit to assess bias. OR = odds ratio; HR = hazard ratio; CI = credible interval.
Discussion
In this study we offer a solution to the problem of detection bias in risk prediction studies conducted in screened populations. Our method is based on latent disease modeling and characterizes the association of risk factors with underlying disease onset rather than with diagnosis. We implemented the method on data from SELECT, which included individual-level screening histories, cancer diagnoses, and key risk factors of interest.
Results from the control group of SELECT suggest little to no detection bias regarding the association between black race and prostate cancer risk when risk is based on diagnosed disease; the estimated relative risks of onset and diagnosis were similar. This finding is supported by empirical comparison of screening and biopsy frequencies, which were similar in black versus non-black men. However, results suggest the presence of detection bias for the association between family history and prostate cancer; the estimated relative risk of disease onset is attenuated compared with the risk of disease diagnosis. This finding is also supported by our observation (in men with elevated PSA levels) of a relatively higher probability of biopsy in those with a family history of disease.
There is a rich statistical literature on latent disease modeling with applications in cancer and infectious diseases, but to our knowledge these methods have not been fully harnessed for resolving detection bias. Addressing detection bias requires methods than accommodate both interval censoring (Bzkova & Lumley, 2007; Sakamoto et al., 1997) and misclassification (Gilbert et al., 2016; Godley & Schell, 1999). Our method accommodates both but requires individual-level screening and diagnosis histories.
As noted in the Introduction, our model is similar to a hidden Markov model based on an underlying discretely-observed continuous time Markov chain with two states (no cancer and cancer). PSA and DRE outcomes correspond to noisy observations of the underlying disease status at each exam time, and we assume, as do hidden Markov models, that observed states are independent conditional on the underlying disease status at the corresponding observation time. Such models are implemented in R packages such as msm (Jackson, 2011); these methods provide an alternative for users to our Bayesian approach. The main difference is that these models require sojourn times to be exponential. In the setting of cancer onset, which has varying rates across a lifetime, exponential models are overly restrictive. Our approach allows for more flexible, parametric sojourn times, such as the Weibull model that we employed.
Potential risk factors for prostate cancer in SELECT were previously studied by Tangen et al. (2016), who compared estimated relative risks with the analogous relative risks in the PCPT. PCPT was considered to be less susceptible to detection bias due to the fact that screening was conducted within the trial, biopsy referral criteria were uniform across study sites, and most men received an end-of-study biopsy. Tangen et al. (2016) inferred that differences between the estimates and the two trials could be suggestive of detection bias in SELECT, in which men were screened and biopsied according to community practices, and no end- of-study biopsy was conducted. According to their results, the relative risks associated with both black race and family history were attenuated in PCPT relative to SELECT. Our results agree that the SELECT relative risks for family history appear to be subject to some detection bias but are more equivocal about black race.
While our latent disease modeling approach expands the ability to account for differential screening and biopsies in cancer risk prediction studies, it has several limitations. First, we did not differentiate the small number of clinically detected cancers from the screen detected ones. Given that they comprised < 5% of total diagnoses, it is unlikely that our results would be substantially different if we had done so. Properly accounting for clinical cancers would require expanding the natural history model to include clinical and preclinical states and would potentially compromise the statistical identifiability of the other model parameters. Ultimately, such an extension would likely only impact results if the relative frequency of clinically detected cancers differed across risk factor levels (e.g., for men with and without a family history).
Our choice to focus on race and family history was motivated by the analyses of Tangen et al. (2016) that suggested these factors might be related to detection bias in the SELECT study based on comparisons with the PCPT. Arguably, a limitation of our analysis is that there are other factors related to cancer risk—and surveillance intensity—that we did not adjust for in our analysis. Even if other factors relate to frequency of visits, this is unlikely to lead to bias in the association between the risk factor of interest and the disease onset so long as the visit times themselves are “non-informative,” that is, planned in advance or scheduled based on prior observed screening data (Gruger et al. (1991)). Patient-initiated visits spurred by symptomatic disease are more problematic for the validity of our model’s inference. We leave a full exploration to future research, particularly residual bias that may result if certain risk factors are more likely to be associated with informative visits.
Other limitations included having to fix DRE sensitivity in order to insure model identifiability. Our sensitivity analysis showed that assuming a fixed DRE had little effect on the other parameter estimates, suggesting this choice was of minimal concern. A final limitation of our SELECT analysis was that we excluded individuals from the data that were enrolled but did not have any screening tests. There may be some selection bias due to limiting the analysis sample in this way.
In conclusion, latent disease modeling offers a useful approach for estimating disease natural history in cancer and other chronic conditions when screening histories are available. While models are limited by identifiability issues, and resulting necessary simplifications, they are broadly applicable, and, in tandem with empirical analyses of diagnostic intensity, can help to assess—and address—detection bias in practice.
Supplemental Material
Supplemental Material, Supplemental_Appendix - A Latent Disease Model to Reduce Detection Bias in Cancer Risk Prediction Studies
Supplemental Material, Supplemental_Appendix for A Latent Disease Model to Reduce Detection Bias in Cancer Risk Prediction Studies by Serge Aleshin-Guendel, Jane Lange, Phyllis Goodman, Noel S. Weiss and Ruth Etzioni in Evaluation & the Health Professions
Footnotes
Declaration of Conflicting Interests
The author(s) disclosed receipt of the following financial support for the research, authorship, and/or publication of this article: The author(s) declared no potential conflicts of interest with respect to the research, authorship, and/or publication of this article.
Funding
The author(s) disclosed receipt of the following financial support for the research, authorship, and/or publication of this article: SAG, JL, NSW, and RE were funded by the National Institutes of Health (NIH) grant R01 CA242735. PG was funded by NIH grant U10 CA37429 and UM1 CA182883.

Supplemental Material
Supplemental material for this article is available online.
References
Supplementary Material
Please find the following supplemental material available below.
For Open Access articles published under a Creative Commons License, all supplemental material carries the same license as the article it is associated with.
For non-Open Access articles published, all supplemental material carries a non-exclusive license, and permission requests for re-use of supplemental material or any part of supplemental material shall be sent directly to the copyright owner as specified in the copyright notice associated with the article.
