
Abstract
Although the bias-corrected (BC) bootstrap is an often-recommended method for testing mediation due to its higher statistical power relative to other tests, it has also been found to have elevated Type I error rates with small sample sizes. Under limitations for participant recruitment, obtaining a larger sample size is not always feasible. Thus, this study examines whether using alternative corrections for bias in the BC bootstrap test of mediation for small sample sizes can achieve equal levels of statistical power without the associated increase in Type I error. A simulation study was conducted to compare Efron and Tibshirani’s original correction for bias, z 0, to six alternative corrections for bias: (a) mean, (b–e) Winsorized mean with 10%, 20%, 30%, and 40% trimming in each tail, and (f) medcouple (robust skewness measure). Most variation in Type I error (given a medium effect size of one regression slope and zero for the other slope) and power (small effect size in both regression slopes) was found with small sample sizes. Recommendations for applied researchers are made based on the results. An empirical example using data from the ATLAS drug prevention intervention study is presented to illustrate these results. Limitations and future directions are discussed.
Keywords
In evaluating programs for health care, training services, or teaching methods, the goal is to determine whether the program has desired effects on outcomes of interest to warrant continued resource allotment, implementation, or funding. Many studies, however, have found that causal relationships are not always direct; the implemented program is not directly causing the outcome variables to change. Instead, causal relationships may involve one or more intermediate variables, known as mediators. For example, Maruska et al. (2016) found that a smoking prevention program (independent variable) indirectly affected adolescent smoking onset (outcome variable) by decreasing perceived peer smoking prevalence and increasing confidence to say “no” to cigarettes (mediators). If mediators are present, statistical analyses can be conducted both to examine whether a program affects the outcome variables and to identify potential causal mechanisms contributing to the effectiveness of the program. By identifying how the smoking prevention program was affecting smoking onset, Maruska et al. (2016) could recommend building substance-specific skills and cognitions into future programs.
Testing indirect effects (i.e., the effect of one variable on another through intermediate variables) for statistical significance is known as statistical mediation analysis. Mediation analysis can be complicated because the sampling distribution of indirect effects is often not normally distributed, so the use of traditional normal-theory statistical tests may result in incorrect inferences (Lomnicki, 1967; Springer & Thompson, 1966). While some work has focused on tests for mediation that make distributional assumptions other than normality (e.g., Cheung, 2007; MacKinnon, Fritz, et al., 2007; MacKinnon et al., 2004), a more popular solution is to use nonparametric resampling methods, such as the bootstrap (Efron & Tibshirani, 1993; MacKinnon et al., 2004), that do not make a distributional assumption at all.
Many researchers have recommended using the bootstrap for statistical mediation analysis (e.g., Bollen & Stine, 1990; Hayes & Scharkow, 2013; Preacher & Hayes, 2004; Shrout & Bolger, 2002). MacKinnon et al. (2004) compared the performance of multiple variations of the bootstrap for testing indirect effects including the percentile, bias-corrected (BC), and accelerated BC bootstrap tests. They found that the BC bootstrap had the highest statistical power, but also elevated Type I error rates in certain conditions. In a follow-up study, Fritz et al. (2012) found the Type I error rates for the BC bootstrap were most inflated when the sample size was small. This is especially problematic given that the BC bootstrap is often used in studies with low statistical power due to small sample sizes (e.g., Fuller-Rowell et al., 2017; Lundgren et al., 2008; McManus et al., 2012; Sella et al., 2016; Tallman et al., 2007), the exact situation where the Type I error rates for the BC bootstrap are the worst. In considering sample size limitations, as may be encountered in health research, it is important to determine if the BC bootstrap can be modified in order to maintain the increased statistical power without the inflated Type I error rate, keeping it instead at the targeted .05 level. The purpose of this study is to identify and compare alternative corrections for bias in the BC bootstrap test of mediation.
The Single-Mediator Model
Statistical mediation analysis is used to examine the indirect effect within a causal sequence, that is, the effect of one variable on an outcome variable through an intermediate variable. The simple mediation model representing the relation between an independent variable X, a mediator variable M, and an outcome variable Y can be represented by the following regression Equations (1), (2), and (3):


where
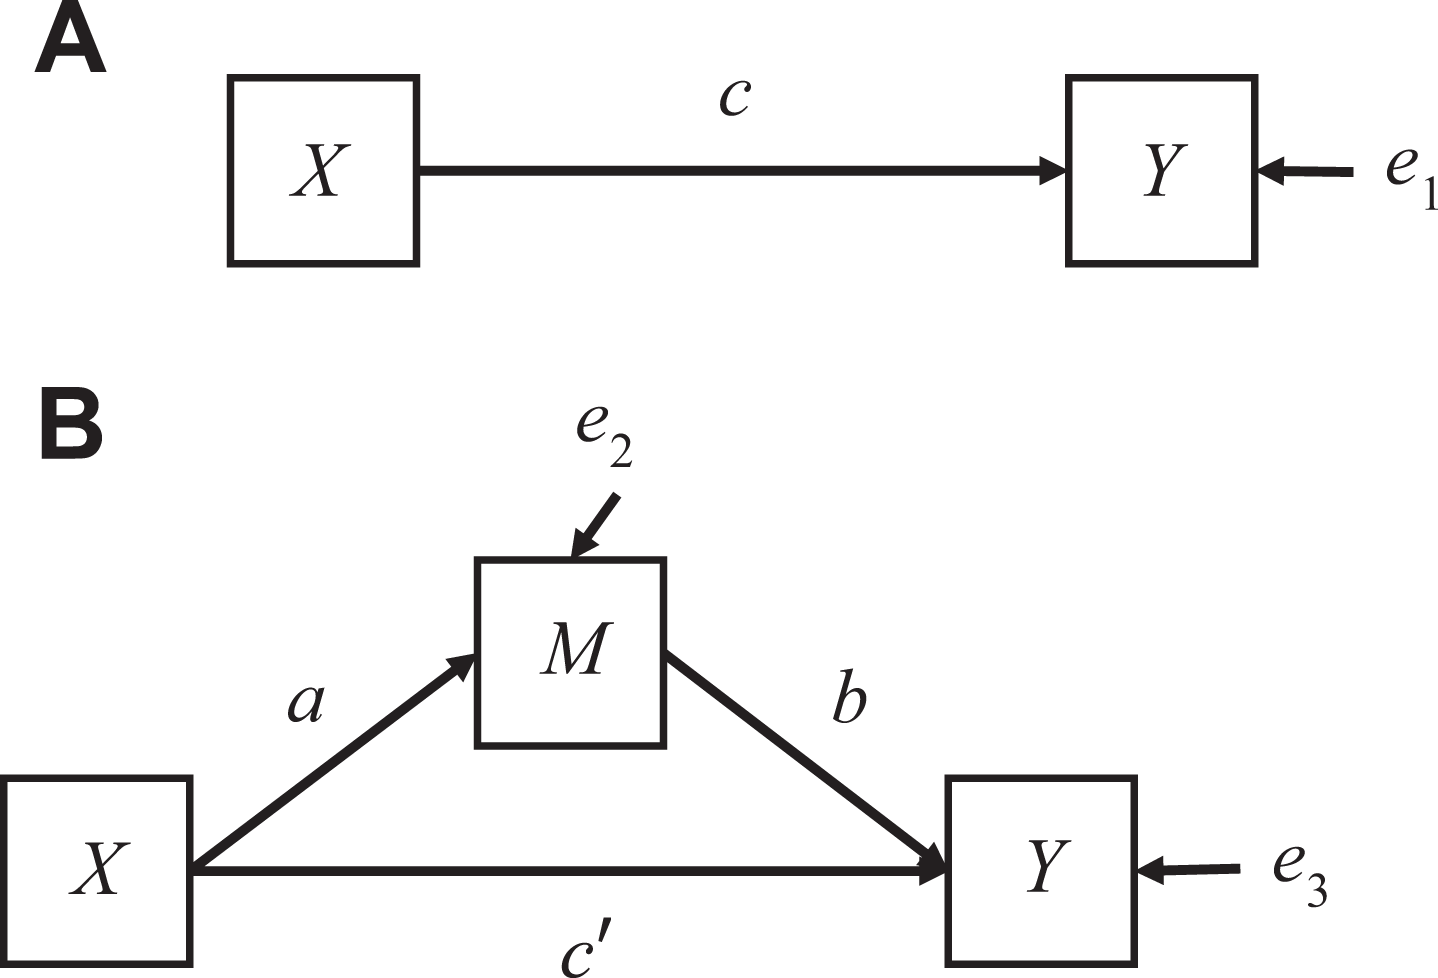
(A) Path diagram for the total effect model. (B) The single mediator model.
Assumptions
Statistical significance of the mediated effect alone is insufficient to make causal inferences, however, as
Tests of the Mediated Effect
Judd and Kenny (1981) originally proposed the causal steps approach to detect mediation, where
Calculating CIs for a Mediated Effect
CIs, on the other hand, can be constructed and have been recommended to statistically test for mediated effects (e.g., Bollen & Stine, 1990; MacKinnon et al., 2004; Sobel, 1982). One method is to assume the data are distributed normally and use the z-distribution such that CIs are calculated using Equation (4):

where
The sampling distribution of the product of two random variables, such as the mediated effect
Monte Carlo method
The Monte Carlo (MC) method is another way to calculate CIs for the indirect effect (MacKinnon et al., 2004; Preacher & Selig, 2012). The MC method assumes a joint normal sampling distribution between the a and b parameters. The estimates
Resampling
Another way to create asymmetric CIs for the mediated effect is by resampling. The act of returning each case to the sample is known as sampling with replacement, which allows the sampling distribution to be created. Given an original sample of size n, a new sample of size n is drawn from the original sample. Every time a case is drawn, it is returned to the sample so that each case has an equal chance of being selected again. For example, suppose an original dataset consists of [1, 2, 3, 4, 5]. On the first draw, 3 is randomly selected and then returned to the sample so that the probability of drawing 3 again remains 1/5. A sample could then be [3, 3, 4, 5, 2], where each case in the original dataset has a 1/5 probability of being selected for each draw. Resampling to create new samples is repeated a large number of times (usually upward of 1,000 new samples are taken). The statistic of interest is calculated from every sample, and the calculated statistic from the samples are then used to create an empirical sampling distribution. For example, given 1,000 samples, the mean of each sample can be calculated, resulting in 1,000 means. These 1,000 means could then be plotted as a sampling distribution.
Percentile bootstrap
A special case of sampling with replacement is the bootstrap—its name derived from the idea of “pulling oneself up by one’s bootstrap” (Efron & Tibshirani, 1993, p. 5). With bootstrapping, generation of a sampling distribution is based entirely on resampling from the original sample. With statistical mediation analysis, the original sample will consist of data for variables X, M, and Y for each participant. When a bootstrap sample is drawn from the original data, the corresponding X, M, and Y values for each participant are together considered one case. Therefore, instead of resampling each separate data value, bootstrapping for mediation analysis can be thought of as resampling participants. The mediated effect
BC bootstrap (z 0)
Theoretically, when all assumptions for statistical mediation analysis are met, the indirect effect is an unbiased estimator of the true indirect effect. When discussing bias in this paper, the focus is on the bootstrap sampling distributions instead of the indirect effect estimate. Bootstrap sampling distributions of
The endpoints of the CIs can be recalculated to correct for bias using the bias-correction,

where

where

given that
Issues Surrounding Current BC Bootstrap
Shrout and Bolger (2002) recommended the use of bootstrap methods for assessing mediation. They illustrated that the BC bootstrap has increased power to assess mediation for small sample sizes (N = 80 and N = 46 in their studies). Results of MacKinnon et al. (2004), in which a number of resampling methods for assessing mediation were compared, corroborated Shrout and Bolger’s (2002) findings. Although the BC bootstrap has been found to have relatively higher statistical power (see also Hayes & Scharkow, 2013; Preacher & Hayes, 2008; Williams & MacKinnon, 2008), the Type I error rate has also been found to be elevated in certain conditions. MacKinnon et al. (2004) reported that BC bootstrap Type I error rates for small sample sizes (i.e., N = 25, 50, and 100) when the effect size for either a or b
Current Study
Rather than attempt to find a correction for z
0 (i.e., correct a correction), the current study sought to find alternative measures of bias that could be implemented within the BC bootstrap that maintained the same levels of statistical power as Efron and Tibshirani’s z
0, but were less prone to elevated Type I error rates for small samples. Given that z
0 is based on the rationale that
Alternative corrections for bias
Mean (
Efron and Tibshirani’s (1993) z
0 converts the proportion of
Winsorized mean
Given the skewed nature of the bootstrap sampling distribution, instead of discarding extreme values that may influence the mean in a certain direction, the Winsorized mean replaces extreme values with a predetermined value that will “trim” a percentage of values from the tails (Lix & Keselman, 1998). For example, given the values 1–10, the value 2 is the 10th percentile and 9 is the 90th percentile value. The 20% Winsorized mean is calculated by

where the most extreme values 1 and 10 have been replaced by the values 2 and 9, respectively, so that 20% of the data are trimmed. In conditions with non-normality and variance heterogeneity, Wilcox et al. (1998) demonstrated that combining trimmed means with bootstrapping resulted in better Type I error control. Wilcox (1995) suggests using a 20% level of trimming because it results in a reduction of the standard error without a loss in power.
This study will cover a progression of trimming levels in increments of 10. If 0% trimming occurs, the CI will be equivalent to using
Medcouple (
)
Medcouple is a robust measure of skewness that “measures the (standardized) difference between the distances of xj
and xi
to the median” (Brys et al., 2004, p. 998). Although the medcouple is not a direct measure of central tendency, it does use a measure of central tendency (the median) to help describe the skew of the distribution. Since the medcouple can be conceptualized as a type of standardized weighted median, the reasoning is to replace z
0 with
The medcouple, introduced by Brys et al. (2003) is defined as

where for all
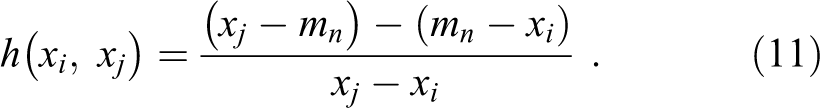
Given two values
Alternative measures implementation
In order to compute the BC bootstrap test of mediation using these alternative corrections for bias, each estimate of bias will replace
Materials and Method
Data Generation
To determine whether the proposed alternatives maintained more accurate Type I error rates compared to the BC bootstrap method, a simulation was performed using R (R Core Team, 2019). This study was an extension of Fritz et al. (2012), so the first four factors that were varied in the previous study were also varied in this study to focus on the effects of the bias adjustments and alternatives.
The first factor that was varied was the test of mediation. The original bias-correction, z
0, was compared to
The R function
Outcome Variables
Out of 1,000 replications for each combination of parameter values, rejection rate was the number of times zero was outside the CIs. The rejection rate is the Type I error when the population effect
Results
Additional tables and figures presenting the results from the following sections are presented as online Supplemental Material.
Type I Error
Figure 2 displays the Type I error rates of the alternative corrections for bias compared to the percentile bootstrap and z
0. These methods were selected for presentation in this figure in order to highlight the similarities of z
0,
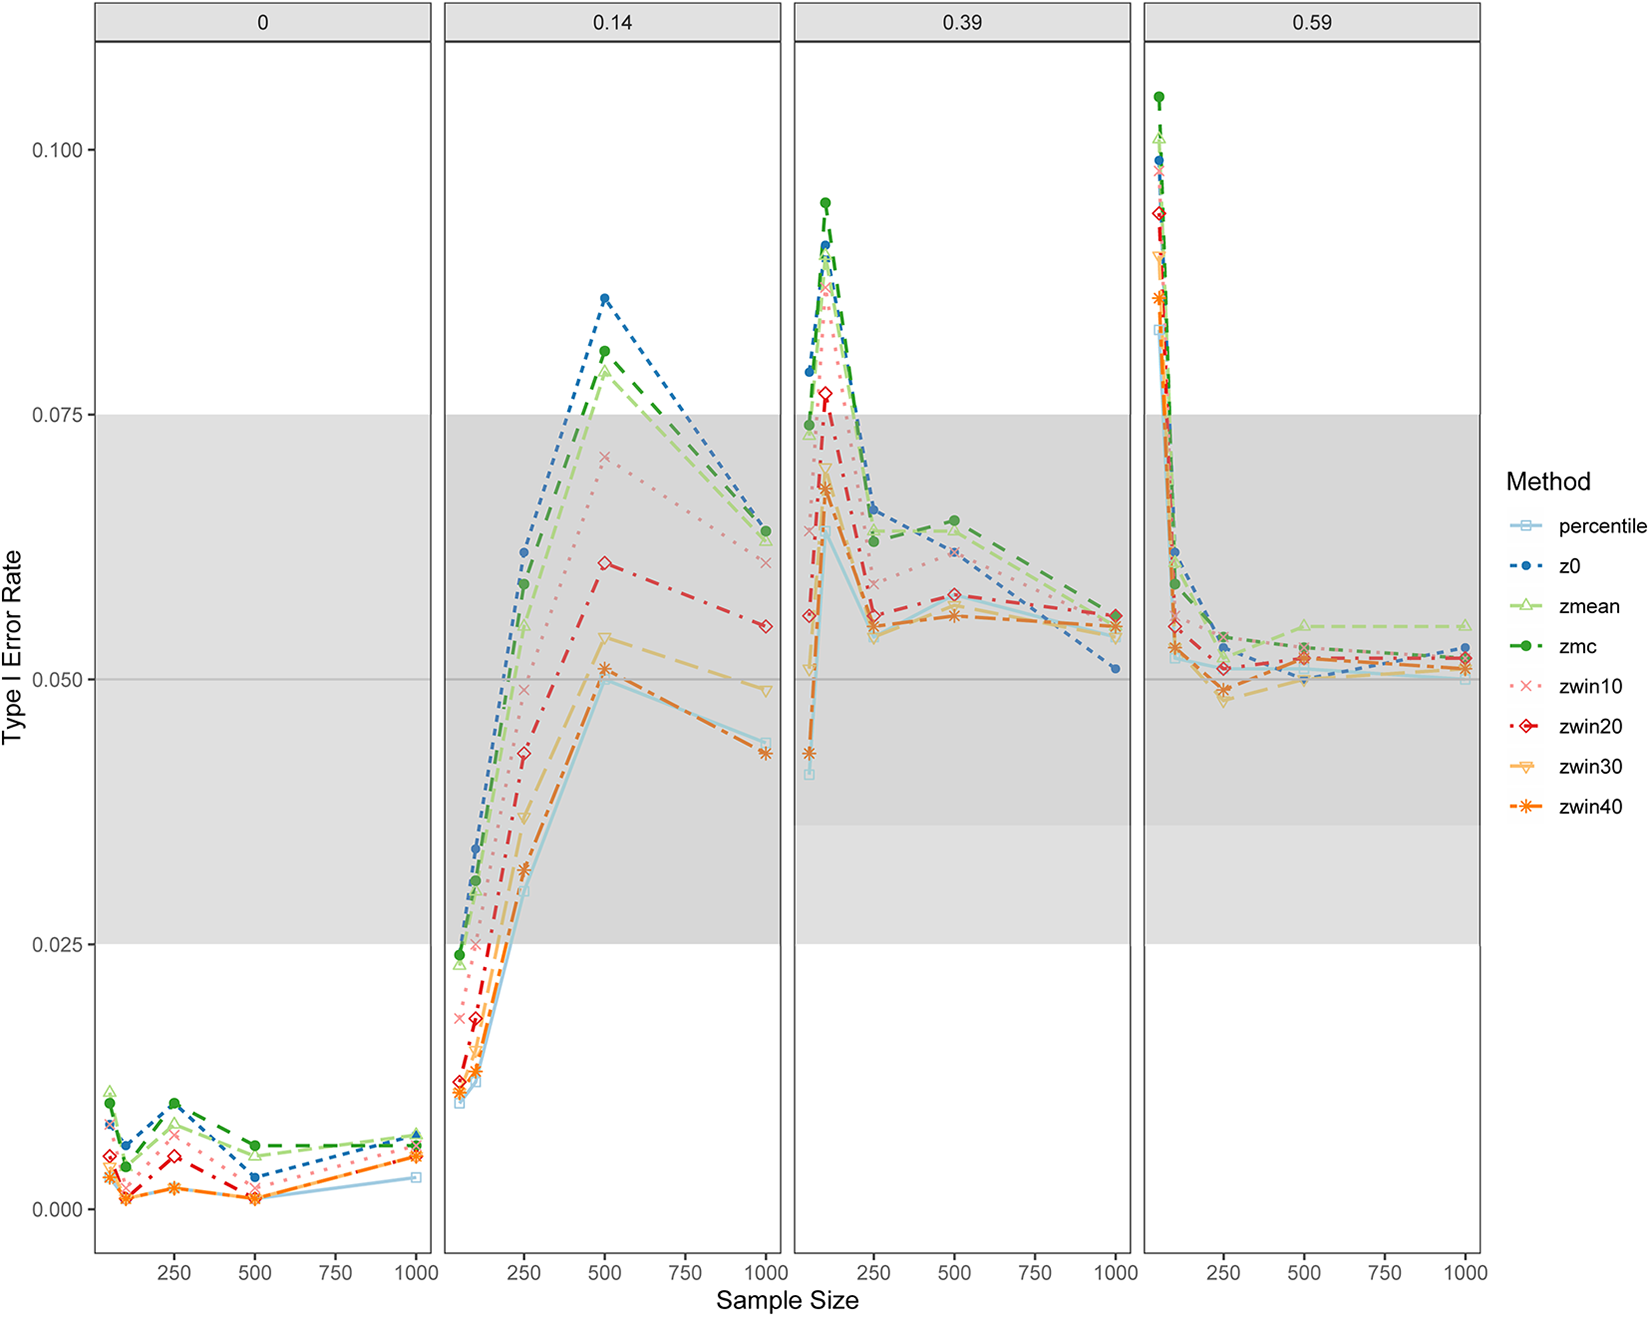
Type I error rates by effect and sample size between the percentile bootstrap and corrections for bias methods. Note. Type I error rates are displayed as the effect of sample size and the effect size of a. Each of the four panels represents a different effect size of a. In this figure, b = 0 for all conditions. “percentile” = percentile bootstrap method, “z0” = z
0, “zmean” =
When a = 0 and b = 0, the Type I error rates for all methods fell outside the robustness criteria. Robustness across methods varied by sample size when a = .14. For n = 50, all methods were outside of the robustness range. As the sample size increased to n = 100, the methods JST, MC, percentile bootstrap,
Overall, z
0,
Power
Generally—and as expected—as sample size increased, power also increased for all tested methods. Differences in power were a function of sample and effect size. Power between the alternative corrections for bias compared to the percentile bootstrap and z
0 is displayed in Supplemental Material Figure 3. Power for all benchmark methods (JST, MC, and percentile bootstrap) along with four corrections for bias methods (namely z
0,
The parameter combinations under which all methods had power
Power for all methods was below the desired .80 for n = 50, 100, or 250 when either a or b = .14, across all levels of the other. The second parameter combination where all methods were underpowered was when b = .39 and n = 50, across all levels of a. The final parameter combination where all methods were underpowered was when a = .59, b = .14, and n = 500.
The z
0,
Coverage and Imbalance
Perfect coverage is considered as .95. Bradley’s (1978) robustness criteria for coverage has a range of [.925, .975]. Coverage for JST was not considered as it is not a method for constructing CIs and thus did not fit the coverage definition. Collapsing across levels of b did not change the overall observed patterns of coverage levels across methods (reported in Supplemental Material Table 3). As depicted in Supplemental Material Figure 6, coverage tended to converge toward .95 as sample size and effect size increased. The following section reports cases where the methods did not meet the robustness criteria for coverage. First, most coverage rates falling outside the range occurred when n = 50. When a = b = .14, the MC, percentile bootstrap,
Coverage levels for z
0,
When the CI does not contain ab, the true mediated effect can either fall to the left or to the right of the CI. Similar to coverage, imbalance for JST was not considered. Imbalance results, collapsed across levels of b, are reported in Supplemental Material Table 4. Values above .50 indicate a larger proportion of CIs fell to the left of ab than the right, while values under .50 indicate more CIs fell to the right. The results for imbalance are displayed in Supplemental Material Figure 7. The methods tend to be imbalanced in the same direction (i.e., most were collectively either above or below .50 for a given parameter combination). The most fluctuation in imbalance was observed when a = b = 0. The fluctuation was due to the low Type I error rates for this effect size combination. Given how proportion for imbalance was calculated, misses only to the left with no misses to the right would equal a proportion of one. On the other hand, misses only to the right with no misses to the left would equal a proportion of zero. Therefore, with a small number of misses to begin with, the probability of the CIs only falling to either side of ab was high. Out of 720 effect size of a
Empirical Example
To illustrate the performance of the corrections for bias methods compared to the benchmark methods, these methods are applied to data from the Athletes Training and Learning to Avoid Steroids (ATLAS) program (Goldberg et al., 1996). The ATLAS program was designed to prevent high school football players from using anabolic androgenic steroids (AAS) by presenting healthy nutrition behaviors and appropriate strength training as direct alternatives to AAS use. Players received the ATLAS program over the course of the football season. Participants were measured at three time points (at the start of the football season, 3 months later at the end of the football season, and at a 1-year follow-up) on numerous potential mediating variables and three outcomes: intentions to use anabolic steroids, nutrition behaviors, and strength training self-efficacy. Because of the nature of bootstrapping, incomplete cases were deleted resulting in complete data for 731 students from Cohort 1 being used for the current example. In this example, the collected data will be treated as the population for illustration purposes only. As such, the use of the terms “power,” “Type I error rate,” and “performance” are only used under the premise of illustration. In practice, true population values would not be known to researchers so these terms would not be used in association with researchers’ collected sample data. Syntax are provided as Supplemental Material.
Power
MacKinnon et al. (2001) examined 12 possible mediators of the ATLAS program and found that the relation between participation in the ATLAS program (X) and a student’s intentions to use anabolic steroids measured 9 months after finishing the ATLAS program (Y) is mediated by a student’s perceived susceptibility to the adverse effects of steroid use immediately after completing the ATLAS program (M). The estimated values for the entire sample of 731 students are
Confidence Intervals From the Empirical Example.
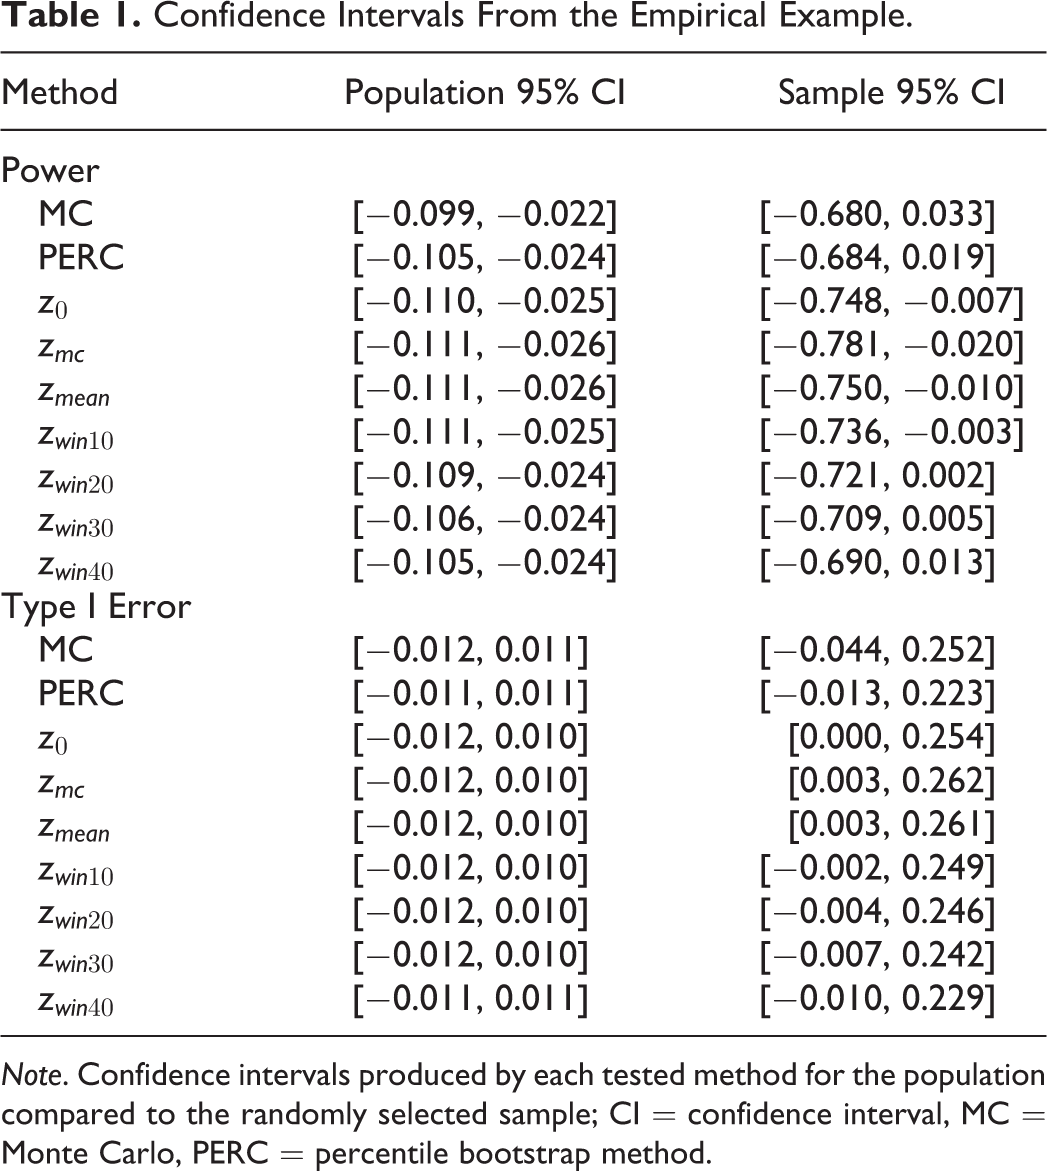
Note. Confidence intervals produced by each tested method for the population compared to the randomly selected sample; CI = confidence interval, MC = Monte Carlo, PERC = percentile bootstrap method.
To illustrate the difference in performance across methods, a random subsample of 50 students was selected from the original sample. The estimated values for the subsample are
Type I Error
In contrast, MacKinnon et al. (2001) found the relation between participation in the ATLAS program (X) and a student’s nutrition behaviors measured 9 months after finishing the ATLAS program (Y) is not mediated by a student’s normative beliefs concerning steroid use immediately after completing the ATLAS program (M). The estimated values for the entire sample of 731 students are
Taking a different random subsample of 50 students resulted in estimated values of
Discussion
The purpose of this study is to address the need to consider alternative corrections for bias that would produce CIs with more accurate Type I error rates without losing power. The original BC bootstrap test of mediation has elevated Type I error rates outside the robustness range in conditions with small sample sizes (i.e., n
The results of this study can be informed by Kisbu-Sakarya et al. (2014) with regard to the skewness of the bootstrap sampling distribution. They found that an increase in skewness leads to a decrease in coverage. One plausible explanation for decreased Type I error rates with the Winsorized means was that effects of a skewed product distribution were mitigated by redistributing tail weights. Without skew in the product distribution, Winsorized means would be similar to the regular mean as the standard error would be reduced (Wilcox et al., 1998). Relatedly, for the Winsorized means as corrections for bias, power is greater than the percentile bootstrap because the sample size is preserved; instead of eliminating outliers, the outliers are assigned a floor or ceiling value. The measure of central tendency used to adjust the confidence limits thus falls somewhere between the mean as a correction for bias (which is similar to the original bias correction) and the percentile bootstrap method. As a result, the Type I error rates and power also fall between those of the mean correction and percentile bootstrap methods.
Recommendation
The simulation study provides the opportunity to control the true population effect sizes (i.e., the effect sizes for a, b, and ab) to observe the corresponding patterns for Type I error, imbalance, power, and coverage. In reality, it is not so simple for researchers to have estimates of the true population effect sizes. Sample size, however, is a factor researchers can account for when selecting a method for CI construction. Overall, the benchmark methods (i.e., joint significance test, Monte Carlo, and percentile bootstrap) had the most consistently robust Type I error rates. Most methods had robust Type I error rates as well as optimal power and coverage when the sample size was greater than or equal to 250, so concerning larger sample sizes, the method of choice will not be associated with different Type I error rates, power, or coverage. The main differences occur with sample sizes smaller than 250.
The recommendations made in this paper echo that of previous studies. If health professionals and researchers using intervention data have a small sample size and are most concerned about not committing a Type I error, it would be advisable to use a benchmark method. Specifically, the Monte Carlo method has robust Type I error rates and higher coverage rates than the other methods. On the other hand, if researchers are most concerned about not committing a Type II error, the original BC bootstrap has the highest power. Finally, using Winsorized means as alternative corrections for bias offers varying levels of compromise between the elevated Type I error rate of the original BC bootstrap and the low power of the benchmark methods. Depending on health professionals and researchers’ cost functions and research goals, different trimming levels may be considered. As the percentage of trimming increases, Type I error rate and power both decrease. Accordingly, Type I error and power for the 10% Winsorized mean are most similar to the original BC bootstrap, while the 40% Winsorized mean is most similar to the Monte Carlo method. Therefore, trimming percentages in between will offer a balance in Type I versus Type II tradeoff. Due to the nature of incorporating Winsorized means as a correction for bias, creating Winsorized BC bootstrap CIs is a multiple step process including first bootstrapping data before calculating the Winsorized mean. Different ways of calculating Winsorized means depend on the software. Example syntax for R and SAS are provided in Supplemental Appendices A and B, respectively. The 30% Winsorized mean is incorporated in the examples, but this level of trimming can be changed to fit the researcher’s needs.
Limitations and Future Directions
As with any study, there were limitations to the design and execution of this study. First, missing data were not considered as a factor. An assumption for this paper was that the data would not have any missingness. In practice, missing data is a common occurrence, so a next step is to explore what percentage of missingness would be acceptable for producing unbiased estimates. Since Fritz et al. (2012) did not find an effect of the number of bootstraps on Type I error, the number of bootstraps used for this paper was 1,000. A future study could consider testing different numbers of bootstraps, however, to examine whether the Winsorized means as corrections for bias would be affected.
The goal of this study was to determine if alternative corrections for bias would maintain increased statistical power of the BC bootstrap with small samples, while also maintaining nominal Type I error rates when calculating CIs for ab. Although this paper did not directly achieve this goal, given the relationship between power and Type I error, ideally both Type I error rate and power would be optimized. In this case, the Winsorized means did help to optimize both. Although the Winsorized means did not have as accurate Type I error rates as the Monte Carlo method or as good statistical power as the original BC bootstrap, the Winsorized means split the difference. Imbalance, however, as observed in previous research (e.g., Bollen & Stine, 1990; Kisbu-Sakarya et al., 2014; MacKinnon et al., 2004) was still present, regardless of which correction for bias was used. This suggests that lower statistical power observed in the BC bootstrap may be related to asymmetry. Trimming for Winsorized means is not required to be symmetric. Therefore, a natural extension for the Winsorized means is to consider asymmetric trimming using the Winsorized means for skewed data instead of trimming from both tails equally, which raises the question of whether Type I error rates and power could be further improved for mediation analysis.
Supplemental Material
Supplemental Material, sj-docx-1-ehp-10.1177_01632787211024356 - Comparing Alternative Corrections for Bias in the Bias-Corrected Bootstrap Test of Mediation
Supplemental Material, sj-docx-1-ehp-10.1177_01632787211024356 for Comparing Alternative Corrections for Bias in the Bias-Corrected Bootstrap Test of Mediation by Donna Chen and Matthew S. Fritz in Evaluation & the Health Professions
Supplemental Material
Supplemental Material, sj-r-1-ehp-10.1177_01632787211024356 - Comparing Alternative Corrections for Bias in the Bias-Corrected Bootstrap Test of Mediation
Supplemental Material, sj-r-1-ehp-10.1177_01632787211024356 for Comparing Alternative Corrections for Bias in the Bias-Corrected Bootstrap Test of Mediation by Donna Chen and Matthew S. Fritz in Evaluation & the Health Professions
Supplemental Material
Supplemental Material, sj-r-2-ehp-10.1177_01632787211024356 - Comparing Alternative Corrections for Bias in the Bias-Corrected Bootstrap Test of Mediation
Supplemental Material, sj-r-2-ehp-10.1177_01632787211024356 for Comparing Alternative Corrections for Bias in the Bias-Corrected Bootstrap Test of Mediation by Donna Chen and Matthew S. Fritz in Evaluation & the Health Professions
Footnotes
Acknowledgments
The authors would like to thank Jim Bovaird, Lorey Wheeler, and Karen Alexander for providing feedback for early drafts of this manuscript. Additional thanks to Jayden Nord for providing programming guidance.
Data Availability Statement
The syntax and the simulated data for this study are available as online supplemental materials. The empirical data that support the findings of this study are available from Dr. David MacKinnon and Dr. Linn Goldberg, but restrictions apply to the availability of these data, which were used under license for the current study, and so are not publicly available. Data are however available from the authors upon reasonable request and with permission of Drs. Goldberg and MacKinnon.
Declaration of Conflicting Interests
The author(s) declared no potential conflicts of interest with respect to the research, authorship, and/or publication of this article.
Funding
The author(s) disclosed receipt of the following financial support for the research, authorship, and/or publication of this article: This research was supported in part by a grant from the National Institute on Drug Abuse (DA 009757).
Supplemental Material
Supplemental material for this article is available online.
Note
References
Supplementary Material
Please find the following supplemental material available below.
For Open Access articles published under a Creative Commons License, all supplemental material carries the same license as the article it is associated with.
For non-Open Access articles published, all supplemental material carries a non-exclusive license, and permission requests for re-use of supplemental material or any part of supplemental material shall be sent directly to the copyright owner as specified in the copyright notice associated with the article.