



Abstract
Using a new disability measure applicable to both the near elderly and elderly population, we track respondents aged 51–61 in 1992 from the Health and Retirement Study and account for their status over 20 years. We demonstrate that to screen in as disabled and to screen out as nondisabled require different analytic strategies and use multiple indicators to establish three groups: disabled, nondisabled, and a residual category with ambiguous status. We use work-disability and Supplemental Security Income/Disability Insurance (SSI/DI) receipt for testing distributional outcomes and assessing face validity of our disability measure. Selective attrition due to death and institutionalization is substantial over 20 years. Persistent disability is the dominant adverse outcome of initial disability shock. Overtime exits due to death become progressively more important; 44% disabled at baseline are dead by Wave 11 compared to 21% for nondisabled. Disability status at baseline is associated with financial insecurity persisting to Wave 11 among survivors.
Keywords
A growing body of literature focuses on financial security among working aged including near elderly people with disabilities. However, less is known about how disablement processes vary in the transition from the working aged to elderly. Developing a framework encompassing both age-groups is policy relevant, given increased life expectancy, transitions from work to retirement, proposals to extend the Social Security full retirement age, changing dynamics of disablement, and mortality. Our paper provides a full accounting of the disablement processes among a nationally representative cohort aged 51–61 in 1992 for over 20 years from the Health and Retirement Study (HRS).
Yet there are two fundamental challenges, namely, the definition of disability in a manner applicable to both the working aged (near elderly) and elderly portions of the life cycle and sample selectivity. In the seminal Nagi framework, disability is defined in a social context and varies across the three major stages of the life cycle: childhood, working-age adulthood, and the elderly years. The effect of disabilities on work capacity is central to the study of the working aged—and properly so. However, work disablement becomes less relevant as people age despite recent increase in work and social expectations to continue to work past the “normal” retirement age. In contrast, the capacity for nonwork daily activities becomes increasingly relevant as people age. “Work disabled” is a logical concept for assessing the working aged, but a successful strategy to analyze disablement across the near elderly to elderly divide requires a more comprehensive approach.
The second challenge is sample selectivity. Mortality and institutionalization dramatically increase among the elderly. Selective mortality associated with disablement magnifies the selectivity problem. Furthermore, extending the time horizon of analysis from a few years to a 20-year span, as we do, should compound this problem. These issues may be marginally relevant when focusing on the working aged but are central to understanding the transition from working aged to elderly.
In the rest of this paper, we develop and implement a new strategy to analyze disablement among the near elderly to the elderly section of the life cycle and to fully account for the baseline sample across 11 HRS waves. The empirical analysis tests a new classification of disability and describes the process of disablement accounting for selective mortality. Our paper is descriptive, and we do not attempt a formal evaluation of causal effects.
Literature Review
We review an emerging body of literature on the process and effects of disablement among the working aged and near elderly (Butrica, Toder, & Desmond, 2008; Charles, 2003; Dushi & Rupp, 2008, 2013; Rupp & Davies, 2004; Johnson, Favreault, & Mommaerts, 2009; Johnson, Mermin, & Murphy, 2007; Meyer & Mok, 2013; Schimmel & Stapleton, 2012; Smith, 1999, 2005, 2007). Our focus includes two areas key to this study’s objectives: (1) disability measurement and (2) selectivity. We are not providing a comprehensive review of the literature that focuses on the working aged. Rather, we focus on issues that become important as we extend the analysis of the process of disablement to the elderly portion of the life cycle. We do not review other important areas, notably the measurement of financial security. However, we acknowledge a trend toward multidimensional measurement and the use of a large array of income, asset, and consumption outcomes (Meyer & Mok, 2013).
Disability Measurement
The literature on the working aged uses several indicators covering various aspects of disablement. These include self-reported “work-limiting condition,” “doctor diagnosed major health condition” (MHC), “fair or poor” health, two or more activities of daily living (ADLs), and two or more instrumental activities of daily living (IADLs). 1 With the exception of a few studies, a single measure is utilized.
The most commonly used measure is work disability, a specific aspect of the overall concept of disability (Jette & Badley, 2000). Charles (2003), Meyer and Mok (2013), and Schimmel and Stapleton (2012) used this single measure. Using a battery of tests, Benitez-Silva, Buchinsky, Chan, Cheidvasser, and Rust (2004) cannot reject the hypothesis that self-reported work limitations provide an unbiased indicator for SSA’s disability award decision among a sample of Social Security Disability Insurance/Supplemental Security Income (SSDI/SSI) applicants. Work limitation addresses a major social role among the working aged. However, the usefulness of this measure becomes less important with aging among the elderly.
Influential papers by Smith (1999 , 2005 , and 2007) focus on doctor diagnosed MHC. This is a predisposing factor clearly applicable to both the working aged and the elderly and becomes increasingly important as the incidence of adverse health events increases with age. This measure has some advantages. For example, it is relatively objective and may signal an early stage of disablement. However, it is a utilization-dependent measurement hampered by selective false negatives among the poor and uninsured. Another weakness is that the effects on disablement are dependent on medical innovation. MHC is not always associated with any signs of disablement, especially at early stages and subsequent to successful medical treatments (e.g., new cancer drugs). ADLs and IADLs are important in the studies of the elderly but less frequently used for studying the working-age population. Heller, Fisher, Marks, and Hsieh (2014) argue that aging and disability research are two separate fields. The selection of measures is highly dependent on research policy context (e.g., work disablement in the disability insurance context in contrast to Centers for Disease Control and Preventions’ [CDC’s] behavioral risk factor surveillance system, see Hall, Kurth, and Fall (2012)).
Compared to health services research, self-reported health status is less frequently used in studying the financial implications of disablement among the working aged, although Rupp and Davies (2004) demonstrated that it is highly predictive of long-term disability program entry and mortality. While subjective, it picks up aspects of disablement that more objective measures fail to detect. Self-reported health status is relatively useful in assessing poor and uninsured populations compared to MHC.
As noted, most studies relied on a single measure; this increases the chance of both false negatives and false positives. Some relied on multiple measures. Dushi and Rupp (2008) used three measures (work limited, MHC, and self-reported poor/fair health) for studying the near elderly. Rupp and Davies (2004) used all five measures for the working aged. A limitation is that neither study attempted to combine these measures. Side-by-side analyses allow for assessment of robustness but do not reduce the screening error of any of the independently used measures.
Salient weaknesses of using single measures arise both from multidimensionality and from the fact that disablement is a process, not a state. Charles (2003), Daly (1998), Meyer and Mok (2013), and Schimmel and Stapleton (2012) identified pre-onset differences in health status and distributional outcomes seemingly suggesting adverse “effects” of disability shocks prior to the measured shock. A possible cause for such differences is classification error due to two reasons: (a) disability is not easily amenable to measurement as a univariate yes–no state and (b) disablement is frequently the result of a gradual process rather than an instantaneous “disability shock” (Verbrugge & Jette, 1994).
Selectivity
We address two kinds of selectivity. The first is selectivity in defining the study population. The second is selective attrition.
First, studies of the working aged often ignore population subgroups with week labor force attachment as Meyer and Mok (2014) argues. Yet, roughly one third of the working aged is at risk of SSI disability (Rupp, Davies, & Strand, 2008). They are disproportionately female, minority, and high-school dropouts. Meyer and Mok (2014) focus on women, filling some gap.
Second, attrition arising from death, institutionalization, and survey-related reasons is a potential source of selectivity. In the literature reviewed here, the focus on the working aged or near elderly death exits is often ignored. For example, excellent studies by Charles (2003), Meyer and Mok (2013), and Schimmel and Stapleton (2012) do not address mortality outcomes. Smith (1999) discusses the issues related to mortality, but he uses only subjective survival probabilities not actual death events in the analysis. As noted, ignoring mortality outcomes is less problematic in studies that focus on the working aged—as these studies do—but become more problematic as one extends the analysis framework to include elderly people.
Using disability measures based on multiperiod disability status indicators may also cause selectivity threatening external validity. For example, Charles (2003) using data from Panel Study of Income Dynamics (PSID) defines two subgroups of analytic interest: those who are work disabled in all survey panels and those who are not work disabled in all panels. He correctly argues that these two subgroups are clearly either work disabled or not. However, respondents work disabled in some but not in other waves are simply ignored in his modeling. Another downside of his measurement strategy is selective attrition, especially among people with severe disabilities. Survivors over several waves, who are chronically disabled, may overrepresent people with intellectual disabilities, while underrepresent impairments with high mortality risk.
Popular fixed effects modeling by definition focuses on longitudinal changes. This is understandable but comes at the expense of external validity: those already disabled (D) at baseline are excluded from the analysis. They comprise a large and important segment of the near elderly and especially the elderly. Dushi and Rupp (2013) demonstrate substantial longitudinal differences among those already D at age 51–61 (Wave 1) and others who become D at subsequent waves.
Research Design
Data
Our baseline consists of a nationally representative sample of HRS respondents in 1992 born in 1931–1941 (Wave 1). They are followed over Waves 2 to 11, and as they reach age 71–81 years by Wave 11 in 2012, or die, or exit to some other semi-absorbing state (e.g., institutionalization) and never return to the sample until 2012. We assign a survey status to Wave 1 observation up to Wave 11.
The HRS health and disability indicators we use include self-reported doctor diagnosed MHC; problems with ADLs such as bathing, eating, and dressing; difficulties with IADLs such as using a telephone, taking medication, handling money; and self-reported health status. We also use indicators of difficulties with gross motor skills (walking one block, walking across the room, climbing one flight of stairs, and bathing), large muscle tasks (sitting for 2 hr, getting up from a chair, stooping or kneeling or crouching, and pushing or pulling a large object), difficulties with mobility tasks (walking one/several blocks, walking across the room, climbing one/several flights), body mass index (BMI), and Center for Epidemiological Studies Depression (CES-D) depression index. While deliberately ignoring the work-limiting condition variable in our disability classification, we provide some comparative statistics.
Analytic strategy and operational measurement
To account for the process of disablement, we start with cross-sectional measures as the potential building blocks. We focus on the five measures used in the studies reviewed above. Disability is not easily amenable to a yes–no measure of two distinct states. There are a number of commonly used disability indicators reflecting multiple dimensions and heterogeneity of disablement. This leads us to consider establishing disability status as a screening problem. Parsons (1991) identifies screening as an endemic problem in targeted public programs (such as DI), since eligibility status is established as a 0–1 variable but not directly observable to program agents. Inevitably uncertainty is compounded by self-screening and moral hazard in applicant reporting. Program operators use a number of indicators – some to “screen in” as D and some to “screen out” as nondisabled (ND). Some cases are straightforward (compassionate allowance cases to screen in, minor fractures or pregnancy to screen out in disability determination). However, there is a wide gray area that allows for substantial discretion in terms of leniency or tightness of decisions. Tightness may lead to better screen-in accuracy (those screened in are more likely to be D) and deterioration of screen-out accuracy (denial of benefits to others who are truly D). This trade-off has implications for program outlays, behavior, and financial security of the target population. Changes in tightness resulted in huge fluctuations in disability caseload over time with profound implications for well-being.
A screening strategy might be fruitful for research but the nature of the screening problem in survey research is different from that facing program agents. Administrative rules and moral hazard are less relevant for research. Researchers and program administrators have access to different sources of data. Availability of government-appointed doctors and administrative record systems may enhance administrative accuracy, but poor record design is frequent. Researchers can rely on survey design and testing but are hampered by underreporting or misreporting of program participation. A yes–no decision on disability status may be inevitable in program administration but not in research. In this research, we recognize screening in and screening out as distinct challenges; we do not force observations into a single dichotomy. We use different algorithms to screen in as D and screen out as ND, allowing for a gray area of “potentially disabled” (PD). Separating this third group allows us to be more definitive about the contrast between D and ND subpopulations and to establish a reasonably clean counterfactual. In the context of the disability determination process, both Benitez-Silva et al. (2004) and Maestas, Mullen, and Strand (2013) find a large gray area between those whose status is D or ND. Our concept of disability is clearly different from the statutory definition of SSA’s disability programs that focus on severe disablement. However, both definitions use screening concepts. In the empirical analysis, we present cross tabulations using both measures as one of our tools to assess validity.
To establish respondents’ D, ND, and PD status, we develop a new operational measure that utilizes the rich array of disability-related information in the HRS using the screening-based classification strategy just discussed. At a high level of abstraction, our strategy is to use a logical “or” to avoid failure to screen in the truly D, and to use a logical “and” to avoid failure to screen out the truly ND. Our screening strategy is informed by an empirical analysis presented in the results section using the five commonly used measures of disability in the literature reviewed above. We will empirically demonstrate that a simplistic screening strategy using all of these variables to screen in and screen out mechanically is not workable. Our operational measurement (summarized in Figure 1) is based on four of the five measures in a flexible way that is informed by the asymmetry between screen in and screen out. We do not use the work-limited measure in our classification because it becomes less and less relevant as elderly people age. The flexibility afforded by this heuristic screening methodology also allows us to use additional variables beyond the core four that are available from the HRS. We use auxiliary measures to improve either screen in or screen out. Figure 1 shows that the first step is to screen in as D. It also shows the list of variables and specific rules of the screen-in algorithm.

Screening algorithm used to derive disability classification.
A few observations are worth noting. We imposed the requirement to meet both MHC and poor health rather than either alone, because MHC is often not associated with substantial limitations in functioning or high mortality risk (especially given advances in medical technology), and self-report of poor health is subjective. We combined ADLs and IADLs because HRS IADLs measurement is limited. Reviewing specific components of ADLs and IADLs items, we decided that a single positive item response did not warrant screen in. Large muscle + mobility score was used as an adjunct to the ADLs/IADLs measures given some overlap but also some unique content. We examined the effects of adding this variable marginally to all of the other screening variables. We also looked at the empirical distribution of the large muscle score distribution and its relationship with other relevant variables. Our technical judgment was that a cutoff of 8 would have added too little to screen in and a cutoff of 6 could have diluted the quality of screen in. Self-identified as D was not an interviewer-prompted category of an HRS variable combining labor force and retirement status in a unique way but was coded from verbal responses volunteered by respondents. We took this as clear indication of severe disablement.
We rely on these indicators because they can be interpreted for both working aged and elderly people. As previously noted, we avoided the inclusion of work limited in our disability measure purposefully, but we use it to test face validity at age 51–61. We did not consider BMI as screen in, because the relationship between disability and BMI is yet to be clarified in the literature. However, we retained very high BMI (≥36) to screen out observations that are not clearly ND. We did not use CES-D to screen in, because measurement based on a single wave is not a reliable indicator of clinical depression.
The second step, conditional on not being identified as D, is to screen out ND. The screen out as ND algorithm (Figure 1) requires screen out on all source indicators. In the third step, the remaining sample is identified as PD.
We apply our concept of disability across all 11 HRS waves. We retain all baseline observations and assign a status for each follow-up wave. In addition to the categories of ND, PD, and D, we assign the status as “dead,” “in institution,” “nonrespondent,” and “dropped from the sample.” We distinguish five known dispositions (ND, PD, D, dead, and in institution), and two sample attrition categories (nonrespondent and dropped) for whom disposition as ND, PD, D, dead, and in institution is unknown. We create a new concept of “adverse outcomes” including three categories: D, dead, and institutionalized. This is based on the recognition that death and institutionalization are frequently the results of disablement; censoring on these outcomes could result in severe selectivity.
Results
First we briefly assesses the “screen-in” and “screen-out” properties of the five disability measures discussed earlier using Wave 1 cross section at age 51–61. In Table 1, we assess the relationship between each of the five measures (rows) and alternative indicators (column) in terms of screen-in probabilities defined as pj | (pi = 1) where “i” refers to the row disability measure and “j” refers to the alternative indicator j ≠ i. We are interested in the proportion defined D by measure i and also screened in by alternative indicator j. Conversely, 1 − pj indicates the proportion that failed to screen in on j despite being labeled D on i. No assumption is made here about relative attractiveness of the measures. The table reveals substantial discrepancies, especially in screen in.
Assessment of Disability Measures Based on Comparisons With Alternative Indicators.
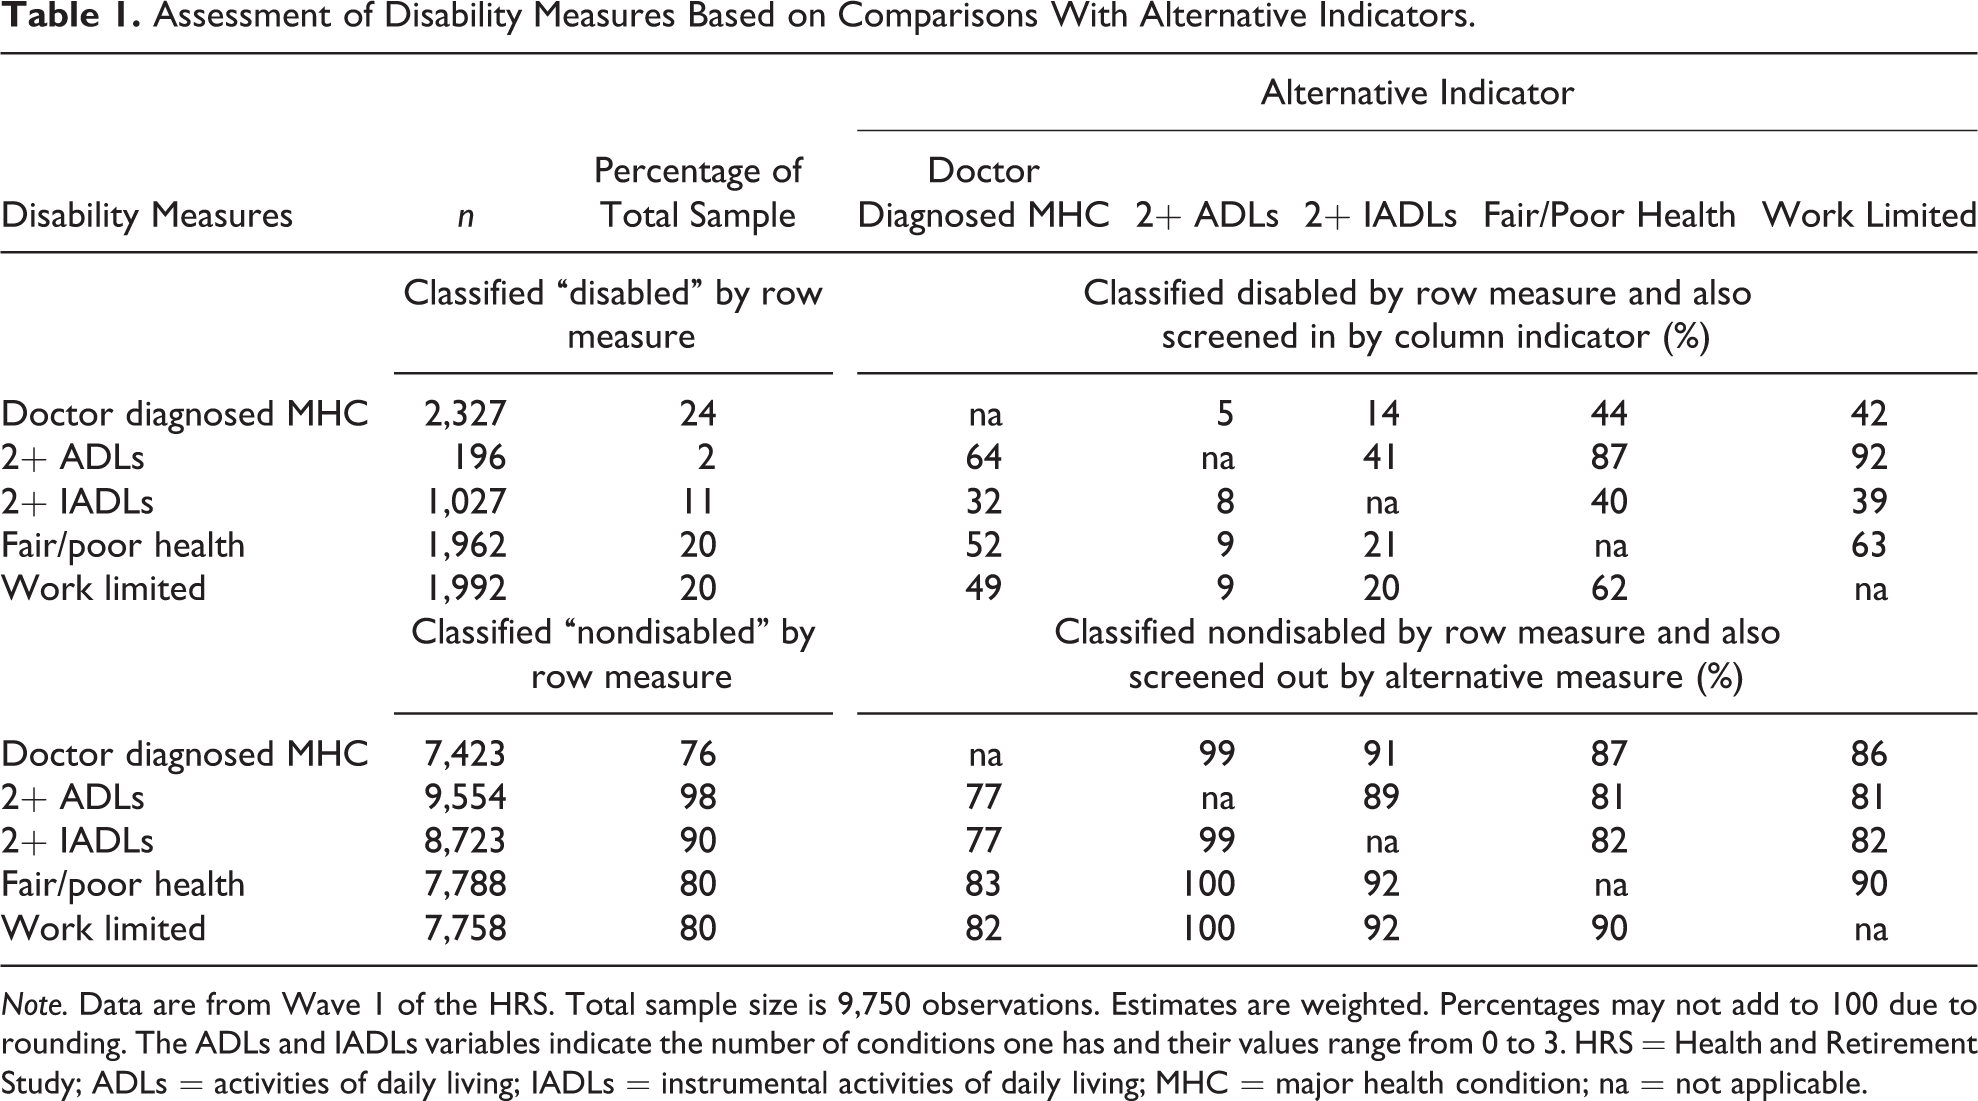
Note. Data are from Wave 1 of the HRS. Total sample size is 9,750 observations. Estimates are weighted. Percentages may not add to 100 due to rounding. The ADLs and IADLs variables indicate the number of conditions one has and their values range from 0 to 3. HRS = Health and Retirement Study; ADLs = activities of daily living; IADLs = instrumental activities of daily living; MHC = major health condition; na = not applicable.
Thus far we looked at bivariate relationships. Another approach is to estimate the joint distribution on all five measures listed in Table 1. Simple probability theory suggests that screening in and screening out are quite different problems. Statistically, this largely reflects the fact that the D is a minority, however defined in a representative sample of 51- to 61-year-olds. Table 2 (column 1) shows that assuming statistical independence there is a very low probability (only 0.002%) of agreement on D on all measures by chance alone. In relative terms, the 0.4% observed agreement is much better but still low in absolute terms.
Distribution of the Number of Disability Indicatorsa Met at Baseline (%).

Note. Data are from Wave 1 of HRS. Percentages may not add to 100 due to rounding error. In the first column of row “Five,” the calculated value is positive but very small: 0.0021%. HRS = Health and Retirement Study; na = not applicable.
aDisability indicators we consider here are those reported in Table 1.
bThe derivation of percentages assuming independence is as follows. Define the probability of being “disabled” on a single indicator “i” as pi (i = 1–5). Then the probability of all indicators being “disabled” equals Πpi , where i = 1–5. Likewise, the probability of all suggesting “nondisabled” status equals Π (1 − pi ). The source of data for this calculation is given in the second column of Table 1.
In contrast the probability of all five measures indicating ND based on chance alone would be 42.4%. 2 Table 2 (column 2) shows that the actual agreement on ND is even higher, 59.9% due to positive correlations. These numeric results suggest that screening in as D is much more challenging than screening out as ND. Requiring screen-in agreement on all five measures would be fairly “foolproof” if the sole objective was to find some truly D. However, the resulting 0.4% is counterintuitive as a prevalence measure; the stricter the screen-in rule, the higher the likelihood of missing truly D. In contrast, screening out on all five indicators as ND suggests both confidence that those screened out are truly ND and it also identifies a relatively large group (59.9%) which is intuitively more appealing. The combination of these two simple rules would leave the disability status of almost 40% (100–0.4–59.9) ambiguous. The screening algorithm we developed addresses the screen-in and screen-out challenges discussed.
The last two columns of Table 2 present comparable results using four measures only; work limited is excluded here due to questionable applicability at older ages. The qualitative conclusions are fairly similar—assuming statistical independence only 0.01% would screen in. The observed 0.4% agreement on all four is better but still low.
Table 3 suggests that the screening strategy developed in this study produces a distribution that is intuitively more appealing: the second row of Table 3 shows 42% is classified as ND, a sizable group (37%) as PD, and 21% as D. The proportion D is very close to prevalence suggested by both MHC and work limited (see second column of top portion of Table 1).
Distribution of Five Disability Measures by Disability Status at Baseline (%).

Note. Data are from Wave 1 of HRS. Estimates are weighted. The ADLs and IADLs variables indicate the number of conditions one has and their values range from 0 to 3. HRS = Health and Retirement Study; ADLs = activities of daily living; IADLs = instrumental activities of daily living; MHC = major health condition; SSI = Supplemental Security Income; DI = Disability Insurance.
The variable “number of disability indicators met” shows strong association as expected. Our sample distribution also makes sense in light of estimates by Benitez-Silva et al. (2004) and Maestas et al. (2013) based on conceptually similar three-way classifications for different but roughly comparable populations. 3 Table 3 further characterizes our classification using the five individual measures discussed earlier. All but one were important building blocks of our new measure; we should expect these associations by construction. Importantly, work limited was not used in developing our new measure, and therefore it can be used for testing on the baseline sample including only working aged people. We also use another variable, not included in our new measure, for testing: the receipt of SSI or DI.
Given the importance of the two measures, we perform double falsification similar to the approach developed by Burkhauser, Fisher, Houtenville, and Tennant (2012) and Burkhauser, Houtenville, and Tennant (2013) to validate the six-question disability sequence established by Department of Health and Human Services (DHHS) in response to a mandate by Affordable Care Act (ACA). A clear analogy is that both our disability measure and the six-question Current Population Survey measure are based on a screening strategy using multiple measures and both exclude the work-limited disability measure, albeit for very different reasons. Burkhauser et al. primarily tests the quality of the six-question measure as a proxy for work disability among working-aged people aged 25–61. In contrast our aim is to test a variable that can be applied both to the elderly and to the near elderly (aged 51–81 and potentially beyond) but still can be used as a reasonable proxy for the near elderly aged 51–61. The data reveal that the prevalence of work limited is only 6.8% among the group we classify ND, and only 14% of work limited are classified ND (Table 3). The corresponding percentages are 0.7% and 5.0% for the receipt of SSI/DI variable. All measures are consistently highest for the D group, with ND in between. Fifty-six percent of work limited is identified as D and another 30% as PD. A high proportion (77%) of SSI/DI disability beneficiaries are identified as D, while an additional 18% is PD. More detail is given in the Supplemental Material. While the samples and objectives of the Burkhauser et al. (2012) study differ, looking at the two sets of falsification checks (Supplemental Tables 1 and 2) also suggests that our classification is reasonable. Taken together, we assess these results as a fairly positive validation.
Comparisons on other baseline characteristics are also favorable. All but one has a strong association with disability status in the expected direction (Table 4). Consistent with the previous research by Dupre (2007), Dushi and Rupp (2008, 2013), Rupp and Davies (2004), Smith (1999, 2005, 2007), and Schimmel and Stapleton (2012), we find strong education, income, and wealth gradients.
Baseline Characteristics by Disability Status at Wave 1.
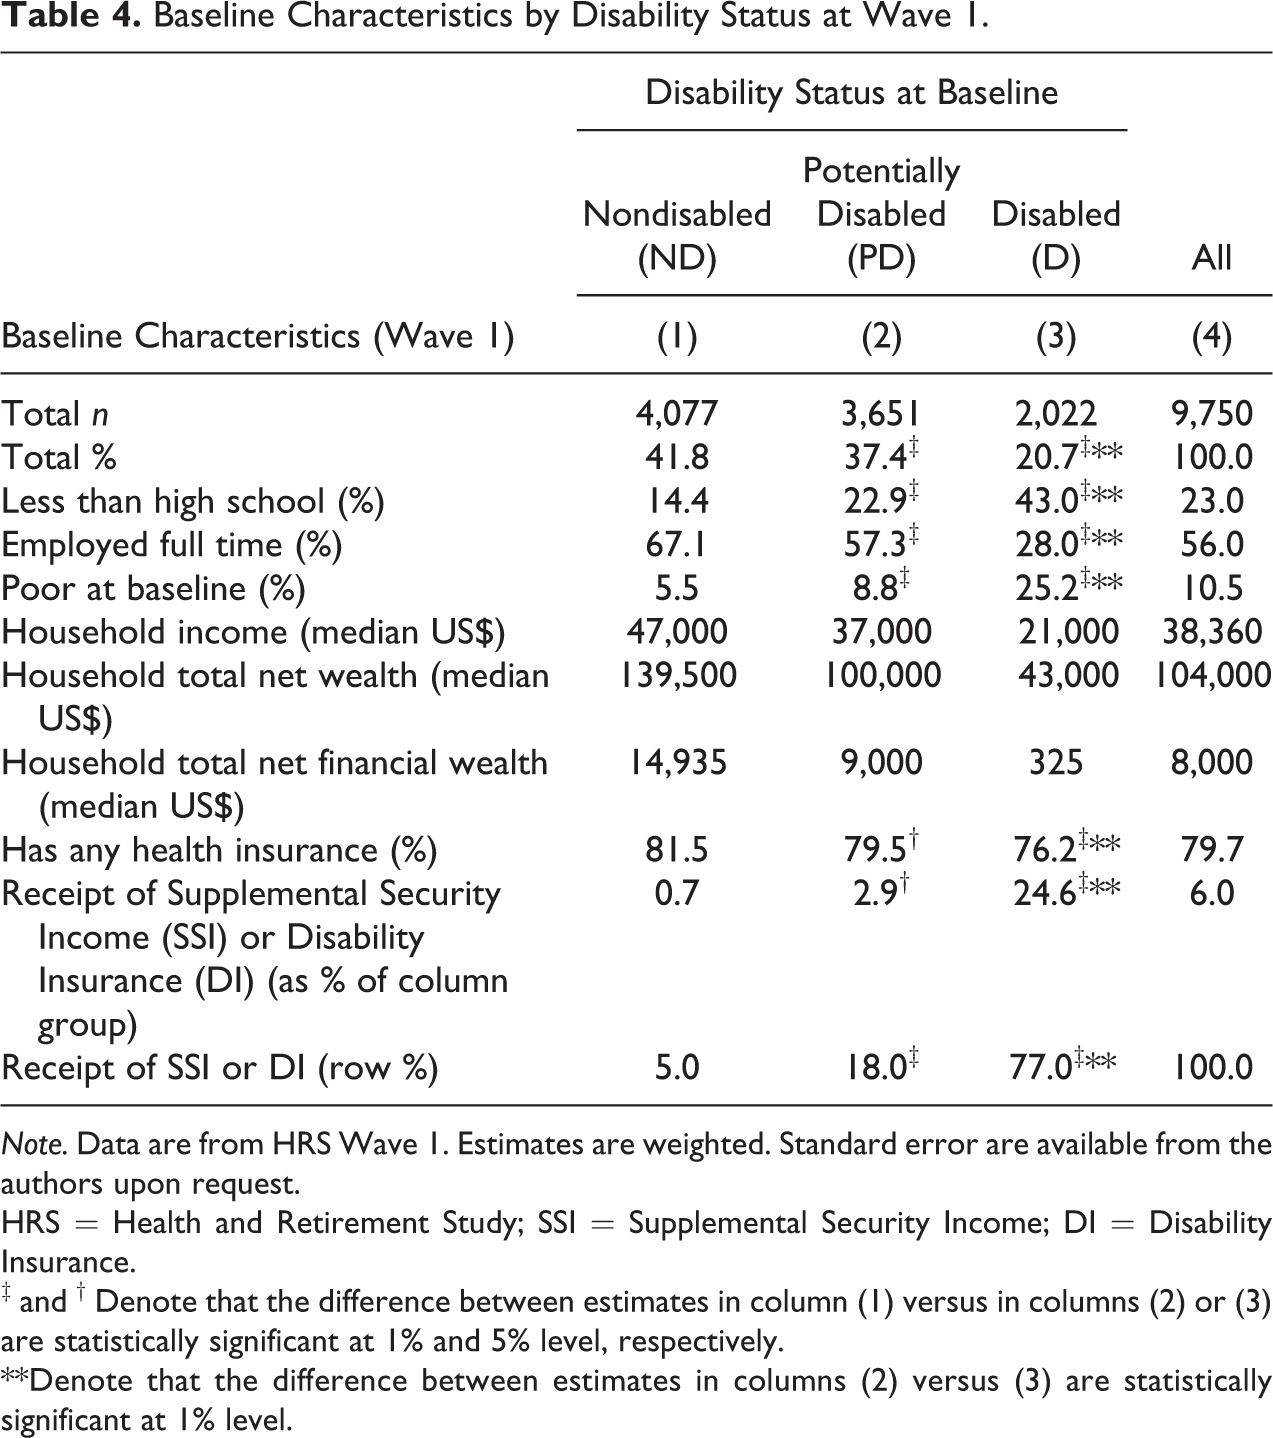
Note. Data are from HRS Wave 1. Estimates are weighted. Standard error are available from the authors upon request.
HRS = Health and Retirement Study; SSI = Supplemental Security Income; DI = Disability Insurance.
‡ and † Denote that the difference between estimates in column (1) versus in columns (2) or (3) are statistically significant at 1% and 5% level, respectively.
**Denote that the difference between estimates in columns (2) versus (3) are statistically significant at 1% level.
The evidence in Tables 1–4 provides cross-sectional support for the validity of our classification. Specifically (1) we succeeded in creating reasonably “clean” subsamples of ND and D and (2) provided evidence that our measure is a good proxy of work disabled among the near elderly—an important finding given the tension between our objective to use a measure that is applicable to both the near elderly and elderly portions of the life cycle and the obvious importance of work disablement among the near elderly.
Next, we account for the disposition of the full baseline sample through Wave 11. Table 5 shows nontrivial attrition from Wave 1 to 2, with nonresponse being the dominant reason. In contrast, the death exits dominate by Wave 11. Attrition is clearly associated with baseline D status. Death is also the dominant reason for differential attrition by D. The cumulative percentage that deceased differentially increases across waves in a roughly linear pattern for all three baseline states (data not shown). Albeit institutionalization is a minor exit reason it is associated with D status at baseline.
Interview Status of the Baseline Sample at Wave 2 and Wave 11, by Baseline Disability Status.
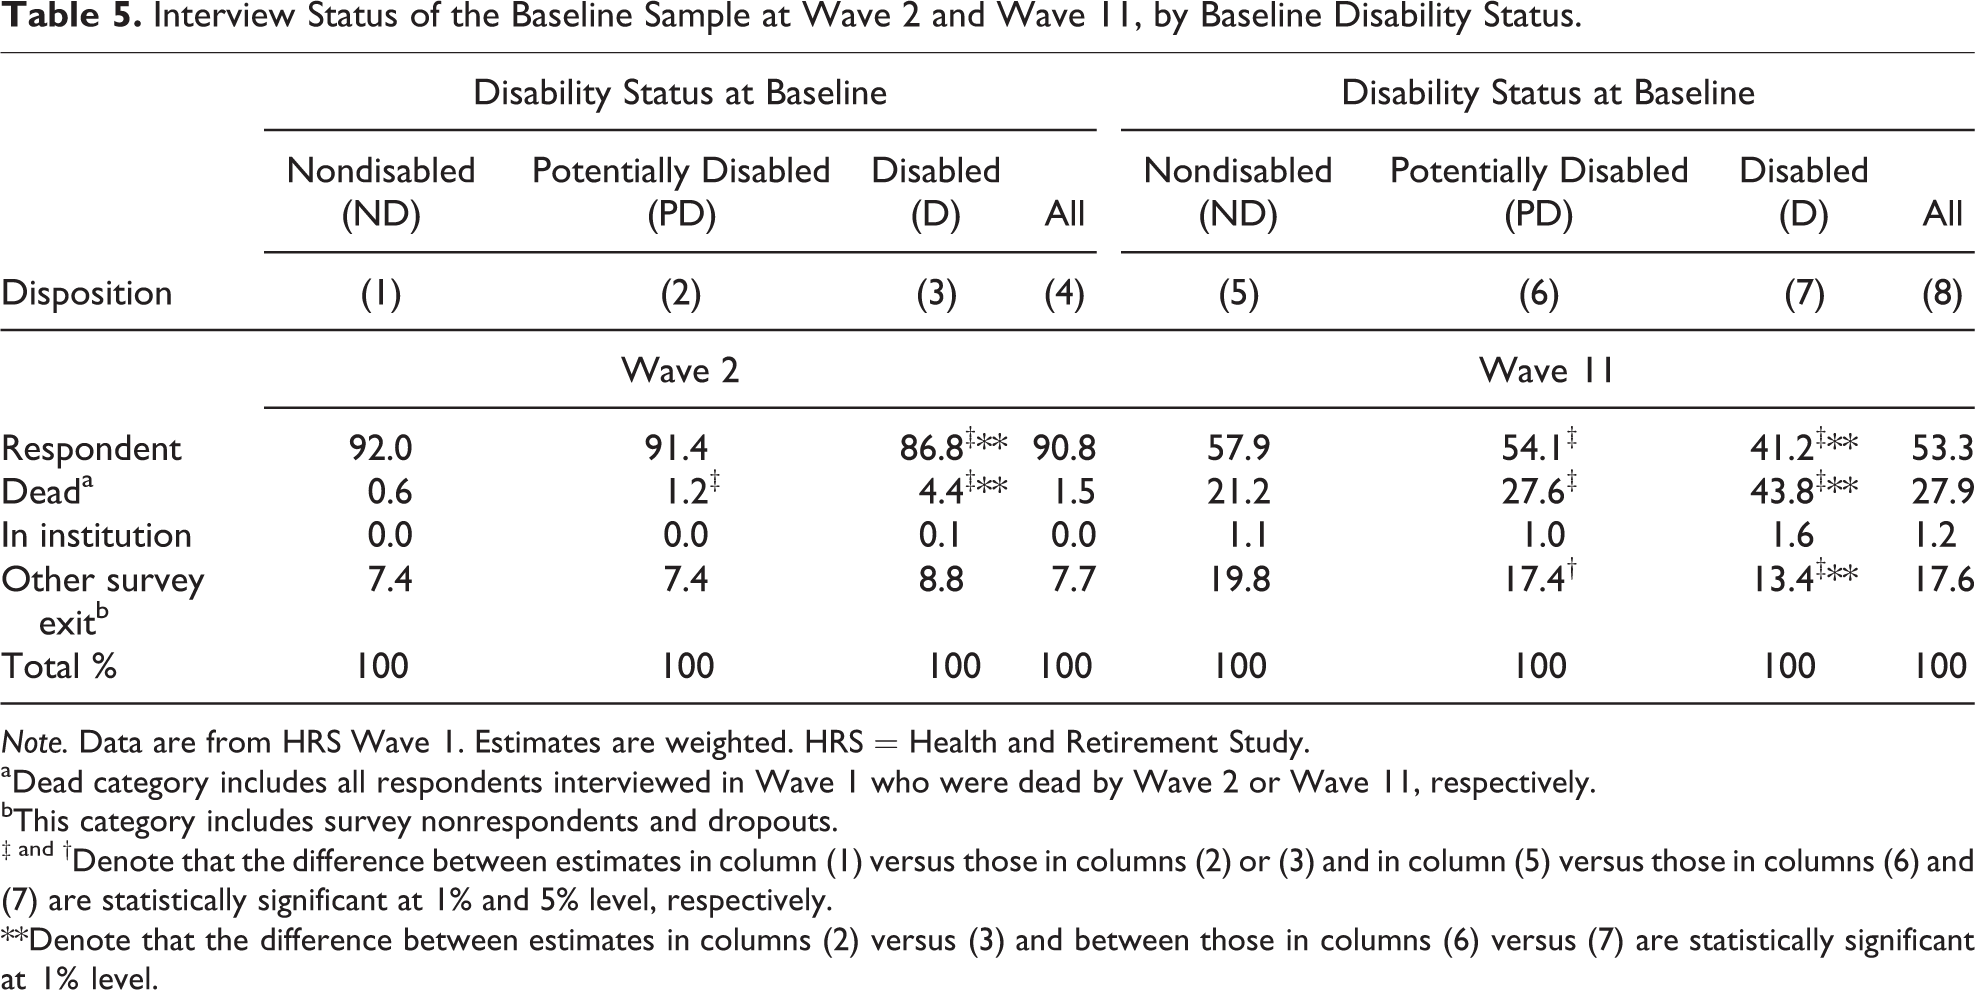
Note. Data are from HRS Wave 1. Estimates are weighted. HRS = Health and Retirement Study.
aDead category includes all respondents interviewed in Wave 1 who were dead by Wave 2 or Wave 11, respectively.
bThis category includes survey nonrespondents and dropouts.
‡ and †Denote that the difference between estimates in column (1) versus those in columns (2) or (3) and in column (5) versus those in columns (6) and (7) are statistically significant at 1% and 5% level, respectively.
**Denote that the difference between estimates in columns (2) versus (3) and between those in columns (6) versus (7) are statistically significant at 1% level.
Since we are interested in the effect of attrition on sample representativeness, Table 6 examines their relationship. Our classification is motivated by concern about unintended and unexamined effects of longitudinal exclusion patterns in previous literature. About a quarter of our sample is represented by people who died before Wave 11 (column 1). Subsamples retained for fixed effects modeling, common in the literature, invariably discard person–wave observations due to selective mortality attrition. Mortality selection associated with D status might also lead to misleading inferences concerning the trajectory of outcomes as we show later. Column 2 of Table 6 is limited to valid survey observations across all 11 waves. Unfortunately, using column 2 sampling rule would discard half of the baseline sample. This substantial attrition is attributable to a combination of two factors: (a) exits due to death selectively increase with age and (b) the substantial, 20-year, follow-up period. Columns 3 and 4 identify two subgroups of survivors affected by attrition using similar but less restrictive exclusion rules applied by Charles (2003), Meyer and Mok (2013), and Schimmel and Stapleton (2012). The more restrictive (column 3) applies to 21% of the baseline sample; the less restrictive (column 4) affects 6%. Not surprisingly, the strongest contrast is between column 1 (exited due to death) and column 2 (valid responses across all 11 waves). Columns 3 and 4 generally fall in between. Importantly, we find major differences between the deceased and survivors by receipt of SSI/DI, our disability classification, and work-limited status at baseline. These results suggest the potential for attrition bias depending on the operational definitions and econometric design.
Classification of Sample Disposition Across 11 Waves Overall and Selected Baseline Characteristics by Classification Status.

Note. Data are from HRS. All statistics are weighted using Wave 1 HRS weights. Subsamples are mutually exclusive and exhausting. HRS = Health and Retirement Study; SSI = Supplemental Security Income; DI = Disability Insurance.
aExited due to death at one of the follow-up waves (from Wave 2 to Wave 11).
bSurvivor (alive respondent) with 11 valid wave observations—no exit.
cSurvivor with 3–10 valid wave information (1–8 waves missing). This category includes all survivors with at least one string of three consecutive waves with an interview status of “respondent alive” combined with at least one wave missing for other reasons (i.e., interview status is “non-respondent alive” or “in an institution” or “dropped from the sample”).
dSurvivor with 1–2 valid wave information (9–10 waves missing). This category includes all survivors who have at least one missing for other reason (i.e., interview status is “nonrespondent alive” or “in an institution” or “dropped from the sample”) and no string of at least three consecutive waves with an interview status of “respondent alive.”
**Denote that the difference between estimates in columns (2) versus columns (1) or (3) or (4) are statistically significant at 1% level.
Table 7 describes the disposition of the baseline sample across subsequent waves using seven categories. The categories nonrespondent and dropped imply unobserved disability/survival status; the other five categories reflect disability status (ND, PD, and D), institutionalization, and death. Institutionalization is typically associated with adverse health/disability dynamics; death is an adverse outcome often (not always) resulting from prior disablement. Thus we create a concept of adverse outcomes by combining three states: D, in institution, and deceased. The rows provide (a) overall results for the full baseline sample (first row of each Waves 2–11 subsection) and (b) disaggregated results by baseline disability status.
Status at Each Wave (2–11) Conditional on Wave 1 Disability Status (%).

Note. The sample consists of all respondents in Wave 1 who were born between 1931 and 1941. Estimates are weighted using Wave 1 weights. “Adverse outcome” category is the sum of columns (3) to (5).
There is a wording difference between Wave 1 and 2–11 that causes some noncomparability. The Wave 1 interview probes for “any difficulty” with ADLs/IADLs, while Waves 2–11 ask about “some difficulties.” The result is that percentage of D substantially drops between Waves 1 and 2; percentage of ND increases. This results from the wording change and not from improvement in true disability status. 4
First, we discuss the overall Table 7 results. Percentage of D (column 3, overall rows) is essentially flat across the waves. In contrast, proportions in institution and dead dramatically increase, with death dominating the combined trend. Consequently, all three adverse outcomes combined show a strong upward trajectory in contrast to the flat trajectory of D alone. Next, we review trajectories conditional on baseline disability status. Interestingly, column 3 shows a strong downward trajectory of the percentage classified as D over time, conditional on being D at baseline, from 34% in Waves 2 to 14.9% in Wave 11. It might be tempting, but incorrect, to revert to the notion of regression to the mean in interpreting this downward trend. The reason is that there is a very strong differential pattern of transition to the absorbing state of death among D and ND. Baseline D status is strongly associated with Wave 11 adverse outcomes combined: D, in institution, and dead.
Figure 2 shows the Waves 2–11 trend in “D” and “D or deceased combined” conditional on D status at baseline. The seeming lack of deterioration in disability status coincides with selective mortality associated with prior disability status. Considering the dynamics of the competing risks of further disablement and death, the overall trend is adverse. This is an important finding, because it suggests that simply conditioning away death exits can provide a misleading picture of the dynamics. Hence, in studies that condition on respondent status, results could be problematic if the analysis sample selectively discards two unexamined adverse exit reasons: death and institutionalization. Both might reflect rapid acceleration of unobserved true disablement between the last wave with complete survey information and the subsequent wave.
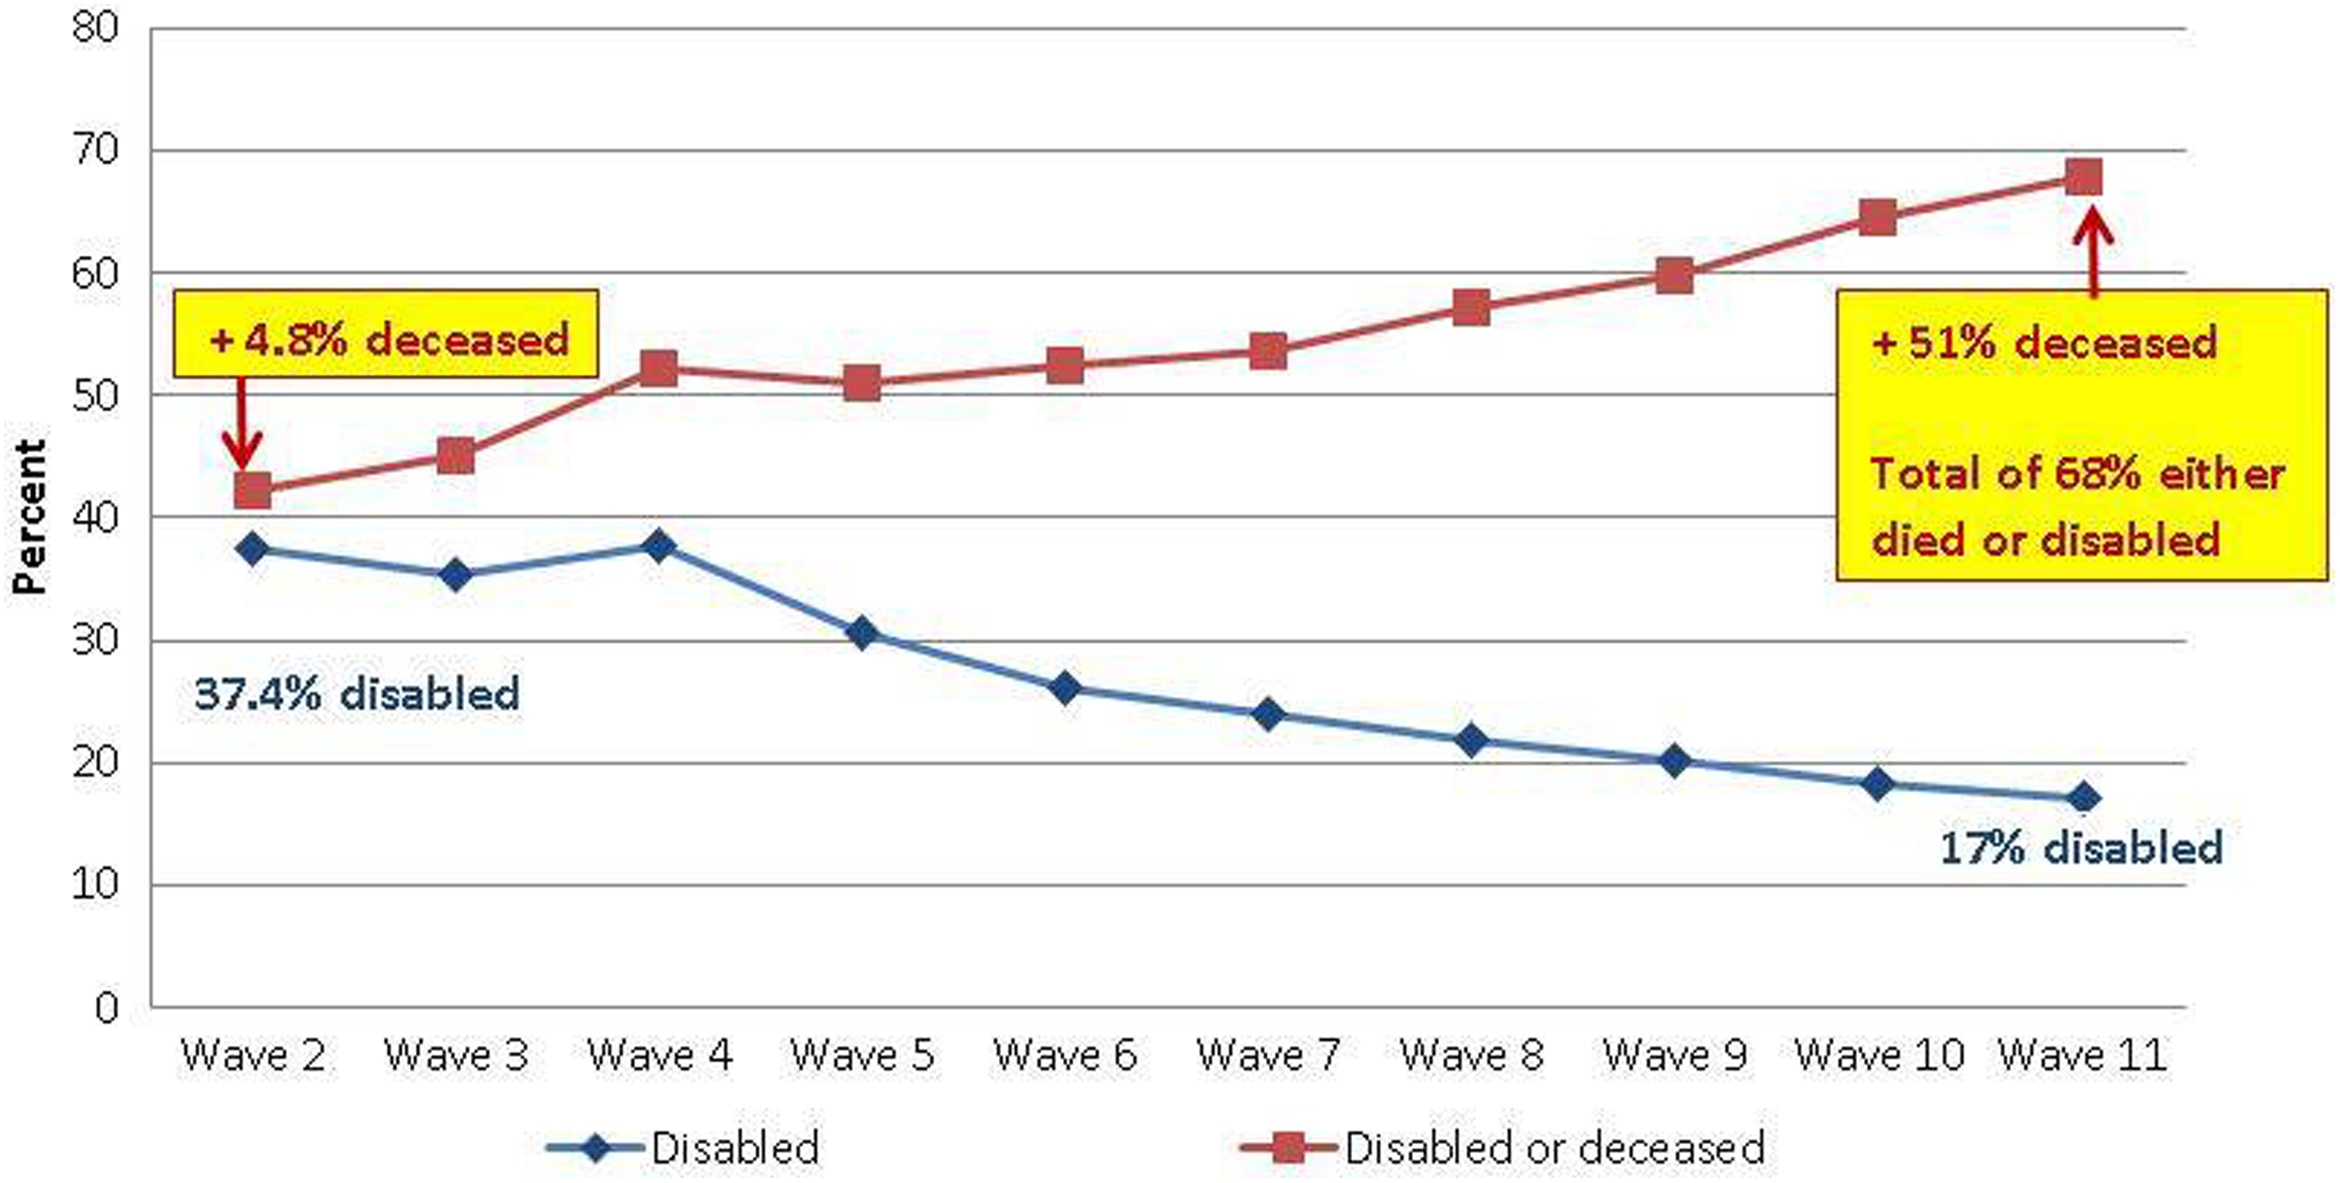
Cumulative percentage disabled or deceased among disabled (D) at baseline.
Table 8 provides a different perspective: first-order transitions across neighboring waves. It shows that our disability classification is a strong predictor of wave-to-wave dynamics as well. The table reveals that the predictive power of disability status is strong across all first-order transitions. The patterns also show the increasing importance of first-order transitions to death and institutionalization as we move toward more recent waves; especially conditional on D in the immediately preceding wave. These findings are invariant to differential nonresponse (column 6).
Status at Each Wave (3–11) Conditional on Previous (t − 1) Wave Disability Status (%).
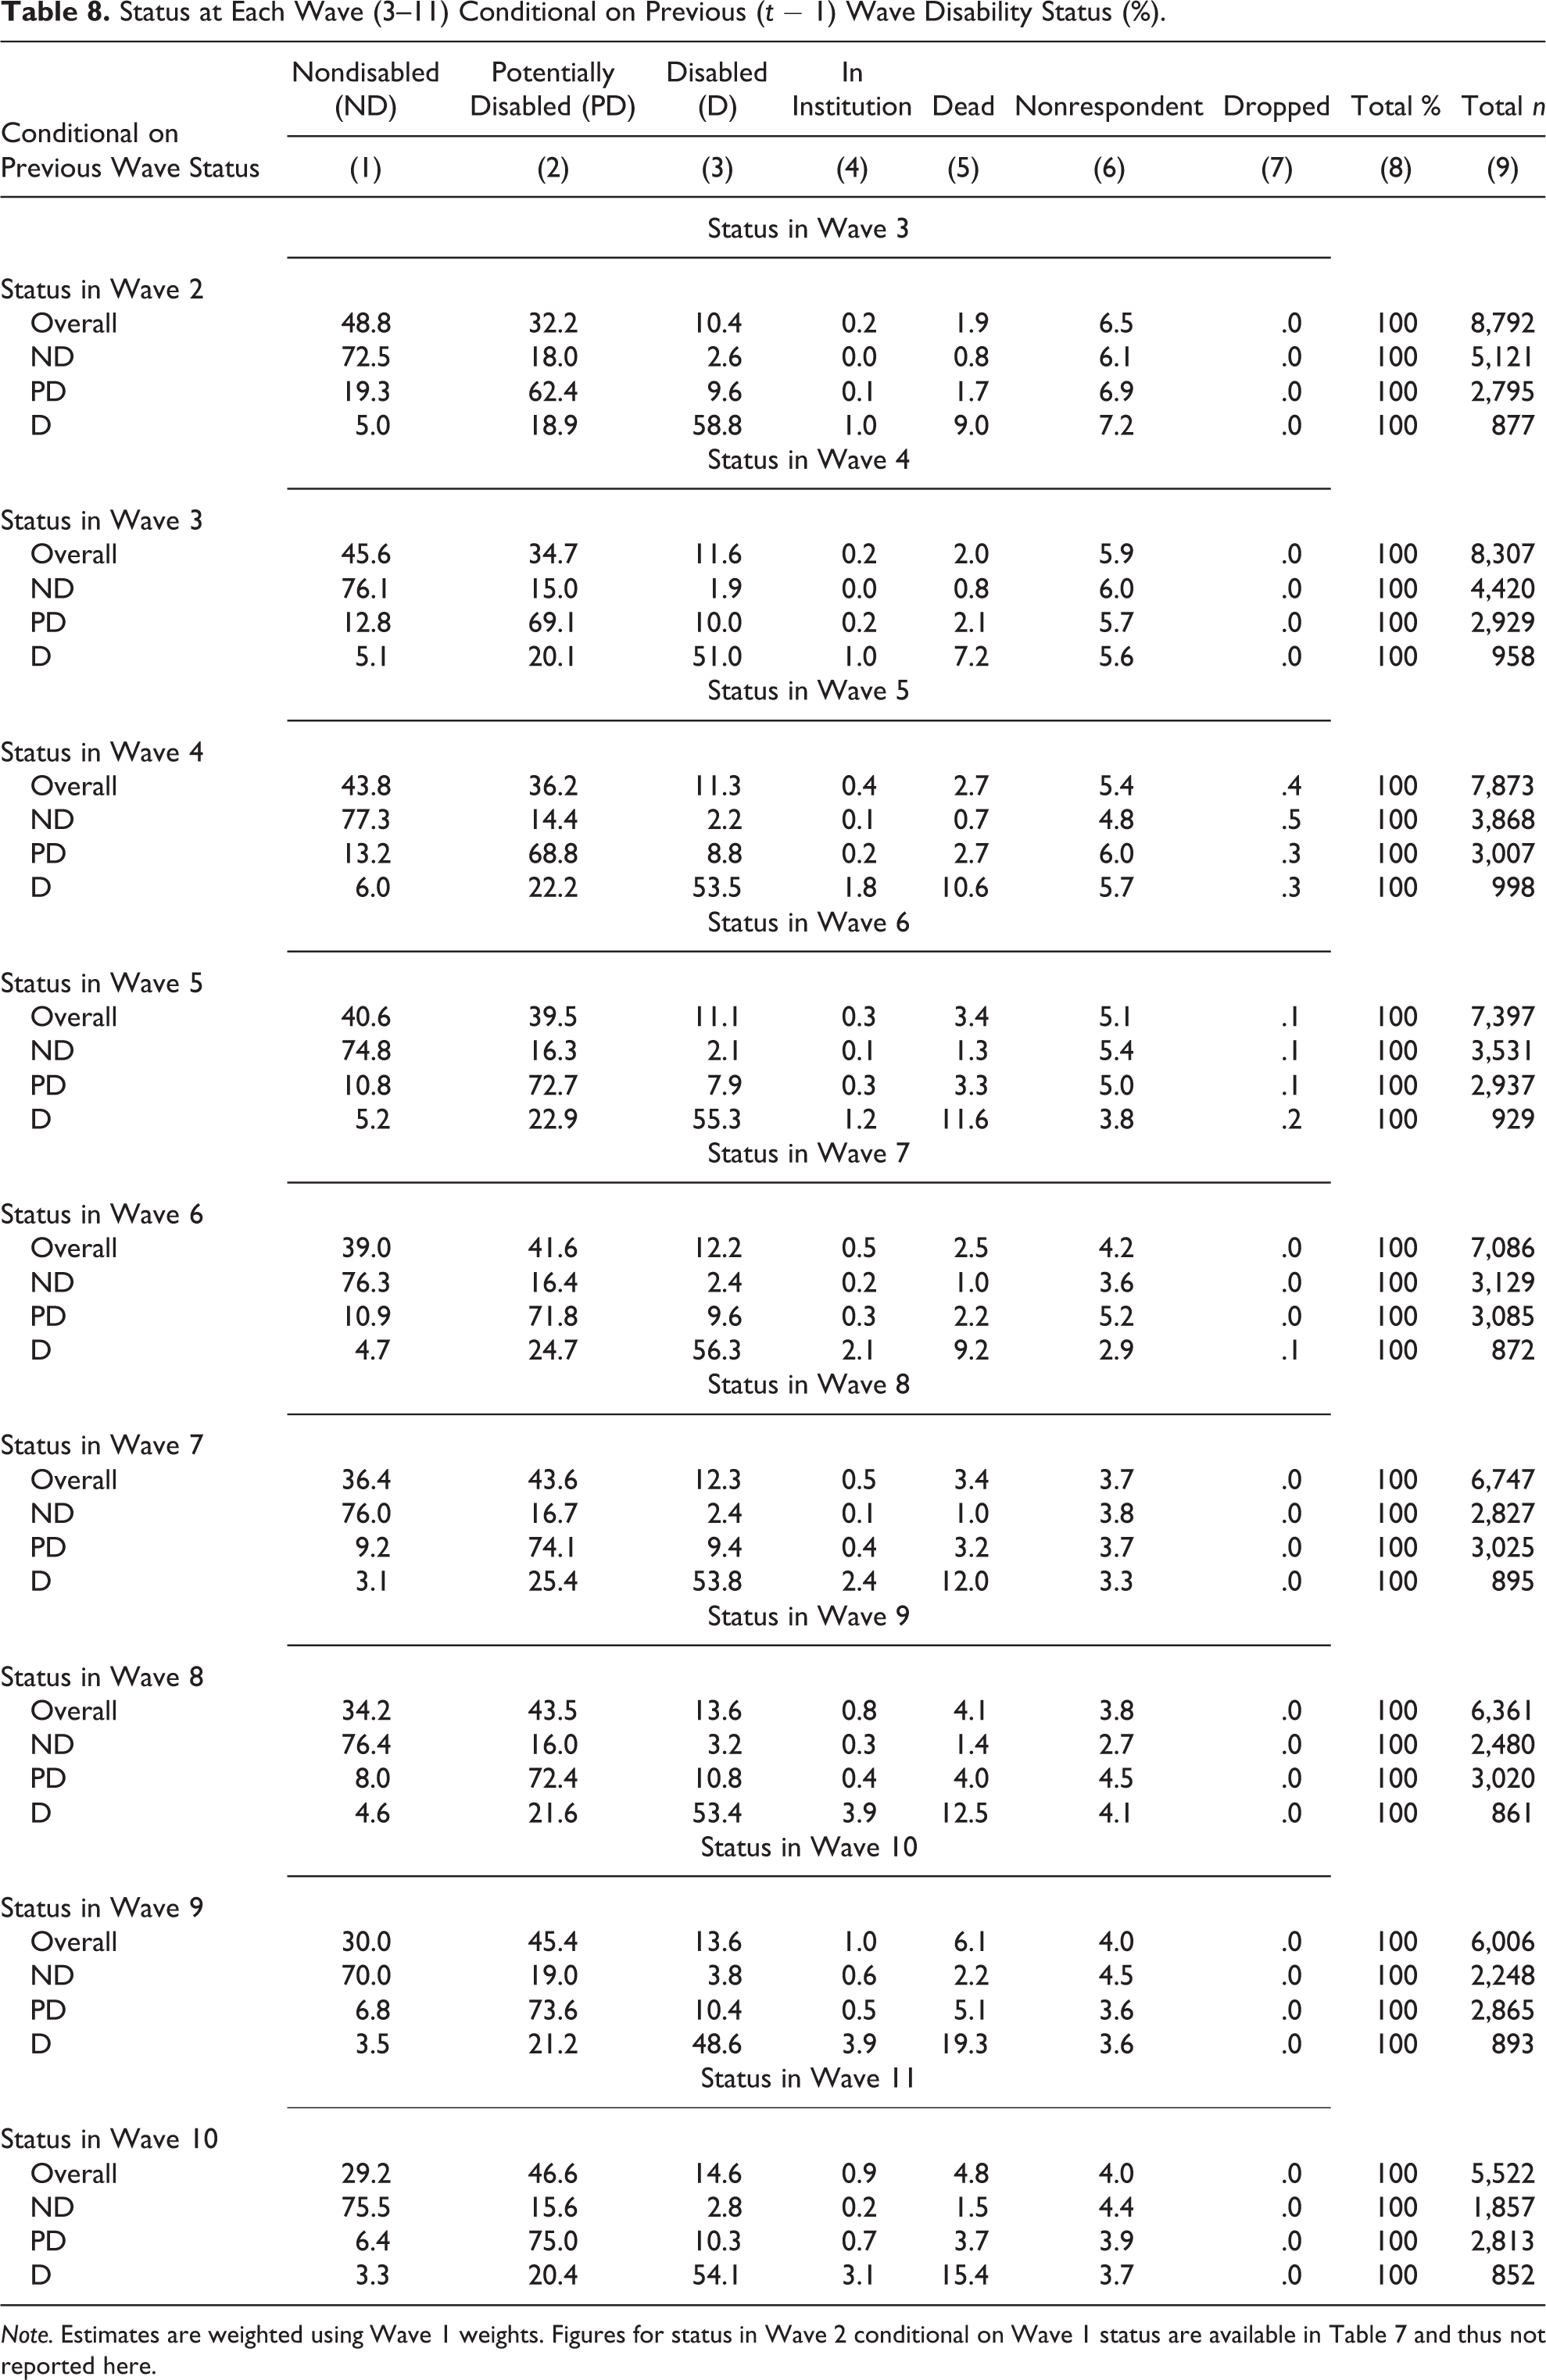
Note. Estimates are weighted using Wave 1 weights. Figures for status in Wave 2 conditional on Wave 1 status are available in Table 7 and thus not reported here.
Ignoring mortality by disability status might lead to problematic interpretations of trends in poverty. Supplemental Table 4 contains two panels: baseline ND and baseline D subsamples. The ND panel interpretation is straightforward. The trend is dominated by the cumulative effect of transitions to the absorbing state of death. Proportion poor is very small to start with and remains so.
In contrast, the D panel shows more complex trends. We observe decreased proportion in poverty through Wave 10, with an interesting uptick at Wave 11 (in both panels). The calculated poverty rate drops from 30% in Wave 2 to 14% in Wave 10. Before declaring the surprising good news for D, we need to look at trends in proportion dead and in institution. Despite the drop in proportion poor, the proportion in the three adverse states combined increases from 31% to 56%. Considering all adverse outcomes, the evidence suggests no improvement in poverty status among D or impoverishment among ND in the aggregate.
Discussion
This paper built on existing literature focusing on disablement among the working aged and the near elderly. We extended the analytic framework across the transition in the life cycle from near elderly to elderly. We find weaknesses in prior work arising from relying on single 0–1 measures of disability and ignoring selectivity, most importantly attrition due to death. Extending the framework of analysis to the elderly and a long follow-up period exacerbates concerns about relying on a single measure of disability, particularly work disability, and concerns arising from complex interactions between disablement and mortality. We develop a screening strategy of disability measurement to address these issues and fully account for transitions among disability states and exits due to death and institutionalization over time. Using independent double falsification tests, we confirm that our classification strategy is capable of capturing the work disabled subsample among the near elderly, without explicitly including a variable that is problematic for measuring disablement among the elderly. To our knowledge, this is the first HRS study fully accounting for the process of disablement and mortality outcomes among both the near elderly and the elderly from Wave 1 to Wave 11—spanning over 20 years—in a systematic way. As we address below, our paper is a helpful prelude to future work asking causal questions and using more complex modeling. It provides some essential foundations by creating a clean ND group that can serve as a counterfactual in these studies and describing the longitudinal selection processes that need to be considered in the design of such future work.
Conclusions
In this paper, we demonstrate the importance of considering heterogeneity, the multidimensional nature of disabilities, and the disablement process. We developed a classification scheme designed to reduce both screen-in and screen-out error and to account for a gray area of observations that cannot be confidently classified as D or ND. We demonstrated attractive screening properties of this new disability classification scheme. Findings reveal that selective attrition due to death is substantial across 11 HRS waves and that death as an outcome of disablement is important to account for. Furthermore, we demonstrate that mortality and distributional outcomes are affected by (a) baseline disability status, (b) prior wave disability status, and (c) current disability status.
Several research directions appear worth pursuing. Further study of the joint effect of socioeconomic status and disablement on mortality and distributional outcomes would be promising. People move from the near elderly to the elderly portion of the life cycle and face altered environments from the heavily conditioned safety nets during the working age years toward more universal safety nets in old age, and new challenges to the overall well-being and financial security emerge. These include increasing the need for assistive technologies and long-term care, especially among the D. The interaction of disablement and financial security during the years prior to death is an important unexplored area. A retrospective analysis of distributional outcomes in a manner analogous to the way health expenditures prior to death have been analyzed by Riley and Lubitz (2010) could be highly informative.
We laid some groundwork for the development of a net impact estimation methodology that might facilitate the complete accounting of the effects of disablement for all segments of the HRS cohorts across a long follow-up period. We believe that such a methodology is feasible using a series of pioneering papers by James Heckman and his associates since the mid-1980s as a point of departure (see Heckman and Robb (1983, 1986), Heckman et al (1987), Heckman and Smith (1999)). These methods have been largely applied to the evaluation of purposive programmatic interventions on highly self-selected target populations but appear particularly well suited for adoption cognizant of important differences between the processes of program participation and disablement. Our screening strategy allows for the creation of reasonably clean “treatment groups” of the D and uncontaminated ND counterfactual “comparison groups” so central to nonexperimental methods of causal analysis. The rich HRS wave-specific data might naturally facilitate an iterative strategy of estimating the effects of disablement on both financial security and deaths over 20+ years accounting for full baseline cohorts.
Footnotes
Authors’ Note
The findings and conclusions presented here are those of the authors and do not necessarily represent the view of the Social Security Administration. Any remaining errors are ours.
Acknowledgments
We would like to thank the editor and anonymous reviewers for their constructive comments. For thoughtful comments and suggestions the authors are indebted to Richard Chard, Paul Davies, Howard Iams, Ellen Meara, Chris Tamborini, and David Wittenburg. We would also like to thank the participants of the December 2014 conference on “Social Insurance and Lifecycle Events among Older Americans” in Washington DC.
Declaration of Conflicting Interests
The author(s) declared no potential conflicts of interest with respect to the research, authorship, and/or publication of this article.
Funding
The author(s) received no financial support for the research, authorship, and/or publication of this article.

Notes
References
Supplementary Material
Please find the following supplemental material available below.
For Open Access articles published under a Creative Commons License, all supplemental material carries the same license as the article it is associated with.
For non-Open Access articles published, all supplemental material carries a non-exclusive license, and permission requests for re-use of supplemental material or any part of supplemental material shall be sent directly to the copyright owner as specified in the copyright notice associated with the article.
