



Abstract
Age segregation adversely impacts health and wellbeing. Prior studies, although limited, report increasing age segregation of the US. However, these studies are dated, do not comprehensively examine the spatiotemporal patterns and the correlates of intergenerational segregation, or suffer from methodological limitations. To address these gaps, we assess the spatiotemporal patterns of age segregation between 1990 and 2010 using census-tract data to compute the dissimilarity index (D) at the national, state, and county levels. Results contradict previous findings, providing robust evidence of decreasing age segregation for most parts of the country and across geographical levels. We also examine factors explaining adult-older adult segregation across counties between 1990 and 2010. Higher levels of rurality indicated lower levels of adult-older adult segregation, but this association diminished over time. Percent of older adults and percent of population in group quarters were inversely related to adult-older adult segregation, contrary to results from previous decades.
Introduction
Segregation is a significant and frequent topic of social inquiry in the US and across the globe. It denotes the separation of population groups defined by different socio-demographic characteristics (such as race-ethnicity, income, age, gender, religion, etc.) that may take place in multiple socio-geographical spaces (e.g., residential, school, workplace, and entertainment) (Oka & Wong, 2019; Vanderbeck, 2007). The general concern about the consequences of segregation may be summarized by the notions of “separate and unequal.” When population groups are separated into different communities, neighborhoods, or regions with unequal access to resources and services for example, these disparities in neighborhood qualities may produce unequal outcomes in various aspects of their life. Minority populations in segregated neighborhoods often suffer from adverse outcomes (Collins & Margo, 2000; Li et al., 2013). Poorer education outcomes in racially segregated schools across communities have been a concern under the historically contested policy of school segregation in the US (e.g., Logan et al., 2012). Another often cited inequality due to racial-ethnic segregation in residential space is health outcomes where minorities in segregated neighborhoods often have poorer health outcomes than those in less segregated areas (e.g., Collins & Williams, 1999; Williams & Collins, 2001).
Although segregation can be defined by multiple socio-demographic characteristics, the emphasis in the literature has been on racial-ethnic residential segregation, that is, racial-ethnic groups separated into different residential neighborhoods (Oka & Wong, 2019; Vanderbeck, 2007). Consequently, empirical studies on age segregation in the US are scarce (Hagestad & Uhlenberg, 2005; Vanderbeck, 2007) although the topic has received some theoretical and conceptual attention (e.g., Uhlenberg & Gierveldm 2004; Hagestad & Uhlenberg, 2006; Vanderbeck, 2007). The graying of the US baby boomer cohorts is raising the proportion of older adults in the population to the highest levels (Lanzieri et al., 2011; Frey et al., 2010). With an ever-increasing number of US residents reaching the 65 and above age mark, Freedman and Stamp (2018) claimed that: “[T]he US Isn’t Just Getting Older. It’s Getting More Segregated by Age.” While this claim is supported by a recent study (Winkler, 2013), this assertion however remains largely under-studied. Consequently, the question that looms large is whether older adults and the non-elderly populations in the US are really becoming more segregated over time.
Prior empirical studies of US age segregation are either entirely dated (Cowgill, 1978; La Gory et al., 1980, 1981) or are limited to the urban setting (Cowgill, 1978; La Gory et al., 1980; 1981; Rogerson, 1998; Deng & Mao, 2018). Some of these studies and a few other are cross-sectional examinations with no discussion of changing age segregation over time (Rogerson, 1998; Moorman et al., 2016; Deng & Mao, 2018). Winkler (2013) analyzed changing patterns of age segregation across the US but it has serious methodological concerns and therefore, the reliability of its results is questionable. In addition, it did not identify the contextual factors affecting levels of age segregation over time. Our study therefore has two main objectives: first, we will verify whether the US population is becoming more segregated by age. Considering the three age groups of youth, adult, and older adults, we will assess the US age segregation levels between 1990 and 2010 at multiple geographical levels (national, state, and county).
Also, changes in age segregation over time typically vary geographically and across different population groups. As part of our second objective, we hypothesize that urbanity-rurality is a significant factor correlated with age segregation. Although prior studies have examined many potential factors affecting age segregation, the role of urbanity-rurality has not been assessed explicitly and thoroughly mainly due to a geographic focus on metropolitan areas in these studies.
Although our study encompasses age segregation between multiple age groups, the emphasis will however be on older adults. This focus is based on findings from prior literature demonstrating that a segregated environment and/or social isolation has detrimental impacts on the physical and mental wellbeing of older adults (Hagestad & Uhlenberg, 2005, 2006). In the next section, we elaborate the limitations of existing studies in further detail and, in connection, establish the motivation and conceptual framework of our analysis.
How much do we know about age segregation?
Age segregation may take different forms that may occur simultaneously at multiple geographical levels. At the individual level, lack of intergenerational interactions, both familial and extra-familial, is a form of age-based segregation of individuals that may be socially isolating, especially for older adults (Hagestad & Uhlenberg, 2006; Portacolone & Halpern, 2016). At the aggregate level, when populations are age-segregated into various socio-geographical spaces (such as residential, school, and workplace), unequal experiences derived from these different settings may influence various outcomes including health and wellbeing, particularly of older adults (Robert & Li, 2001; Uhlenberg & De Jong Gierveld, 2004; Vanderbeck, 2007; Williams & Collins, 2001; Williams et al., 2010). The focus of our study is variations at the aggregate-ecological level, specifically assessing the separation of age groups based on their residential locations (census tracts), summarized at the state and county levels.
One of the earliest empirical studies by Cowgill (1978) focused on the metropolitan US. Dividing the population into 65 and over and under 65 in age, Cowgill compared the values of dissimilarity index D of metropolitan areas in 1970. The index is for two-group comparison, and is defined as

Cowgill (1978) studied the period of 1940–1970 using tract-level decennial census data. An increasing trend in D was reported, but the greatest increases were found in the fastest-growing metropolitan areas and during the period of fast urban expansion in the 1950s. Cowgill noted that part of the increasing segregation was attributable to the use of metropolitan boundaries in 1970 as opposed to city boundaries in each previous decennial year. Additionally, Cowgill attributed high segregation of some areas to high proportions of older adults and the large presence of institutions including military bases and older-adult facilities.
Similar to Cowgill (1978), La Gory et al. (1980) used 1970 census-tract data for 70 standard metropolitan statistical areas (SMSAs) and computed the dissimilarity index D values for these SMSAs. La Gory et al. explain the geographical variation in age segregation in 1970 using covariates derived from 1960 data. The covariates were population changes, including suburbanization as two major factors affecting segregation of older adults. In a subsequent study, La Gory et al. (1981) examined where older adults resided and concluded that in the older rustbelt cities, this group tended to live closer to the central business district (CBD) in older and smaller houses partly due to declining housing needs with aging and consequent changes in the family-life cycle. But in the newer sunbelt cities with greater housing choices, older adults tended to be less concentrated around the city centers.
The next empirical study by Rogerson (1998) conducted an analysis of age and racial segregation focusing on the Whites (W) and African Americans (AA) with each of the two racial groups subdivided into two age groups, elderly versus non-elderly. Rogerson computed the dissimilarity index D to compare four pairs of subgroups (AA elderly vs. AA non-elderly; W elderly vs. W non-elderly; AA elderly vs. W elderly; AA vs. W). Results showed that African Americans had higher age segregation than Whites. However, this study focused on only 15 metropolitan areas in a single year—1990, failing to evaluate the geographical variations of age segregation across the US and over time. In addition, the study did not explore factors related to the geographical variations of age segregation.
Winkler (2013) examined to what extent two population groups—60 years and over and younger adults (20–34 years)—resided in the same neighborhoods and the changes over the two decades from 1990 to 2010 using the dissimilarity index D. Treating states as subunits, a finding of this study was that the D-index for the entire US declined slightly from 1990 to 2010. Winkler also computed the D values for the following geographical levels: for states using counties as subunits, for counties using county sub-divisions as subunits, and for county sub-divisions using census blocks as subunits. Means of D values for all these geographical regions (states, counties, and county sub-divisions) exhibited slight increasing trends over the two decades.
The trend of increasing age segregation reported in Winkler (2013) is consistent with findings in studies completed decades ago (Cowgill, 1978; La Gory et al., 1980, 1981) and with the subsequent sounding of alarm on rising age segregation in the US (Freedman & Stamp, 2018). However, Winkler’s results cannot be regarded as evidence affirming the increasing trends reported previously. Winkler reported average D values computed for different geographical levels (nation, state, county, and county sub-division) but for each geographical level, she used subunits of different sizes (from states, counties, county sub-divisions, and census blocks). Studies about the scale-sensitivity of segregation measures have shown that segregation levels reported using the dissimilarity index D and other segregation measures will be higher when using smaller subunits (e.g., census blocks) than using larger subunits (e.g., counties) (Wong, 1997; Wong et al., 1999). The finding of increasing age segregation in Winkler may therefore have been an artifact resulting from the use of successively smaller subunits along the hierarchy of geographic levels (nation to county sub-division) for which average D values were examined. Further, the conclusion of higher age segregation was synthesized from examinations of the D-index computed for regions at multiple geographic levels. However, D values for larger regions (e.g., states) are likely to be higher than those for smaller ones (e.g., county sub-divisions) (Krupka, 2007). To summarize, D values computed for regions at different geographic levels (nation to county sub-divisions) using subunits of different sizes are not comparable. The direction of change in age segregation in the US over the past two decades therefore remains unclear.
Recognizing that national averages depict the general levels of age segregation of the US but mask the spatial variation across the country, Winker (2013) used blocks as subunits to compute the D-index and examined spatial variation of age segregation across counties. But this examination of spatial variation was conducted only for 2010 which thereby failed to ascertain the direction of changes in US age segregation over time. Another methodological concern in Winkler’s study is the use of 60 years as the cut-off age to define older adults. This age is not consistent with the existing convention in the literature to define older adults (Das Gupta & Wong, 2020). In addition, the study considered only a subgroup of the younger adults (20- to 34-year-olds), excluding a large proportion of adults, children, and youth populations in assessing age segregation. Lastly, Winkler’s study used census block, the smallest census tabulation unit. However, data at the block level are subject to disclosure requirements such that small population counts can be suppressed and turned into zeros, potentially inflating segregation levels reported by the D-index (US Census, 2018).
In summary, the limited number of empirical studies of age segregation is deficient in different aspects. While findings in Cowgill (1978) and La Gory et al. (1980, 1981) are dated, subsequent studies reporting results for more recent decades are cross-sectional without assessing changes over time and/or are limited in geographical scope (Rogerson, 1998; Moorman et al., 2016; Deng & Mao, 2018). Winkler (2013) could have provided the spatiotemporal patterns of age segregation in the US, but it suffers from multiple methodological issues, rendering study results unreliable. To address these gaps, the primary research question of our study is, to what degree do populations in different age groups share the same areas (communities) across the US and how has this intergenerational dynamic changed in the past several decades? This aim will be addressed in the first part of our study.
Distinct from the early age segregation studies published before the 1990s, the more recent studies we reviewed above share a common deficiency: these studies did not explore factors affecting the geographical variations of age segregation or the changes of age segregation over the past two decades. Studies prior to the 1990s identified some factors affecting age segregation based on the demographic and urban dynamics at that time. Whether these factors were still relevant for the recent two decades is not known. Age segregation involves multiple age groups and segregation for different age groups may be affected by different sets of conditions. Instead of exploring factors affecting each and all age groups, the second part of our study will focus on the older adults. The beginning of our study period (1990) corresponds to the time when parents of the baby boomers started entering their retirement stage. These older-adult cohorts deserve focused attention in terms of their intergenerational relations (Rogerson, 1998). After examining to what extent these older-adult cohorts were spatially separated from the other age groups in the first part of our study, we then explore factors affecting the segregation of these older adults and the changing levels of these relations in the second part. More specifically, we test the hypothesis that older adult segregation of a region may be affected by the urban/rural setting of that region.
Research Design
Data used in this study are based on the US decennial census data for the years: 1990, 2000, and 2010. We use census tracts as the subunits of analysis in our study partly because tracts are regarded as the census enumeration units most similar to the sizes of communities or neighborhoods (US Census, 1994). Furthermore, compared to the various census enumeration units, tract boundaries are relatively stable with minimal change over the census years and therefore appropriate for temporal and longitudinal analysis. Given that in our study we compare and contrast trends over the two decades between 1990 and 2010, using the relatively more stable boundary system of tracts is warranted in order to avoid erroneous interpretation of boundary changes as population changes.
Although marginal, since census-tract boundaries did change between the 1990 and 2010 census, we did not use the original census-tract level data provided in the US Census Bureau Summary File 1 (SF1). Instead, we obtained these census data from the National Historical Geographic Information System (NHGIS) (Manson et al., 2021). The NHGIS provides US Census population estimates in a time series after harmonization based on the geography of one census year. For the three census years, we used the population estimates provided by NHGIS based on the 2010 census-tract boundaries. For each census tract, we obtained the estimated counts by the standard age groups for the three census years and for all 50 states plus Washington, DC. We then aggregated these population estimates into the three conventional age categories of youth (0–14), adult (15–64), and older adult (65 and over). These three age categories are compatible with the conventional definition of the dependency ratio applied in the field of demography and population research (Jahan et al., 2014; Lau & Tsui, 2017; Sanderson & Scherbov, 2015; Das Gupta & Wong, 2020). Data for the additional variables we considered in our study also come from NHGIS. The degrees of rurality by counties are provided by the US Census Bureau (US Census, 2019).
In traditional segregation studies, groups are compared using segregation measures. The applicability of the index of dissimilarity D as a segregation measure has been scrutinized and established in the literature and is used in most previous studies of age segregation (Cowgill, 1978; La Gory et al., 1980, 1981; Rogerson, 1998; Winkler, 2013). We therefore used the dissimilarity index D as the measure of age segregation with each of the three age categories serving as a population group (equation (1) we presented earlier). As the D-index is a two-group segregation measure, all previous studies we reviewed divided the populations into only two age groups (Cowgill, 1978; La Gory et al., 1980; 1981; Rogerson, 1998; Winkler, 2013). Instead, we computed the D-index for three pairs of comparisons: youth versus adult (YA), adult versus older adult (AO), and youth versus older adult (YO).
To address our first study objective, we used tract-level data to compute the D-index values at the national, state, and county levels for the three census years. The county-level computation was to identify the intra-state variations that remain masked by the state-level values (Winkler, 2013). Statistical graphics summarizing the distributions of age segregation over the 3 years may reveal the temporal changes over the two decades. We also used the resultant D-index values for each state
To address our second study objective, we conducted a regression analysis to examine older adult segregation. Since demographic compositions and subgroup locations may vary widely within states (Winkler, 2013), counties provide the suitable granular geographical context for this analysis. Prior studies have presented specific variables that are significant in explaining older adult segregation. These factors include whether the area is urban or rural (Besel & Andreescu, 2013; Buckwalter & Davis, 2011; Caldwell et al., 2016; Hofferth & Iceland, 1998; National Academies of Sciences, Engineering, and Medicine (NAS), 2018; White & Guest, 2003), the proportion of older adults in the population, and the proportion of institutional populations (Cowgill, 1978; La Gory et al., 1980, 1981). Accordingly, we selected the proportion of population 65 and older, proportion of population in group quarters, and level of rurality of a county (% of population) to inspect relations with older adult segregation. We examined both the cross-sectional relations for each of the three census years as well as pooled the data for these years to examine changes in relations over the study period of 1990–2010.
Results
Trends in spatial pattern of intergenerational segregation over time
Using the tract-level population estimates, we computed the D-index for the entire country for the three comparisons, which reveal varying degrees of segregation between different age groups (Figure 1(a)). Youth-adult (YA) segregation has been the lowest among the three comparisons and youth-older adult (YO) segregation has been the highest. Figure 1(a) also shows that age segregation has been declining except for YA segregation, which declined initially but rose back up in the second decade. These results are contrary to the increasing trends reported in a previous study. Whether this national-level picture was shared across the country at the subnational-level is what we examined next. (a) Dissimilarity index, D, values of age segregation for the entire US, based on census-tract population counts, 1990, 2000, and 2010. (b) Distributions of D across states based on census-tract population counts, 1990, 2000, and 2010. Youth-adult (YA); adult-older adult (AO); youth-older adult (YO).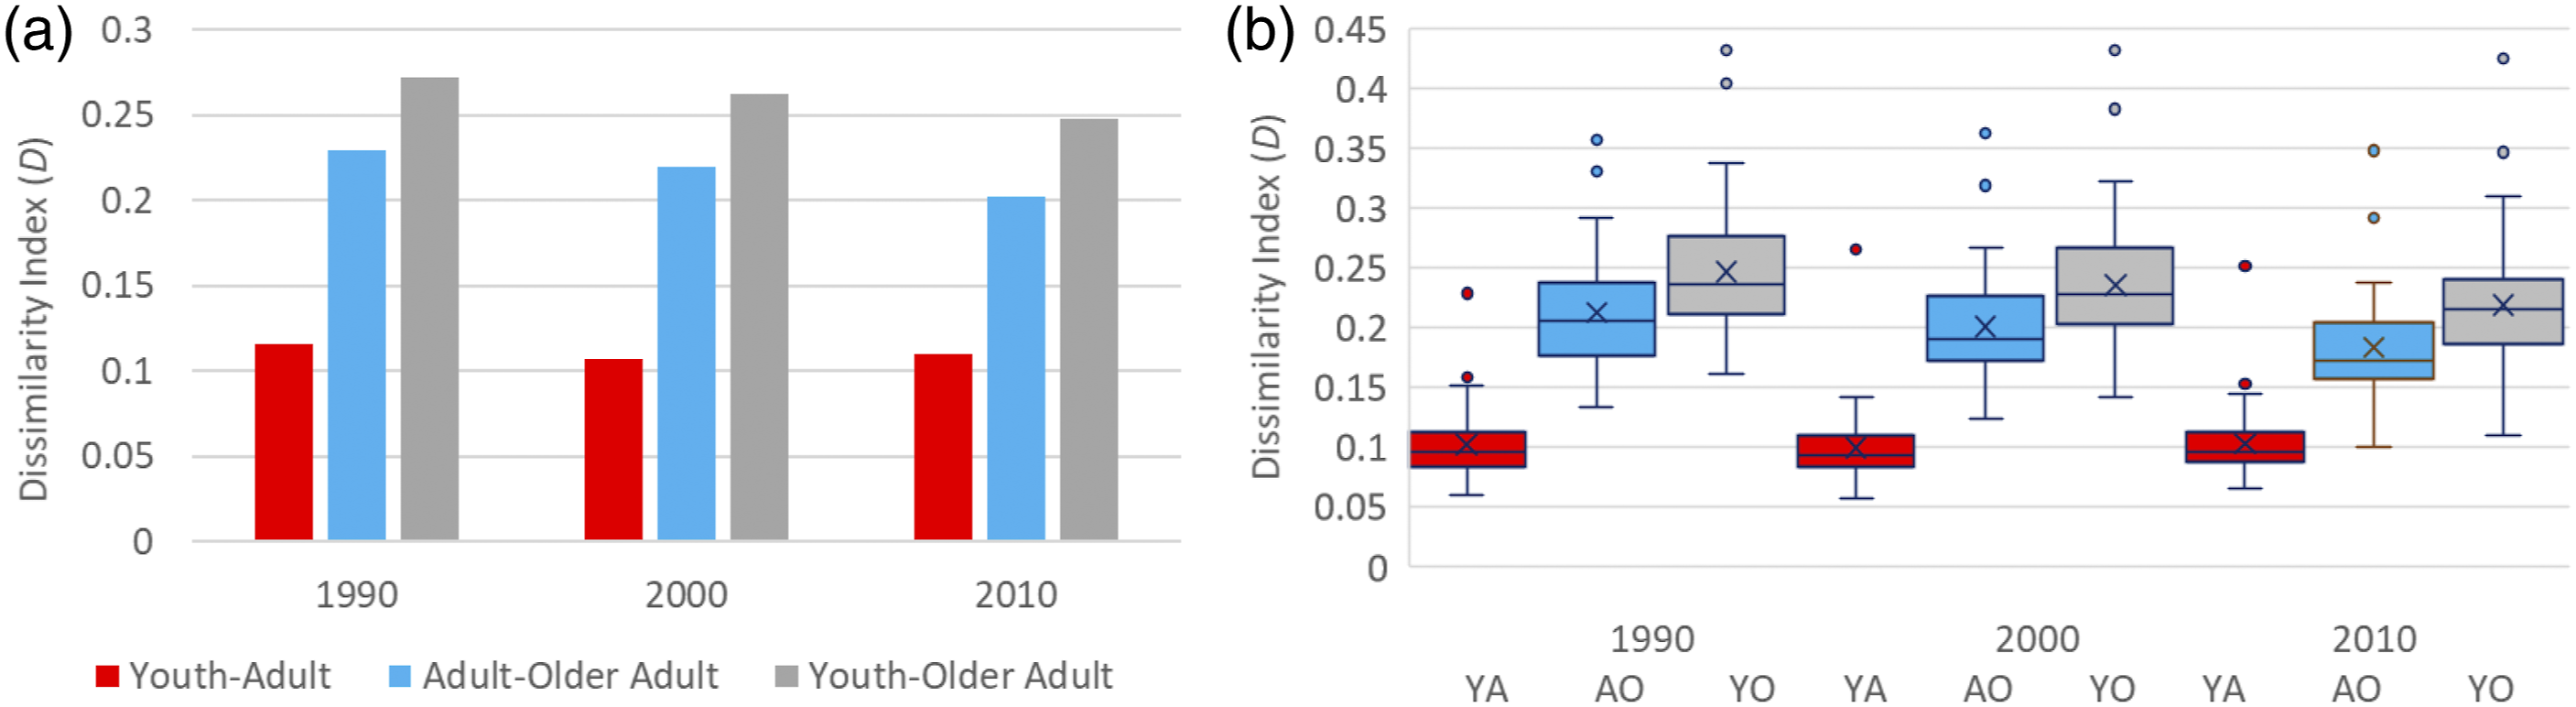
We computed the D-index for each state in each year using tract-level data. The state-level analysis (Figure 1(b)) provides a picture similar to that of the national level. State averages of YA segregation were the lowest in all 3 years, followed by AO and YO segregations. While average segregation levels of all states involving older adults (AO and YO) declined over the two decades, YA segregation declined in the first decade but increased in the second, despite changes being marginal. Washington, DC recorded the highest youth-adult segregation in all years.
Figure 2 visualizes the changing segregation levels from another perspective. In each panel, states are sorted from the lowest to the highest according to their segregation levels in 1990. If segregation in both the subsequent years declined across all states, the lines for 2000 and 2010 would remain below that for 1990. For YA segregation (Figure 2: top panel), many states experienced small increases while states with higher segregation levels (depicted on the right) underwent slight decline over time. In contrast, for AO (Figure 2: middle panel) and YO (Figure 2: bottom panel) segregations, most states declined over the two decades with some exceptions. Thus, trends of YA segregation were not clear over the two decades, but levels of AO and YO segregations had declined for most states. Changing age segregation (D): 1990–2010. Note: Youth-adult (Y-A); adult-older adult (A-O); youth-older adult (Y-O).
To further facilitate the spatiotemporal analysis of segregation patterns, we used the same sets of class break values and colors to map the D values across all three segregation types and 3 years to assist visual comparisons of states (Figure 3). Consistent with the results we presented earlier, YA segregation was the lowest across the country and over time when compared to the segregation levels involving older adults. Over time, YA segregation of most states converged to moderately low levels (lighter blue tone on the maps). AO segregation levels in Figure 3 (middle panel) indicate moderate-to-high segregation for most parts of the country in 1990. While Arizona and Florida had the highest segregation levels, over time, most states, including Florida, experienced decline in AO segregation. States with relatively higher levels of YO segregation (Figure 3: bottom panel) were concentrated in the southwest and states in eastern US, except Florida, had relatively low levels. Despite several western states and Florida featuring consistently high levels, YO segregation also declined over time across the states. Segregation levels for three-group comparisons in three census years (1990–2010) by states. Note: Same class break values and colors are used across all maps.
To analyze substate-level patterns, we computed segregation index for each county in the three census years for the three pairs of comparison. Results are shown in Figures 4 and 5. The county averages of the three comparisons across 3 years were similar to the state-level results, but the distribution of age segregation across counties had many outliers on the high side (Figure 4). Geographically, most part of the US had low levels of YA segregation over the 3 years (Figure 5) with southwest as the only region with a high concentration of moderate age segregation counties. Over the years, increasing numbers of moderate-to-high level counties remained scattered across the country, providing strong evidence that hardly any state had a relatively uniform segregation level within. Changing age segregation in the US: Distributions of D across counties. Segregation levels for three-group comparisons in three census years (1990–2010) by counties. Note: Same class break values and colors are used across all maps.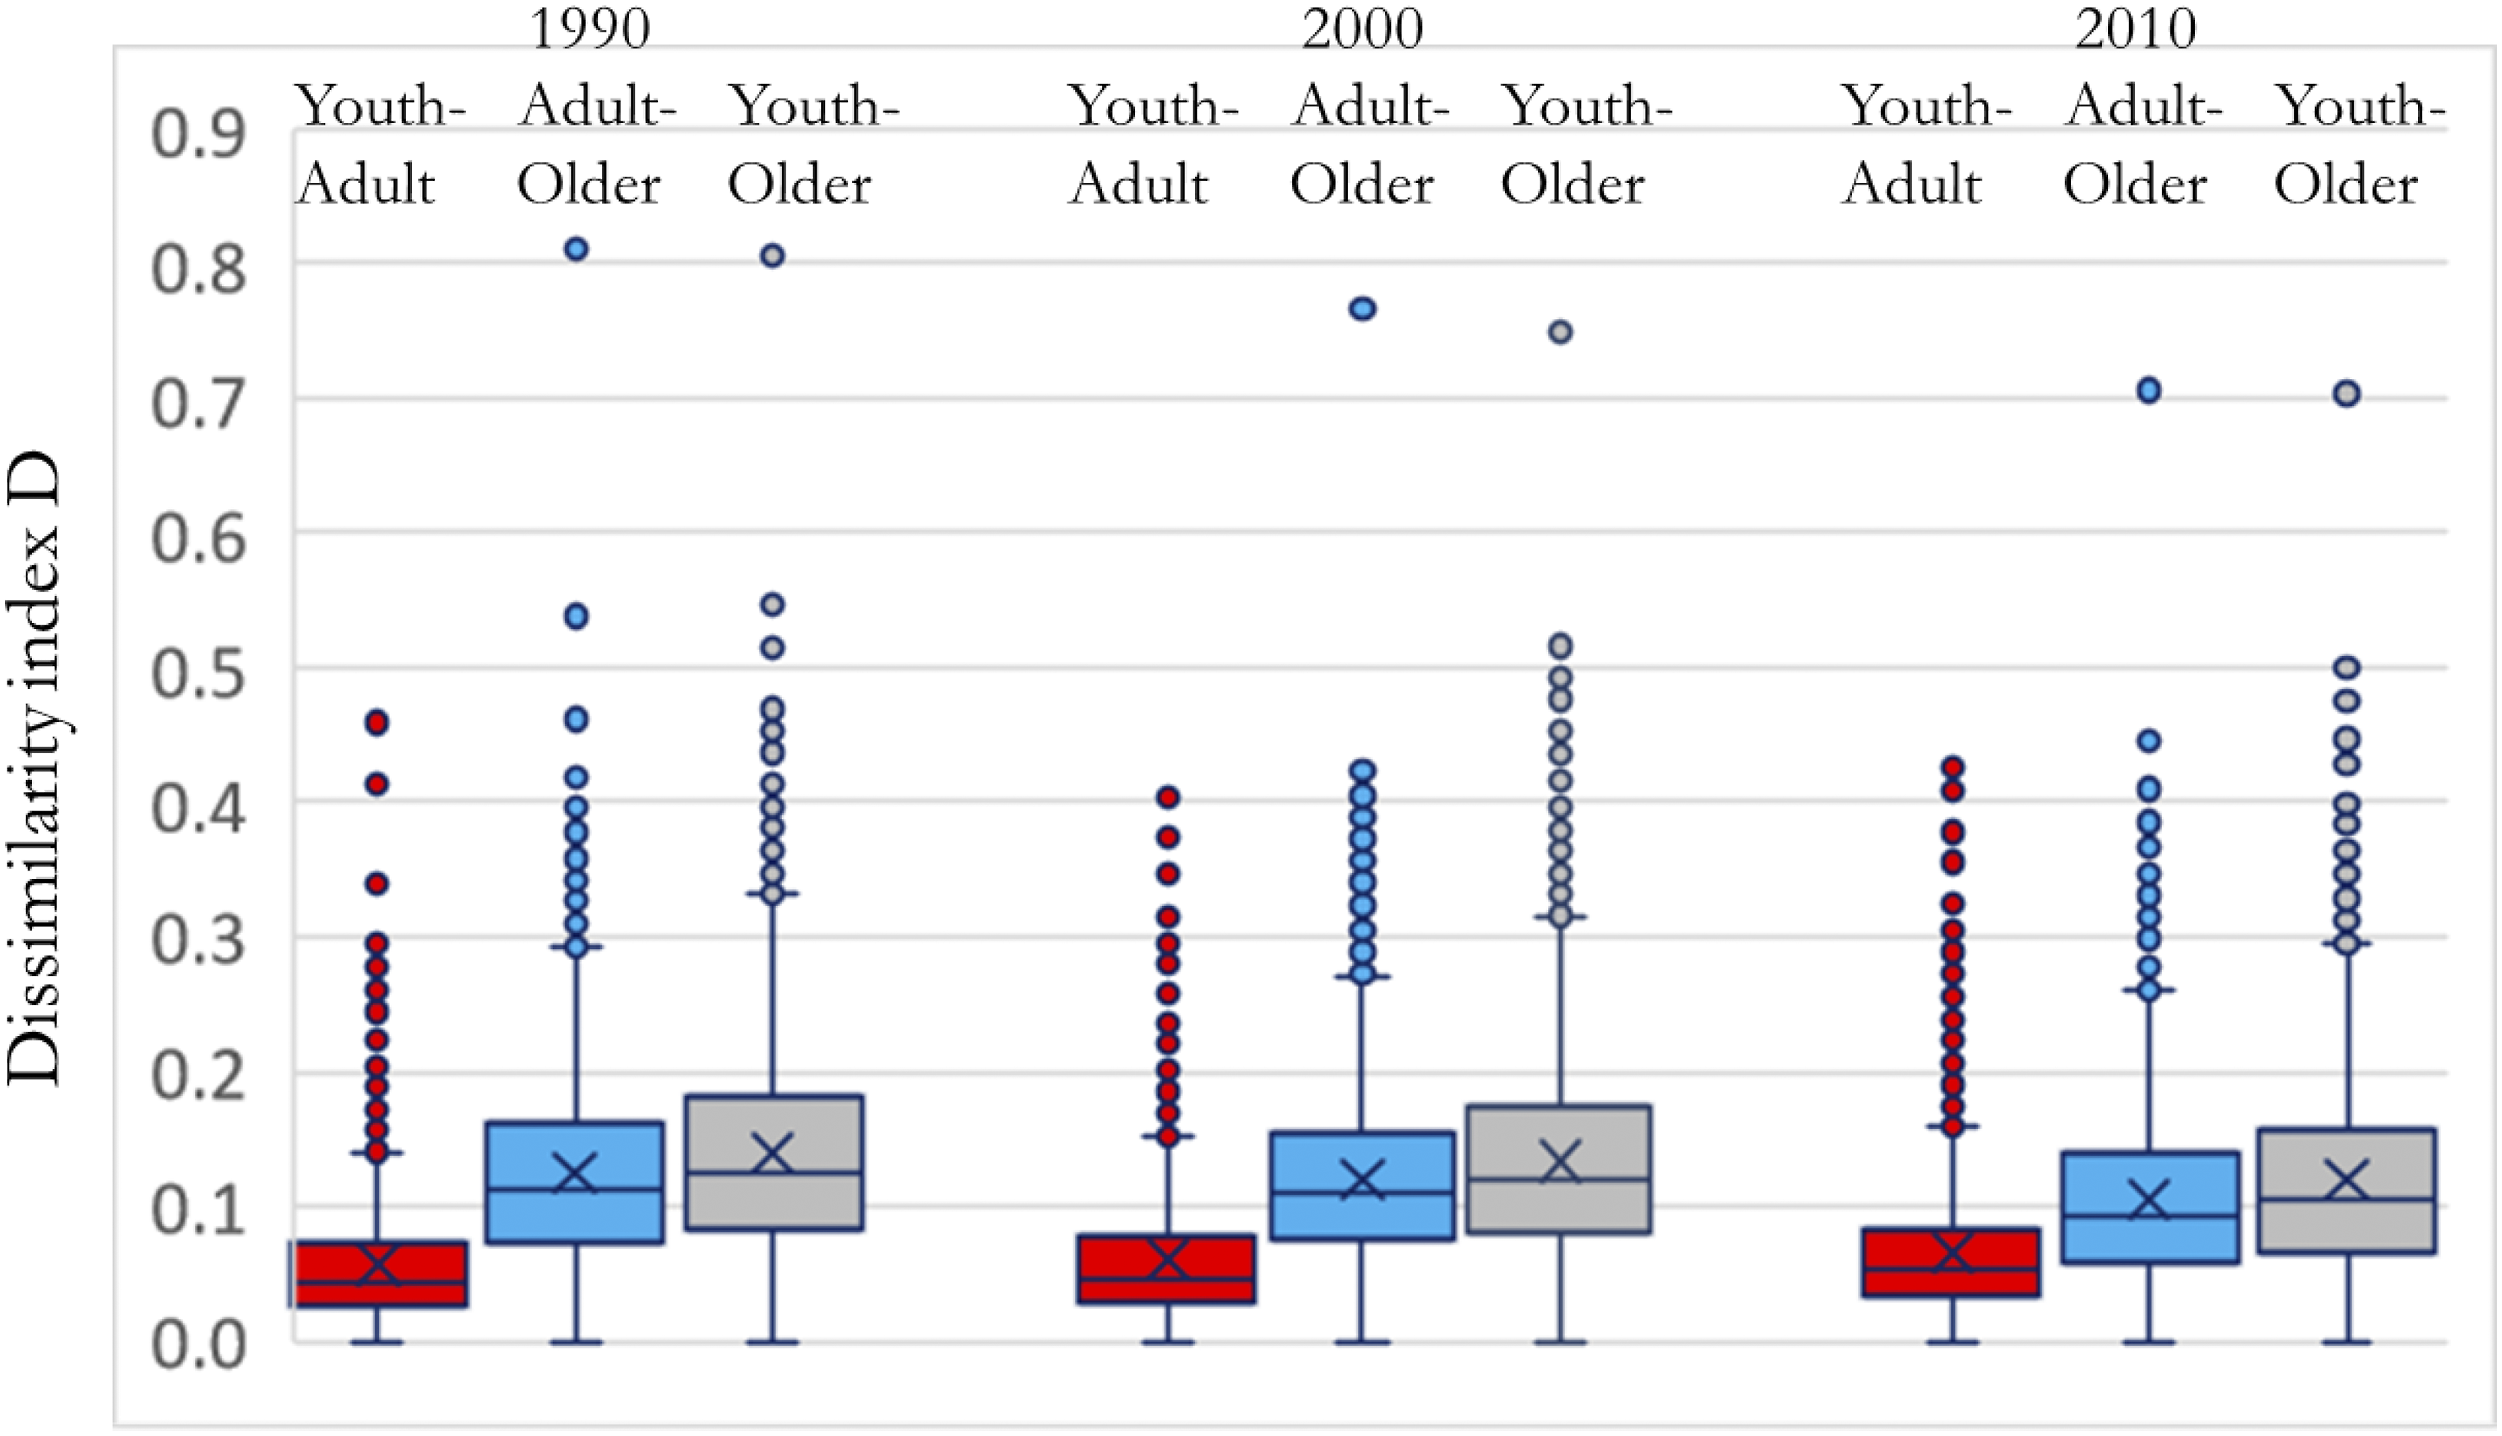
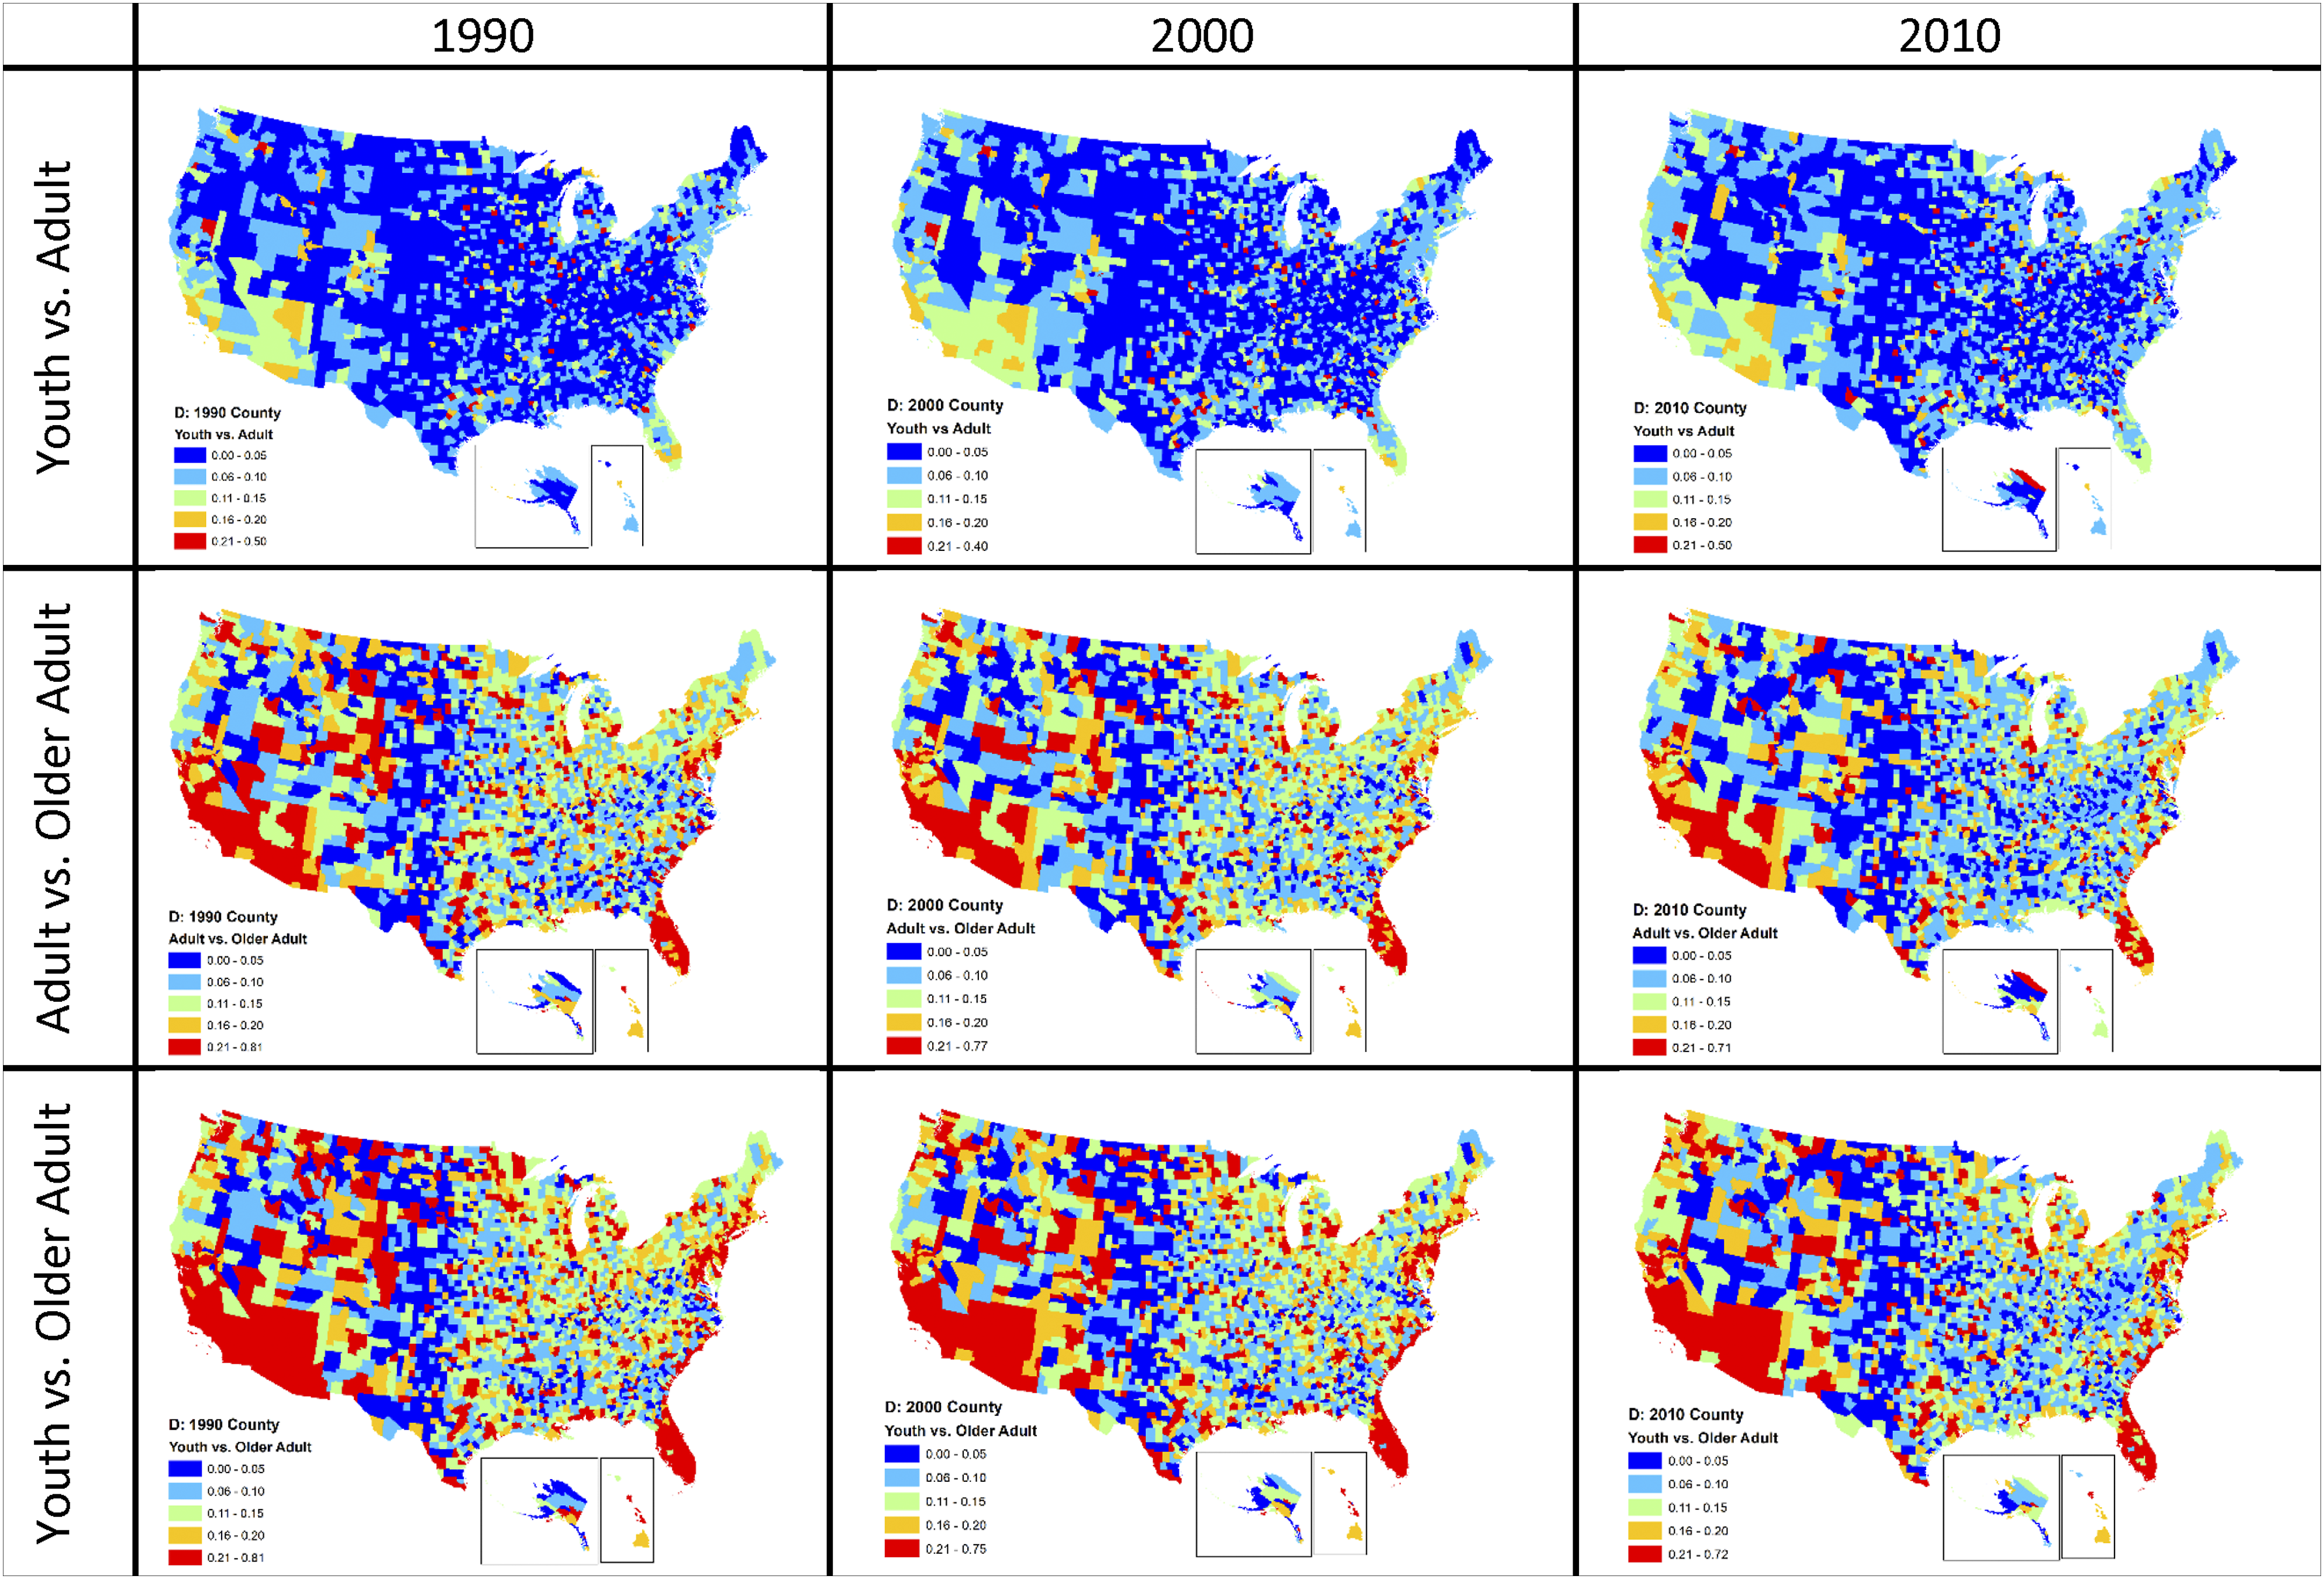
For segregation involving older adults (AO and YO), a similar spattering of counties across the US experienced high levels of segregation. Counties in the west and southwest as well as parts of the Mid-Atlantic and almost all counties in Florida had high segregation levels in all 3 years. However, the region from north central (Montana, North Dakota) down to south central (western Texas and New Mexico) had the lowest levels in all 3 years for segregation involving older adults.
To further assess changes in segregation at the county level, we computed the proportion of counties within each state that experienced an increase in 1990–2010 (Supplementary Map 1). For YA segregation, except Washington and Oregon, with a high proportion of counties (> 80%) experiencing an increase, states across the country exhibit no clear increasing trends over the two decades. For segregation involving older adults (AO and YO), most states have moderate-to-low proportions of counties (< 40%) experiencing an increase over the two decades. These intra-state findings are consistent with our earlier results and indicate no alarming increase in age segregation across the US between 1990 and 2010.
Factors affecting older adult segregation across counties, 1990–2010
In interpreting older adult segregation, we focus on adult-older adult (AO) segregation. In addition to the factors (urbanity/rurality, % older adults, and % of institutional populations) we discussed earlier, we were also particularly interested in investigating the relation between the three types of age segregation. Among the three types, we found consistent and near-perfect correlations between AO-YO (1990–2010: r ≈ 0.90), indicating these two types of segregations may essentially be the same phenomenon. In interpreting the variations in AO segregation, we therefore examined the role played by DYA (and not DYO) and included it as an additional explanatory factor in our regression models.
Descriptive results: Adult-older adult segregation [DAO × 100] across counties by urbanity/rurality.

Note.
1Nonparametric two-sample Wilcoxon rank-sum (MannWhitney) test.
***p < 0.01.
Multivariable regression results: Adult-older adult segregation [DAO × 100] in the US, 1990–2010.

Note.
1Segregation indices, DAO and DYA, multiplied by 100.
β, regression coefficient; CI, confidence interval; DYA, youth-adult segregation.
* p < 0.10, ** p < 0.05, *** p < 0.01.
The cross-sectional regression results are quite consistent across the study period of 1990–2010. A higher percent of older adults in all 3 years, and a higher percent of population in group quarters in 2000 and in 2010 were associated with lower adult-older adult segregation (DAO). In each cross-sectional year, the higher the percent of rural population in a county, the lower was the value of D
AO
in that county (
The negative coefficients for the time dummies for 2000 and 2010 in Model 4 confirm our earlier finding of decreasing AO segregation in counties over the years. Compared to the mean for 1990, the mean D AO across counties in 2000 and 2010 were lower, respectively, by 0.75 and by 2.3 points (p < 0.05). The time dummy in Model 5 indicates that over the period of 2000–2010, the mean of D AO across counties went 3 points below that in 1990. For all covariates except one (%population in group quarters), the initial regression coefficients (main effects in Model 5) affirm the findings from the cross-sectional models (1–3). Higher levels of rurality (%rural) and higher proportion of older adults (%65 years and over) were associated with lower AO segregation in counties. But the interaction terms in Model 5 reveal an interesting dynamic. For both rurality and proportion of older adults, while the coefficients for the interaction term were positive, the coefficients for the main effects were negative. But for D YA , the coefficients for both the main effect and interaction term were positive. Together, these findings indicate an increase in the strength of the association between the two types of segregation (AO and YA), while the roles of the other two factors diminished over the study period. Lastly, together, the covariates in each regression model explain about 56–64% of the variation in AO segregation across the counties.
Discussion
Age segregation is a social concern with detrimental impacts on the wellbeing of different population groups, especially older adults (Hagestad & Uhlenberg, 2006; Vogelsang et al., 2019). Empirical evidence in this regard is mounting (e.g., Aneshensel et al., 2007; Vogelsang & Raymo, 2014). We add to this literature by identifying current directions in age segregation. Previous findings have reported increasing age segregation of the US before the 1980s (Cowgill, 1978; La Gory et al., 1980, 1981). Results from our comprehensive analysis indicate that segregations involving older adults in the US had been declining for most states and counties in the recent decades between 1990 and 2010. This finding is contrary to the increasing trend reported for these recent decades in a study with significant methodological concerns (Winkler, 2013).
Besides identifying a declining trend, we show that age segregation levels vary among different age-group comparisons. YA segregation has been the lowest, while YO segregation has been the highest across the US. These results reflect the generational distance differentials between youths and adults and between youths and older adults (Kidwell & Booth, 1977). While older adults are more likely to be taken care of or cohabit with adults than with grandchildren, youths, on the other hand, most likely have to be dependent on and therefore cohabit with adults. Our results also indicate that these generational differentials vary geographically at the state and county levels (Figures 3 and 5).
We also extracted salient spatiotemporal patterns on age segregation. At the state-level, our results showed that Arizona and Florida recorded the highest AO segregations in all 3 years, while some New England states (Maine and Vermont) had the lowest levels. Florida’s population is among the oldest, but Arizona’s median age is lower than the national average, and New England states are also among the oldest (US Census, 2011). These results illustrate that despite dissimilar median age and age compositions, regions may have similar levels of age segregation. Comparable age segregation despite demographic asymmetry at the macro (state) level is possible because segregation assesses the differences in the distributions of population groups across neighborhoods.
Washington, DC recorded the highest YA segregation and had relatively high AO and YO segregation in all years. The uneven distributions of populations across neighborhoods is much more pronounced in spatially more restrictive urban-city settings like Washington, DC than in the more spatially expansive state settings, an expected result that has been explained in the literature (Krupka, 2007). However, the relatively high segregations in Washington, DC is also partly the result that urban areas had higher segregation than in rural areas in all three types of age segregation (AO, YO, and YA) (Table 1 and Supplementary Table 1).
At the county level, the dynamics of age segregation have been complex. Between 1990 and 2010, both the level as well changes in the three types of age segregation were less than clear, although AO and YO segregation declined (Figures 4 and 5). The absence of a clear pattern of change at the county level may have been dictated by the differential levels of age segregation by urbanity/rurality of counties (Table 1). Similar trends of higher segregation in urban compared to rural counties defined all three segregation types (Table 1 and Supplementary Table 1). The stretch of relatively rural counties from Montana and North Dakota down to western Texas had the lowest age segregations, reflecting urban-rural differences (Figure 5).
A core tenet of research on place and aging is urbanity/rurality of places (National Academies of Sciences [NAS], 2018; Shiode et al., 2014; Singh & Siahpush, 2014). Urbanity-rurality is indeed a rich dimension that represents many age-segregation contextual factors, such as housing, access to services, and economic conditions (Caldwell et al., 2016; Subramanian et al., 2006; NAS, 2018). Accordingly, older adults experience great disparities in environment (Davies & James, 2011), aging (Kinsella, 2001), and social behavior (Vogelsang, 2016) based on urbanity/rurality of a place. The characteristics of urban/rural places therefore shape whether communities are able to support aging as well as the evolving needs of the elderly population (Besel & Andreescu, 2013; Buckwalter & Davis, 2011; Caldwell et al., 2016; Hofferth & Iceland, 1998; National Academies of Sciences, Engineering, and Medicine (NAS), 2018; White & Guest, 2003).
Although prior evidence is less than clear on which characteristics of places are supportive of aging (NAS, 2018), lower social environment and support in cities has often been identified as a limiting factor (Hofferth & Iceland, 1998; White & Guest, 2003). Social connection and support of seniors, especially support for the oldest-old living alone (Das Gupta et al., 2020), may be of greater concern in age-segregated communities in urban areas. Prioritizing resources for innovative local and area programs addressing isolation of seniors is therefore imperative given the evidence of a positive association between quality of governmental services and health and wellbeing of older adults in general (Hogan et al., 2016) and during the current pandemic, in particular (Hoffman et al., 2020; Pendergrast, 2021).
Our multivariate analysis examining correlates of AO segregation (Table 2) further confirmed an urban-rural dynamic showing higher rurality (%rural population) of counties associated with lower AO segregation, although this relation diminished over time. Additionally, percent of older adults and percent of population in group quarters were inversely related to AO segregation between 1990 and 2010. The influences of these significant variables on AO segregation diminished over time, similar to the behavior of the rurality variable, but the positive influence of YA segregation increased.
The above findings may be indicative of the increasing salience of intergenerational relations, as opposed to broader place-based characteristics, toward explaining age segregation in the US. Additional research is however needed in this area to understand the exact mechanisms underlying these temporal trajectories. Nevertheless, a housing and urban policy implication would indicate a move away from retirement enclaves and toward all-age communities, intergenerational housing, and co-housing models (Forsyth et al., 2019) for communities experiencing high segregation across YA and AO populations.
The above policy direction may be particularly relevant for the western part of the country. Our results identified an east-to-west shift in the clustering of states with a moderate proportion of counties experiencing increase in AO and YO segregation (supplementary Map 1). This specific shift may be indicative of the fact that in the first decade, older adults and the other two age groups resided increasingly in different communities in many parts of the eastern US with this age-based geographical mismatch decreasing in the following decade. However, the reverse seems to be true in the West—over time, the spatial extent of age-based geographical mismatch involving the older adults not just persisted but expanded to include additional states.
In summary, findings from our study reveal age segregation in the US to be a highly heterogeneous phenomenon. The level of segregation varied based on the population groups (YA, AO, and YO) as well as the geographical scales (state and county) being considered. The resulting spatiotemporal dynamics exhibited complicated with sporadic to no clear direction in this pattern. It is essential that these variabilities are highlighted rather than understated in future work. Similarly, social and policy efforts addressing age segregation should be specific to local contexts and variabilities at different geographical levels. For instance, to address relatively high age segregation (Figure 3) in the state of Florida, jurisdictions may consider what percent of state monies they allocate to finance child-friendly policies as these policies have the potential to boost the size of younger populations in the state (McDonald, 2006; Mills, et al., 2011). However, such budgetary reallocations may be less of a priority for counties in the panhandle region of Florida where age segregation has been moderate to low (Figure 5). Conversely, pockets of high age segregation in select regions of the low segregation state of New York may also not be tackled by statewide policies. High age segregation found in secondary cities, including Rochester, Syracuse, and Watertown (Figure 5), are tied to their similar urban historical experiences dominated by the decline of the manufacturing industry (Beauregard, 2009, 2013). Consequently, addressing age segregation in these areas may need municipal-level approaches (such as economic development and urban renewal, jobs creation programs) to attract younger populations into older neighborhoods based on each local-historical setting (Mallach, 2018).
Our study has some limitations. While age segregation may be manifested at multiple scales, household, neighborhood, and regional (Vanderbeck, 2007), we focused on the census geography (census-tract) closest to the concept of a community at the neighborhood level (US Census, 1994). Results from this ecological-level analysis should however not be used to infer age segregation and/or isolation at the household level. Additionally, we used census-tract data as the subunit to compute dissimilarity index D summarizing the spatial separation of different age groups at the national, state, and county levels. Thus, intra-tract uneven distributions would not be captured by our study.
Furthermore, while spatial separation by age are fueled by larger societal processes transforming demographic composition of regions, social separation by age may exist at the household level (Vanderbeck, 2007). Therefore, evaluation of changes in generational compositions will need consideration in future research to better interpret the context of age segregation at the household level. Results from a recent study (Pilkauskas et al., 2020) report low but rising levels of multigenerational households in the US since the decade of 1980s. This finding is indicative of decreasing age segregation within the household and is in line with the results from our study at the ecological level.
Conclusion
To address significant gaps in prior age segregation studies, we conducted a two-part analysis systematically evaluating age segregation in the US. Across multiple geographies and over the two decades (1990–2010), segregation of AO and YO exhibited a declining trend, while YA segregation, the lowest among the three types of age segregation, had no clear trajectory. These findings contradict results reported in a prior study. We also show that segregations of YO were higher than those of AO and that the spatiotemporal dynamics of YA segregation were different from that involving the older adults.
Geographical variations of YA segregation across states were relatively small, but the variations of AO and YO segregations have been larger with the highest levels in the southwest and lower in the northeast and the south (except Florida). Regression analysis revealed evidence consistent with our hypothesis of rurality as a significant factor influencing age segregation. Higher the rurality, lower was the age segregation in counties across the US. While this role of rurality decreased over time, the high-high YA-AO association, in contrast, increased over time. Future research is therefore warranted to interpret the changing relation between these two types of segregation, youth-adult and adult-older adult.
Supplemental Material
sj-pdf-1-roa-10.1177_01640275221074398 – Supplemental Material for Changing Age Segregation in the US: 1990 to 2010
Supplemental Material, sj-pdf-1-roa-10.1177_01640275221074398 for Changing Age Segregation in the US: 1990 to 2010 by Debasree Das Gupta and David W. S. Wong in Research on Aging
Footnotes
Declaration of conflicting interests
The author(s) declared no potential conflicts of interest with respect to the research, authorship, and/or publication of this article.
Funding
The author(s) received no financial support for the research, authorship, and/or publication of this article.
Authors’ Note
Debasree Das Gupta and David W. S. Wong should be considered joint first authors

Supplemental Material
Supplemental material for this article is available online.
Author Biographies
References
Supplementary Material
Please find the following supplemental material available below.
For Open Access articles published under a Creative Commons License, all supplemental material carries the same license as the article it is associated with.
For non-Open Access articles published, all supplemental material carries a non-exclusive license, and permission requests for re-use of supplemental material or any part of supplemental material shall be sent directly to the copyright owner as specified in the copyright notice associated with the article.
