



Abstract
Intentional self-regulation (ISR) undergoes significant development across the life span. However, our understanding of ISR’s development and function remains incomplete, in part because the field’s conceptualization and measurement of ISR vary greatly. A key sample case involves how Baltes and colleagues’ Selection, Optimization, and Compensation (SOC) model of ISR, which was developed with adult populations, may be applied to understand and measure adolescent self-regulation. The tripartite structure of SOC identified in older populations has not been replicated in adolescent samples. This difference may be due to measurement issues. In this article, we addressed whether using a Likert-type format instead of a forced-choice format of the SOC Questionnaire resulted in a tripartite factor structure when used with an adolescent population. Using data from 578 late adolescents who participated in the 4-H Study of Positive Youth Development (70.80% female), we showed that the two versions of the measure produced a similar factor structure and were similar in terms of reliability and validity, although the traditional forced-choice version provided data with slightly lower criterion validity. We therefore conclude that both types of the measure are acceptable, but the choice of measure may depend on the sample in question and the analytical approach planned for the findings. We discuss the implications of our findings for future research.
Optimizing one’s own development within a complex physical, social, cultural, and historical context requires that individuals intentionally regulate interactions with their environments in ways that meet both personal goals and environmental demands (Brandtstädter, 2006; Gestsdottir & Lerner, 2008). Brandtstädter (2006) has called such bidirectional person ← → context interactions “adaptive developmental regulations” when they benefit both the individual and his or her environment. Agentic control over these relations (termed intentional self-regulation [ISR]) has accordingly been associated with positive developmental outcomes across the life span (for reviews, see Geldhof, Little, & Colombo, 2010; McClelland, Ponitz, Messersmith, & Tominey, 2010).
ISR undergoes significant development across the life span (Freund & Baltes, 2002; Gestsdottir & Lerner, 2008; Napolitano, Bowers, Gestsdottir, & Chase, 2011); yet, our understanding of the development of ISR remains surprisingly incomplete. This gap is perhaps in part because researchers define self-regulation in myriad ways, and even researchers who approach ISR from the same theoretical perspective can disagree on how best to measure it. For example, the Selection, Optimization, and Compensation model, and its associated measure (SOC; Baltes & Baltes, 1990; Freund & Baltes, 2000) has been applied to individuals/samples from adolescence through old age (e.g. Baltes, Lindenberger, & Staudinger, 2006; Gestsdottir & Lerner, 2007), but recent research suggests that it may not be applicable to adolescence in the same way as adulthood (e.g. Gestsdottir et al., 2014). The appropriateness of the binary nature of the response scale has been questioned, in particular when used with adolescent populations (e.g. Geldhof, Little, & Hawley, 2012; see also Weise, Freund, & Baltes, 2000, 2002, and Ziegelmann & Lippke, 2007, who adapted the SOC questionnaire into Likert-type measurements, although these authors did not explicitly discuss how their measurement strategies would compare to the forced-choice questionnaire).
In this article, we address this criticism by directly comparing the structure, reliability, and validity of the SOC Questionnaire when administered to late adolescents using either (a) the traditional forced-choice format, or (b) a more standard Likert-type format. We aim to facilitate an understanding of how researchers can most appropriately implement the SOC Questionnaire. We address these issues as they relate to the measurement of SOC toward the end of adolescence; additional research is needed to assess the appropriateness of these two types of response scales in other periods of the life span.
The SOC model
The SOC model is an action-theoretical approach to self-regulation that emphasizes four self-regulatory action processes: Elective selection, optimization, compensation, and loss-based selection. Elective selection (henceforth selection) refers to an individual’s ability to commit to a set of meaningful goals and entails organizing selected goals into a hierarchy that accounts for personal and environmental needs. Once an individual selects a goal, or a hierarchy of goals, he or she must next follow through with actually achieving that goal. In the terminology of the SOC model, self-regulated actions that move an individual closer to attaining his or her selected goals are called
SOC in adolescence
In the second decade of life, youth develop an increased capacity for self-regulation. Self-regulation also gains increased significance for adaptive development during this period (e.g. Gestsdottir & Lerner, 2008). Changes in the prefrontal cortex, increases in interconnectivity among brain regions, and increases in dopamine levels, all provide the opportunity for increased cognitive control during this age period, especially in relation to long-term goals (Steinberg, 2010). In addition, an orientation toward one’s personal future becomes increasingly important during adolescence, when a more developed identity helps the young person form goals and utilize goal-relevant strategies, such as SOC, to reach those goals (Brandtstädter, 2006; Havighurst, 1972; Schmid & Lopez, 2011; Schmid et al., 2011).
Recent research has provided evidence that SOC supports adaptive adolescent development, including indicators of the Five Cs of Positive Youth Development (Competence, Confidence, Character, Caring, and Connection; see Bowers et al., 2011; Gestsdottir & Lerner, 2007; Gestsdottir, Lewin-Bizan, von Eye, Lerner, & Lerner, 2009; Gestsdottir et al., 2010), which are thought to foster young people’s tendency to make meaningful contributions to their communities (e.g. Lerner et al., 2005). Furthermore, SOC has been a consistent negative predictor of adolescents’ substance use, delinquent behaviors, and depressive symptomology (Gestsdottir & Lerner, 2007; Gestsdottir et al., 2009, 2010).
Researchers have hypothesized that SOC develops from a general “intentional self-regulation” factor into separate selection, optimization, and compensation factors during adolescence. Research examining the differentiation of SOC generally has confirmed a unidimensional structure in early adolescence (Gestsdottir et al., 2014; Gestsdottir et al., 2009; Gestsdottir & Lerner, 2007; Zimmerman, Phelps, & Lerner, 2007; see Table 1). Gestsdottir and colleagues (2009) identified a tripartite model during Grades 8, 9, and 10—middle adolescence—although a single factor solution also displayed acceptable fit. Exploratory factor analyses (EFAs) using data from the same study further suggested a global factor across 8 years of adolescence (Geldhof, Bowers, Gestsdottir, Napolitano, & Lerner, in press). These analyses also suggested separate factors for Selection and a Reverse-Code Method Factor in all age groups considered, and found some evidence that items tapping participants’ willingness to model and accept help from others formed an additional factor. We propose that the observed lack of evidence that supports differentiated Selection, Optimization, and Compensation factors during adolescence may be partly due to the way that the SOC Questionnaire is administered. As such, we hypothesized that a Likert-type response format may produce a more valid and reliable assessment of SOC strategies among late adolescents.
Model fit from previous studies of adolescent Selection, Optimization, and Compensation.
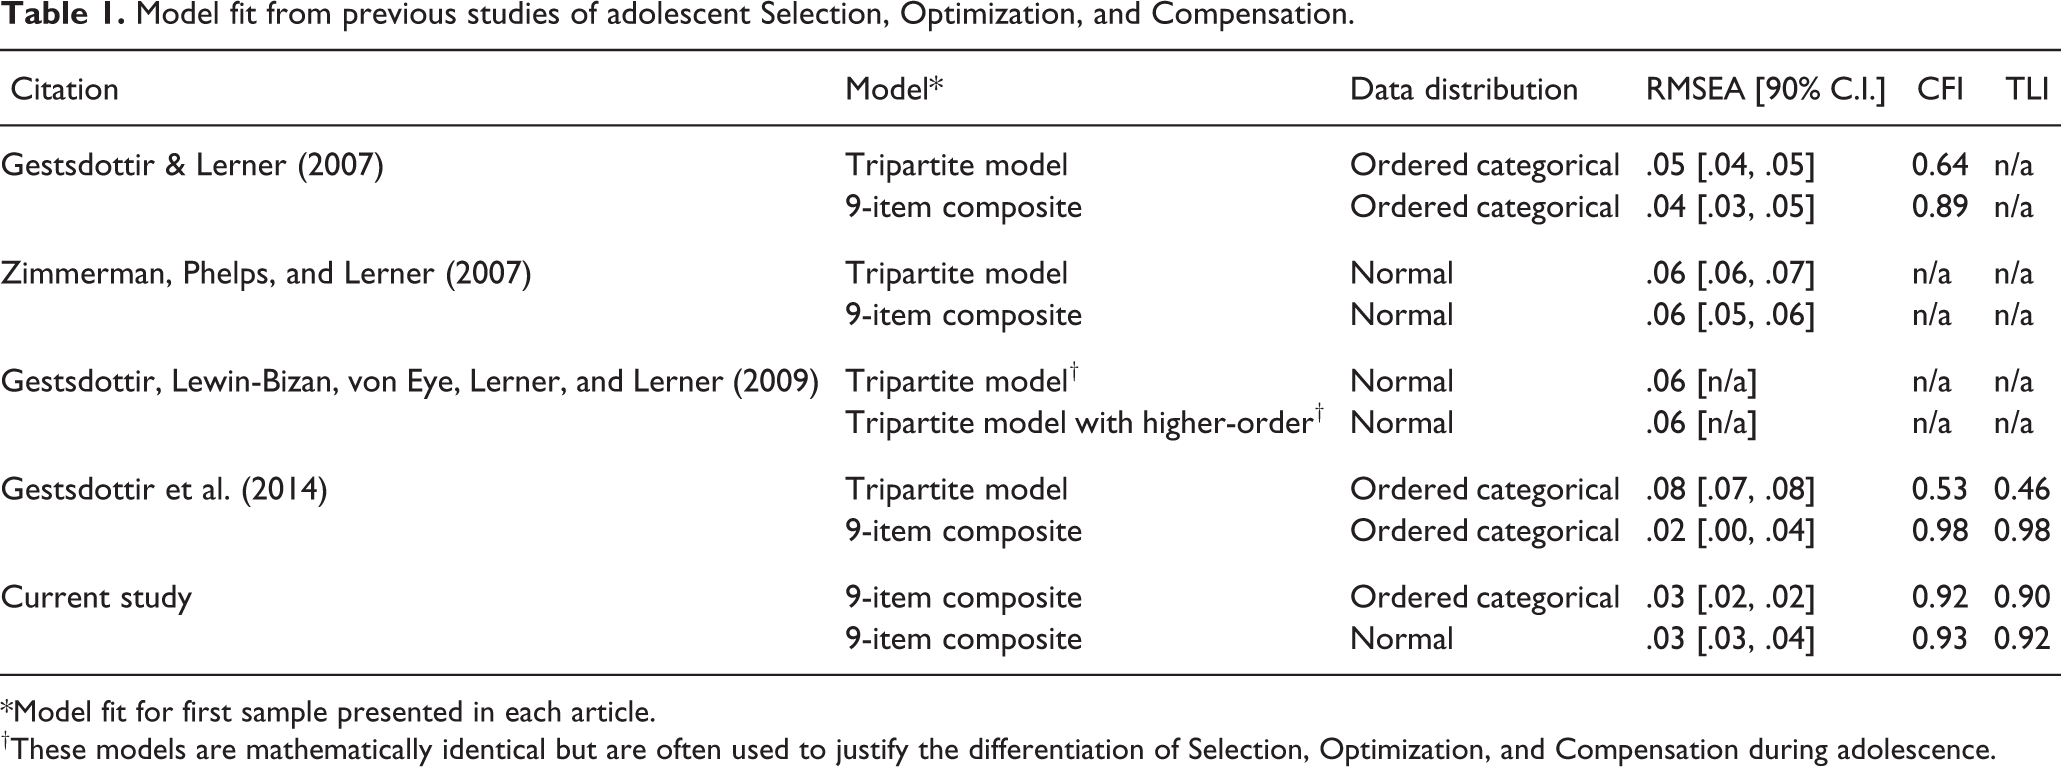
*Model fit for first sample presented in each article.
†These models are mathematically identical but are often used to justify the differentiation of Selection, Optimization, and Compensation during adolescence.
Adapting the SOC measure for adolescents
Items from the SOC Questionnaire use a forced-choice format rather than the more-common Likert-type response format. The forced-choice items each consist of two statements, one describing a behavior that reflects self-regulation and the other describing a behavior not indicative of self-regulation. Participants must read both statements and choose which is most similar to how they behave.
This forced-choice measurement approach was designed to reduce the effect of social desirability bias on responses to the SOC Questionnaire. The amount of research that supports this is limited, however. For instance, Stange, Freund, and Baltes (2000; as cited in Freund & Baltes, 2002) found a median correlation between SOC and a measure of social desirability of .31 when SOC was measured using a Likert-type scale, but a median correlation of .11 when SOC was measured using the forced-choice format. The researchers did not consider alternative explanations, however. In addition, these findings have not been replicated. Bajor and Baltes (2003) found a significant correlation between social desirability and a composite of forced-choice SOC items (r = .27). Geldhof and colleagues (2012) similarly found a significant correlation between social desirability and an undifferentiated factor indicated by forced-choice Selection and Optimization items (r = .42). Given the inconsistency of these findings, a Likert-type response format may present an equally valid, and potentially more practical, alternative to the binary forced-choice response format. A Likert-type format may also have several advantages over the use of a binary version.
First, from a statistical perspective, researchers also often analyze data from the SOC questionnaire using traditional parametric statistics. For example, Bajor and Baltes (2003) used OLS regression, Gestsdottir and colleagues (2010) present factor analyses that assume normally distributed indicators (although they also discuss an analysis of Yule coefficients), and Hahn and Lachman (2014) used scale composites in multilevel modeling.
Most parametric statistics—including the commonly used methods of covariance-based factor analysis and structural equation modeling—make several assumptions about the data being analyzed. First, these methods assume that data are continuous and normally distributed. Items that are answered on an ordered categorical scale (such as Likert-type or binary) violate these assumptions (Jamieson, 2004) and potentially bias the results of such analyses (e.g. Lubke & Muthén, 2004). Recent simulations (e.g. Rhemtulla, Brosseau-Liard, & Savalei, 2012) suggest that this bias is minimal when Likert-type ordinal data are represented by a sufficient number of categories (typically five or more), however. For data with fewer categories (e.g. binary response options), considerable bias is still present when these data are analyzed as if they were continuous.
Alternative data analysis techniques are available for these types of data (e.g. robust least squares estimation and tetrachoric correlation matrices, which are also appropriate for analyzing Likert-type data as ordinal; Forero, Maydeu-Olivares, & Gallardo-Pujol, 2009); however, these techniques often have reduced power, especially when samples are small (Rhemtulla et al., 2012). Binning continuous data distributions into a limited number of categories necessarily results in a loss of information (e.g. MacCallum, Zhang, Preacher, & Rucker, 2002). Furthermore, these techniques may be difficult to implement when paired with other techniques such as latent growth curve modeling or growth mixture modeling. Thus, although alternative techniques are available for binary data, Likert-type data with at least five categories can be productively analyzed with traditional parametric statistics that assume normality and allow researchers to more easily maintain acceptable statistical power.
Second, the nature of the complex variation occurring with particular developmental issues encountered during adolescence (e.g. identity moratorium and search processes; Côté, 2009) may also pose specific challenges for using binary response options (Geldhof, 2012). Prior research using the SOC measure in adolescence has suggested that the absence of a tripartite factor structure may indicate there is an adolescent-specific SOC structure (Gestsdottir et al., 2014). That is, rather than hypothesizing that certain items from the SOC questionnaire are not sensitive to inter- and intra-individual differences in self-regulation during this age period, it is possible that intentional self-regulation takes on a qualitatively different meaning during adolescence (as compared to adulthood). For instance, young people may not view the SOC-related and non-SOC-related behaviors depicted by the binary SOC options as opposites. As an example, one selection item states “I always focus on the one most important goal at a given time” as a SOC-behavior and “I am always working on several goals at once” as a non-SOC-behavior. Adolescence and young adulthood are typically characterized by growth, both in regard to individual functions (e.g. cognitive abilities; Blakemore & Choudhury, 2006; Keating, 2004) and in regard to ecological opportunities (e.g. the young person is increasingly expected to explore, set, and pursue goals independently; Gestsdottir & Lerner, 2008; Gestsdottir et al., 2010). Similarly, toward the end of the second decade of life, pursuing multiple goals, changing goal-hierarchies, and exploring multiple ways to achieve those goals, may be fruitful as young people explore different developmental paths and refine their knowledge of self-regulation strategies (Côté, 2009). In fact, Napolitano and colleagues (2011) found that youth who scored highest on indicators of positive development were characterized by either having high or low levels of goal selection. During later developmental periods, when internal and external resources (e.g. physical health, employment opportunities) become more limited, such instability may become problematic. For these reasons, although SOC-behaviors are adaptive at any developmental period, in adolescence and early adulthood, SOC and non-SOC behaviors may not be incompatible, making binary answer options problematic for adolescents.
We note, however, that as young people move through adolescence and into adulthood, their self-regulatory strategies are expected to become more consistent. Older adolescents should become increasingly competent in reflecting on such complicated behaviors and answering questions about their self-regulatory strategies. This development may make binary answer options more appropriate as adolescents age into adulthood.
The present study
Accordingly, we address the question of whether a forced-choice or Likert-type approach to measuring SOC during late adolescence produces scales with similar structure and similar, or improved, reliability and criterion validity. We chose a sample of late adolescents because SOC theory predicts that the Selection, Optimization, and Compensation processes should have differentiated by this age period, and a late adolescent sample offers the greatest probability of observing a differentiated factor structure during adolescence. This sample therefore allows us to better understand whether previous findings that suggest a general ISR factor represent an adolescence-specific factor structure or a measurement artifact related to response scaling.
As detailed below, we compared criterion validity of the forced-choice and Likert-type adaptation of the SOC questionnaire by examining criterion correlations with scales previously found to correlate with the SOC processes (i.e., Five Cs of Positive Youth Development, substance use, delinquent behaviors, depressive symptoms), as well as with community contributions, which are theoretically linked to these same criteria. We did not control for social desirability in these analyses due to previous research that questions the influence of social desirability on the SOC Questionnaire (Geldhof et al., 2012).
Method
We investigated these issues using data from a follow-up wave of the 4-H Study of Positive Youth Development (4-H Study), a longitudinal study of adolescents in the United States that began in 2002 with the study of fifth-graders and continued through 2011 with the collection of data from 12th-graders (for full details regarding prior waves of the study, see Bowers, Geldhof, Johnson, Lerner, & Lerner, 2014; Lerner et al., 2005, 2009, 2011). The follow-up data collection used in the present study occurred in 2012, when most participants were in their first year of college.
Participants
We obtained data from 578 participants (M age = 20.11 years, SD = .86). Participants were predominantly female (70.80%) and White/European American (78.19%), with smaller numbers of other ethnicities represented (2.48% Asian or Pacific Islander, 3.72% African, 3.37% Latino/a, 12.24% Other). We did not collect information regarding the participants’ socioeconomic status, although a majority of the participants were enrolled in or had completed some form of post-secondary education (87.54%).
Procedures
We recruited participants using contact information obtained during prior waves of the 4-H Study. We first contacted all participants from previous waves via email, with reminder emails sent 2 weeks after making initial contact. Approximately 1 month after sending reminder emails, we sent recruitment postcards to participants who had not yet completed the survey. All participants completed the survey online and received $35 gift cards (sent electronically) as compensation for their participation.
Measures
Participants responded to both types of the SOC measure as part of a larger online questionnaire, which took approximately 20 minutes to complete. We randomized the order that participants saw items from each measure such that, where possible, the items of each measure did not appear in the same section of the questionnaire. Overall, participants provided nearly complete data, with very low missingness across the variables analyzed in this study (average percent missing was 4.47% and ranged across variables from 2.77% to 6.57%).
SOC
We operationalized SOC using two modified versions of the short version of the SOC Questionnaire developed by Freund, Baltes, and colleagues (e.g. Freund & Baltes, 2002). Participants completed one version of the SOC questionnaire using the traditional forced-choice format and completed a second version that was scaled using a Likert-type format. Our modified measures included three subscales (six items each): selection, optimization, and compensation. Both versions of the SOC questionnaire omitted loss-based selection items and included the minor wording modifications described by Gestsdottir and Lerner (2007). The 18 SOC items we used are presented in the Appendix, cast in regard to the original forced-choice format as well as the options used in our Likert-type measure.
Forced-choice format
As noted above, the forced-choice administration of the SOC Questionnaire asks participants to read two statements and to choose which statement best reflects their own behavior (see the Appendix). As described by Freund and Baltes (2002), Person A reflected SOC for some items, whereas Person B reflected SOC for other (reverse-coded) items. Before analyzing our data we re-coded all reverse-coded items such that higher scores represented higher SOC on all items.
Likert-type format
For our Likert-type measure we presented participants with the SOC-related option of each item and asked them to respond to the prompt, “How much do each of these statements describe you?” Responses options ranged from 1 (“Not at all like me”) to 5 (“Very much like me”), with the mid-point (3) anchored by the term, “Somewhat like me.”
Criterion measures
We examined the validity of the forced-choice and Likert-type measures of SOC by examining the correlations of each with several criterion measures. Criterion measures were all key measures from the 4-H Study used in previous research to index both healthy and problematic functioning (e.g. Bowers et al., 2011; Lewin-Bizan et al., 2010; Schmid et al., 2011). Theoretically, and as supported by previous empirical studies, SOC should be positively related to these indicators of positive youth development and negatively related to risk behaviors (e.g. Bowers et al., 2014; Lerner, Lerner, Bowers, & Geldhof, in press).
Academic achievement
We measured academic achievement by asking participants, “What is your current or most recent GPA?” Responses ranged from “0.0” to “4.0 or more” in increments of .5.
Community contributions
Participants responded to 12 items that were weighted and summed to create a composite measure of contribution. These items were derived from existing instruments with known psychometric properties and used in large-scale studies of adolescents, including the Search Institute’s Profiles of Student Life-Attitudes and Behaviors (PSL-AB) scale (Benson, Leffert, Scales, & Blyth, 1998; Leffert et al., 1998) and the Teen Assessment Project (TAP) Survey Question Bank (Small & Rodgers, 1995).
Contribution was comprised of two equally weighted subscales—ideology and actions—and each subscale included six items. The ideology subscale measured the extent to which contribution was an important facet of participants’ identity and future self. An example ideology subscale item stated, “It is important to me to contribute to my community and society” with response options ranging from 1 = Strongly disagree to 5 = Strongly agree. An example item that assessed future ideological orientation gauged the self-perceived chances that the young person would be involved in community service in the future, with a response format that ranged from 1 = Very low to 5 = Very high.
The action subscale of contribution was comprised of three components: helping, leadership, and service. Items measured the frequency of time youth spent helping others (i.e., friends and neighbors), acting in leadership roles (i.e., being a leader in a group or organization within the last 12 months), and providing service to their communities (i.e., volunteering, mentoring/peer advising, and participating in school government), respectively. The composite contribution scores (with equally weighted subscales of ideology and action) ranged from 0 to 100, with higher scores indicating higher levels of contribution. This overall composite displayed acceptable reliability (α = .79).
Depressive symptoms
We measured depressive symptomatology using the 20-item, self-report Center for Epidemiological Studies Depression scale (CES-D; Radloff, 1977). Respondents indicated how often they experienced particular symptoms during the past week. Example items included: “I was bothered by things that usually don’t bother me” and “I felt sad.” The response options for all items ranged from 0 = Rarely or none of the time (less than 1 day) to 3 = Most or all of the time (5–7 days). Items were summed for a total score, with a maximum value of 60, and higher scores were indicative of higher depressive symptomatology. This overall composite displayed acceptable reliability (α = .91).
Risk behaviors
We measured indicators of risk behavior with five questions derived from items included in the Search Institute’s Profiles of Student Life-Attitudes and Behaviors (PSL-AB) scale (Leffert et al., 1998) and the Monitoring the Future (2000) questionnaire. Items assessed the frequency of delinquent behaviors (e.g. stolen something, gotten in trouble with the police, hit or beat up someone, damaged property just for fun, carried a weapon). The response format for these items ranged from 1 = Never to 5 = Five or more times, and sum of the items was used as a single-indicator estimate of overall risk behavior (α = .68).
Substance use
Seven items, also from the PSL-AB scale (Leffert et al., 1998) and the Monitoring the Future (2000) questionnaire, assessed the frequency of participants’ substance use (smoked cigarettes, drank alcohol, used marijuana or hashish, used other drugs such as LSD or cocaine, sniffed glue, taken steroid pills or shots without a doctor’s prescription) in the past year. The response format ranges from 1 = Never to 4 = Regularly, and the item sum was taken as a single-indicator estimate of overall substance use (α = .59).
Positive Youth Development (PYD)
We operationalized PYD using a modified version of the short measure of the Five Cs of PYD (PYD-SF) discussed by Geldhof, Bowers, Boyd, and colleagues (in press). The Five Cs model identifies PYD as consisting of the Five Cs discussed above. Our measure of PYD drew items from several primary sources, including: the Search Institute’s Profiles of Student Life-Attitudes and Behaviors (PSL-AB) scale (Benson et al., 1998; Leffert et al., 1998); the Self-Perception Profile for Children (Harter, 1983); the Self-Perception Profile for Adolescents (Harter, 1988); Teen Assessment Project (TAP) Survey Question Bank (Small & Rodgers, 1995); Eisenberg Sympathy Scale (Eisenberg et al., 1996); and the Empathic Concern Subscale of the Interpersonal Reactivity Index (IRI; Davis, 1980). We also modified items from the Self-Perception Profile for Adolescents (Harter, 1988). We analyzed items using a bifactor confirmatory analysis (described in further detail below), which corrects for measurement error, and therefore do not report scale reliabilities here.
As discussed by Geldhof, Bowers, Boyd, and colleagues (in press), the PYD-SF measures Competence using six items, two items representing each of Academic Competence, Social Competence, and Physical Competence. All Competence items asked participants how much they agreed with several statements on a 5-point Likert-type scale (e.g. “I do/did very well in my class work”), with responses ranging from 1 = Strongly disagree to 5 = Strongly agree.
The PYD-SF similarly measures Confidence using six items, with two items each representing Self-Worth, Positive Identity, or Physical Appearance. The Self-Worth and Physical Appearance items followed the same response format as the Competence items (e.g. “I am happy with myself most of the time”), as did the Positive Identity items (e.g. “All in all, I am glad to be me”).
The measure of Character in the PYD-SF includes eight items, with two representing each of: Social Conscience, Values Diversity, Conduct Behavior, and Personal Values. All items were scored on a five-point Likert-type scale. The Social Conscience and Personal Values items asked participants how important different values were to them (e.g. an item measuring Social Conscience was “Helping to make the world a better place to live in,” and an item measuring Personal Values was “Doing what I believe is right even if my friends make fun of me”). The Conduct Behavior items followed a similar response format to the Competence items above (“I usually act the way I know I am supposed to”).
Caring was measured through six items that asked participants how well statements described them (e.g. “When I see someone being picked on, I feel sorry for them”). Response options were on a 5-point Likert-type scale with the response options of 1 = Strongly disagree to 5 = Strongly disagree.
The Connection scale contained eight items scaled using the same response format as the Competence items above. Items measuring Connection represented connection to participants’ families, neighborhoods, schools, and peers, respectively (two items each; e.g. “I have lots of good conversations with my parents,” and “Adults in my town or city make me feel important”).
Prior psychometric work using the PYD-SF (e.g. Geldhof, Bowers, Boyd, et al., in press, see also Geldhof et al., 2014), has demonstrated that it is most appropriately analyzed using bifactor confirmatory factor analysis which is the approach that we took in the present analyses. In this bifactor model (see Figure 1), all indicators of PYD load onto two constructs: a global factor that aggregates across all Cs (all of the items load onto this factor) and one of five specific constructs representing each C after controlling for global PYD. The global PYD construct provides a heuristic estimate of global positive functioning, whereas the residual C constructs represent levels of each C after controlling for overall PYD.

A bifactor model of Positive Youth Development (PYD). Note that global PYD and the residual Cs are necessarily modeled as orthogonal (uncorrelated).
As discussed by Geldhof and colleagues (2014), the bifactor model of PYD has both empirical and theoretical advantages over alternative models such as second-order confirmatory factor analyses (CFA). Empirically, the bifactor model provided statistically better fit than a higher-order model (see Geldhof, Bowers, Boyd, et al., in press). A bifactor model also maps more directly onto the 5 Cs of PYD discussed by Lerner, Lerner, and their colleagues (e.g. Lerner et al., 2005). Treating PYD as a second-order construct necessarily assumes that participants have set levels of PYD and that PYD itself causes participants to display specific levels of each C. A bifactor model instead suggests that each item has two sources of true-score variance: global PYD and C-specific variance (see Reise, 2012, for further information about bifactor models).
Analyses
Existing evidence suggests that data from the binary version of the SOC questionnaire adheres to a relatively stable factor structure across adolescence. Research (e.g. Geldhof, Bowers, Gestsdottir, et al., in press) supports a general ISR factor, a Selection factor, and a reverse-code method factor from ages 11 through 18 years. These studies also provide some evidence for a fourth factor that represents participants’ willingness to emulate, and accept help from, others. We therefore began our analyses by examining a CFA that included both versions of the SOC measure and all of our criterion variables. The binary SOC data were specified to indicate these four factors. 1
We specified the Likert-type data as indicating one of three factors; the reverse-coded method factor was not included because none of the Likert-type indicators was reverse-coded. We also included residual covariances between each forced-choice SOC item and its Likert-type counterpart. Indicators of the reverse-coded method factor were sufficiently differentiable from indicators of all other factors and we were able to model this method factor as potentially correlated with all other factors in the model. Although method factors should be uncorrelated with all other factors in the population, estimating these latent relations allowed the resulting model to account for sample-specific latent correlations that deviate from the hypothesized population value of zero.
We ran this model to help determine if and how criterion correlations varied between our two versions of the SOC questionnaire. Accordingly, we tested whether the latent factors indicated by the forced-choice SOC items correlated with the criterion variables with the same strength as the parallel SOC factors indicated by the Likert-type items. This approach allowed us to model differences between the observed scales’ measurement structures (i.e., one had binary indicators and the other had continuous) while testing whether the scales’ substantive meaning was similar. This approach is therefore akin to Nesselroade’s (e.g. Molenaar & Nesselroade, 2012; Nesselroade, Gerstorf, Hardy, & Ram, 2007) approach to establishing factorial invariance at the latent level when measurement invariance (i.e., invariance of indicator-construct relations) is not reasonable. Nesselroade’s approach argues that two constructs are reasonably similar if they correlate equally with a set of criteria, even when their respective item-construct relations differ.
Because these analyses included categorical (binary) data, we used polyserial correlations (e.g. tetrachoric correlations for the forced-choice items, standard Pearson correlations for all other items) and robust weighted least square estimation. We treated our Likert-type SOC items as continuous indicators. This approach is consistent with our above discussion of when ordered categorical data can be reasonably interpreted as continuous (see also Rhemtulla et al., 2012), and also allowed us to determine whether it was reasonable to analyze a Likert-type adaptation of the SOC questionnaire using traditional parametric analyses derived from classical test theory (e.g. analysis of variance [ANOVA]).
Reliability estimation
The decision to treat the forced-choice items as ordered categorical, but to treat Likert-type items as continuous, directly impacted our approach to comparing reliability. The analysis of Likert-type items derives from classical test theory, which defines reliability as the proportion of a scale’s total variance relative to the variance of its underlying true score (i.e., the variance of the latent construct that a scale is designed to measure). As such, equations for reliability, such as that for McDonald’s ω and Cronbach’s α, simplify to:
where
The choice of reliability coefficients is more complicated with ordinal or categorical (e.g. binary) items. Models designed to analyze ordinal data typically derive from item response theory, which makes substantively different assumptions about data and data generating processes than classical test theory. Specifically related to the concept of reliability, item response theory emphasizes that a scale’s precision (reliability) is not necessarily equal across all levels of an underlying latent construct. An algebra test may be very good at differentiating between individuals with low versus moderate or high levels math ability, but a test focusing on partial differential equations is better suited for distinguishing between individuals with high vs. very high levels. Both tests measure math ability, and both may be equally “reliable” in the classical sense. The two tests measure different levels of math ability with different levels of precision, however. In this spirit, item response theory replaces the concept of a scale’s overall reliability with information curves that illustrate how a scale’s precision (i.e., the amount of information it provides) varies across levels of the underlying latent construct.
To our knowledge there is no way to directly compare estimates of internal consistency reliability with information curves in their raw metrics; the two derive from distinct theoretical approaches to data analysis. The two can be placed on a common metric, however, by converting estimates of both internal consistency reliability and information into a standard error of measurement; denoted henceforth as SE(m). This is the approach that we took. In addition, our analysis of binary data using robust weighted least squares estimation and tetrachoric correlations can be parameterized from the perspective of classical test theory or item response theory. As such (and consistent with prior discussions of the SOC questionnaire, see Napolitano, Callina, & Mueller, 2013), it is also possible to calculate McDonald’s ω to index the reliability of binary data. Another approach would have been to analyze both sets of items as ordered categorical, which would have enabled us to produce and compare two information curves. As noted above, however, we chose to analyze our Likert-type data as continuous based on simulation results suggesting this procedure was appropriate as well as on our desire to investigate whether traditional parametric techniques would be appropriate with these items.
Model fit
We assessed model fit using a multiple-indicator strategy (see Hu & Bentler, 1998; Kline, 2005; Little, 2013). We examined model χ2 statistics, which test the null hypothesis that a fitted model perfectly replicates the observed data, but supplemented these statistics with indicators of absolute and relative fit. We evaluated the Root Mean Square Error of Approximation (RMSEA, Steiger & Lind, 1980) as an index of absolute fit, or the degree that a model fits observed data as well as a perfect (i.e., saturated) model. The RMSEA indicates the amount of model misspecification per degree of freedom, with values below .08 typically interpreted as indicating acceptable fit and values below .05 typically indicating excellent model fit (see Little, 2013).
We examined the Comparative Fit Index (CFI; Bentler, 1990) and the Tucker-Lewis Index (TLI; Tucker & Lewis, 1973) as measures of relative fit, or the degree that a given model fits observed data better than a null model which specifies zero inter-item relations. Although simulation studies (e.g. Hu & Bentler, 1998) suggest that CFI and TLI values greater than .95 indicate good fit, these simulations assume perfect correspondence between fitted models and observed data. This is an unrealistic assumption when testing models designed as imperfect approximations of complex real-world data generation processes (Marsh, Hau, & Wen, 2004). Consistent with prior literature (e.g. Little, 2013; Marsh et al., 2004), we therefore interpreted CFI and TLI values greater than .90 as indicating good model fit.
Due to the relatively high power of latent variable analyses, as well as our desire to be conservative when discussing the differences between the SOC measures, we tested the equality of the criterion correlations using likelihood ratio tests with a Type-I error rate of .001. That is, if we equated a criterion correlation across the SOC measures and the p value for the corresponding likelihood ratio test was not significant at the .001 level, we considered the two criterion correlations to be sufficiently similar to be equated.
The above analyses were designed to illuminate the advantages and challenges of the SOC Questionnaire’s forced-choice format compared to a Likert-type format. Those analyses, however, were constrained by the assumption that the forced-choice data were analyzed using a categorical data approach based on tetrachoric correlations. Although this is an acceptable choice for analyzing binary data (e.g. Rhemtulla et al., 2012), other researchers may instead rely on covariance-based maximum likelihood analyses and/or an assumption of normality due to the data requirements for, and complexity of, analyzing tetrachoric correlations. If researchers take this approach they are necessarily assuming that the binary data are in fact continuous. To determine whether this approach (i.e., ignoring the dichotomous nature of the SOC Questionnaire) might be acceptable, we conducted an additional set of analyses wherein we explicitly examined the forced-choice SOC data using a continuous-data approach (i.e., maximum likelihood). In this set of analyses, we tested whether the criterion correlations could be fixed to the values obtained when analyzing the binary data in our second set of analyses (via a likelihood ratio test, again setting our Type-I error rate to .001).
Results
We present the results for our analyses below. We completed all analyses with Mplus using robust weighted least squares estimation for analyses that treated binary data as ordered categorical.
Confirmatory factor analyses
In our initial CFAs, we specified the factor loading pattern shown in Table 2. That is, we simultaneously modeled both versions of the SOC questionnaire, a bifactor model of PYD, and included single-indicator constructs that represented GPA, Contribution, Depressive Symptoms, Risk Behaviors, and Substance Use. This model displayed marginally acceptable fit, χ2(2199) = 3019.542, p < .001; RMSEA = .03, 90% C.I. (.02, .03); CFI = .91; TLI = .90. The modification indices suggested two cross loadings for Likert-type SOC items (item four loading onto ISR and item six loading onto Modeling and Accepting Help from Others). Given our somewhat inductive approach to the structure of SOC in these analyses (i.e., exploring how each response format can be optimally used), we specified a subsequent CFA that included these cross loadings. This model displayed slightly better fit, χ2(2197) = 2974.07, p < .001; RMSEA = .03, 90% C.I. (.02, .03); CFI = .92; TLI = .90. Using this latter model as a baseline, we then ran a final model in which we removed two non-significant factor loadings from our forced-choice Reverse-Code Method Factor (items 3 and 14), which did not significantly decrease model fit, Δχ2(2) = .76, p = .68. The factor loadings from this final model are presented in Table 2.
Standardized factor loadings from confirmatory factor analysis.
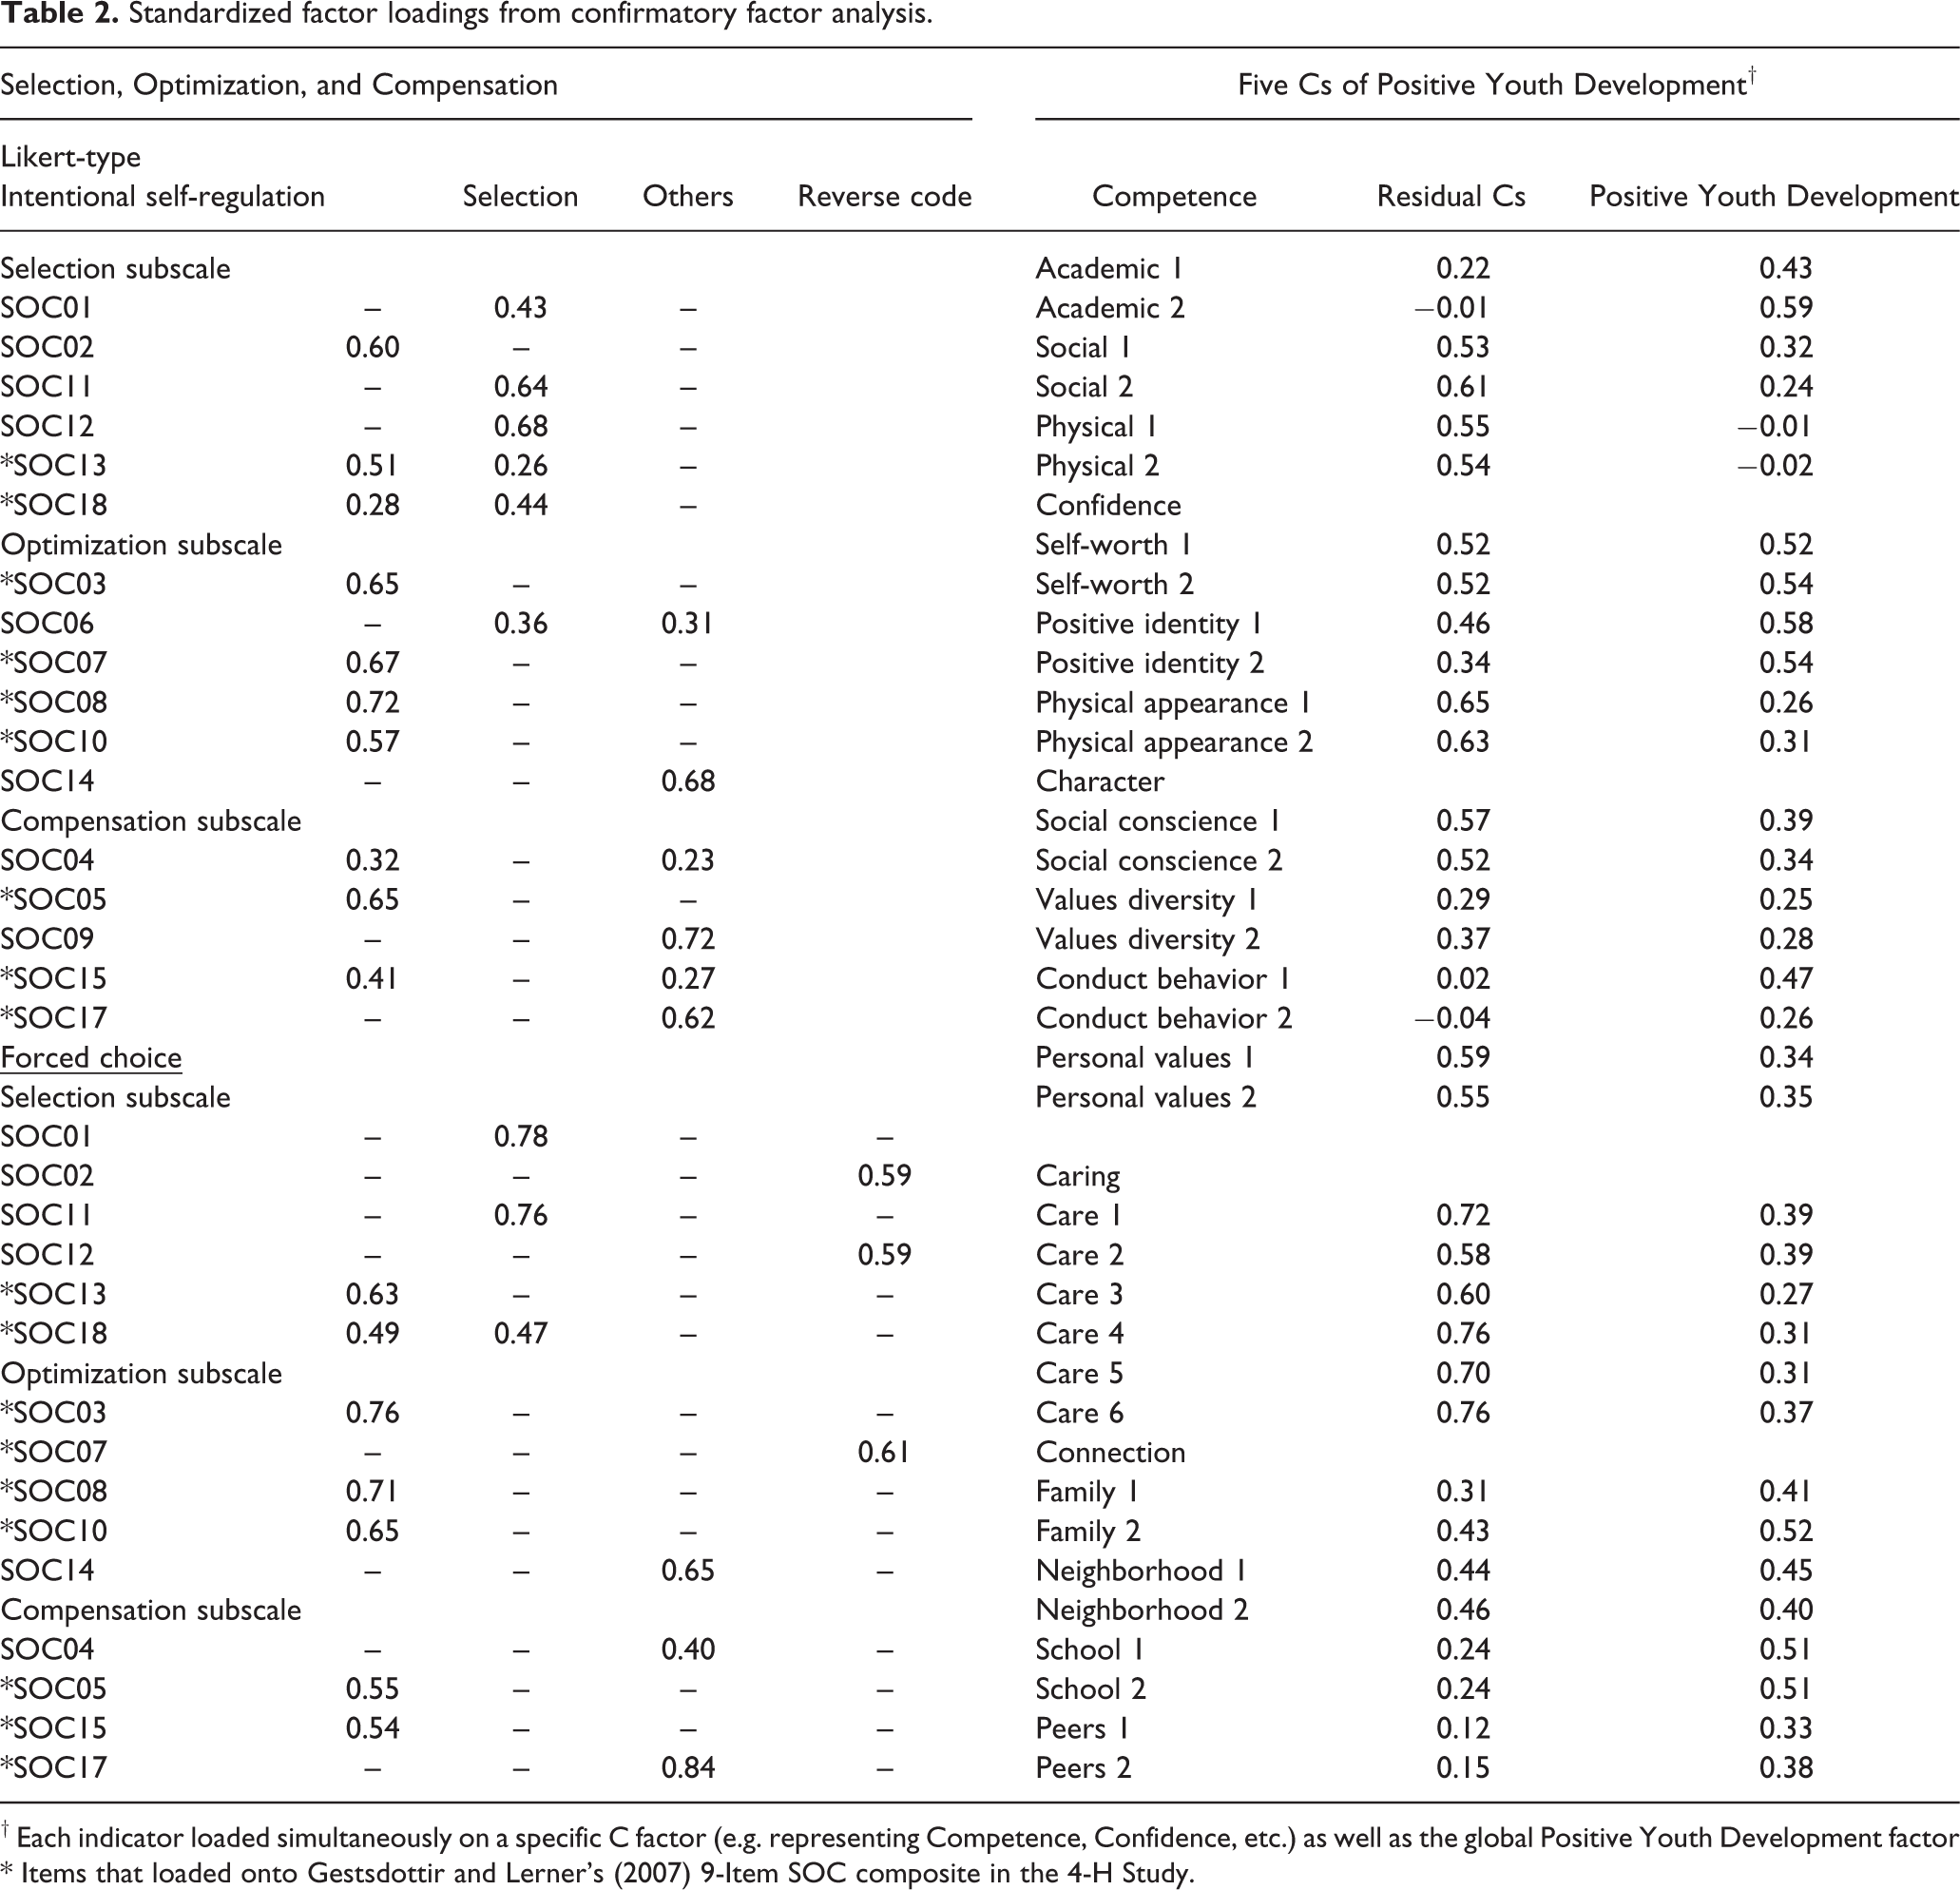
† Each indicator loaded simultaneously on a specific C factor (e.g. representing Competence, Confidence, etc.) as well as the global Positive Youth Development factor
* Items that loaded onto Gestsdottir and Lerner’s (2007) 9-Item SOC composite in the 4-H Study.
To compare the reliability of both measures, we first used the loadings from our final base CFA (without cross-measure equality constraints on the latent covariances) to compute composite reliability (ω) for each construct. Reliability of the Intentional Self-Regulation factor was .83 for the Likert-Type data and .82 for the binary data. The reliability of Selection was .75 for the binary version but .68 for the Likert-type measure. Finally, the reliability of the Modeling and Accepting Help from Others factor was .67 for the binary measure and .69 for the Likert-type measure.
We next converted ω for the Likert-type constructs into estimated SE(m)s. We compared these SE(m)s with information curves for each binary-indicated factor that had likewise been converted to an SE(m) metric. Curves for all constructs are included in Figure 2, which suggests that the SE(m)s derived from the Likert-type data’s reliability estimates were consistently lower than the SE(m)s derived from the IRT information curves, even at levels of theta (scores on the factor) that exhibited the greatest precision. That is, these plots suggest that the Likert-type data provided more precise estimates of the respective latent constructs than did the binary data.
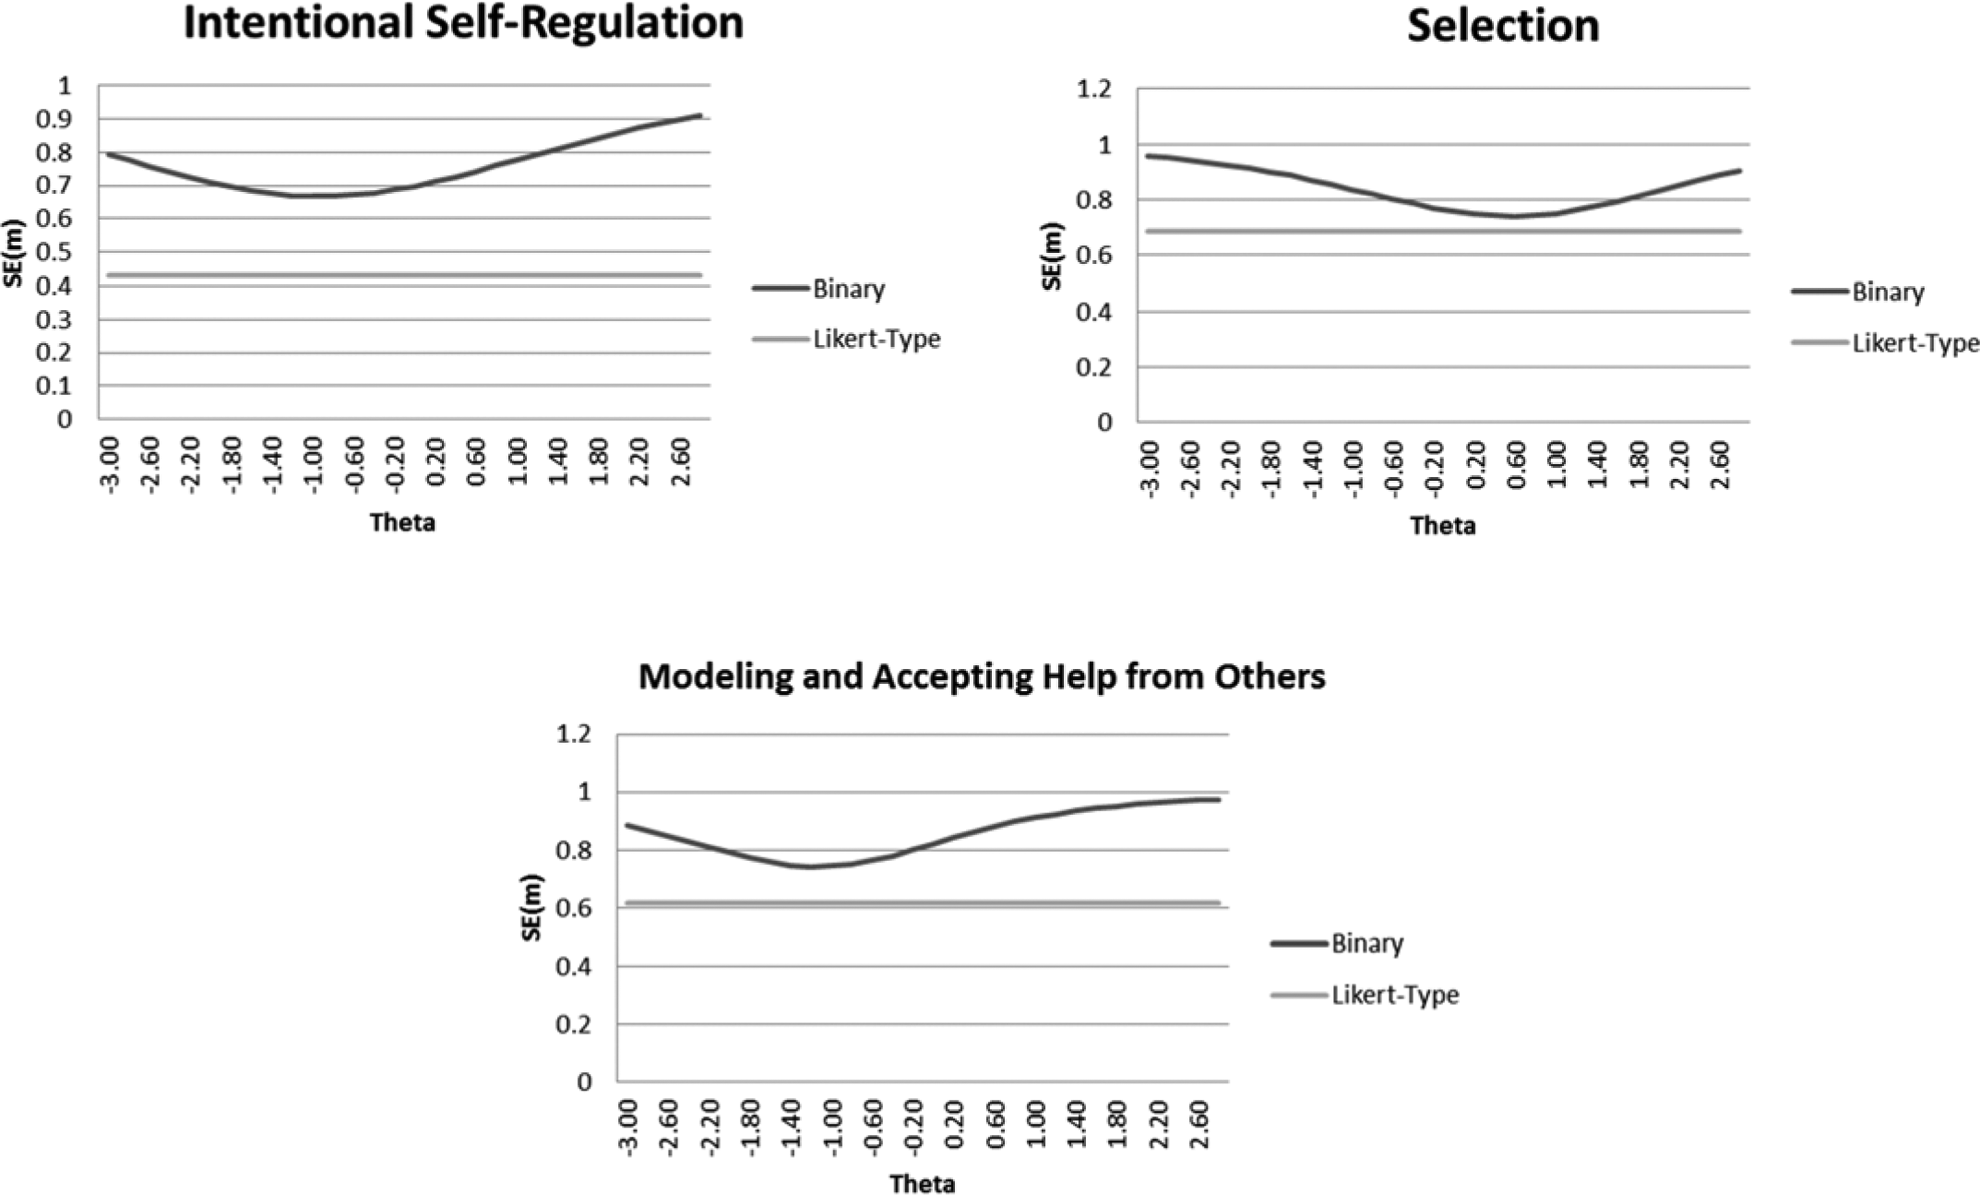
A comparison of each construct’s SE(m)s at various levels of theta (scores on the factor) as estimated by either reliability or information plots.
Criterion correlations
Using the above CFA as a baseline, we next equated latent criterion correlations between our Forced-Choice and Likert-Type versions of SOC (e.g. specifying the correlation between GPA and the forced-choice Intentional Self-Regulation factor to be the same as the correlation between GPA and the Likert-type Intentional Self-Regulation factor). We began by simultaneously equating all criterion correlations where the absolute difference between forms was less than .10 (14 total correlations). These constraints did not produce a meaningful decrease in model fit, Δχ2(14) = 14.07, p = .44. We next equated all latent criterion correlations where the absolute difference between forms was less than .13 (four total; Δχ2(4) = 13.05, p = .01), then equated subsequent latent correlations one or two at a time until equating the criterion correlation with the smallest absolute difference resulted in a significant change in model fit (at the α = .001 level). In the following results we highlight which criterion correlations were statistically equivalent across forms.
We present the correlations for this final CFA model in Tables 3 and 4. Table 3 lists the correlations between the SOC constructs and shows especially strong relations among the constructs indicated by Likert-type items, as well as a strong correlation between the two Intentional Self-Regulation factors. The two Modeling and Accepting Help from Others factors also displayed a strong positive correlation, although the two Selection factors only correlated moderately. Overall, this pattern of between-version correlations suggests that the two measurement approaches produced similar, but not identical, measures of ISR and Modeling and Accepting Help from Others, and produced somewhat dissimilar measures of Selection. The moderate correlation between the two Selection factors suggests that we must be especially careful when considering whether or not the two measurement approaches capture similar indices of goal selection.
Correlations among selection, optimization, and compensation constructs.
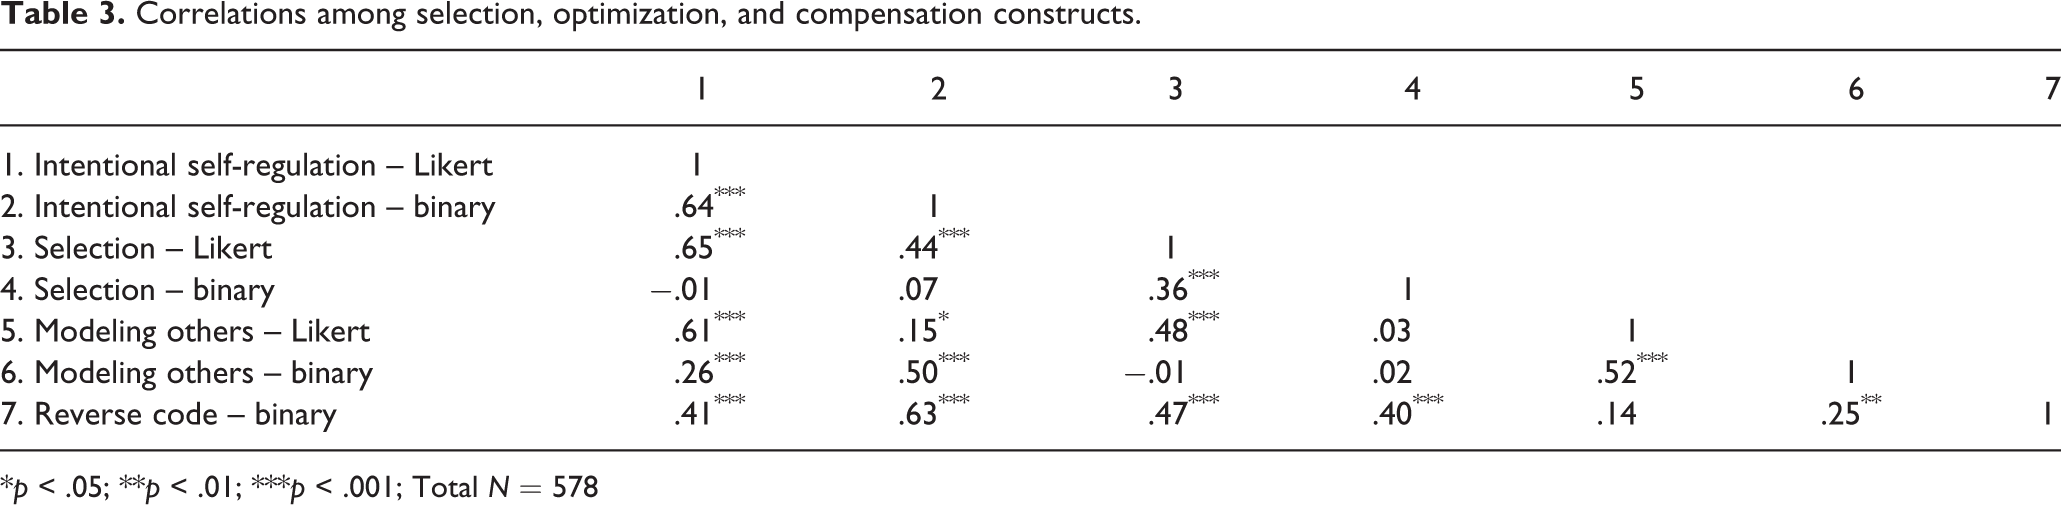
*p < .05; **p < .01; ***p < .001; Total N = 578
Criterion correlations.
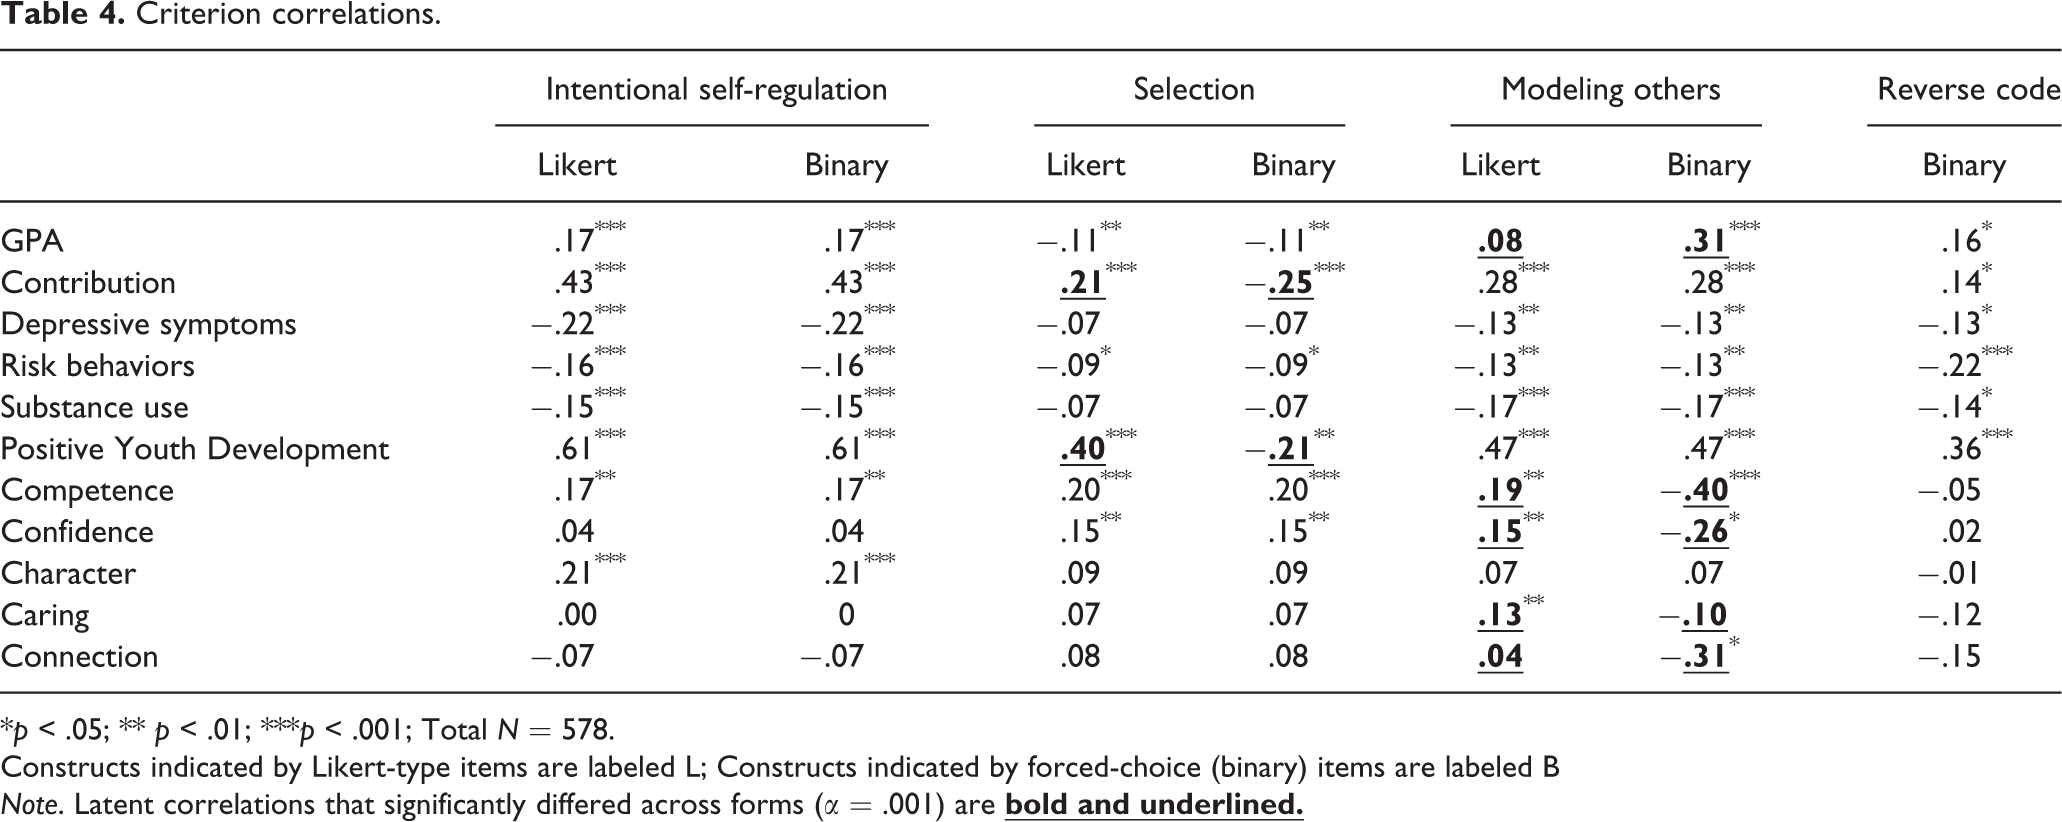
*p < .05; ** p < .01; ***p < .001; Total N = 578.
Constructs indicated by Likert-type items are labeled L; Constructs indicated by forced-choice (binary) items are labeled B
Note. Latent correlations that significantly differed across forms (α = .001) are
Table 4 presents the correlations between the SOC factors and all criterion measures. By and large, the criterion correlations could be equated across versions. In fact, we equated all criterion correlations for the global Intentional Self-Regulation factors and equated all but two criterion correlations for our Selection factors. Where criterion correlations for the Selection factors could not be equated (i.e., for Contribution and PYD), the construct indicated by Likert-type items displayed moderate to strong positive correlations with the criteria, whereas the construct indicated by forced-choice items displayed moderate negative correlations. Lastly, the Reverse-Coded Method Factor, which was indicated by two binary selection items and one binary optimization item in the final models, displayed weak positive correlations with both of these criteria.
The third set of latent correlations that we equated during this stage of analysis involved the factor representing participants’ willingness to accept help from or model others. We equated several criterion correlations across these two factors, although the criterion correlations with GPA and with most of the residual Cs were significantly different between the Likert-type and forced-choice formats. When indicated by Likert-type indicators, this factor correlated positively, but weakly, with the residual Cs and did not significantly correlate with GPA. When indicated by forced-choice items, the same factor displayed a moderate positive correlation with GPA, but moderate to strong negative correlations with three of the five residual Cs.
The reason for these differences is not immediately clear, as the observed results can be interpreted in several ways. For example, these results may suggest that at different levels of measurement precision the Modeling or Accepting Help from Others factor may be differentially related to aspects of positive development. This interpretation fails to account for the fact that the sign of the relations differed across versions of the questionnaire, however. It is also possible that the different relations are due to a nonlinear relation between this construct and the criterion that we have specified. Post-hoc analyses conducted to address this issue did not suggest a quadratic relation between the Modeling or Accepting Help from Others factor (indicated by Likert-type data) and either global PYD or the residual Five Cs, but this possibility deserves further investigation.
Finally, it is also possible that these results merely reflect social desirability bias, as suggested by previous research examining Likert-type versus forced-choice measurement of SOC (Stange, Freund, & Baltes, 2000, as cited in Freund & Baltes, 2002). If the Likert-Type data are indeed unduly influenced by social desirability, the shared variance between the Five Cs, the Likert-type measure, and social desirability may mask the otherwise negative relation between the Cs and the Modeling or Accepting Help from Others factor.
Maximum likelihood estimation with binary data
In a final stage of analysis we examined the forced-choice SOC items with covariance-based maximum likelihood. Thus, this model mirrored the previous CFA models, with the exception that the Likert-type measures of SOC were omitted and maximum likelihood estimation was used in an analysis that treated the forced-choice SOC items as continuous variables. The data requirements for, and computational complexity of, analyzing tetrachoric correlations presents one major drawback to the forced-choice response format of the SOC Questionnaire, and we conducted these analyses to better understand the impact of ignoring the binary structure of these data.
This CFA fit the data reasonably well, χ2(1266) = 2067.43 p < .001; RMSEA = .03, 90% C.I. (.03, .04); CFI = .93; TLI = .91, although one item did not significantly load onto its reverse-code construct. 2 Removing this item did not substantially impact model fit, i.e., χ 2(1213) = 1997.26 p < .001; RMSEA = .03 C.I. (.03, .04); CFI = .93; TLI = .92, and this item was omitted from all subsequent analyses. The factor loadings in this CFA were somewhat lower than in the parallel model that examined tetrachoric correlations, and, accordingly, the factors displayed substantially lower reliabilities than in the tetrachoric models (composite reliability for Intentional Self-Regulation = .65, Selection = .56, Modeling and Accepting Help from Others = .41). These results are consistent with Rhemtulla and colleagues’ (2012) simulation that suggests continuous data analyses can produce biased factor loadings when the number of response categories is small.
Despite the lower item reliabilities and differential manifestation of the Reverse-Code Method Factor, the criterion correlations observed in this model mirrored those observed in the model that analyzed tetrachoric correlations estimated from the same data. Equating all criterion correlations for the Intentional Self-Regulation, Selection, and Modeling or Accepting Help from Others factors to the values from the final tetrachoric correlation model resulted in a nonsignificant change in model fit (again using a Type-I error rate of .001; Δχ2(33) = 53.42, p = .01). Although far from definitive, this result suggests that the latent criterion correlations are not strongly impacted by the decision to use either of estimation approaches, despite the very different assumptions that each approach requires (and are also consistent with the simulation of Rhemtulla and colleagues, 2012).
Discussion
Intentional self-regulation has been associated with positive developmental outcomes across the life span (McClelland et al., 2010). Researchers often disagree on what, exactly, constitutes self-regulation, and on how specific aspects of self-regulation are best measured, however. Although the integration of multiple theories of agentic behavior may be a long-term goal for self-regulation research, cohesive integration assumes adequate measurement.
The SOC model has been applied to adolescence, but prior research suggests a lack of differentiation of the SOC factors in adolescents as old as 18 years (e.g. Gestsdottir, Bowers, Boyd, et al., in press; Geldhof, Bowers, Gestsdottir, et al., in press). Existing evidence, however, has almost entirely relied on the forced-choice version of the SOC questionnaire. The response format of this questionnaire presents potential difficulties. From a methodological standpoint, appropriate analyses for binary data are not well-understood by many developmental scientists. From a theoretical standpoint, adolescents may not see the forced choice options presented by the SOC Questionnaire as opposite ends of a single continuum.
Whether the evidence for an undifferentiated structure suggests that the adolescence-specific structure of intentional self-regulation also applies to late adolescence or is an artifact of measurement difficulties is therefore an unresolved question. In the present research we moved closer to answering this question by determining whether forced-choice and Likert-type versions of the SOC Questionnaire produced measures with equivalent factor structures, internal consistency, and criterion validity in a sample of late adolescents.
Our results suggested that both the forced-choice and Likert-type questionnaires produced similar factor structures, reliability estimates, and criterion validity, with the exception of the reverse-code method factor found with forced-choice items. In addition, treating Likert-type data as continuous produced moderately acceptable reliability estimates, but maximum likelihood analysis of the forced-choice data’s raw-metric correlation matrix produced unacceptably low reliability estimates. In terms of overall item quality, either the forced-choice or the Likert-type administrations therefore appear to be acceptable. The choice of measure largely depends on the sample in question and the analytical approach planned for the findings.
Despite these differences, the similarities in factor structure and reliability across the two types of the SOC measure align with our finding that the criterion correlations were roughly equivalent across all three sets of our analyses. These findings suggest that that the forced-choice and Likert-type response scales tap similar constructs. We can therefore tentatively conclude that social desirability bias likely did not negatively impact the criterion validity of our Likert-type data, but we must also conclude that the Likert-type administration format did not add substantially to the overall scale’s criterion validity. The major exception to these general findings was the markedly different correlations between the 5 Cs of PYD (residualized to control for global PYD) and the constructs representing participants’ willingness to model and accept help from others. The binary version of the selection scale also correlated negatively with contribution and overall PYD, whereas the selection construct indicated by Likert-type items correlated positively with these constructs. As we speculated above, these surprising results may indicate a wide variety of phenomena, ranging from measurement precision to the possibility of a non-linear relation between these constructs. Little existing evidence supports the existence of the modeling and accepting help form others factor in the SOC Questionnaire, and it is also possible that this factor is specific to this sample. Thus, future research is needed to better understand these relations and the potential importance of the modeling and accepting help from others factor and the selection factor in independent samples.
In terms of construct validity, however, the Likert-type data produced a more parsimonious factor structure. The forced-choice data produced either one or two reverse-coded method factors (depending on the estimation used), which suggests that reverse-coded items should be omitted from any forced-choice administrations of the SOC Questionnaire. However, after accounting for differences in whether reverse-coded items formed separate factors, our analyses found sufficiently similar factors in each set of analyses. Thus, we can suggest that both administration formats will display sufficiently equal levels of construct validity in future datasets, provided all reverse-coded items are omitted from the forced-choice version.
Taken as a whole, these results therefore provide initial evidence that the forced-choice and Likert-type measures tap roughly equivalent latent constructs. Interpreted in light of this finding, existing evidence for an undifferentiated SOC factor structure across adolescence is not likely due to measurement-related issues. The data instead suggest an adolescence-specific structure that extends into late adolescence and must be explored in future research.
When measuring adolescent self-regulation in future research, our results suggested that the choice between a Likert-type and a forced-choice administration of the SOC Questionnaire depends largely on the analyses a researcher wishes to perform. If a researcher plans on collecting data from small- to moderately-sized samples, or if he or she intends on running traditional parametric analyses such as multiple regressions or ANOVAs, then we would caution against the forced-choice format. When analyzed as if the data were continuous (which is an assumption of traditional statistics) we obtained very low reliability estimates for the forced-choice data. For smaller samples or traditional analyses we instead suggest a Likert-type version, which produced acceptable reliability estimates (indicating that using scale scores would be appropriate) and displayed both construct and criterion validity.
From a practical point of view, there is also considerably less text in the Likert-type version of the SOC questionnaire. Less text could be beneficial by reducing participant fatigue when administering long surveys or when including respondents with reading difficulties. Furthermore, the Likert-type version presumably is less cognitively demanding and might therefore be more appropriate in early adolescence. More research is needed on the effects of different representations of the SOC questionnaire for young adolescents.
Limitations
Prior research has suggested that the SOC Questionnaire’s forced-choice format reduces the correlations between the SOC processes and indices of social desirability (Stange, Freund, & Baltes, 2000, as cited in Freund & Baltes, 2002). As previously explained, some evidence suggests that items used to measure social desirability bias may represent self-control behaviors, which can be seen as a component of self-regulation (Uziel, 2010). The extent and nature of the overlap of these two constructs is still debated, however. The strongest limitation to the present study is therefore that we did not include a measure of social desirability and empirically test the relations between social desirability and SOC in our analyses. Although the criterion correlations for our Likert-type SOC data did not appear to be attenuated when compared to those for the forced-choice SOC data, additional empirical research would inform whether social desirably scales are related equally to the binary and Likert-versions of the SOC measure. Previous research found a significant positive correlation between social desirability and a forced-choice measure of SOC (Geldhof et al., 2012), and further examination of how social desirability relates to different administrations of the SOC Questionnaire would additionally inform an understanding of the relations between social desirability and self-regulation.
Our study is also limited in regard to generalizability. Our sample was a relatively homogenous group of primarily female college-aged participants, although the present study included participants from across the United States (i.e., not from a single university’s psychology subject pool). It is not clear that our findings will replicate in samples of different ages or in different contexts, which suggests the need for extension and replication of our results.
Similarly, our results suggest generally poor differentiation of the SOC processes. We did not find clear Selection, Optimization, and Compensation factors in either our Likert-type or forced-choice data. These findings replicate the results obtained from earlier waves of the 4-H Study (e.g. Geldhof, Bowers, Gestsdottir, et al., in press) and from a recent study with adolescent samples from four cultures (Gestsdottir, Geldhof, et al., in press), but our findings may not replicate in samples where greater differentiation is observed, such as would be expected in older samples. For instance, our sample consisted largely of college students, and a more heterogeneous sample may have produced more heterogeneous data that would be better represented by a tripartite factor structure. Such heterogeneity could differentially impact the correlations between criterion constructs and the elements of SOC, when the SOC Questionnaire is scaled using either a Likert-type or forced-choice format. These results therefore underscore the limited nature of the field’s understanding of self-regulation processes and their development during late adolescence and the transition to adulthood.
Last, we did not consider changes in how the SOC questionnaire was worded (except where necessary to convert the existing forced-choice items to a Likert-type format). The processes of goal selection, optimization, and compensation are necessarily domain specific (e.g. selection of social goals vs. selection of academic goals; Geldhof et al., 2012), but the SOC questionnaire is worded in a way that taps domain-general processes (e.g. “I think about exactly how I can best realize my plans”). Adolescents may respond differently to abstract vs. domain-specific items, and it is unclear how the abstract nature of the considered items might have impacted the factor structure and criterion relations that we observed.
Conclusions
In sum, our findings suggest that forced-choice and Likert-type formats of the SOC Questionnaire are acceptably interchangeable. A researcher may find the traditional forced-choice format of the SOC Questionnaire undesirable for any number of reasons, ranging from statistical to practical, and for these instances we show that a Likert-type administration is useful. Such an administration format will make the SOC Questionnaire more widely accessible and, in the long term, may encourage researchers to more fully integrate the field’s understanding of SOC with its knowledge of other self-regulation processes across the life span.
Footnotes
Notes
Funding
This research was supported in part by a grant from the National 4-H Council.