
Abstract
The purpose of the study was to evaluate bidirectional associations between peer acceptance and both emotion and effortful control during kindergarten (N = 301). In both the fall and spring semesters, we obtained peer nominations of acceptance, measures of positive and negative emotion based on naturalistic observations in school (i.e., classroom, lunch/recess), and observers’ reports of effortful control (i.e., inhibitory control, attention focusing) and emotions (i.e., positive, negative). In structural equation panel models, peer acceptance in fall predicted higher effortful control in spring. Effortful control in fall did not predict peer acceptance in spring. Negative emotion predicted lower peer acceptance across time for girls but not for boys. Peer acceptance did not predict negative or positive emotion over time. In addition, we tested interactions between positive or negative emotion and effortful control predicting peer acceptance. Positive emotion predicted higher peer acceptance for children low in effortful control.
Social relationships, emotion expression, and self-regulation are intricately related (Sroufe, Schork, Motti, Lawroski, & LaFreniere, 1984). An accumulating body of literature indicates that individual differences in emotionality and self-regulation are related to early social functioning and adjustment (Eisenberg, Smith, & Spinrad, 2011; Rothbart & Bates, 2006). Furthermore, children’s social and emotional adjustment during the transition to school has implications for later developmental trajectories (Denham, Bassett, Thayer, et al., 2012; Rimm-Kauffman & Pianta, 2000). Kindergarten is often children’s introduction to formal schooling, which likely requires increased expectations for self-regulation, as well as a critical time when self-regulation is still developing (Ponitz, McClelland, Matthews, & Morrison, 2009). Thus, examination of concurrent and longitudinal relations of emotions or self-regulation to social relationships in kindergarten can provide insight to the early development of social competence during this key transition to schooling.
In school, interacting with peers likely provides children with opportunities to expand their social competence and relationship skills (Ladd, 2005; Rubin, Bukowski, & Parker, 2006). Relations between children’s expression of emotions or self-regulation and the development of positive social relationships probably are bidirectional. Although reciprocal relations have sometimes been examined empirically in longitudinal designs with repeated measures assessed annually (e.g., Dill, Vernberg, Fonagy, Twemlow, & Gamm, 2004; Sallquist, DiDonato, Hanish, Martin, & Fabes, 2012), we were interested in examining reciprocal relations within the span of a school year, a period during which a child’s classroom and its peer composition are fairly constant (rather than typically changing considerably from one grade to the next, which might affect children’s relationships with peers). Thus, the purpose of this study was to examine concurrent and longitudinal associations of emotional expression and self-regulation with peer relationships during kindergarten – a critical transition year in schooling.
Peers, Emotions, and Self-regulation in Childhood
Theoretical propositions on the association between emotions and social relationships abound. Beckes and Coan (2011) proposed that social interaction is a “baseline condition” for humans to sustain a state of calmness, whereas social rejection may elicit stress and negative emotion responses. From this viewpoint, interacting with and being accepted by peers fulfill the child’s baseline need to relate with peers, which promotes regulation, prompts the capacity to express positive emotions, and deters negative emotional expression. Also, consistent with the need-to-belong hypothesis (which proposes that having an attachment to others is a basic necessity; Baumeister & Leary, 1995), children initially well-liked by peers, as a result of their adaptation, may enjoy the commodity of higher social status and further develop their self-regulatory and social skills. Other work suggests that poor quality school-based relationships, including peer relationships, elicit children’s distress or frustration (Juvonen, 2006). These theoretical stances all suggest that peer acceptance promotes self-regulatory capacities and positive emotions, as well as deters negative emotional expression.
Emotions may also encourage approach behaviors that serve to initiate or invite interactions from others (Fredrickson, 2001; Lyubomirsky, King, & Diener, 2005). For example, children who experience and express more positive emotions are thought to be friendlier, more assertive, and exhibit lower aggression, which may assist in the development of social relationships as well as in the initiation and regulation of social exchanges (Denham, McKinley, Couchoud, & Holt, 1990). From this perspective, positive emotion, especially if appropriately regulated, can promote peer acceptance. Similarly, negative emotion expression, as well as low self-regulation, may be inversely associated with peer acceptance because it is associated with social withdrawal, inappropriate behavior, or approach to conflict (Saarni, Campos, Camras, & Witherington, 2008). Children with low self-regulation may be quicker to engage in conflict with peers and be less liked by peers. However, these associations may be contingent on factors discussed later (e.g., effortful control, gender).
Peer Acceptance and Emotions: Empirical Findings
Some researchers have found positive associations between children’s expression of positive emotions and social status with peers, friendship quality, and social competence (Denham, Bassett, Mincic, et al., 2012; Denham et al., 2003; Doughtery, 2006; Putnam, 2012; Sallquist et al., 2012; Shin et al., 2011). Children who are more positive are more likely to be prosocial, engaging, and better liked by peers. For example, preschoolers displaying positive emotion are less likely to show reticent play over time (i.e., not playing/involved with peers; Spinrad et al., 2004) and exhibit higher social competence at school (Sallquist et al., 2012). In other work, however, positive emotion did not significantly predict sociometric status, even though it was correlated within time (Sroufe et al., 1984). Thus, examining possible bidirectional associations between peer acceptance and positive emotion can help clarify whether these associations are intermittent or show patterns across the school year.
Negative emotions, in contrast, have been associated with social withdrawal or approach to conflict (Eisenberg, 2000b; Saarni et al., 2008). Children who exhibit more negative emotion tend to exhibit higher levels of aggression and non-constructive behaviors than their less negative peers (Eisenberg, Fabes, Nyman, Bernzweig, & Pinuelas, 1994), and aggressive behaviors have been associated with higher rates of peer exclusion and rejection at school (Tremblay, Hartup, & Archer, 2005). Displays or reports of negative emotion have also been positively associated with more time spent in solitary play (Fabes, Hanish, Martin, & Eisenberg, 2002) and victimization by peers (Hanish et al., 2004). Negative emotions have also been negatively related to being liked by peers and social competence (e.g., Eisenberg, Liew, & Pidada, 2004; Jones, Eisenberg, Fabes, & MacKinnon, 2002; Maszk, Eisenberg, & Guthrie, 1999; Miller, Kiely Gouley, Seifer, Dickstein, & Shields, 2004; Murphy, Shepard, Eisenberg, & Fabes, 2004; Zhou, Eisenberg, Wang, & Reiser, 2004; Zhou, Main, & Wang, 2010). Thus, negative emotions seem to predict lower peer relationship quality, perhaps in part due to peers’ reactions to children’s negative emotions.
Although we are not aware of research examining whether peer relationships predict later negative emotions, some research has demonstrated that problematic peer relationships positively predict later internalizing emotion that include negative emotion components (Bornstein, Hahn, & Haynes, 2010; DeRosier, Kupersmidt, & Patterson, 1994; Dill et al., 2004; van Lier et al., 2012). Also, in a meta-analysis examining longitudinal studies of peer victimization and internalizing symptoms, Reijntjes, Kamphuis, Prinzie, and Telch (2010) found support for a bidirectional association. On the basis that negative emotions are closely related to internalizing symptoms, there may be a bidirectional association between peer relationship quality and negative emotions (although arguably experiencing negative emotions is more normative than experiencing internalizing symptoms). Furthermore, negative emotions displayed in school may be particularly relevant for acceptance with peers at school. We were interested in examining the association between common negative emotions and peer acceptance at school across time.
Peer Acceptance and Effortful Control
There is also some evidence that poor peer relationships among first and third graders negatively predict later dispositional self-regulation, that is, effortful control (Iyer, Kochenderfer-Ladd, Eisenberg, & Thompson, 2010) – “the ability to inhibit a dominant response and/or to activate a subdominant response, to plan, and to detect errors’’ (Rothbart & Bates, 2006, p. 129). Favorable social interactions more generally, including those with adults, also appear to promote self-regulation (Eisenberg, Cumberland, & Spinrad, 1998; Morris, Silk, Steinberg, Myers, & Robinson, 2007). Thus, peer acceptance may promote children’s effortful control. However, effortful control, which is likely to result in emotion regulation and socially appropriate behavior, may also be associated with later peer acceptance. For example, there is some evidence that effortful control is associated with children’s peer acceptance (Maszk et al., 1999), as well as with social competence (Eisenberg et al., 2004; Miller et al., 2004; Raver, Blackburn, Bancroft, & Torp, 1999; Valiente, Lemery-Chalfant, Swanson, & Reiser, 2008; Zhou et al., 2010) and prosocial/sympathy tendencies (Eisenberg, 2000a), concurrently and across time.
Conditional Mechanisms for the Association between Peer Acceptance and Emotions
Besides the main effects between emotion or self-regulation and peer acceptance, there are reasons to suggest that individual differences in self-regulation (Eisenberg, Eggum, Sallquist, & Edwards, 2010; Eisenberg, Spinrad, & Eggum, 2010) and sex (Jones et al., 2002; Ladd, 2005; Martin, Fabes, & Hanish, 2014; Stormshak et al., 1999) moderate the relations of emotionality to social competence.
Emotion-relevant Regulation, Emotion, and Peers
Unregulated displays of emotion and behavior would be expected to be less appropriate than regulated displays and, hence, undermine the quality of social interactions. Researchers have found that self-regulatory abilities, including effortful control, moderate the association between emotional intensity or frequency and social competence (Eisenberg, Eggum, et al., 2010; Eisenberg, Spinrad, et al., 2010). Negative emotional intensity often predicts maladjustment, particularly among children who exhibit lower levels of effortful control (e.g., Eisenberg, Fabes, Guthrie, & Reiser, 2000). For example, Moran, Lengua, and Zalewski (2013) found that, among 36–40-month-olds, the frequency and intensity of fear or frustration were positively related to externalizing symptoms for children with low and/or moderate – but not high – effortful control. However, the interaction between anger/frustration or negative emotion and effortful control did not predict social skills (which are related to, but not the same as, peer-nominated acceptance; Moran et al., 2013) or prosocial behaviors (reported by mothers/teachers; Rydell, Berlin, & Bohlin, 2003). Furthermore, Belsky, Friedman, and Hsieh (2001) found that among 15- to 36-month-olds, negative emotionality negatively predicted social competence (e.g., empathy, cooperation) only for children low in regulation (i.e., attention focusing/shifting).
Although most researchers testing the moderating role of effortful control have examined negative emotion, positive emotions have been proposed to predict adjustment, particularly among children who exhibit low effortful control, because children with higher effortful control are generally well adjusted regardless of their emotionality (Eisenberg, 2000a; Rydell et al., 2003). However, we found only one empirical study that examined interactions between positive emotion/exuberance and regulation when predicting early social competence (Rydell et al., 2003); the interactions did not predict either parents’ or teachers’ reports of children’s prosocial behavior. Furthermore, to our knowledge, no researchers have examined moderation of effortful control when predicting the association between emotion and peer-reported acceptance. Moreover, most measures of social competence have been based on reports from teachers or parents and, although informative, peer reports may provide a different perspective on peer relationship dynamics.
Gender Norms, Emotion, and Peers
Research suggests that boys and girls establish and engage with their peer groups differently and that distinct factors could sometimes predict girls’ and boys’ peer liking. Beginning in preschool and kindergarten, children tend to form same-sex peer networks (Ladd, 2005; Martin et al., 2014). Children also show early patterns of play preferences; for example, boys form larger peer networks and play at greater distances from adults than girls (Ladd, 2005). These different peer patterns may set the stage for different behavioral norms for boys and girls.
Because boys show more dominance-related behaviors in their peer play (Ladd, 2005), expressing more negative emotion (used to establish dominance) may be less detrimental to their peer status than for girls. Furthermore, boys tend to play in larger peer networks compared to girls. Thus, boys may be less affected by negative emotion displays because emotions could be (a) normative in an environment of competition and dominance and/or (b) diffused because of their larger peer networks. Girls, however, play in smaller groups of peers and their play is characterized by more communal interaction styles compared to boys (Ladd, 2005; Martin et al., 2014). Thus, negative emotion displays may come at a higher cost to peer acceptance for girls than for boys. Some research suggests, for example, that girls, but not boys, who were more aggressive were less liked by peers (Stormshak et al., 1999). Aggression, a behavior characterized by negative emotion, may be less normative (and thus less socially accepted) among girls, particularly at an early age when same-sex peer networks are salient. Furthermore, gender stereotypes in school or in the home may further reinforce children’s expectations of girls’ and boys’ emotion expression. Also, girls and boys generally display similar levels of positive emotion (Else-Quest, Hyde, Goldsmith, & Van Hulle, 2006); it is likely that positive emotion is beneficial for both boys’ and girls’ peer relationships (e.g., for engaging peers). In brief, due to different gender-related expectations (Ladd, 2005; Martin et al., 2014) and positive emotion trends among boys and girls (Else-Quest et al., 2006), negative displays of emotion might be viewed as especially problematic for girls, whereas displaying positive emotions may be expected and valued for both sexes.
Empirically, there is mixed evidence regarding gender differences in associations between emotion-related factors and peer relationships. Some researchers have found no gender differences (Doughtery, 2006; Murphy et al., 2004; Schultz, Izard, Stapleton, Buckingham-Howes, & Bear, 2009), whereas others have found that the relations between negative emotions or behaviors and social competence were stronger for girls than boys (Jones et al., 2002; Stormshak et al., 1999), or that boys’, but not girls’, anger or sadness observations were negatively correlated with social competence (Jones et al., 2002; Walter & LaFreniere, 2000). Thus, we examined possible differences between boys and girls in the associations between peer acceptance and both effortful control and emotions.
The Present Study
To summarize, in the present study we examined whether peer acceptance was associated with effortful control, negative emotions, and positive emotions across kindergarten. We also examined the moderating roles of effortful control and gender in the examined associations. We used multi-informant reports from observers and peers and observations of emotions expressed in school. We also examined moderation of these relations by gender and effortful control, and controlled for children’s age, ethnicity, and family socioeconomic status (SES) because of their relations to peer acceptance (Pettit, Bates, & Dodge, 1997; Rubin et al., 2006). Moreover, we used a short-term longitudinal design based on measures assessed in the fall and spring semesters of kindergarten.
Based on the research reviewed, we expected that peer acceptance would be positively associated with later effortful control, and vice versa. We also expected that positive emotions would be positively related, and negative emotions negatively related, to later peer acceptance, and vice versa. Moreover, we expected that the association between emotions and peer acceptance would be moderated by effortful control and the association would be strongest under conditions of low effortful control. Also, if gender differences were present, emotional expressivity, particularly negative emotions, was expected to relate more strongly to peer acceptance for girls than boys.
Method
Participants
Participants were kindergarteners (N = 301, 52% girls, Mage = 5.5 years) recruited from 26 classrooms over two years (one year apart) at five schools in a southwestern US metropolitan area (26 of 29 classroom teachers accepted participation). Families were invited to participate during parent–teacher meetings, during curriculum nights, and via teacher newsletters and invitation letters sent in student backpack mailings. Of 541 children in the 26 classrooms, 301 of children provided consent and participated in the current study; an additional 34 contributed to peer nominations (and 38% of children in the 26 classes [i.e., 206 children] did not participate in the any portion of the study). The recruitment rate in this study (301 children or 56% of the potential sample) is typical of similar studies of young children (e.g., McClelland et al., 2007). Participating children in the main study were 52.82% Hispanic, 34.22% White, 2.66% Asian, 1.99% American Indian/Alaska Native backgrounds, 1.99% Black, .67% other, and 5.65% unknown. Parents varied in education (for mothers and fathers, respectively, 30% and 39% earned a high school degree or less, 31% and 24% attended some college, and 39% and 37% graduated from college) and household income (M = US$50,000–69,999, ranging from less than US$9999 to US$100,000+).
Procedure
Measures included naturalistic observations of students’ positive and negative emotion displayed at school; observers’ ratings of children’s positive/negative affect (i.e., positive, sadness, anger) and effortful control; and peers’ ratings of peer acceptance. Prior to rating child interactions in participating schools, observers received several weeks of training, which included rating child interactions in pre-coded videos and/or in pilot preschool settings. During these training sessions, observers received instruction on how to code children’s emotions. In the field, checks were made on a bi-weekly basis for agreement with the coding supervisor.
A separate group of research assistants (trained for 5 weeks) collected information on peer acceptance each semester. Data collection sessions were conducted during school in a designated schoolroom so that distractions were minimized. After data collection sessions, children received two small toys for their participation.
Measures
Peer Acceptance
Peer acceptance was assessed using peer nominations from participating children (N = 301) in the fall and spring semesters. An additional 34 peers provided peer nominations in the fall but were not part of the larger study. Each child was seen individually and asked to identify three classmates with whom they play with the most. Each child was told his/her replies would be treated confidentially and was asked not to discuss the interview with their peers. Nominations were scored based on the order selected (3 = first, 2 = second, 1 = third, 0 = no nomination). Scores were summed, divided by the number of raters (Mfall = 12.46 raters per child; Mspring = 10.64 raters per child), and standardized within class for fall and spring semesters. A higher score on this composite represents being nominated more as a playmate. Previous studies have established the stability and reliability of measures obtained through similar procedures (Boulton & Smith, 1994; Maszk et al., 1999).
Effortful Control
Effortful control was rated with the short version of the Children’s Behavioral Questionnaire (CBQ; Putnam & Rothbart, 2006) at the end of fall and spring semesters by two or three coders who had observed children for 9–12 weeks. Some items in the CBQ were modified to reflect appropriate wording for children’s behavior in the classroom (e.g., “Tends to become sad if the family’s plans don’t work out” was modified to “Tends to become sad if plans don’t work out” in the current study). Previous studies have used teacher reports of the CBQ (e.g., Eisenberg et al., 1997), supporting the use of the measure in the school context, and observer reports of similar temperament-related measures (e.g., Taylor et al., 2013, used observer reports of attention and persistence). Attention focusing (e.g., “When drawing or coloring in a book, shows strong concentration,” five items: αs = .95 in fall and spring) and inhibitory control (e.g., “Is good at following instructions,” four items: fall and spring αs = .93) were reported (1 = extremely false; 7 = extremely true), and were significantly correlated in the fall and spring semesters (fall and spring rs = .90). Scores were averaged across reporters for attention focusing and inhibitory control within each semester.
Positive Emotion
The observers also rated the intensity, frequency, and duration of children’s real-life positive emotions exhibited in school (i.e., classroom, art lab, music lab, library class, lunch/recess) for 9–12 weeks (depending on the number of children in the class) in the fall and spring semesters. Positive emotion refers to expressions of happiness, joy, excitement, amusement, pride, positive anticipation, and awe, as demonstrated by smiles, cheeks raised, eyes squinted in an intense smile or wide and bright when excited or joyful, jumping up and down, and chest and head up and upbeat tone and/or laughter (0 = no evidence of emotion; 3 = strong evidence of emotion). Reliability ratings were obtained from a set of pre-coded videos (which were only used for reliability purposes for the second cohort of children) and randomly selected live observations with a supervisor across the fall (Totaltime = 1907 min) and spring semesters (Totaltime = 1768 min). Interobserver reliabilities assessed with intraclass correlations coefficients (ICCs) were .96 (fall) and .97 (spring) for positive emotion. For each child, observers’ ratings were averaged across all positive emotion observations by semester and location to account for overall emotion expressed in school: fall classroom (Mtime-observed = 41.13 min, SDtime-observed = 13.10 min), fall lunch/recess (Mtime-observed = 19.91 min, SDtime-observed = 7.37 min), spring classroom (Mtime-observed = 46.07 min, SDtime-observed = 13.23 min), and spring lunch/recess (Mtime-observed = 26.67 min, SDtime-observed = 7.95 min).
At the end of each semester, the same observers who rated the 30 s segment observations throughout the semesters also rated (1 = very slightly/not at all; 5 = extremely) the extent to which children expressed positive affect (10 items, e.g. enthusiastic, happy; adapted from Larsen & Diener, 1992) and these scores were averaged across observers of each child within semester (fall/spring αs = .94 and .94). The measures of positive emotion (i.e., observed positive emotion in the classroom, during lunch/recess, and the positive affect scale) were significantly correlated in the fall (rs = .44 to .52) and spring (rs = .43 to .58) semesters.
Negative Emotion
Using the same general procedures, observers (two or three per child) rated the intensity, frequency, and duration of children’s negative emotions exhibited in the classroom (i.e., classroom, art lab, music lab, library class) in the fall and spring semesters, two to three times a week (typically for several hours). Negative emotion refers to expressions of anger, frustration, sadness, fear, and anxiety, as demonstrated by pouted lips, lips downturned in a frown (sadness), furrowed brows (anger), or brows raised (fear), and behaviors such as crying, emotionally knocking things over, and biting nails as well as vocal tone (e.g., slow and gentle sighs for sadness) and posture (e.g., freezes or jerks suddenly for fear/anxiety). Observers had a list of participants for each class and rated children’s emotions (0 = no evidence of emotion; 3 = strong evidence of emotion) in 30 s segment observations (children were not coded again until the entire list of children, if present, were coded). Reliability assessed across the fall (Totaltime-coded = 1907 min; ICC = .96) and spring semesters (Totaltime-coded = 1768 min; ICC = .97) was very good. For each child, observers’ ratings were averaged across all negative classroom emotion observations in the fall (Mtime-observed = 39.66 min, SDtime-observed = 14.45 min) and spring (Mtime-observed = 46.07 min, SDtime-observed = 13.24 min). Although negative emotions in school outside the classroom (e.g., lunch/recess) were observed and coded, this measure had a low standardized factor loading in the fall (less than .30) and, thus, was not included in latent factor estimates.
Sadness and anger were assessed with the short version CBQ (Putnam & Rothbart, 2006) at the end of the fall and spring semesters, by the same observers who rated the 30 s segment observations throughout the semesters. Some items in the CBQ were modified to reflect appropriate wording for children’s classroom behaviors (e.g., “Becomes upset when loved relatives or friends are getting ready to leave following a visit” was modified to “Becomes upset when loved relatives or friends are getting ready to leave”). Sadness (e.g., “Cries sadly when a favorite toy gets lost or broken,” eight items: fall α = .90, spring α = .90) and anger (e.g., “Throws a fit when s/he doesn’t get what she/he wants,” four items: fall α = .94, spring α = .92) were rated (1 = extremely false; 7 = extremely true) by observers at the end of the fall and spring semesters and these scores were averaged by semester. The measures of negative emotion (i.e., observed negative emotion in the classroom, observer reports of sadness, and observer reports of anger) were significantly correlated in the fall (rs = .37 to .71) and spring (rs = .44 to .70) semesters.
Covariates
Age (M = 5.5 years, SD = 0.34 years), ethnic minority status (1 = minority [i.e., Hispanic, Asian, American Indian/Alaska Native, Black, or other]; 0 = white, non-Hispanic), sex (1 = boy; 0 = girl), and SES (composite of standardized family income and the average of parent education [standardized]) were used as control variables.
Results
Descriptive Statistics
Table 1 provides the descriptive statistics for the variables used as indicators for latent and manifest variables. On average, observers rated girls as more negative (M = .06, SD = .07) than boys (M = .04, SD = .04) in spring classroom observations. Marginally significant differences were also found. Spring sadness was higher for girls (M = 2.72, SD = .77) than boys (M = 2.54, SD = .79) and fall attention focusing was higher for girls (M = 5.31, SD = 1.03) than boys (M = 5.08, SD = .99). No other gender differences were found.
Descriptive statistics of study variables and mean differences between boys and girls.
Note. Sex (Girl = 0; Boy = 1); ethnic minority (Minority = 1; non-Hispanic, White = 0); socioeconomic status (family income and average parent education).
Preliminary Analyses
Confirmatory Factor Analysis
Before testing our proposed models, we evaluated the measurement properties of our study variables in a structural equation modeling (SEM) framework using Mplus v7.11 (Muthén & Muthén, 1998–2014). To account for the clustering of data by classroom and missing data, we used the ‘Type = Complex’ command and full information maximum likelihood (FIML) estimation with robust standard errors (MLR). FIML uses all available data and produces more reliable results compared with listwise or pairwise deletion (Widaman, 2006).
The confirmatory factor analysis (CFA) with all latent and manifest variables showed acceptable fit to the data: MLR χ2 (106) = 226.74, p < .001, CFI = .95, RMSEA < .06, 90% CI [.05, .07]. Effortful control, composed of two indicators (i.e., attention focusing and inhibitory control), had significant standardized factor loadings in the fall (.94–.95) and spring (.94–.96). Negative emotion, composed of three indicators (i.e., rated sadness, rated anger, observed negative emotion in class), had significant standardized factor loadings in the fall (.43–.95) and spring (.56–.95). Positive emotion, composed of three indicators (i.e., rated positive affect, observed positive emotion in class, observed positive emotion in lunch/recess), had significant standardized factor loadings in the fall (.58–.77) and spring (.63–.83).
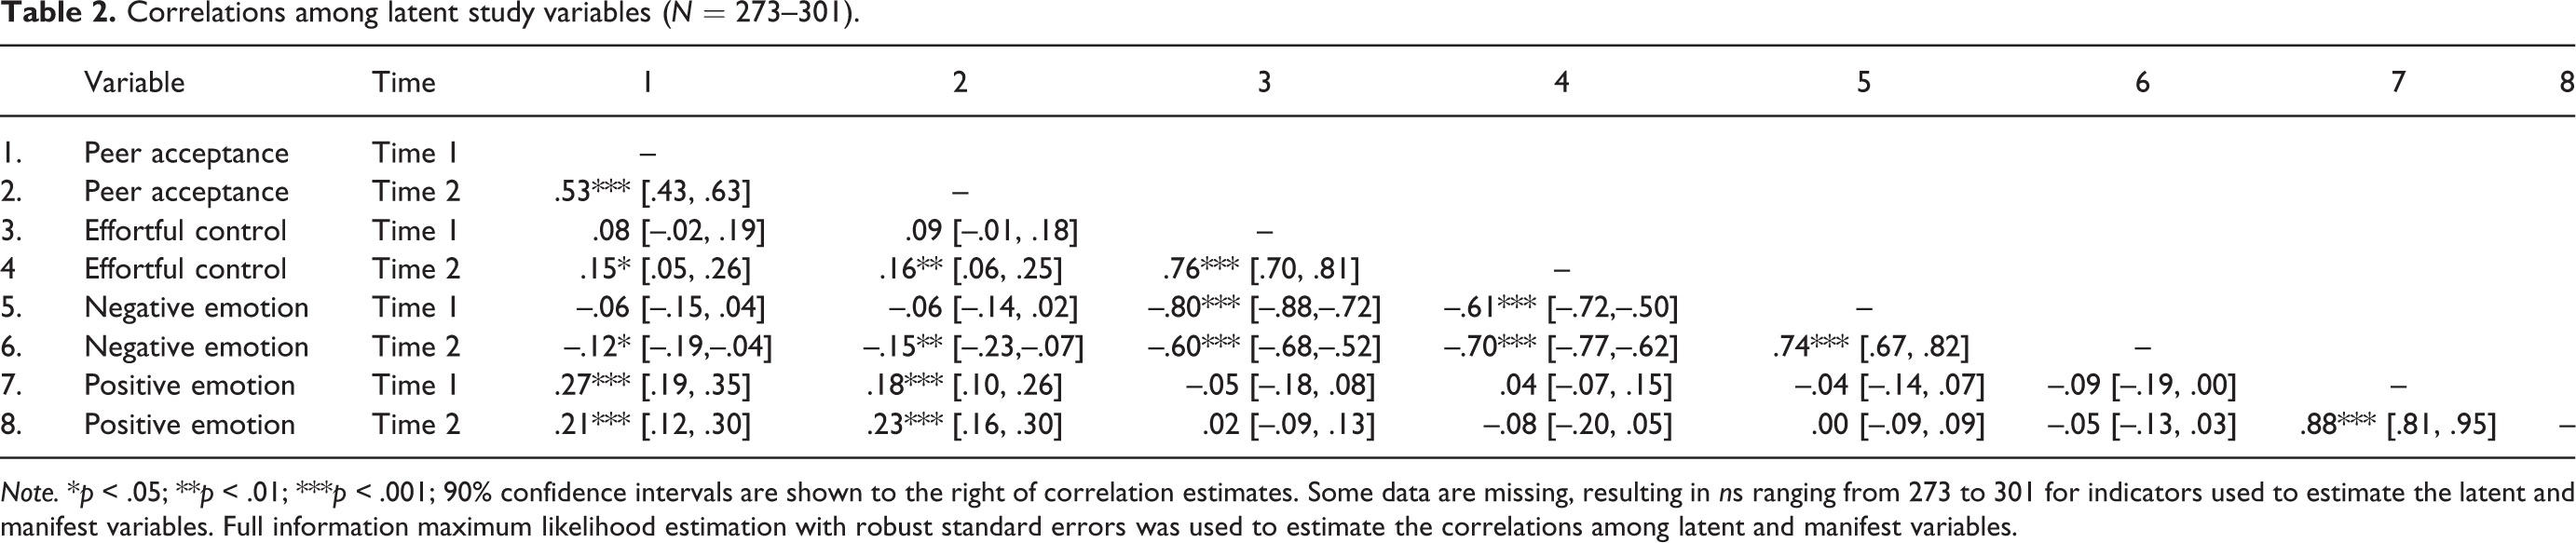
Correlations among Latent Variables
Table 2 provides correlations between manifest (i.e., peer acceptance) and latent study variables (i.e., effortful control, negative emotion, positive emotion). Effortful control and negative emotion in spring (but not fall) were positively and negatively correlated, respectively, with peer acceptance in both the fall and spring. In addition, positive emotion for both semesters was positively correlated with peer acceptance in both fall and spring. The study constructs showed moderate to high stability from fall to spring.
Correlations among latent study variables (N = 273–301).
Note. *p < .05; **p < .01; ***p < .001; 90% confidence intervals are shown to the right of correlation estimates. Some data are missing, resulting in ns ranging from 273 to 301 for indicators used to estimate the latent and manifest variables. Full information maximum likelihood estimation with robust standard errors was used to estimate the correlations among latent and manifest variables.
Measurement Invariance
In order to test possible path differences in the proposed models between boys and girls, measurement invariance was tested for the latent variables (evaluating whether each scale assessed the same construct across boys and girls). We also tested longitudinal invariance. The simplest form of invariance is configural, which entails unconstrained factor estimates (either across groups or across time). We compared the change in fit from this configural model to a weak invariance model (i.e., invariant factor loadings across groups or time). We next compared this weak invariance model with a strong invariance model (i.e., invariant factor loadings and measurement intercepts). We compared a strong invariance model to a strict factorial invariance model (i.e., invariant factor loadings, measurement intercepts, and unique variances). In each step, a nonsignificant change in model fit suggests that the model with additional constraints fits the data as well as the model with fewer constraints. All chi-square difference tests were calculated based on adjusted values given that the models were calcuated using MLR estimates (Muthén & Muthén, 1998–2014).
We found evidence for measurement invariance between boys and girls and longitudinally, Δχ2 (54) = 69.47, p > .05, for the latent constructs of negative emotion (weak group invariance, strong longitudinal invariance), positive emotion (strict group and longitudinal invariance), and effortful control (strict group and longitudinal invariance) in the fall and spring. Given nonsignificant changes on chi-square tests, the more parsimonious invariance latent factors were preferred. Invariance tests showed at least weak invariance in the measurement properties of the latent variables across boys and girls – a necessary prerequisite to conduct multiple group analyses. The constraints found in these analyses were used in subsequent analyses to test hypothesized structural paths.
Interaction Model Analysis Description
We tested whether effortful control moderated the association between emotion (positive or negative) and peer acceptance using a latent moderated structural (LMS) equation technique (Klein & Moosbrugger, 2000). Typical fit indices are not available in Mplus for LMS models; thus, we compared the log-likelihood values and number of parameters from a null interaction model to one that estimated the interaction effect (Klein & Moosbrugger, 2000) and the Akaike information criterion (AIC; Akaike, 1973) values with lower values demonstrating improved model fit (Kelava et al., 2011).
Testing the structural models
A series of models were tested within a SEM framework. Covariates (i.e., age, ethnic minority status, SES, sex) were included. We report standardized coefficients; thus, in multiple group analyses, paths constrained to be equal may have different beta coefficients based on their standardized metric. Given that more than half of participants were of Hispanic heritage, we tried replacing the ethnic minority status covariate with an ethnicity variable based on Hispanic heritage (1 = Hispanic, 0 = non-Hispanic) but model results remained the same. Tests of moderation showed that the models were equivalent across ethnicity and, thus, we analyzed the proposed models with all participants in one group and kept ethnic minority status as a covariate.
Effortful Control and Peer Acceptance
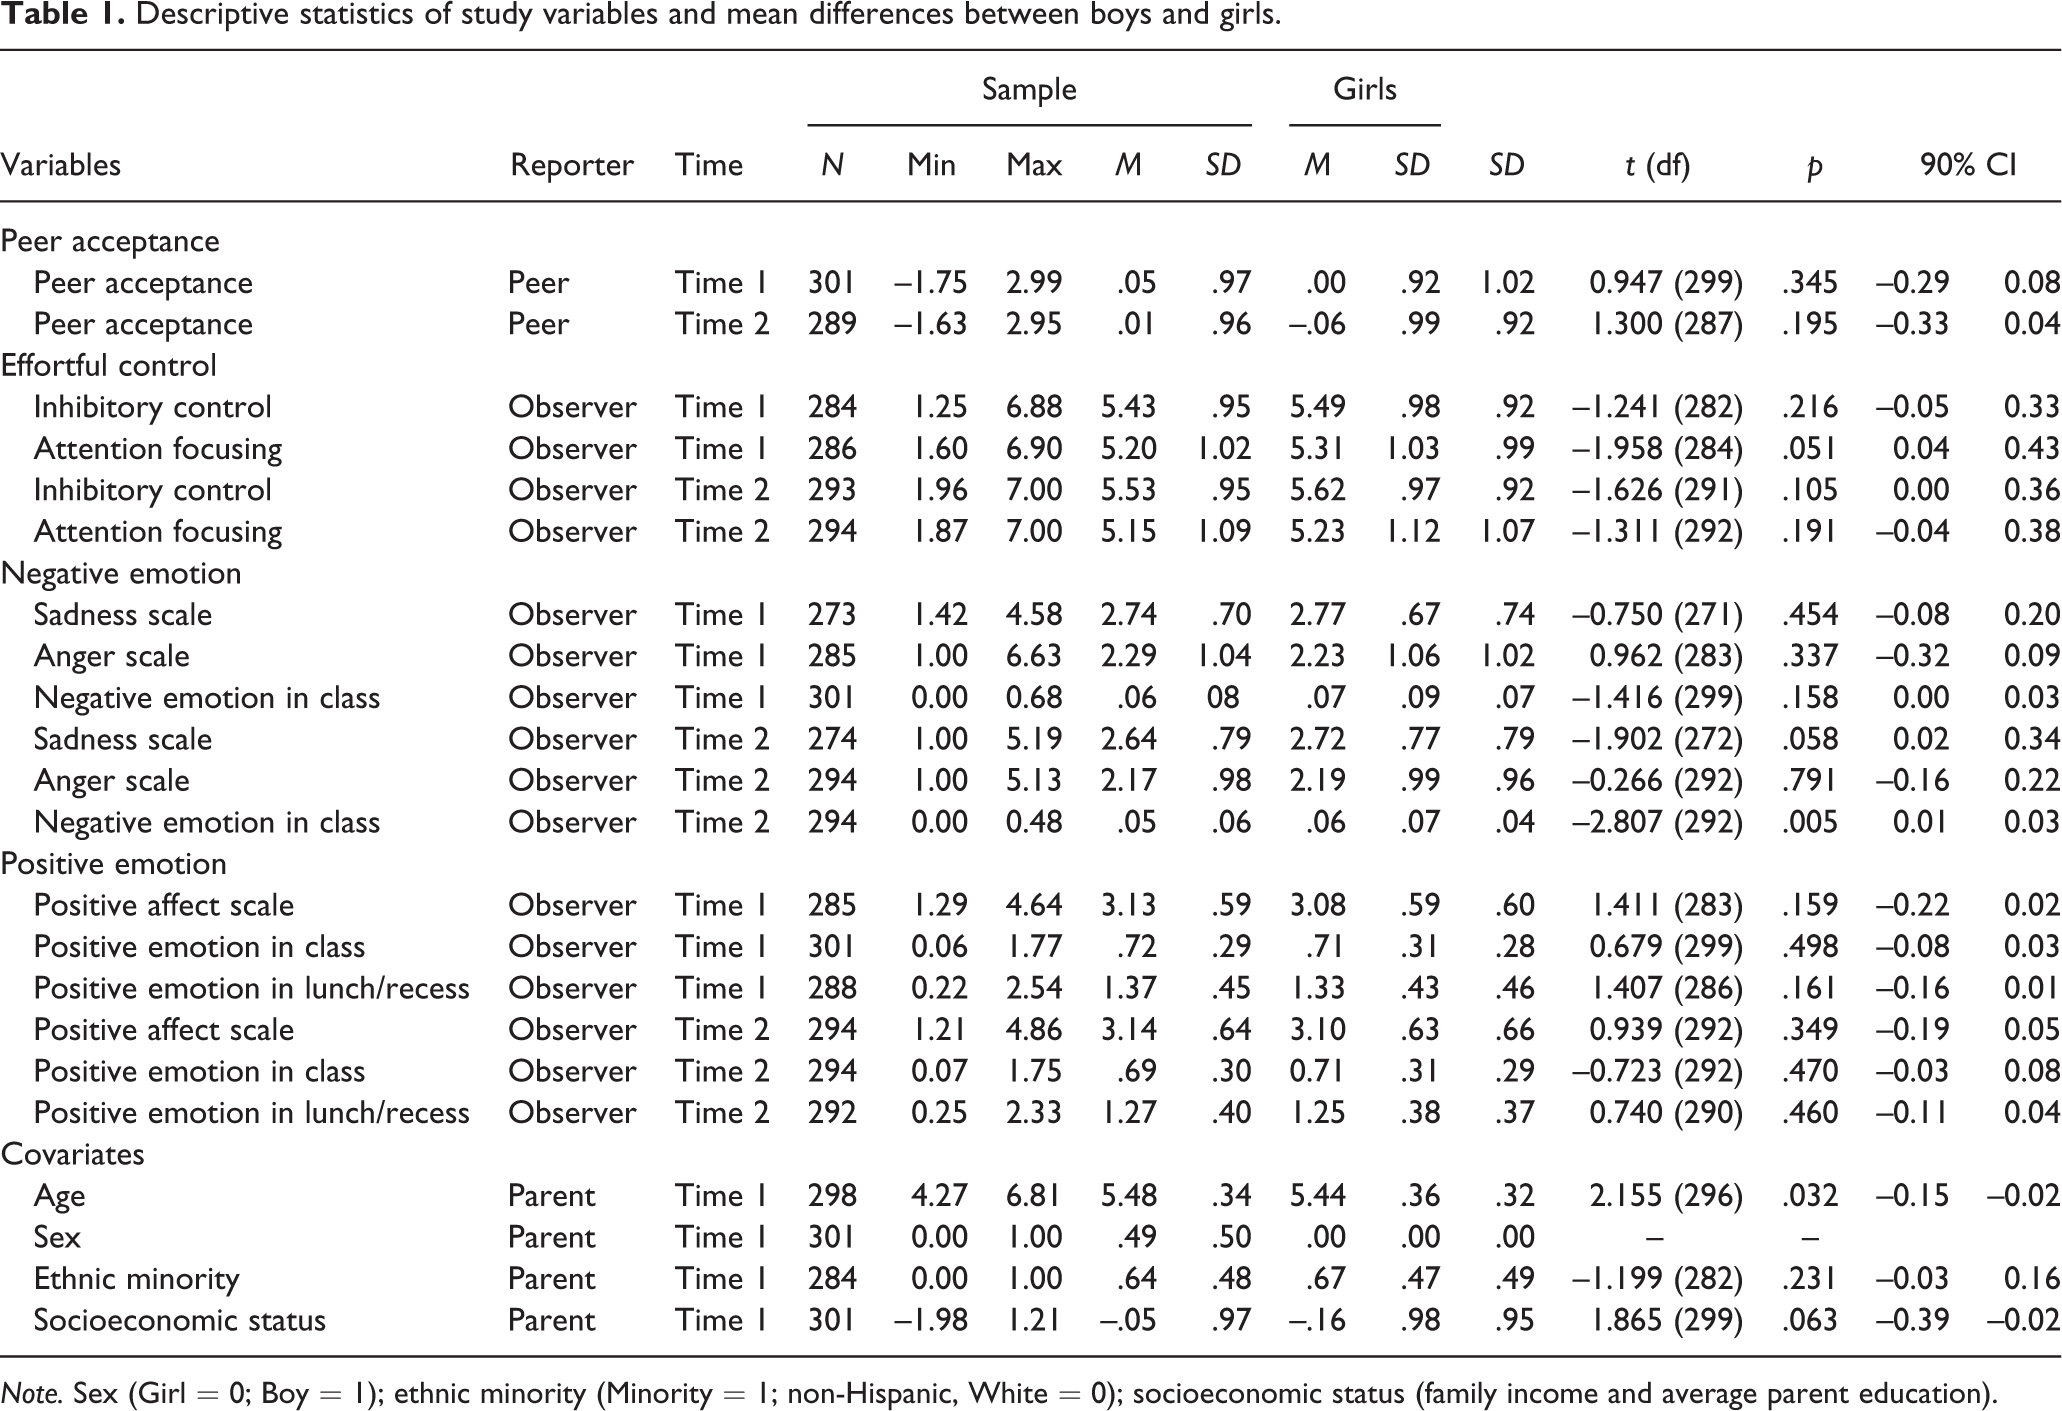
We first tested a model identifying possible bidirectional associations between effortful control and peer acceptance in the fall and spring kindergarten semesters controlling for covariates. This model showed adequate fit: MLR χ2 (19) = 53.33, p < .001, CFI = .96, RMSEA < .08, 90% CI [.05, .10]. Peer acceptance (b = .52) and effortful control (b = .63) showed strong stabilities from fall to spring (see Figure 1). Peer acceptance in the fall predicted higher effortful control in the spring; however, effortful control in the fall did not predict peer acceptance in the spring. We tested for group differences between boys and girls and found that the pattern of results was equivalent across sex.
Cross-lagged panel model of peer acceptance (peer nominations) and effortful control (observers’ reports) in kindergarten. Covariates: age, socioeconomic status, ethnic minority status, and sex. Coefficients are standardized. Spring peer acceptance R2 = .29***; Spring effortful control R2 = .41***. MLR χ2 (19) = 53.33, p < .001, CFI = .96, RMSEA < .08, 90% CI [.05, .10]. Nonsignificant paths are dashed; 90% confidence intervals are shown below parameter estimates. *p < .05; **p < .01; ***p < .001.
Positive Emotion and Peer Acceptance
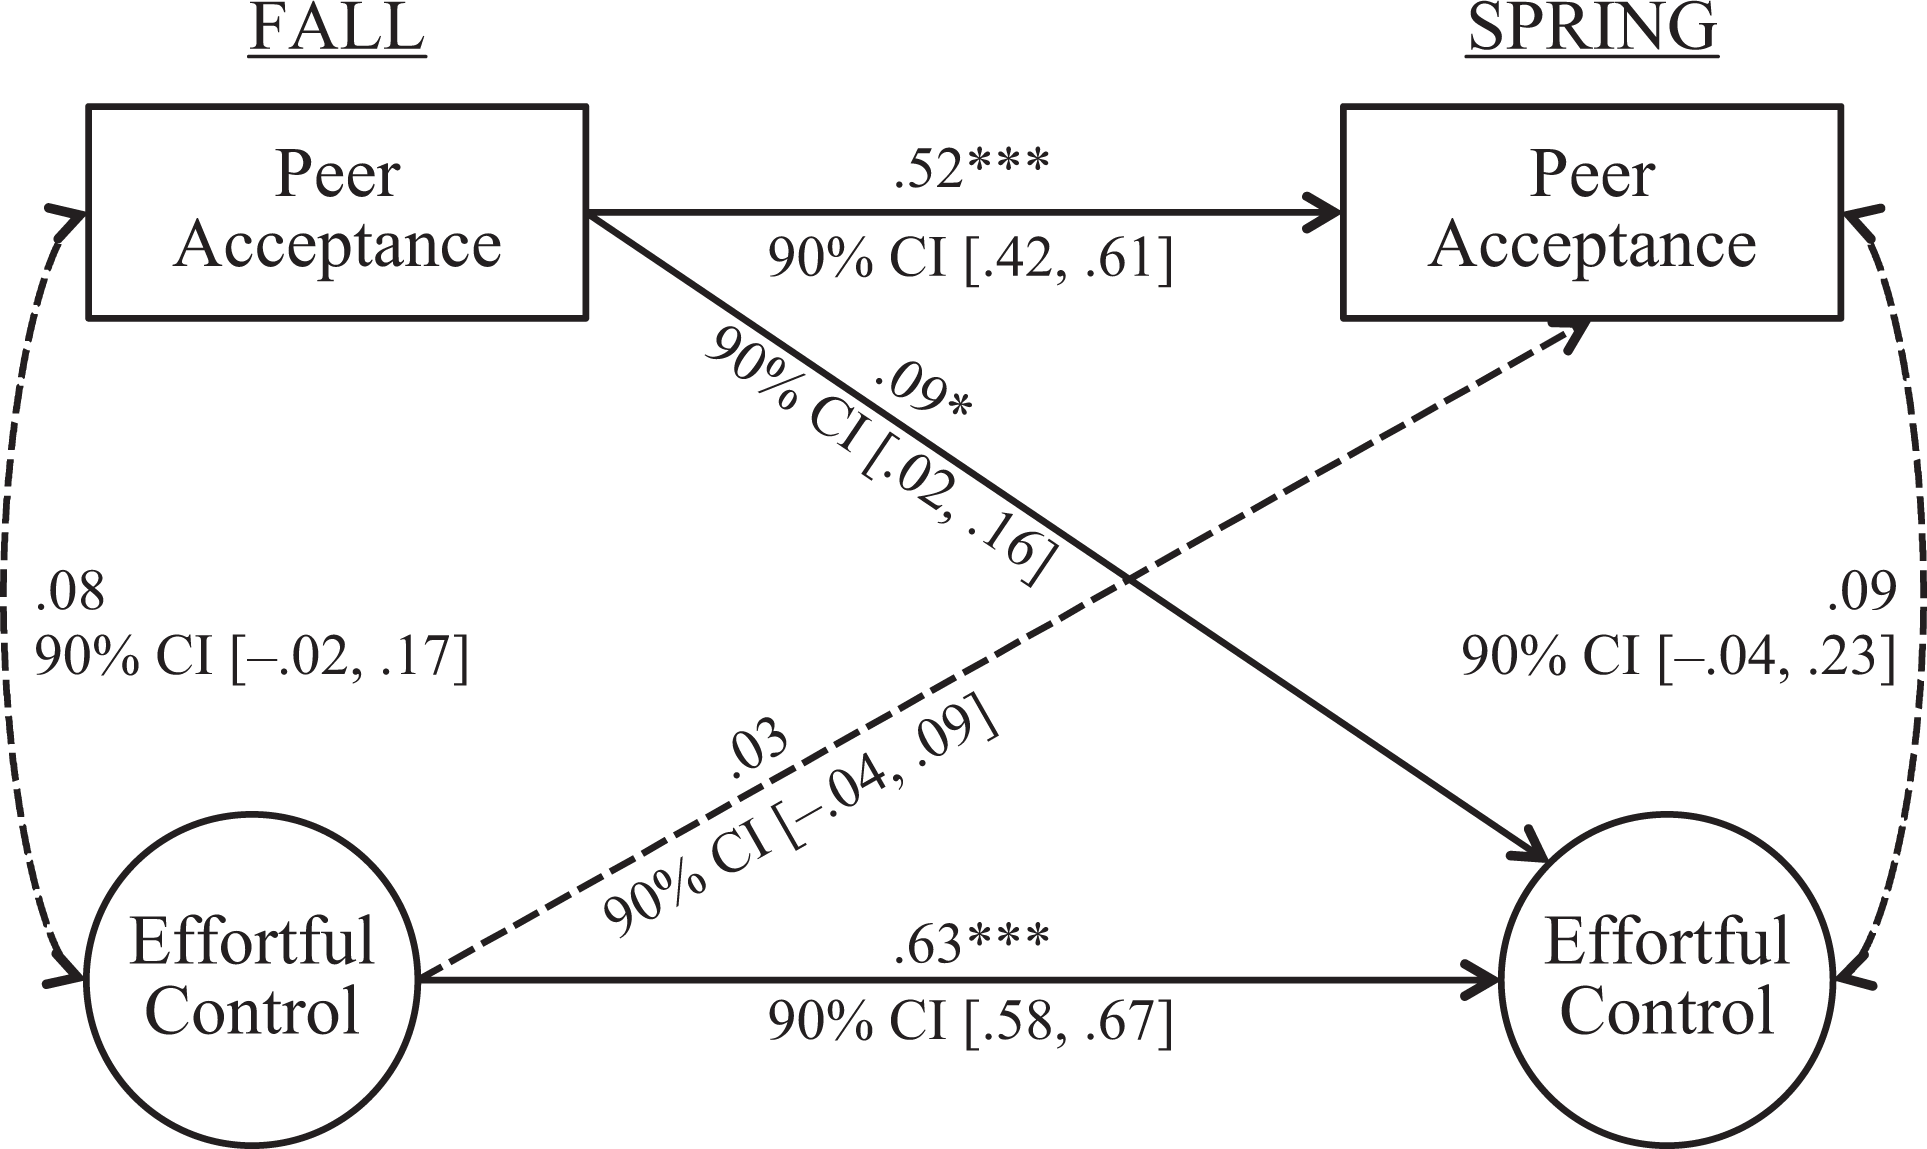
We tested the same model using positive emotions (rather than effortful control). Model fit was good, MLR χ2 (30) = 58.32, p < .01, CFI = .96, RMSEA < .06, 90% CI [.03, .08] and cross-lagged paths were not significant. In a multiple-group model, the model paths were equivalent (and nonsignificant) for boys and girls.
Next, we tested the interaction between positive emotion and effortful control using the LMS technique (Klein & Moosbrugger, 2000). The interaction was significant (b = –.10, p < .05; Figure 2) and adding the interaction improved model fit (Δχ2 (1) = 3.78, p = .05; ΔAIC = –1.76). The simple slopes analysis, based on Preacher, Curran, and Bauer (2006), indicated that positive emotion significantly predicted higher peer acceptance (b = .12, p = .05) only for children low in effortful control (Figure 3).
Cross-lagged panel model of peer acceptance (peer nominations), positive emotion (observers’ reports and naturalistic observations), and effortful control (observers’ reports) in kindergarten. Covariates: age, socioeconomic status, ethnic minority status, and sex. Coefficients are unstandardized. Nonsignificant paths are dashed; 90% confidence intervals are shown below parameter estimates. *p < .05; **p < .01; ***p < .001.
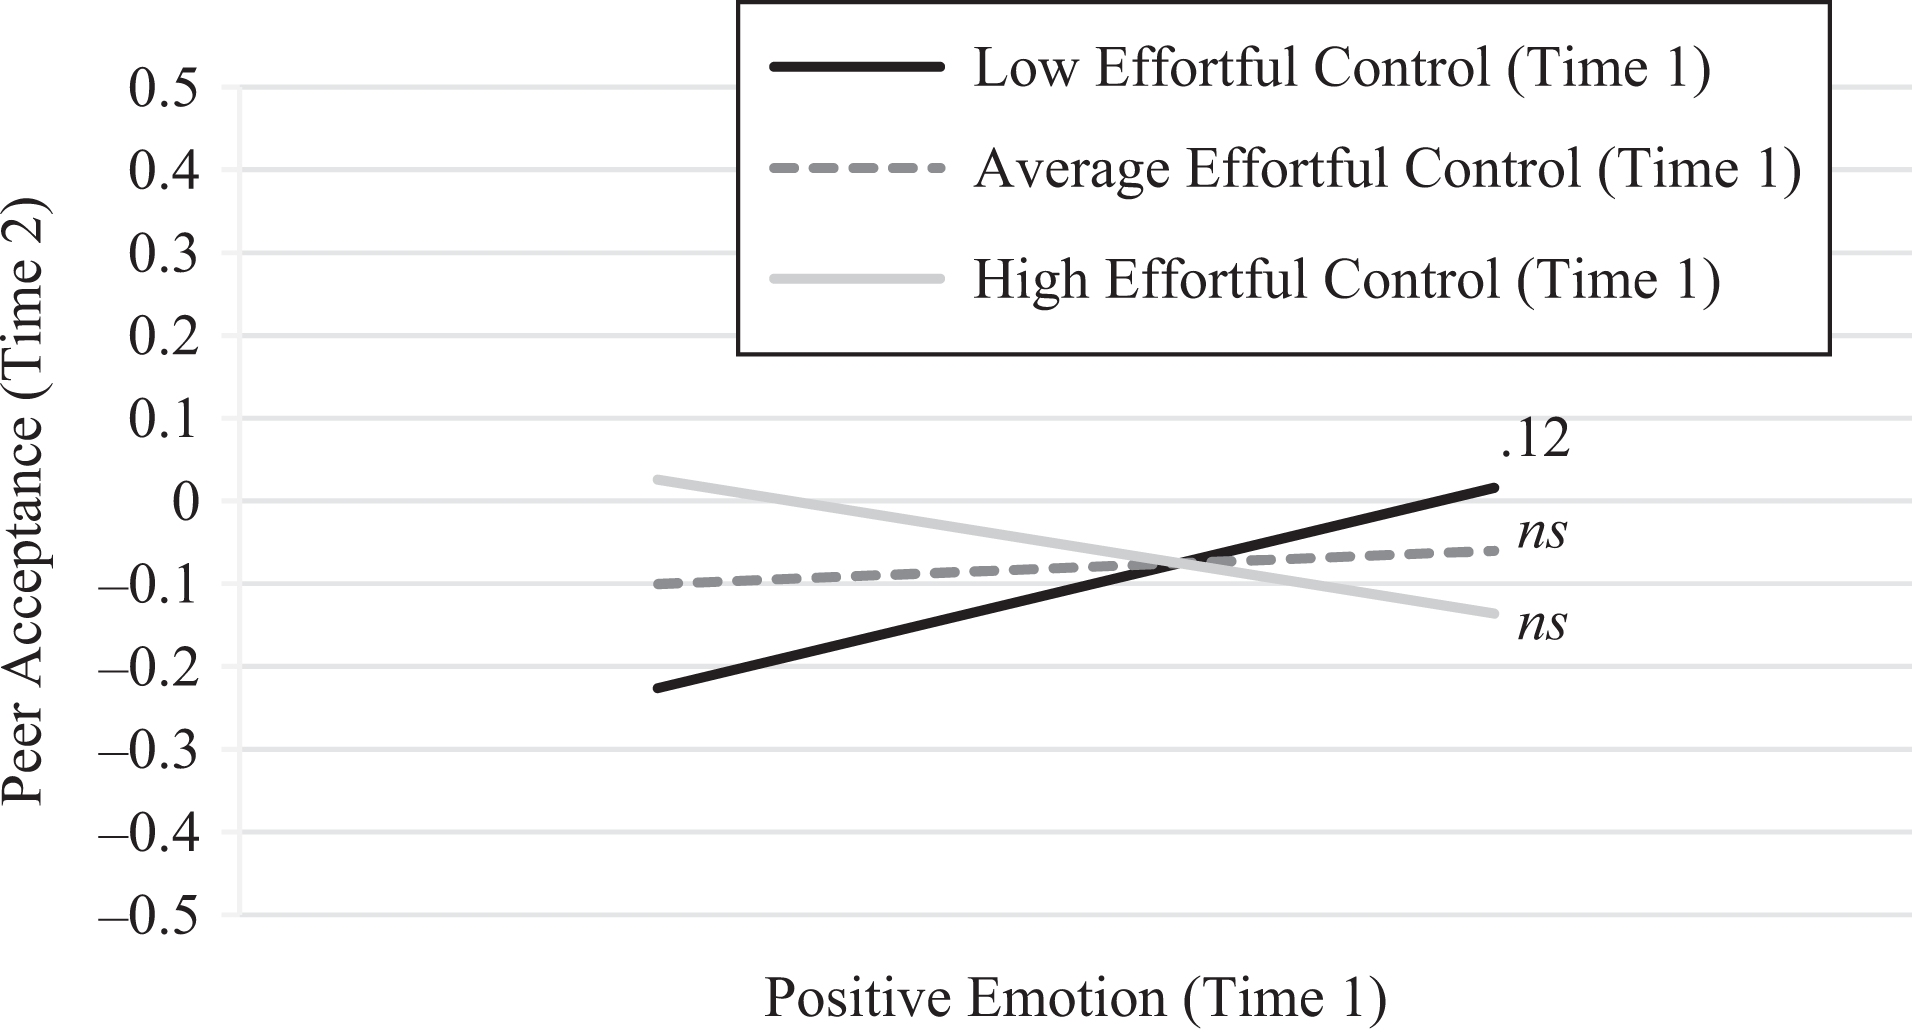
Positive emotion in the fall significantly predicted higher peer acceptance in the spring (b = .12, p = .05, 90% CI [.02, .20]) for children low in effortful control (one standard deviation below the mean) measured in the fall.
Negative Emotion and Peer Acceptance
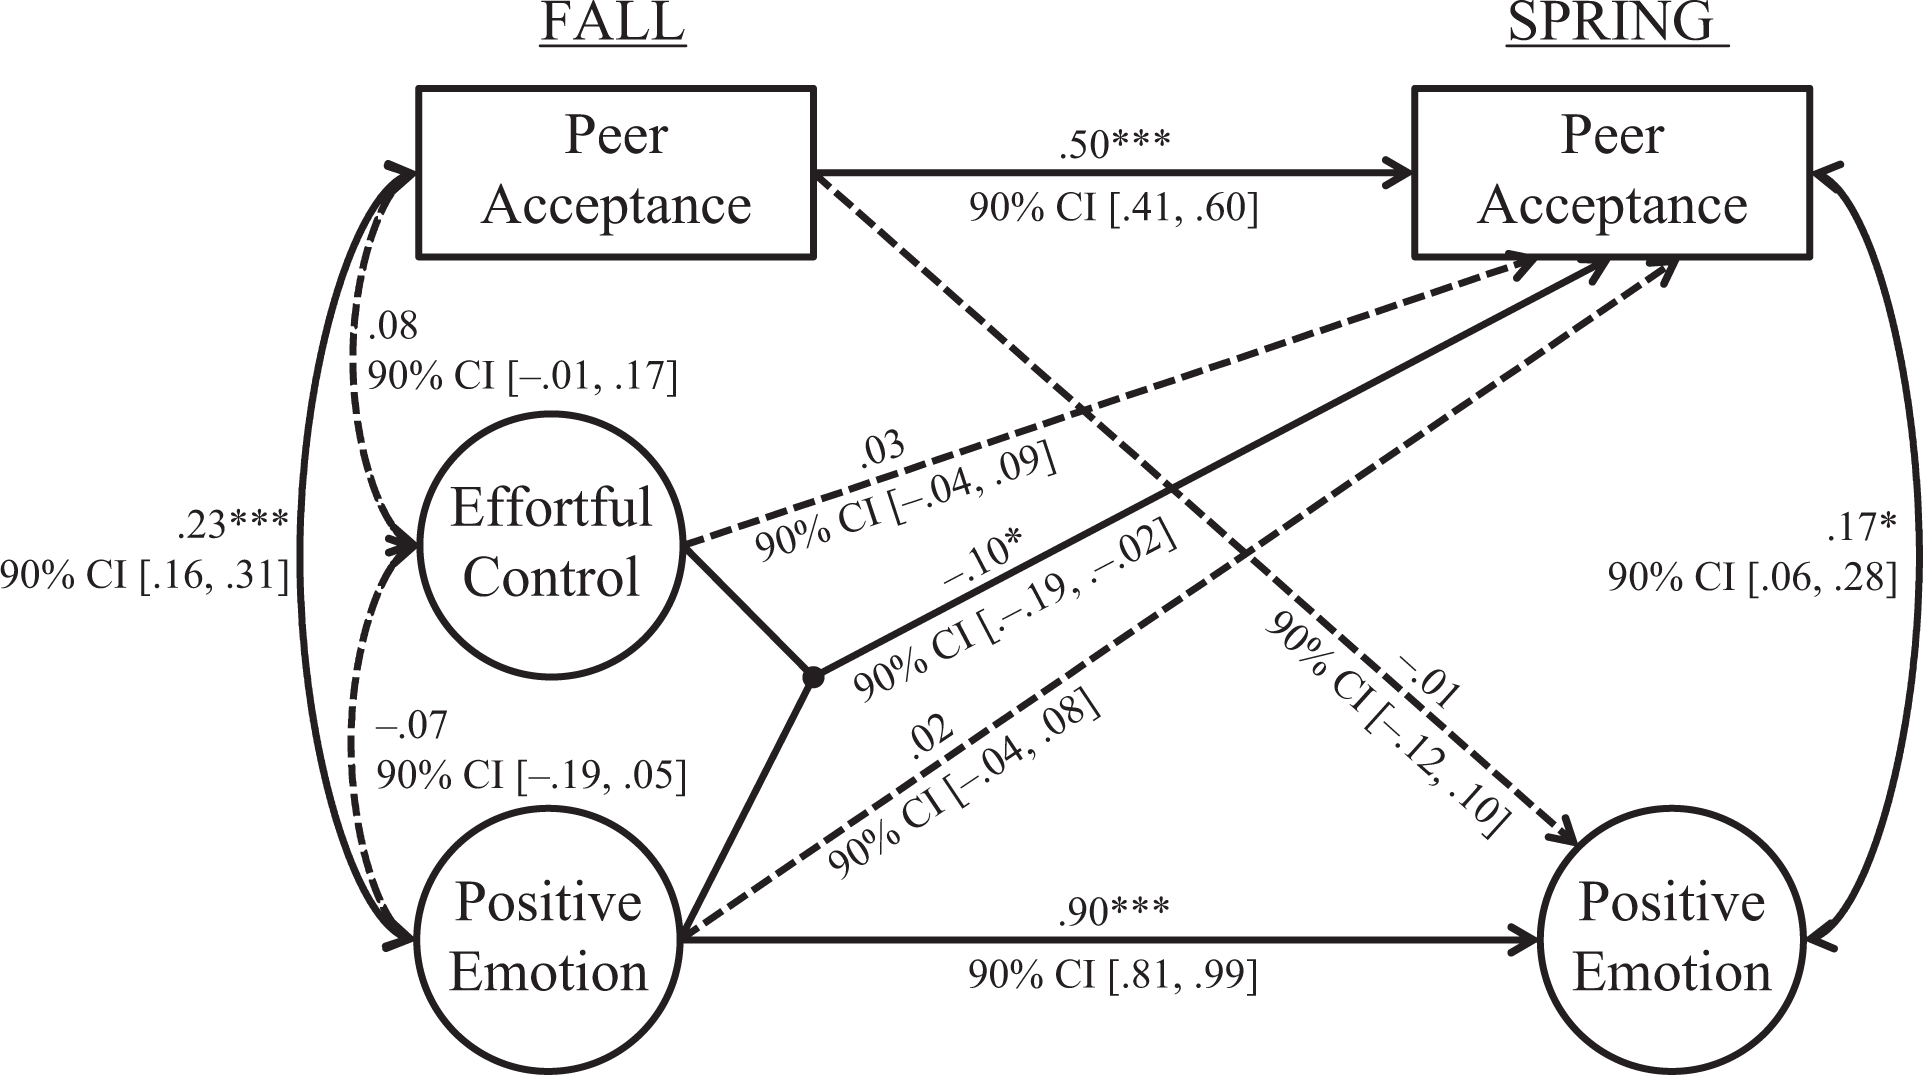
In an analogous model with negative emotions and peer acceptance, the fit was adequate, MLR χ2 (38) = 84.34, p < .001, CFI = .93, RMSEA < .06, 90% CI [.05, .08]. Cross-lagged paths were not significant. We tested for gender differences in the proposed associations. Based on multiple group analyses, MLR χ2 (83) = 119.71, p < .01, CFI = .95, RMSEA < .06, 90% CI [.03, .08], negative emotion in the fall significantly predicted lower peer acceptance in the spring for girls (b = –.13, p < .05) but not for boys (Figure 4; Δχ2 (1) = 6.21, p < .05). All other paths were equivalent between boys and girls. Peer acceptance did not predict later negative emotion. We also tested the interaction between negative emotion and effortful control when predicting peer acceptance using the LMS technique; it was not significant.
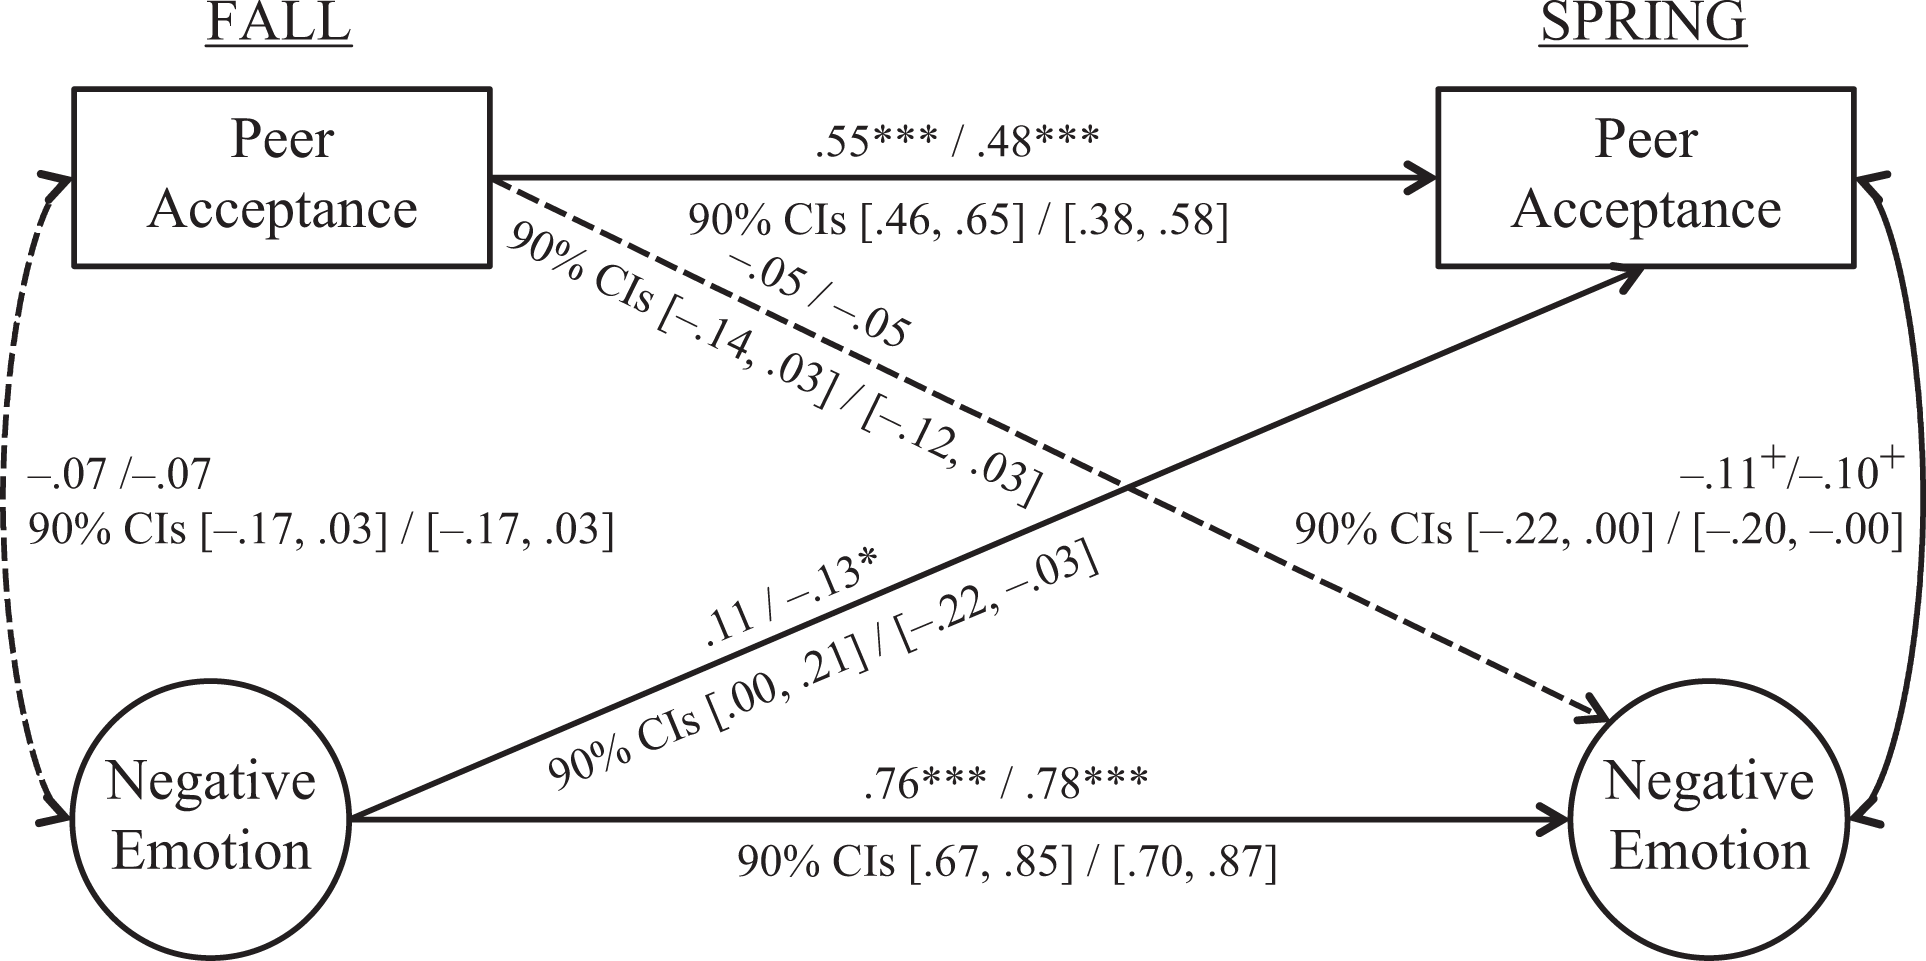
Cross-lagged panel model of peer acceptance (peer nominations) and negative emotion (observers’ reports and naturalistic observations) for the multiple group analysis comparing boys and girls in kindergarten. Standardized coefficients are presented for boys (left of diagonal) and girls (right of diagonal). Spring peer acceptance R2 = .33*** (boys), .27*** (girls); spring negative emotion R2 = .57*** (boys), .61*** (girls). MLR χ2 (83) = 119.71, p < .01, CFI = .95, RMSEA < .06, 90% CI [.03, .08]. Covariates: age, socioeconomic status, and ethnic minority status. Nonsignificant paths are dashed; 90% confidence intervals are shown below parameter estimates. *p < .05; **p < .01; ***p < .001.
Discussion
The present study tested bidirectional relations of peer acceptance to emotions or effortful control (and their interaction). Concurrently, peer acceptance and effortful control were not correlated in the structural equation model (although the two were related in zero-order correlations in spring). Rather, peer acceptance in the fall predicted effortful control in the spring, but not vice versa. This finding supports the social baseline (Beckes & Coan, 2011) and need-to-belong hypotheses (Baumeister & Leary, 1995), as well as research indicating that peer acceptance may promote self-regulation (Eisenberg et al., 1998; Iyer et al., 2010; Morris et al., 2007). Although effortful control did not predict later peer acceptance, contrary to some previous results with teacher- and parent-reported social competence (e.g., Miller et al., 2004; Valiente et al., 2008; Zhou et al., 2010) and some findings on peer acceptance (Maszk et al., 1999), further examination is needed across later time points. Inconsistent findings on the association between peer acceptance and effortful control may have to do with the method of assessing peer acceptance – acceptance usually was assessed with teachers’ or parents’ reports in previous studies – or children’s characteristics. One study that found that peer victimization predicted later effortful control – as in the current study – included first and third graders, about half of which were of Latino origin (Iyer et al., 2010), which is similar to our sample. In contrast, studies in which effortful control predicted later peer competence (contrary to our results) were based on older children (albeit with similar ethnic characteristics as the present study; Valiente et al., 2008), Chinese children in first grade (Zhou et al., 2010), preschoolers attending Head Start (half of European American background and only 10% Latino; Miller et al., 2004), or preschoolers attending a university daycare center (primarily of European American backgrounds; Maszk et al., 1999). Perhaps because effortful control is developing in younger years (Ponitz et al., 2009), social dynamics, including peer acceptance, foster effortful control for younger children more than for older children. Future research with children of a wider range of ages and diverse backgrounds will test the generalizability of our findings.
Similar cross-lagged associations were tested between emotions and peer acceptance, revealing nuanced associations in kindergarten. Positive emotion, although concurrently correlated with peer acceptance, predicted later peer acceptance only in the context of low effortful control (and not for more regulated children). Perhaps children who are relatively less regulated have a more difficult time being liked by peers if they are not positive but are relatively well-liked when they are positive because they are fun and exciting to be around. Although peer acceptance did not predict later levels of positive emotion, positive emotion had very strong stability from fall to spring. Thus, predicting positive emotion would have been difficult given its strong association within kindergarten. Future research examining the nuances of positive emotion expression (i.e., distinguishing joy, happiness, contentment) and at older and younger ages, particularly in the peer context, may help to clarify the role of positive emotion in social interactions. Also, researchers should examine positive emotion in conjunction with emotion regulation in predicting other aspects of social relationships with peers. Previous research has typically not included positive emotion as a predictor of social relationship qualities at an early age and our findings suggest that positive and negative emotion might relate differently to the quality of peer relationships.
Unlike positive emotion, negative emotion in the fall was associated with later peer acceptance, but only for girls. These findings suggest that expressing negative emotions is particularly harmful for girls’ peer acceptance, even after controlling for earlier levels of acceptance, supporting the view that expressed negative emotion is more costly for girls than boys (Stormshak et al., 1999), perhaps because of gendered norms for aggression/anger or peer interaction styles (Ladd, 2005; Martin et al., 2014). Peer acceptance did not predict later negative emotion. Future research could explore different aspects of social relationships and relevant social skills and their association with negative emotionality with peers. For example, negative emotion expressed toward peers may be more harmful to peer relationships than the general expression of negative emotion.
Although we tested whether effortful control moderated the association between negative emotion and peer acceptance, we did not find support for this interaction as other studies did for social competence and adjustment (Eisenberg, Eggum, et al., 2010; Eisenberg, Spinrad, et al., 2010; Rydell et al., 2003). However, there was a relatively strong correlation between effortful control and negative emotion, and thus an interaction effect would be difficult to obtain. Furthermore, in supplemental analyses we tested and found that an interaction between positive and negative emotions did not predict later peer acceptance; nonetheless, future research can further examine how positive and negative emotions jointly affect social processes throughout development.
Noteworthy strengths of the study include extensive use of observational measures, as well as the use of multiple peer reporters at two time points. Nevertheless, there were limitations; for example, our measures of effortful control were available twice only for observers’ reports. Although researchers have used observers’ reports of temperament-based measures (e.g., Taylor et al., 2013), a combination of parents’ and teachers’ reports and behavioral measures of regulation could approximate a broader measure of effortful control (Bridgett, Oddi, Laake, Murdock, & Bachmann, 2013). Furthermore, relations of emotional expression and peer relationships might change with age or across cultural environments (Matsumoto et al., 2008); longitudinal cross-cultural research on these relations across a wider range of years with multiple points within a school year would clarify the generalizability of our results. Finally, distinguishing children’s emotional profiles (e.g., specific positive and negative emotion patterns) may help find specific associations with peer acceptance across time.
Footnotes
Funding
Research reported in this publication was supported by the Eunice Kennedy Shriver National Institute of Child Health and Human Development of the National Institutes of Health (NIH) (R01HD068522). The content is solely the responsibility of the authors and does not necessarily represent the official views of the NIH.