
Abstract
Older adults tend to have lower emotion-perception accuracy compared to younger adults. Previous studies have centered on individual characteristics, including cognitive decline and positive attentional preferences, as possible mechanisms underlying these age differences in emotion perception; however, thus far, no perceiver-focused factor has accounted for the age differences. The present study focuses on perceived social-context factors and uses the Social Input Model as the framework for investigating the relation between the expressivity of the social environment and emotion-perception accuracy in younger and older adults. Younger (n = 32) and older adults (n = 29) reported on the make-up of their social circles and the expressivity of their three closest social partners and then completed a static facial emotion-perception task. Older adults reported greater positive and negative expressivity in their social partners compared to younger adults. Moreover, older adults were marginally less accurate than younger adults when perceiving emotions. Positive expressivity of the social partners predicted lower emotion-perception accuracy in younger but not older adults. Our findings mark the first step to identifying possible characteristics of the social environment that may contribute to the age difference in emotion-perception accuracy.
Older adults perform worse than younger adults on emotion-perception tasks using facial expression stimuli (see meta-analysis by Ruffman, Henry, Livingstone, & Phillips, 2008). Previous research has focused on individual characteristics, such as general cognitive decline (Keightley, Winocur, Burianova, Hongwanishkul, & Grady, 2006; Sullivan & Ruffman, 2004) and age-related changes in attention (Murphy & Isaacowitz, 2010) as explanatory factors, but these characteristics have not fully accounted for the age difference in emotion-perception accuracy (Isaacowitz & Stanley, 2011), suggesting the need for a new approach. The present study shifts the focus to socioemotional characteristics that might explain the age-related deficit in emotion perception. Throughout the lifespan, how we perceive social input impacts our ability to interact with others (Fingerman & Pitzer, 2007). Yet, no study has focused on specifically how perceived social input may contribute to age differences in emotion-perception accuracy. Therefore, the present study investigated the expressivity of social partners as a contributor to age differences in emotion-perception accuracy.
Age differences in emotion perception
Traditionally, facial emotion-perception accuracy tasks have used static, isolated facial expressions of emotion (happiness, anger, fear, sadness, disgust, or surprise; e.g. Borod et al., 2004; MacPherson, Phillips, & Della Sala, 2002; Phillips, MacLean, & Allen, 2002). In this paradigm, older adults tend to perform worse compared to younger adults, although the magnitude of the difference varies by emotion (Ruffman et al., 2008): older adults tend to have the greatest deficit when perceiving negative emotions such as, anger, sadness, and fear but sometimes perform similarly to younger adults when perceiving disgust and happiness (Ruffman et al., 2008). Thus, factors that contribute to age differences in emotion perception may be strongest for the perception of negative emotions.
Recently, researchers have considered the role of context in emotion-perception accuracy. For instance, younger adults tend to respond quicker when facial expressions match the surrounding context of the stimuli (Milanak & Berenbaum, 2014). Social-context factors such as relationship closeness relate to emotion-perception ability: closer friends are more accurate at perceiving each other’s emotions compared to acquaintances (Parmley & Zhang, 2015). When provided with more context-rich stimuli, older adults’ accuracy improves (Sze, Goodkind, Gyurak, & Levenson, 2012), and social familiarity attenuates age differences in emotion-perception accuracy (Stanley & Isaacowitz, 2015). Although this context-focused research has created paradigms that may more closely mimic everyday emotion perception, they do not assess perceived characteristics of the social partners that may contribute to the individuals’ emotion-perception accuracy. Age differences in how social partners interact with younger and older adults may contribute to age differences in emotion-perception accuracy.
Social input model
The Social Input Model (SIM; Fingerman & Baker, 2006) describes how the social contexts of younger and older adults differ. Briefly, older adults bring factors such as their health, experiences, and social roles to relationships, and their social partners respond to these factors in ways that create a social environment filled with positivity (Fingerman & Baker, 2006).
Older adults trim their social environments by removing problematic relationships (Antonucci, Akiyama, & Takahashi, 2004). Older adults’ remaining social partners—regardless of age and relationship—appear to display more positivity when interacting compared to younger adults’ social partners. For example, individuals, regardless of relationship quality or length, report that they are less likely to confront older adults who commit a social transgression compared to when a younger adult does (Fingerman, Miller, & Charles, 2008). Additionally, older adult social partners are more likely to choose to avoid interpersonal conflict rather than confront it (Birditt & Fingerman, 2005), which may minimize negativity in the environment. Lastly, older adults desire to preserve their positive social environment: they engage in passive emotion-regulation strategies (Charles, Piazza, Luong, & Ameida, 2009; Sorkin & Rook, 2006), which, in turn, may increase perceptions of positivity from the social partners. Through the expression of positive emotion and the inhibition of negative emotion, older adults’ social partners—including their offspring and friends—appear to create a social environment that is inherently positive with fewer interpersonal conflicts.
Research with younger adults suggests that partners’ expressivity can interfere with emotion perception (Halberstadt, 1986). One consequence of older adults’ highly positive social environment may be that the frequent displays of positive emotion mask or interfere with the perception of negative emotions. Frequent masking of negative emotions by others may create unreliable or ambiguous cues for older adults to perceive, thus decreasing their accuracy when perceiving negative emotions from clearer expressions such as in the facial emotion-perception task.
Present study
The present study takes a novel approach by focusing on a perceived characteristic of the social environment that likely contributes to age differences in emotion-perception accuracy: social partner expressivity. We considered the perceived expressivity of the three closest social partners as socioemotional contextual predictors to the age differences in emotion perception. We covaried the effects of individual and social variables likely to vary by age (such as memory and social circle size) to investigate the unique effect of perceived expressivity.
Younger adults were expected to have higher overall emotion-perception accuracy (Ruffman et al., 2008). We hypothesized that older adults would report more positive and less negative expressivity from their social partners compared to younger adults. Individuals in both age groups who reported social partners high in positive expressivity were predicted to have lower accuracy when perceiving negative emotions compared to individuals reporting less expressive partners. We expected higher social partners’ positive expressivity to moderate the age difference in the perception of negative emotions, such that higher positive expressivity in older adults would predict lower perception of negative emotions compared to younger adults.
Methods
Participants
Participants were 32 younger adults (M = 19.63, SD = 1.60) and 29 older adults (M = 70.45, SD = 7.74). Younger adults were recruited via university undergraduate psychology courses, and older adults were recruited through a database of past participants, flyers, and local community centers. Within the younger adult sample, half (50%) were female, 69% were White, 25% were Asian, and 6% were Black. For older adults, 79% were female, 86% were White, 10% were Black, and 4% declined to report their race.
Procedure
After giving informed consent, participants provided demographic information and completed tests of vision, memory, dementia, and mood. First, participants completed a modified version of the social circles task to outline their social circles. Second, participants were asked questions about the three individuals to whom they felt closest. Participants were then asked to report the expressivity of these individuals and their satisfaction in that relationship. Surveys were given on the computer, but paper copies were provided upon request. After completing these surveys, the participants completed the facial emotion-perception task. Lastly, participants were debriefed and given course credit (younger adults) or monetary compensation (older adults).
Measures
Individual covariates
Factors that might differ with age and influence emotion-perception accuracy were tested as covariates (e.g. visual acuity, depression, mood, and cognitive ability). Vision was measured with Pelli and Robson’s (1988) near, far, and contrast vision charts to control for visual acuity. Depressive symptoms were measured with the Center for Epidemiologic – Depression scales (Radloff, 1977) because of possible links with emotion perception (Kohler, Hoffman, Eastman, Healey, & Moberg, 2011). Baseline mood was measured at the beginning of the study with the Positive and Negative Affect Schedule (Watson, Clark, & Carey, 1988). Fluid intelligence was measured with a working memory test from Wechsler Adult Intelligence Scale (Weschler, 1981). Possible symptoms of dementia were also measured with the Mini-mental State Exam (MMSE; Folstein, Folstein, & McHugh, 1975).
Social environment covariates
We measured social circle size and relationship satisfaction because we expected these to vary with age such that social circle size would be smaller and relationship satisfaction would be higher in older adults (Antonucci et al., 2004; Luong, Charles, & Fingerman, 2012). The social circles task (Antonucci & Akiyama, 1987) was used to quantify the size of the social environment and help participants identify three individuals to whom they felt closest. At the beginning of the task, participants were given a diagram with a set of three concentric circles around a small center circle. The center circle was labeled with the word “you,” and the surrounding circles were labeled “Very closely related people,” “Closely related people,” and “Less closely related but still important people.” Participants were asked to write the initials of individuals that fit into each circle and then identify the three individuals to whom they are closest. Participants were also asked to identify the gender of the social partner, their relationship to that person, and how long they have known him or her. Relationship satisfaction with each of the three closest individuals was measured with the 7-item Relationship Assessment Scale (RAS; Dicke & Hendrick, 1998). Scores from the three social partners were averaged together. Depending on the social partner, the reliability of the RAS ranged from α = .82 to α = .88. The sizes of each of the three social circles and the relationship satisfaction with each of the social partners were included as covariates when predicting emotion-perception accuracy.
Expressivity of others
Participants used the peer-rating version of the 16-item, Berkeley Expressivity Questionnaire (BEQ; Gross & John, 1997) to report the emotional expressivity of their three closest social partners. Each item describes an emotional event to which the participant indicates their agreement on a 7-point Likert scale (1 = strongly disagree, 7 = strongly agree). The positive expressivity subscale focuses on the social partners’ expression of positive emotions (e.g. “When my friend/relative is happy, his/her feelings show”), whereas the negative expressivity subscale focuses on negative expression (e.g. “Whenever my friend/relative feels negative emotion, people can easily see exactly what he/she is feeling”). Scores for each social partner selected were calculated by averaging the item response values. In order to assess the expressivity of the social environment rather than just individuals, the three closest social partners’ expressivity were averaged together to form overall positive and negative expressivity scores. For each social partner, the reliability ranged from α = .57 to α = .79 for positive expressivity, α = .67 to α = .84 for negative expressivity, and α = .81 to α = .84 for impulse strength.
Emotion perception
During the emotion-perception task, participants viewed 120 static images of faces expressing six emotions (happiness, sadness, fear, anger, disgust, and neutral) displayed on a computer screen. The stimuli were randomly-selected middle-aged faces from the FACES database (Ebner, Riediger, & Lindenberger, 2010). The database consists of high-quality, color photographs of adults (young, middle-aged, and old). Middle-aged faces of an equal number of men and women were used to prevent either an own-age or own-gender bias. Each face was presented for 3 seconds preceded by a 1-second-long fixation cross. Participants were then presented with a choice of six emotions and asked to say their answer aloud; answers were recorded by an experimenter in another room. A percentage correct score was calculated for each emotion and participants were given an overall mean score. The overall reliability for the facial emotion-perception task was high (α = .86). The reliability for each emotion ranged from low to high: Happy (α = .53), sad (α=.71), neutral, (α = .70), angry (α = .77), fearful (α = .84), and disgusted (α = .79).
Results
Covariates
Individual covariates
Older adults had worse vision, t(57) = 23.72, p < .01, fewer depressive symptoms, t(53) = 10.29, p < .01, and better mood, t(58) = 18.90, p < .01, than younger adults (see Table 1). None of the participants reported difficulties viewing text on the computer monitor. Older and younger adults did not differ in fluid intelligence, t(49) = .16, p = .69, nor did they differ on the MMSE, t(51) = 1.24, p = .27; additionally, all participants scored above 26, suggesting a lack of dementia symptoms (Folstein et al., 1975). These patterns are consistent with previous studies showing that older adults tend to have higher positive mood, fewer symptoms of depression, and worse visual acuity (Dulin & Pachana, 2005; Lawton, Kleban, & Dean, 1993; Lawton, Kleban, Rajagopal, & Dean, 1992; Mroczek & Kolarz, 1998; Park, 2002) compared to younger adults. All participants were healthy enough to come to the lab unassisted.
Means by age for memory, vision, mental state, and mood measures.

Note. Younger adults (N = 26–32), older adults (N = 26–29). Forward and backward digit spans were measured with the WAIS and were scored from 2 to 9 and 2 to 8, respectively. Higher scores indicated better memory. Possible scores on the Mini-Mental State Exam ranged from 0 to 30, with lower scores indicating higher risk for dementia. Possible scores on the far vision task ranged from 10 to 200 and 20 to 800 on the near vision task, with lower scores indicating higher visual acuity. Contrast sensitivity ranged from 2.25 to 0.00; higher scores indicated better sensitivity. Positive and negative mood were scored using the PANAS. Possible scores ranged from 1 to 5, with higher scores representing higher levels of affect. Depression was assessed using the CES-D. Our possible scores ranged from 20 to 80, with higher scores indicating more depressive symptoms.
**p < .01; ***p < .001.
Social circle sizes
A mixed 2 (Age: younger, older) × 3 (Social circle type: very close, close, less close) Analysis of Variance (ANOVA) was performed to test whether age difference in number of individuals reported in each social circle emerged. Mauchly’s test indicated that the assumption of sphericity had been violated, X 2 (2) = 14.23, p < .01; therefore, degrees of freedom were corrected using Greenhouse-Geisser estimates of sphericity (ε = .80). There was no main effect of social circle type, F(1.63, 92.74) = .99, p = .36, ηp 2 = .02; however, a main effect of age emerged, such that older adults reported fewer individuals than younger adults, F(1, 57) = 5.14, p = .03, ηp 2 = .08. There was no significant interaction between social circle type and age group, F(1.63, 92.74) = .97, p = .37, ηp 2 = .02.
Closest social partners
In order to test the age differences in the composition of the closest social partners, as suggested by previous research (Antonucci & Akiyama, 1987), we performed a chi-squared test assessing the difference in the number of each type of relationship reported by the participants. The three reported closest social partners were grouped into six categories: parent, offspring, sibling, spouse/significant other, friend, and other family. The number of each type of relationship reported by younger and older adults differed significantly, X 2 (6, N = 59) = 21.94, p < .01. Compared to older adults, younger adults more frequently reported parents, X 2 (1, N = 43) = 28.49, p < .01, significantly fewer offspring, X 2 (1, N = 23) = 23.00, p < .01, and a similar number of siblings, X 2 (1, N = 26) = .15, p = .69, and friends, X 2 (1, N = 59) = 1.37, p = .24. Younger and older adults both reported more female social partners, but neither age group reported more male or female partners than the other. Lastly, older adults had known their social partners significantly longer than had younger adults, t(53) = 11.15, p < .01.
Age differences in perceived social partner expressivity
Expressivity of closest partners
Positive expressivity, F(7, 51) = 1.19, p = .32, and negative expressivity of the social partners did not differ by relationship type, F(7, 51) = .29, p = .96. Because expressivity did not differ by relationship type, we averaged expressivity across social partners. In order to assess possible age differences in the amount of reported expressivity in the three closest social partners, we performed a mixed 2 (Age: younger, older) × 3 (Expressivity: positive, negative, impulse strength) ANOVA. Means for younger and older adults are reported in Figure 1. A main effect of expressivity emerged such that both age groups reported significantly more positive expressivity in the closest social partners compared to negative expressivity, F(1, 56) = 161.88, p < .01, ηp 2 = .79. There was also a main effect of age where older adults reported more expressivity overall, F(1, 56) = 4.29, p = .04, ηp 2 = .11. However, there was no significant interaction between expressivity and age, F(1, 56) = .38, p = .54, ηp 2 < .01. Impulse strength did not differ between age groups, t(57) = −.15, p = .89.
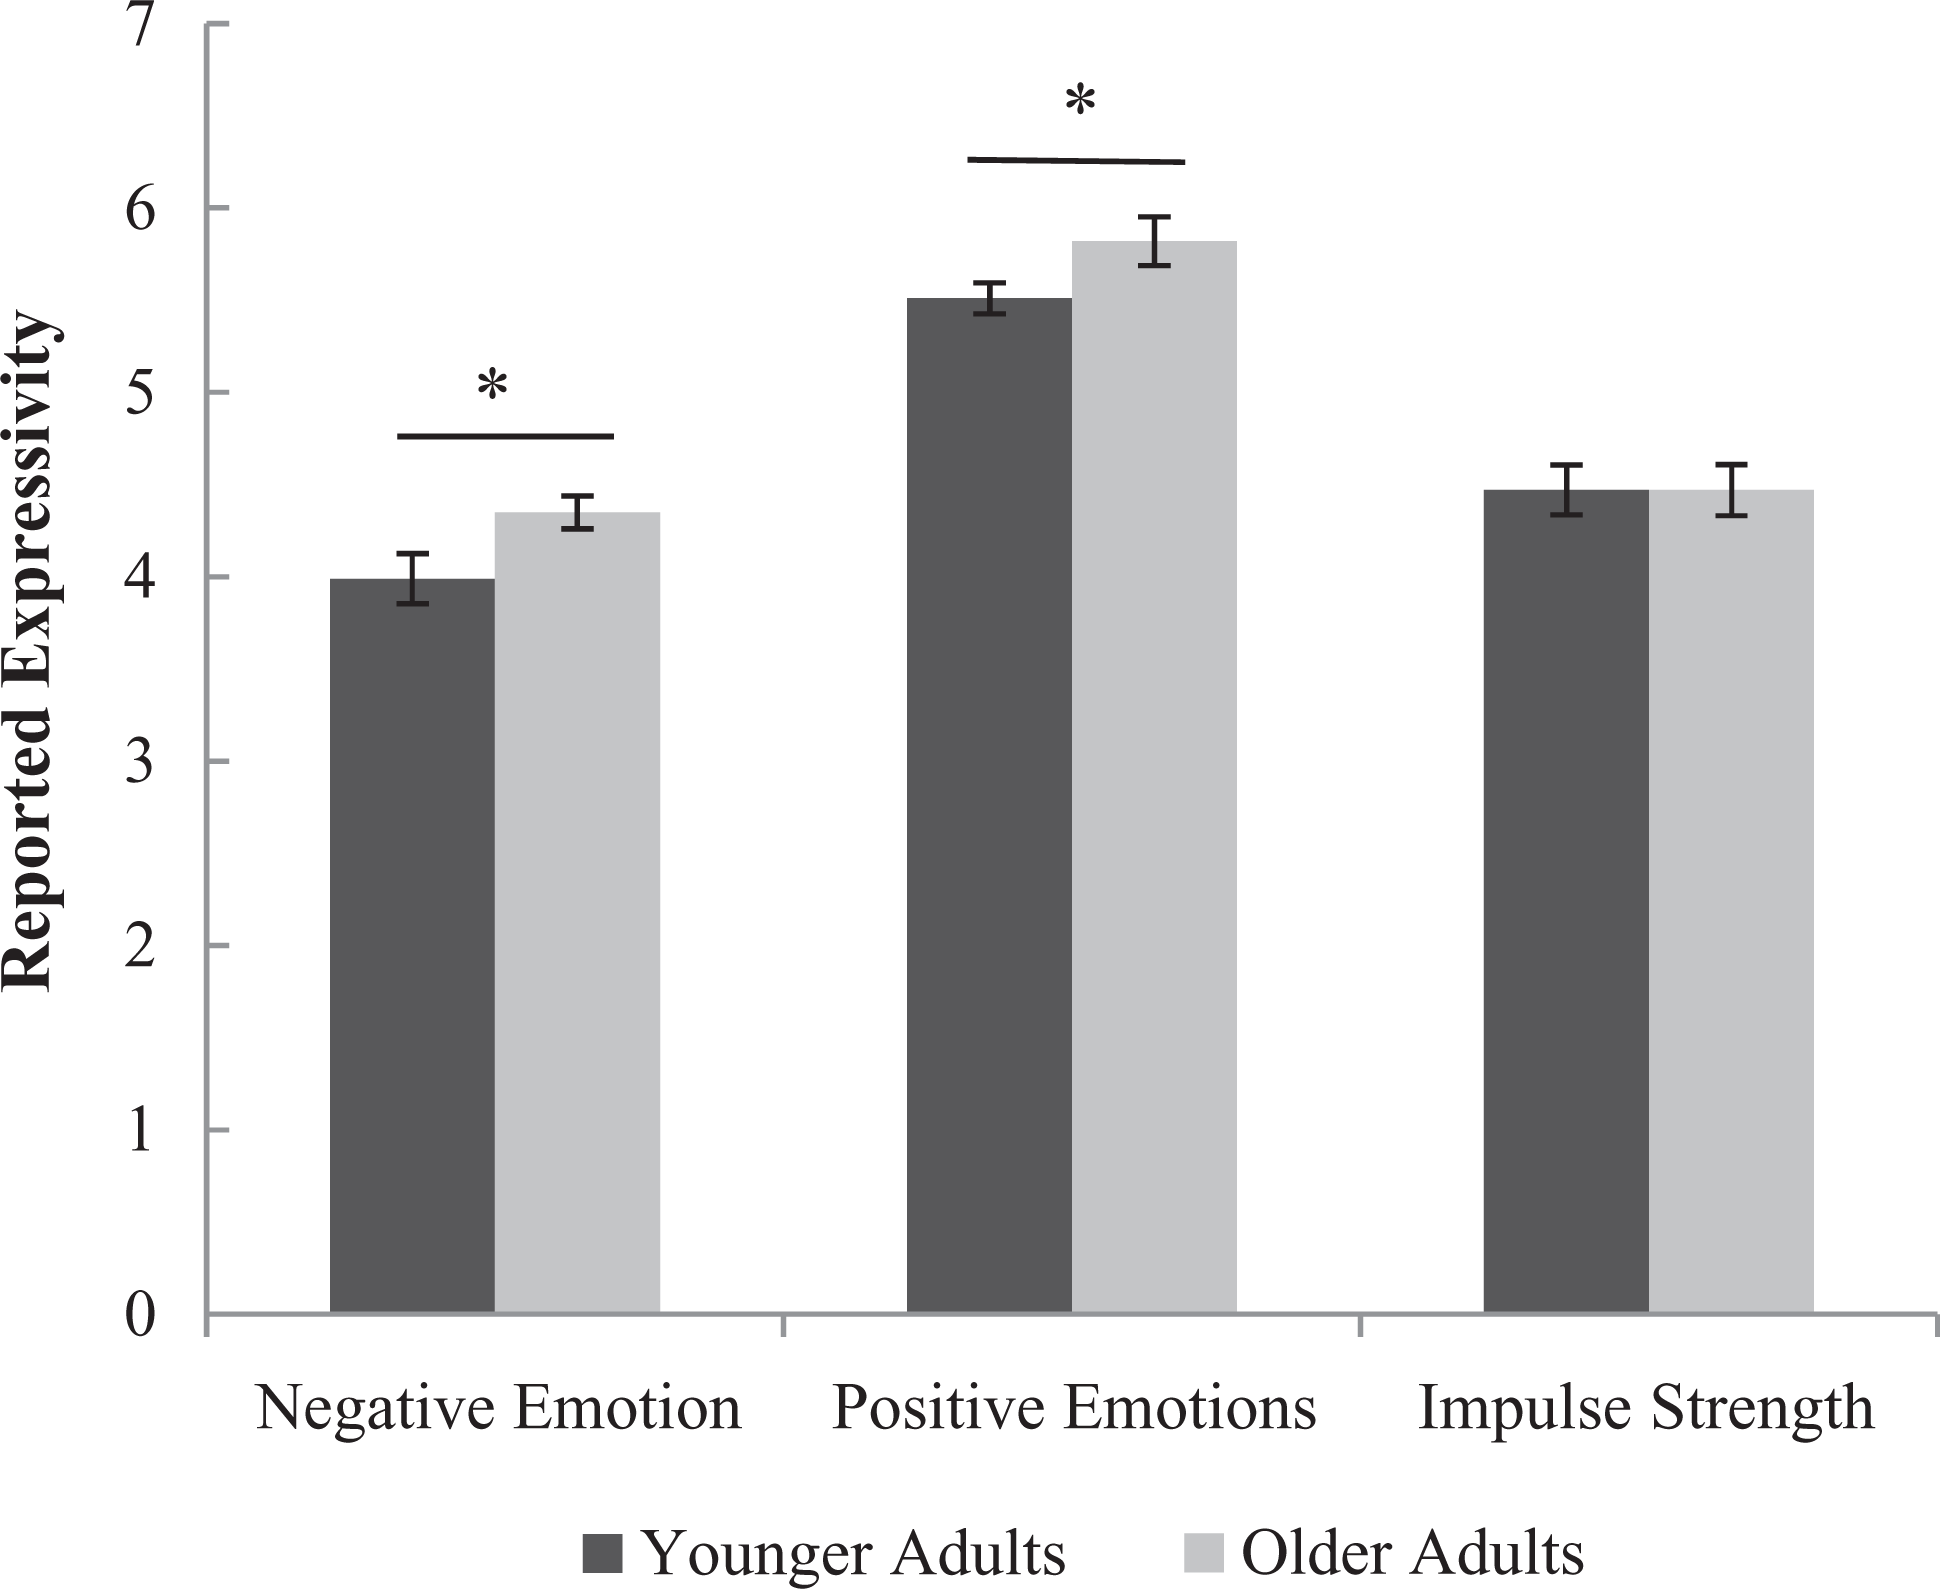
Average expressivity scores for closest social partners of younger and older adults
Emotion-perception accuracy
To test age differences in emotion-perception accuracy, we performed a mixed 2 (Age: younger, older) × 6 (Emotion: happiness, sadness, anger, fear, disgust, neutral) ANOVA. Emotion-perception accuracy means for each emotion and each group are reported in Table 2. Mauchly’s test indicated that the assumption of sphericity had been violated, χ 2 (14) = 46.262, p < .01; therefore, degrees of freedom were corrected using Greenhouse-Geisser estimates of sphericity (ε = .82). There was a significant main effect of emotion, F(4.09, 237.46) = 31.68, p < .01, ηp 2 = .35. Participants were most accurate perceiving happiness, followed by fear, disgust, neutral, anger, and sadness. Older adults were marginally less accurate overall compared to younger adults, F(1, 60) = 3.52, p = .06, ηp 2 = .06, older (M = .82, SD = .09) and younger adults (M = .86, SD = .06). There was no Emotion by Age interaction, F(4.09, 237.46) = 1.17, p = .33, ηp 2 = .14.
Means for emotion-perception tasks by age group.
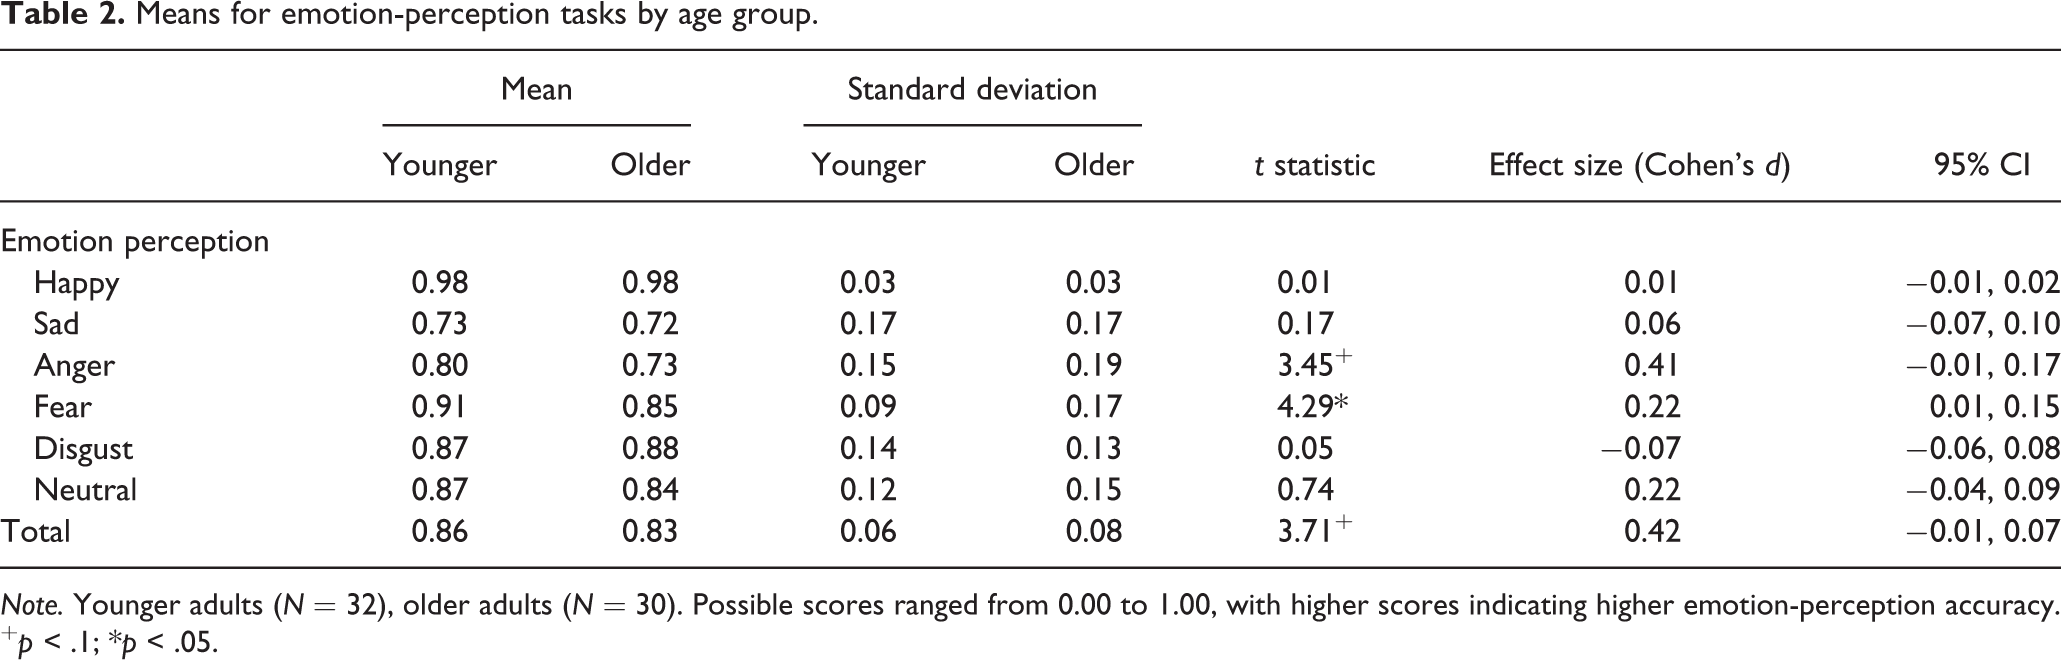
Note. Younger adults (N = 32), older adults (N = 30). Possible scores ranged from 0.00 to 1.00, with higher scores indicating higher emotion-perception accuracy.
+ p < .1; *p < .05.
Social environment predictors of emotion-perception accuracy
Emotion-perception accuracy
A hierarchical regression was conducted to evaluate if expressivity of the social partners uniquely predicted overall emotion-perception accuracy (see Table 3 and Table 4). The individual covariates—mental state, depression, vision, and memory—were entered into the regression model at step 1, F(4, 39) = 2.49, p =.06, R2 = .20, f2 = .25, and accounted for 20.3% of the variance. At step 2, the social environment covariates, social circle sizes and relationship satisfaction, were entered into the model, F(8, 35) = 1.28, p = .28, R2 = .23, f2 = .30, which explained 2.3% additional variance, a non-significant amount, p = .90. Lastly, positive and negative expressivity and impulse strength were entered in step 3, F(11, 32) = 1.45, p = .20, R2 = .33, f2 = .49, and accounted for 10.5% additional variance, a non-significant amount p = .19. Positive expressivity emerged as the only significant predictor of lower overall emotion-perception accuracy in the final step, ß = −.33, (SE =.02), p = .04. Negative expressivity, ß = .04, (SE =.02), p = .84, and impulse strength, ß = .20, (SE =.02), p = .33, were not significant predictors.
Zero-order correlations between predictors and emotion perception.
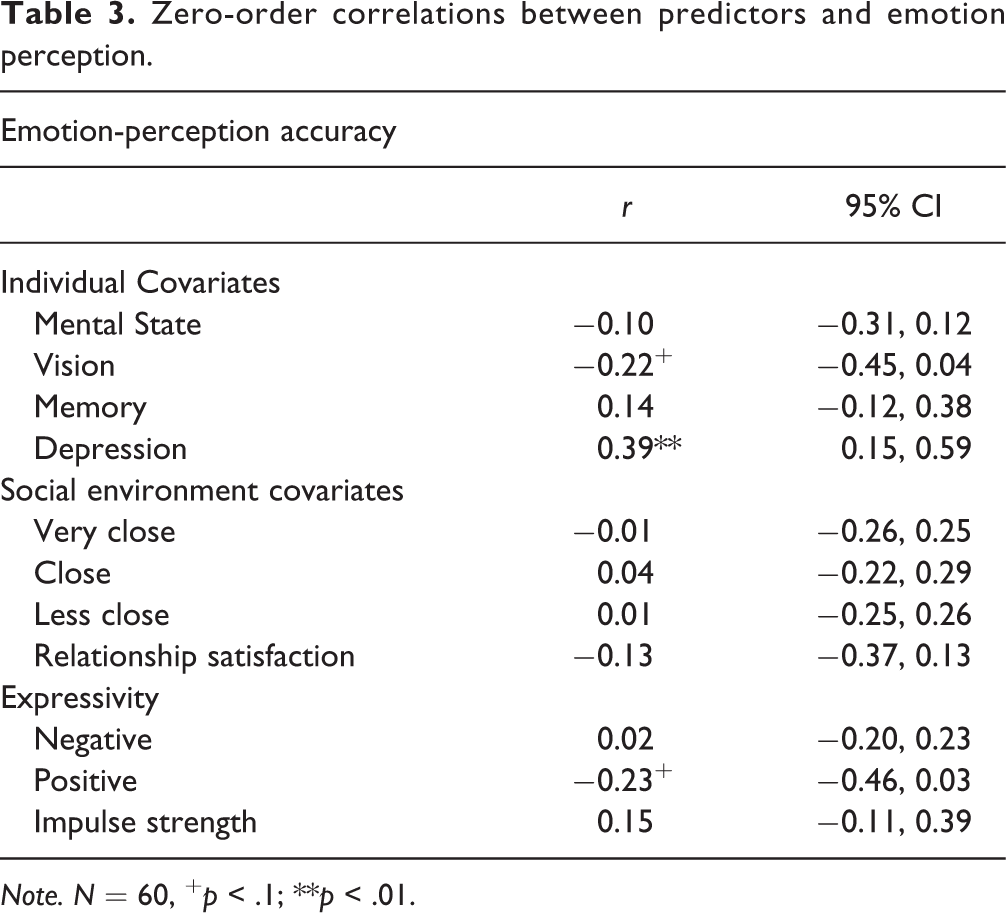
Note. N = 60, + p < .1; **p < .01.
Results for hierarchical regression analyses predicting emotion perception with the social environment.
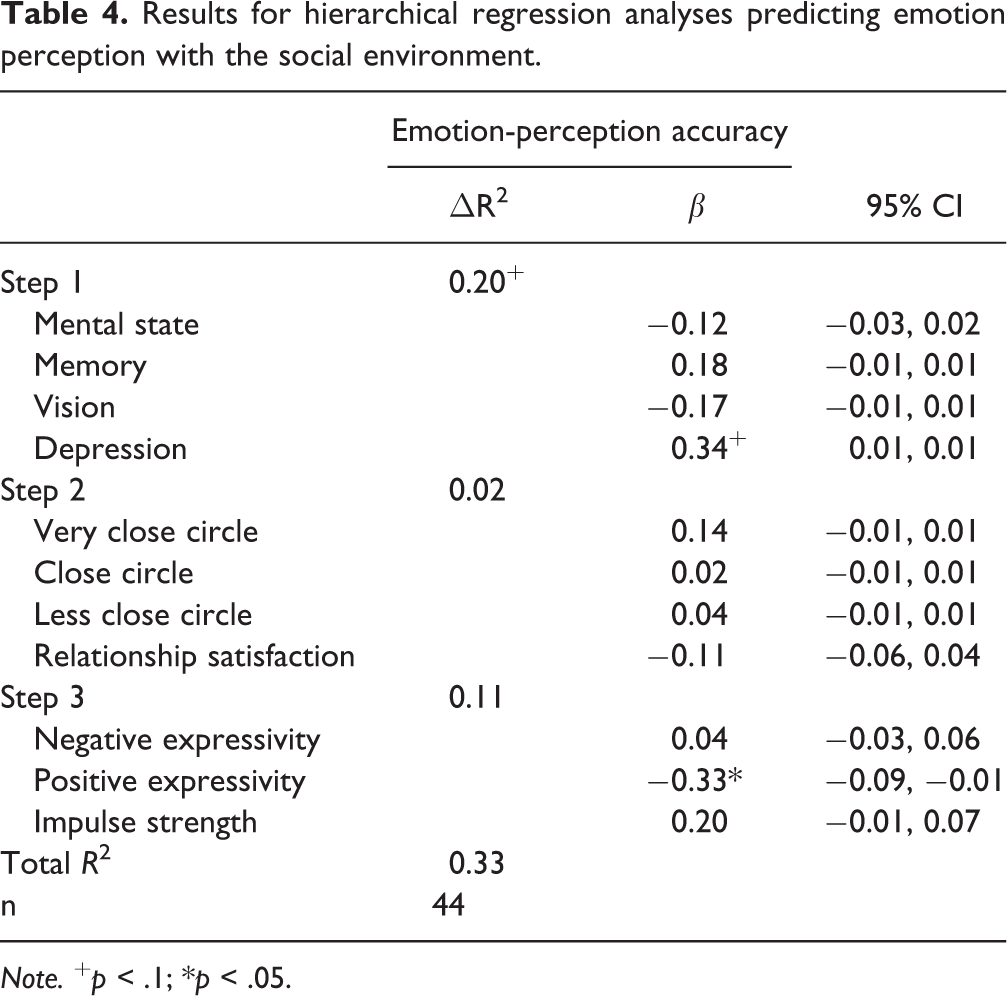
Note. + p < .1; *p < .05.
In order to understand how this relationship might differ by age we performed the same hierarchical regression separately by each age group. In younger adults, again, high positive expressivity of others predicted lower overall emotion-perception accuracy, ß = −.40, (SE = .02), p = .04; however, in older adults, positive expressivity of others was not a significant predictor, ß = .37, (SE = .04), p = .45, and no other predictors were significant.
Because positive expressivity was the only significant predictor and we hypothesized the stronger age difference for negative emotions (anger, sadness, fear, disgust), we performed the hierarchical regressions again, separately by age group, with overall emotion-perception accuracy replaced by negative emotion-perception accuracy. Positive emotion-perception accuracy reached ceiling (M = .98, SD = .03), so it was not investigated further. Younger adults (M = .83, SD = .08) and older adults (M = .80, SD = .08) did not differ significantly in negative emotion-perception accuracy, t(58) = 1.08, p = .29. When controlling for all covariates, positive expressivity predicted lower negative emotion-perception accuracy for younger adults, ß = −.41, (SE = .03), p < .05, but not for older adults, ß = .54, (SE = .05), p = .22. A significance test of the difference between the betas for younger and older adults revealed that positive expressivity was a significantly better predictor of lower negative emotion-perception accuracy for younger adults compared to older adults, z = 2.41, p = .02.
Discussion
Unlike previous research, which has focused mainly on perceiver-based factors, we used the Social Input Model (SIM) as the framework to investigate the impact of the social environment on emotion perception. This approach is unique, in that, it accounts for younger and older adults’ daily social interactions, and how social partners may shape emotion perception across adulthood. Therefore, the present study is both an extension of previous findings with age difference in emotion perception and an exploration into the role of the social environment in younger and older adulthood.
Age differences in social partners’ expressivity
Compared to younger adults, older adults reported more positive and negative expressivity in their closest social partners. That is, older adults reported that their closest social partners have a tendency to express more emotions than do the partners of younger adults, which suggests that older adults may observe the expression of both positive and negative emotions from their closest social partners more frequently than do younger adults. We expected older adults to have a more positive environment based on SIM, but it was surprising that they also reported more negativity compared to younger adults. Although according to SIM, older adults’ social partners may attempt to display more positivity, our findings suggest older adults view their social environment as more expressive overall.
One explanation could be that older adults reference their own expressivity when rating the expressivity of their social partners. If older adults are less expressive than younger adults are (Fölster, Hess, & Werheid, 2014), older adults may rate their younger social partners as more expressive because they are more expressive than they are. The inverse should be true for younger adults’ ratings. Older adults’ social environment may be more expressive because they report more social partners who are younger than they are. Lastly, if this explanation is correct, older adults should rate older adults in their social environment as less expressive compared to the younger adults. However, we found that older adults reported similar expressivity in their offspring and friends suggesting that older adults believe they have a more expressive social environment regardless of the type of social partners they have.
Alternatively, older adults may exaggerate the expressions of others. According to SIM, older adults have a more positive social environment because their social partners act more positively toward them. However, SIM does not address how older adults perceive this environment. Socioemotional Selectivity Theory posits that older adults focus on emotional goals more extensively compared to younger adults (Carstensen, Isaacowitz, & Charles, 1999). Older adults may be more cognizant of the emotions in their social environment, thus rating their social partners as more expressive of both positive and negative emotions. Although the perceived expressivity may be influential, future research should measure the expressivity of the social environment more objectively as well to provide a comparison.
Social partners’ expressivity as a predictor of perception accuracy
Individuals with social partners who express more positive emotion were expected to have lower accuracy when perceiving negative emotions. This relation was expected to moderate the age difference in emotion perception. More positive expression from the closest partners predicted lower accuracy when perceiving negative emotions, but this held true only in younger adults.
Our findings extend previous research that suggests younger adults’ emotion-perception accuracy is hindered by the expressivity in the social environment (Halberstadt, 1983, 1986; Halberstadt & Eaton, 2002; Halberstadt, Dennis, & Hess, 2011). Younger adults’ abilities to perceive negative emotions seem to be inhibited by the expression of positive emotions in the social environment, especially by the expression of their parents and friends. Highly positive social partners may display positive or mixed expressions when they are feeling negative, which may make their cues unreliable. Alternatively, the younger adult pattern is similar to findings that suggest when primed with a congruent facial expression, individuals tend to perform better than when primed with one that is incongruent (Carroll & Young, 2005). Younger adults may view happiness more frequently in the social environment, which may prime them with happiness; therefore, when their expectations are violated by negative expressions, they may make more errors. Future research could use ambiguous facial expressions to match what participants might see in their social environment, or expressivity could be assessed more quantitatively by asking participants to report the frequency of expression in their daily interaction rather than the expressivity of individuals. However, because older adults’ emotion-perception accuracy did not seem to relate to their social partners’ expressivity, other factors could be attenuating the relation in older adulthood.
For older adults, the expressivity of the social environment did not relate to their emotion-perception accuracy. Older adults may not be influenced as much by social partners because they have fewer face-to-face interactions compared to younger adults (Cornwell, 2011). Furthermore, older adults appear to participate in fewer social activities and spend less time overall on social activities (Huxhold, Fiori, & Windsor, 2013). Thus, despite reporting more expressive social partners, older adults’ lessened face-to-face contact with them could dampen the impact of expressivity on their emotion-perception ability. Specifically, older adults may not be utilizing their facial emotion-perception ability as frequently as younger adults if they have fewer in-person interactions; therefore, this lowered utilization could lead to lower accuracy. In order to test whether the frequency of facial emotional expressions contributes to the age difference in emotion perception, future studies should measure the actual number of facial expressions seen in daily interactions over the course of a short period of time and test whether that predicts emotion-perception accuracy.
The majority of past research on the relation between emotion perception and the expressivity of others has concentrated on the expressivity of parents as a predictor (Halberstadt, 1983, 1986; Halberstadt & Eaton, 2002; Halberstadt et al., 2011). The present study assessed the expressivity of a wide range of participants’ closest social partners including parents and other relationships. We took this approach, rather than identifying specific shared social partners, because younger and older adults were unlikely to have similar relationships due to life-course factors such as death and marriage (Antonucci et al., 2004). However, future research should take steps to incorporate more of the social environment to investigate the potential influence of less close social partners, such as coworkers or acquaintances.
Limitations and future directions
The present study examined expressivity of the social environment as a contributing factor of the age difference in emotion-perception accuracy. Although we used an emotion-perception task based on previous literature, we only found a marginal age difference for overall emotion-perception accuracy, which is a limitation of the study. We replicated past findings of age difference when perceiving fear and anger and age similarity for disgusted faces (Ruffman et al., 2008). In contrast with previous studies, we found age-similarity when perceiving happy, sad, and neutral faces (Ruffman et al., 2008). However, a more recent study has found age similarities for all emotions except sadness and disgust (Sze et al., 2012). Additionally, the traditional facial emotion-perception task may lack ecological validity (Isaacowitz & Stanley, 2011). Future research should also measure emotion-perception accuracy using more social tasks such as the perception of social partners of varying closeness and across different modalities.
Another limitation of the study is that participants only reported characteristics of the three closest individuals in their social environment. Because the composition of the social partners of younger and older adults were likely to be nonequivalent, we focused on the individuals closest to the participant regardless of group. Although we would argue that these individuals might be most influential to the participants, we cannot rule out that other social partners—including acquaintances—may or may not relate to participants’ emotion-perception accuracy.
Lastly, we asked participants to report the expressivity of their closest social partners. These ratings may have been subject to the participants’ biases. Previous research suggests that personality relates to perception of social environment properties (Russell, Booth, Reed, & Laughlin, 1997); for example, participants high in neuroticism could have perceived their social environment as higher in negativity. Individuals may also use their own expressivity when recalling others’ expressivity. Future research should therefore also assess objective expressivity of social partners.
The current study has implications for future work linking the social environment to changes in emotion-perception accuracy across adulthood. In line with previous findings, older adults had smaller social circles, but our findings extended the literature by demonstrating that older adults report close social partners that are more expressive of positive and negative emotions. Although younger adults’ emotion-perception accuracy tends to be hindered by the expressivity of their social environment, future research should investigate face-to-face interaction as predictor of age differences in emotion perception. Our findings demonstrate substantial age differences in characteristics of the social environment, and although these differences do not seem to account for the differences in emotion perception in older adults, they do not discount the characteristics of the social environment as potential contributing factor. Rather, they open the door for future research to focus on other aspects such as frequency of social contact. Future investigations should continue to use SIM, as a framework for understanding possible contributing factors for age difference in emotion-perception accuracy. By understanding how older adults interact with individuals in everyday life, we may be able to understand how they perceive the emotions of others.
Footnotes
Funding
The authors received no financial support for the research, authorship, and/or publication of this article.