
Abstract
The goal of this study was to evaluate the measurement invariance of an adapted assessment of motivations for social withdrawal (Social Preference Scale–Revised; SPS-R) across cultural contexts and explore associations with loneliness. Participants were a large sample of university students (N = 4,397; Mage = 20.08 years, SD = 2.96; 66% females) from 10 countries (Argentina, Australia, Canada, China, India, Italy, South Korea, Norway, Turkey, and the United States). With this cross-cultural focus, we illustrate the multiple-group factor analysis alignment method, an approach developed to assess measurement invariance when there are several groups. Results indicated approximate measurement invariance across the 10 country groups. Additional analyses indicated that overall, shyness, avoidance, and unsociability are three related, but distinct factors, with some notable country differences evident (e.g., in China, India, and Turkey). Shyness and avoidance were related positively to loneliness in all countries, but the strength of the association between shyness and loneliness differed in Italy and India relative to the other countries. Results also indicated that unsociability was related positively to loneliness in the United States only. Theoretical and assessment implications are discussed.
Keywords
Social withdrawal refers to the behavioral tendency to withdraw from and avoid familiar and unfamiliar peers (Rubin et al., 2009). Although its concurrent and predictive psychological risks across the lifespan are now well-established, so too is the heterogeneity in the negative psychological outcomes of social withdrawal (Bowker et al., 2012; Bowker & White, 2021). Put simply, not all individuals who regularly withdraw from their peers suffer significantly. To account for this heterogeneity, social withdrawal research has focused on varying motivations (or reasons) for social withdrawal (Coplan & Bowker, 2021). Informed by approach and avoidance models (Asendorpf, 1993), shyness is posited to be rooted in psychological distress. Shy individuals desire to approach and interact with peers, but they ultimately withdraw due to overwhelming fears and anxieties. In contrast, unsociability is posited to involve non-fearful preferences for solitude (and also weak approach and avoidant motivations), and avoidance is believed to be rooted in strong dislike for social interactions (or avoidant motivations) and weak approach motivations. Significantly, numerous studies show that shy and avoidant motivations are more strongly associated with indicators of psychological distress, such as loneliness, relative to unsociability, suggesting that the underlying motivation matters when understanding the risks associated with social withdrawal (Coplan et al., 2021).
The most frequently used measures of withdrawal motivations are the parent-rated Child Social Preference Scale (CSPS; Coplan et al., 2004) for younger children, and its two revisions, the CSPS-R for adolescents (Bowker & Raja, 2011) and emerging adults (Bowker et al., 2017), which were adapted to be developmentally appropriate self-report measures (for other studies that utilized the CSPS-R with emerging adults, see Braathu et al., 2022; White et al., 2022). Unlike the CSPS, both versions of the CSPS-R also included new items to assess avoidant motivations and peer isolation, with the latter not considered a motivation for withdrawal, but instead time alone due to external causes such as ostracism. Initial psychometric work with the CSPS-R provided some evidence that the three motivations were distinct from isolation—and also from each other during adolescence (e.g., based on exploratory factor analyses, with low to moderate inter-factor correlations; Bowker & Raja, 2011). There is little psychometric work with the emerging adult version, although Bowker et al. (2017) provided some evidence of its validity, with results uniquely linking shyness and avoidance (but not unsociability) to loneliness and depressive symptoms. This study, however, also revealed strong correlations among the motivation factors as well as poor internal consistencies for the motivation factors and only involved emerging adults from the United States.
It is not known whether there are mean differences across cultures in shy, unsociable, and avoidant withdrawal motivations. We do know, however, that although there are numerous similarities in the psychological concomitants of the varying withdrawal motivations across cultures, there is also some cultural variability. For example, it has been suggested that unsociability is viewed more positively in Western cultures because of the positive emphasis on individualism and personal choice. In contrast, in China, where group-orientation and collectivism are core facets of the society, choosing to remove oneself from the group is more likely to be perceived as selfish and deviant (Chen, 2019). In support of these notions, unlike the research conducted in the United States and Canada, unsociability is consistently found to be related to negative psychosocial outcomes in China (e.g., Liu et al., 2015). Such findings underscore the importance of cross-cultural studies of withdrawal motivations (Chen, 2019). We contend, however, that to better understand which withdrawn individuals, within and across cultures, are most at risk for negative psychological outcomes, and most in need of clinical intervention, we need measures of withdrawal motivations that are reliable across cultural barriers. Although the three-motivation model (shyness, unsociability, and avoidance) and assessment developed by Coplan, Bowker, Nelson, and others has received both theoretical and some empirical support (e.g., Bowker & Raja, 2011; Nelson, 2013), the reliability evidence remains mostly limited to the U.S., Canadian, and Chinese cultural contexts. In addition, the mean differences in, and cross-cultural implications of, the model and the CSPS-R have not been thoroughly considered. In fact, we were not able to locate a single study that evaluated measurement invariance of either version of the CSPS-R across cultures. Consequently, we argue that researchers should not make assertions about the explanatory power of withdrawal motivations across cultures before measurement invariance of the CSPS-R is established. Cultures differ in the extent to which they value and actively socialize their children to engage or approach, rather than avoid, others (Chen, 2019). These cultural differences and others (discussed below) may in turn influence the ways in which varying withdrawal motivations develop, are expressed, and received by others.
Current Study
The overarching goal of the current study is to test for measurement invariance in the CSPS-R, and pending these results, evaluate mean differences in the CSPS-R factors and how they are related to one of the most commonly studied outcomes of withdrawn behavior and motivations, loneliness (i.e., social dissatisfaction or perceived social inadequacies; Asher et al., 1984). Loneliness is also one of the strongest predictors of later internalizing symptomology, including social anxiety and depressive symptoms (Lim et al., 2016), with some of the strongest links during emerging adulthood, highlighting the importance of understanding its predictors during this developmental period. Establishing measurement invariance for the CSPS-R is a timely and necessary next step in the ever-growing withdrawal motivation area of research. This would, in turn, allow not only cross-cultural comparisons in motivations but also cross-cultural comparisons in the associations between the motivations and psychological outcomes.
Ten countries are included in this study, including the two Western countries (the United States and Canada) and one non-Western country (China) where the majority of recent research in this area has been conducted. To provide additional informative cultural contrasts, we also included samples from Argentina, Australia, India, Italy, Korea, Norway, and Turkey. Many of these countries are relatively new to the social withdrawal research area (which prevents us from developing strong a priori hypotheses) and vary not only in the extent to which they socialize and prioritize social interactions and initiations, but also in the degree to which they are, broadly, considered independent (like the United States and Canada, but also Australia, Italy, and Norway) and interdependent (similar to China, and also Korea, Turkey, Argentina, and India) in their cultural norms and values (e.g., Triandis, 1995).
We evaluate self-reports of withdrawal motivations and loneliness in large samples of university students in these countries. The focus on university students allows us to examine the psychometric properties of the CSPS-R (as it was revised for emerging adults) among individuals who are often experiencing new freedom to decide how to spend their free time, including whether, and when, to engage with peers or withdraw (Nelson & Millet, 2021). Emerging adulthood is also when withdrawn behavior may interfere with the completion of numerous tasks (e.g., occupation obtainment), which in turn, may have negative cascading consequences.
Evaluating and establishing exact measurement invariance using more traditional strategies such as multigroup confirmatory factor analysis (MG-CFA) is often difficult to achieve when there are many groups (Kim et al., 2017), such as is the case in our study of 10 countries. As such, we used a newer method to evaluate for approximate measurement invariance, referred to as a multiple-group factor analysis alignment, which addresses the limitations of the more restrictive MG-CFA with its focus on the configural model (Asparouhov & Muthén, 2014; Muthén & Asparouhov, 2014). This approach has been used with increasing frequency in other areas of research (e.g., political science; Coromina & Peral, 2020), but continues to be rarely used in developmental research.
Method
Participants
Participants were N = 4,397 undergraduate students (n = 2,891; 66% female) enrolled in introductory psychology courses (Mage = 20.08, SD = 2.96). Participants were from urban regions in 10 countries: Argentina, Australia, Canada, China, India, Italy, Korea, Norway, Turkey, and the United States (for more information about sociodemographic characteristics of each country group, see Table 1). The total sample included university students from different ethnic groups, with approximately 30% (n = 1,342) self-reporting as Caucasian, 42% (n = 1,834) as Asian, 2% (n = 103) as Black, 7% (n = 313) as Hispanic/Latinx, 2% (n = 65) as Arabic, and 4% (n = 161) as “Other” (missing data was reported for 13% of participants, n = 579).
Sample Sociodemographic Characteristics by Country.

Procedures
Ethics approval was obtained for all sites (see Appendix 1 for specific ethics approval information). All participants first provided informed consent and then completed several questionnaires, including some that were not of interest in this study, as part of a larger cross-cultural study on solitary experiences among university students. Participants either completed paper-and-pencil measures or completed the measures online (through Qualtrics, SurveyMonkey, Limesurvey, Nettskjema, or FluidSurveys), and many received course credit for their study participation. In countries in which English was not the primary language, measures were translated into their respective native language and then back-translated into English, with any discrepancies resolved by an expert panel.
Measures
Social Withdrawal Motivations
Participants completed the 21-item revised version of the Child Social Preference Scale-Revised for emerging adults (CSPS-R; Bowker et al., 2017), which is a self-report developmentally appropriate adaption of the CSPS (Coplan et al., 2004) that assesses varying motivations leading emerging adults to withdraw from their peers. The measure includes items descriptive of shy (e.g., “Feeling shy to hang out with others”), unsociable (e.g., “Do not mind spending time alone”), and avoidant motivations (“I try to avoid spending time with others”) as well as peer isolation, which was not of interest and thus excluded in analyses. Participants reported how much they were like each item on a 5-point scale (1 = not at all, 5 = a lot). Psychometric properties are reported in the “Results” section.
Loneliness
Participants completed the 20-item version of the UCLA Loneliness Scale (Russell et al., 1978), indicating how often each of the statements was descriptive of them on a 4-point scale (0 = never, 3 = often). For the present study, we used 5 items that have been demonstrated previously to be appropriate for cross-cultural comparisons (Hudiyana et al., 2021; e.g., “I feel left out”; “I feel isolated from others”). We confirmed the cross-culturally equivalence of the 5 items across the cultural groups in our study (see supplemental materials) and found good reliability values in the total sample (ω = .85) and in each cultural group (ωs = .89, .89, .85, .81, .74, .83, .83 in Canada, United States, Italy, China, India, Turkey, and Korea, respectively 1 ). This loneliness measure has been widely used in different countries (e.g., Auné et al., 2022; Boffo et al., 2012).
Data Analytic Approach
To examine the invariance of the CSPS-R across the 10 country groups, we first ran a series of exploratory factor analyses (EFAs) using Geomin as the oblique method of rotation in the United States sample (i.e., the calibration sample). The United States was chosen as the calibration sample since the scale was developed and revised by one of the study authors in this country (Bowker et al., 2017; Bowker & Raja, 2011). Initial EFAs were conducted to ascertain the goodness of different factor solutions (from 1-factor solution to 4-factor solution) and to individuate the items that displayed the best psychometric properties (e.g., primary factor loadings above .30, no cross-loadings; Costello & Osborne, 2005). Using the most acceptable EFA solution, we also ran a confirmatory factor analysis (CFA) in the U.S. sample to evaluate its model fit.
Then, using the CFA model tested in the U.S. sample, we performed the multigroup factor analysis alignment method to check the invariance of the scale across the 10 country groups (Asparouhov & Muthén, 2014; Muthén & Asparouhov, 2014). As noted previously, the alignment method is appropriate when there are many groups involved, providing approximate (rather than exact) factor loadings and intercepts invariance. Approximate measurement invariance is obtained when less than 25% of the estimated parameters are non-invariant. As a set of exploratory analyses, we also ran the traditional MG-CFA to analyze the gender invariance of the scale across two groups (males vs. females) in the overall sample, testing Configural invariance (i.e., the same pattern of fixed and free-factor loadings are estimated across groups), Metric invariance (i.e., the factor loadings for items are constrained to be equal across groups), and Scalar invariance (i.e., the intercepts are constrained to be equal across groups; the scalar invariance allows to test differences in mean values across groups). For model comparison, we considered the difference in comparative fit index (CFI) with a critical level of −.01 (Cheung & Rensvold, 2002) (see supplemental materials). The models were evaluated based on previously established criteria for acceptable model fit indices including CFI, Tucker–Lewis index (TLI) (>.90), and standardized root-mean-square residual (SRMR; <.08) (Hu & Bentler, 1999). Because root-mean-square-error-of-approximation (RMSEA) values tend to increase when multiple groups are involved, a more liberal cut-off of .10 was used to evaluate model fit (Rutkowski & Svetina, 2014).
We then performed a multigroup analysis to evaluate the association between the individuated factors of the CSPS-R across the cultural groups. Finally, multivariate multigroup regression analysis was run to evaluate the links between the individuated factors to self-reports of loneliness. In both of these models, the fit of the unconstrained model (i.e., all paths were freely estimated across the groups) was compared with the fit of the constrained model (i.e., all paths were constrained to be equal across the groups) through the chi-square difference test for nested models (Δχ2) to evaluate possible differences in the paths across the country groups. All the analyses were run in Mplus 8 (Muthén & Muthén, 1998–2017) with the maximum likelihood estimator with robust standard errors to non-normality. Missing data, ranging from 0% to 3% across countries, were handled using the full-information maximum-likelihood estimation of the parameters.
Results
Factor Structure of the CSPS-R in the U.S. Sample
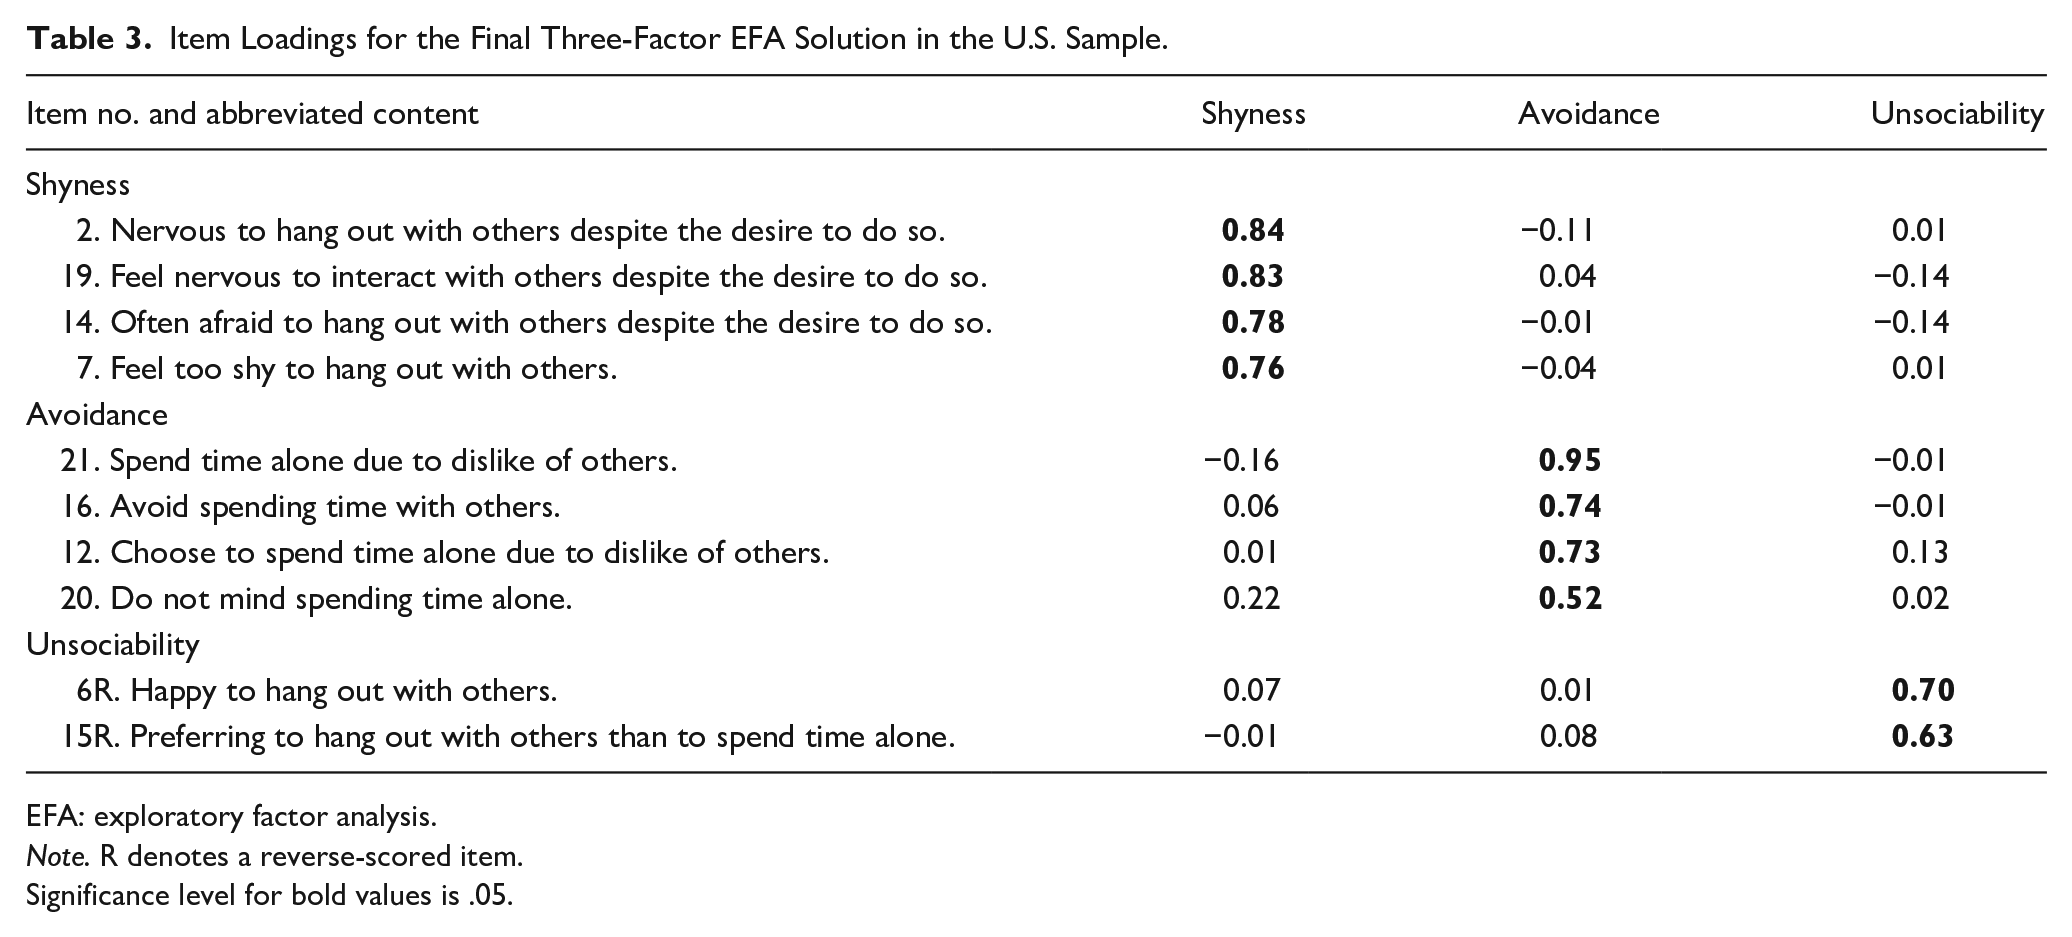
The 3-factor solution showed the best fit indices (Table 2). However, 11 items were removed because they showed poor psychometric properties (i.e., low factor loadings on the intended factor and/or cross-loading items). The results of the final EFA solution are displayed in Table 3. This adapted scale was renamed as the Social Preference Scale–Revised (SPS-R). The first factor, labeled shyness, was defined by 4 items (primary factor loadings ranged from .76 to .84), the second factor, labeled avoidance, comprised 4 items (primary factor loadings ranged from .52 to .95), and the third factor, labeled unsociability, was defined by 2 items (primary factor loadings ranged from .63 to .70).
EFA Factor Solutions for the U.S. Sample.
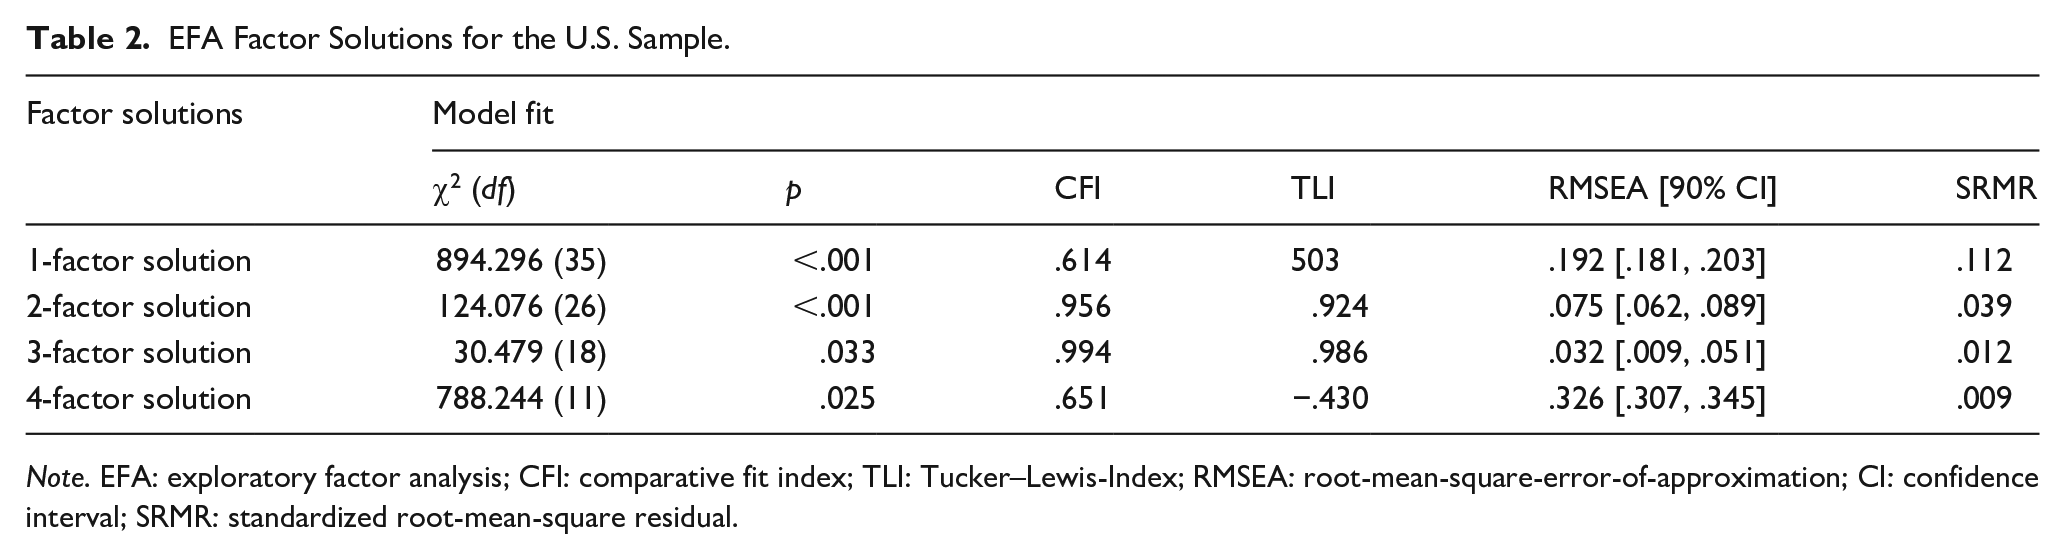
Note. EFA: exploratory factor analysis; CFI: comparative fit index; TLI: Tucker–Lewis-Index; RMSEA: root-mean-square-error-of-approximation; CI: confidence interval; SRMR: standardized root-mean-square residual.
Item Loadings for the Final Three-Factor EFA Solution in the U.S. Sample.
EFA: exploratory factor analysis.
Note. R denotes a reverse-scored item.
Significance level for bold values is .05.
The CFA conducted with the final 3-factor EFA solution displayed a good model fit, χ2(32) = 92.333, p < .001, CFI = .973, TLI = .962, RMSEA = .053 [90% confidence interval, CI = .041, .066], SRMR = .039. Factor loadings ranged from 0.73 to 0.85, .68 to .82, and .60 to .70 for the shyness, avoidance, and unsociability factors, respectively. At the latent level, the three factors were correlated positively (shyness with avoidance r = 0.58, p < .001, shyness with unsociability r = 0.11, p = .046, avoidance with unsociability r = 0.54, p < .001).
Cross-Cultural Measurement Invariance of the SPS-R Across the 10 Countries
The configural CFA model had an acceptable fit, 2 χ2(383) = 1,093.151, p < .001, CFI = .945, TLI = .936, RMSEA = .065 [90% CI = .061, .070], SRMR = .064. Results from the multiple-group factor analysis alignment method revealed that at the factor-loading level, there were non-invariant factor loadings in the United States (Item 2 for the shyness factor), Turkey (Item 16 of the avoidance factor), India (Item 7 of the avoidance factor), and China (Item 15R of the unsociability factor). At the intercept level, results showed that there were non-invariant intercepts in Turkey (Items 2, 16, and 20), Canada (Item 14), Australia (Item 14), Korea (Items 12 and 14), China (Items 15R and 21), and Norway (Item 19). Overall, 7% of the estimated parameters were not invariant, suggesting an approximate measurement invariance of the SPS-R measure across the 10 country groups. The reliability of the three factors was good for most groups (ω values ranged from .78 to.87 for the shyness factor, from .64 to .85 for the avoidance factor, and from .64 to .81 for the unsociability factor). 3
Table 4 reports the means for the three factors as estimated by the alignment method. For shyness, participants from Korea and China reported the highest mean levels, and those from Argentina, Turkey, and Italy reported the lowest levels. For avoidance, Indian and Korean participants reported the highest mean levels, and those from Argentina, Italy, and Norway reported the lowest levels. Finally, for unsociability, participants from Turkey and China reported the highest mean levels, whereas participants from Italy, India, and Argentina reported the lowest mean levels.
SPS-R Items: Factor Mean Comparisons of the 10 Countries.

Note. Data collection groups: KOR: Korea; CHN: China; IND: India; NOR: Norway; CAN: Canada; AUS: Australia; USA: United States of America; ITA: Italy; TUR: Turkey; ARG: Argentina.
The means, ordered from high to low, are shown for the groups that have factor means significantly different at the 5% level. Average Invariance Index = 0.716; this index represents the degree of confidence for mean comparisons across the groups, with values ranging from 0 (full non-invariance) to 1 (perfect scalar invariance).
Multigroup Analysis for Shyness, Avoidance, and Unsociability
Table 5 reports the means and standard deviations of the study variables. To test possible differences in the associations between shyness, avoidance, and unsociability across the 10 country groups, we ran a multigroup analysis. 4 The unconstrained model showed a good fit, χ2(27) = 32.162, p = .23, CFI = .997, TLI = .994, RMSEA = .021, 90% CI = [.001, .045], SRMR = .027, but it was statistically different, Δχ2(27) = 189.047, p < .001, from the constrained model, χ2 (54) = 221.209, p < .001, CFI = .913, TLI = .904, RMSEA = .084, 90% CI = [.073, .096], SRMR = .120, suggesting cultural differences in the parameters estimated. Based on the modification indexes and the chi-square contribution, we relaxed the correlation between avoidance and unsociability in Turkey, China, Australia, and India. We also relaxed the correlation between unsociability and shyness in China and the correlation between shyness and avoidance in Canada, the United States, Australia, and Norway. The partially constrained model, χ2(45) = 58.236, p = .09, CFI = .993, TLI = .991, RMSEA = .026, 90% CI = [.001, .044], SRMR = .051, did not differ from the unconstrained model, as indicated by the nonsignificant chi-square difference test, Δχ2(18) = 26.074, p = .09. Results of the partially constrained path model revealed that shyness, avoidance, and unsociability were correlated positively in nearly all country groups. However, the association between avoidance and unsociability was stronger in Australia and Turkey and weaker in China and India compared with the other countries. Also, the association between unsociability and shyness was negative in China, and the relation between shyness and avoidance was stronger in the United States, Canada, Australia, and Norway compared with the other countries (Table 6).
Means and Standard Deviations for Shyness, Avoidance, Unsociability, and Loneliness by Country.

Note. The loneliness measure was not administered in Argentina, Australia, and Norway. The range of the scales was 1 (not at all) – 5 (a lot) for shyness, avoidance, and unsociability and 0 (never) – 3 (often) for loneliness, with higher scores meaning higher levels of the construct.
Associations Between Shyness, Avoidance, and Unsociability in the Final Multigroup Analysis.
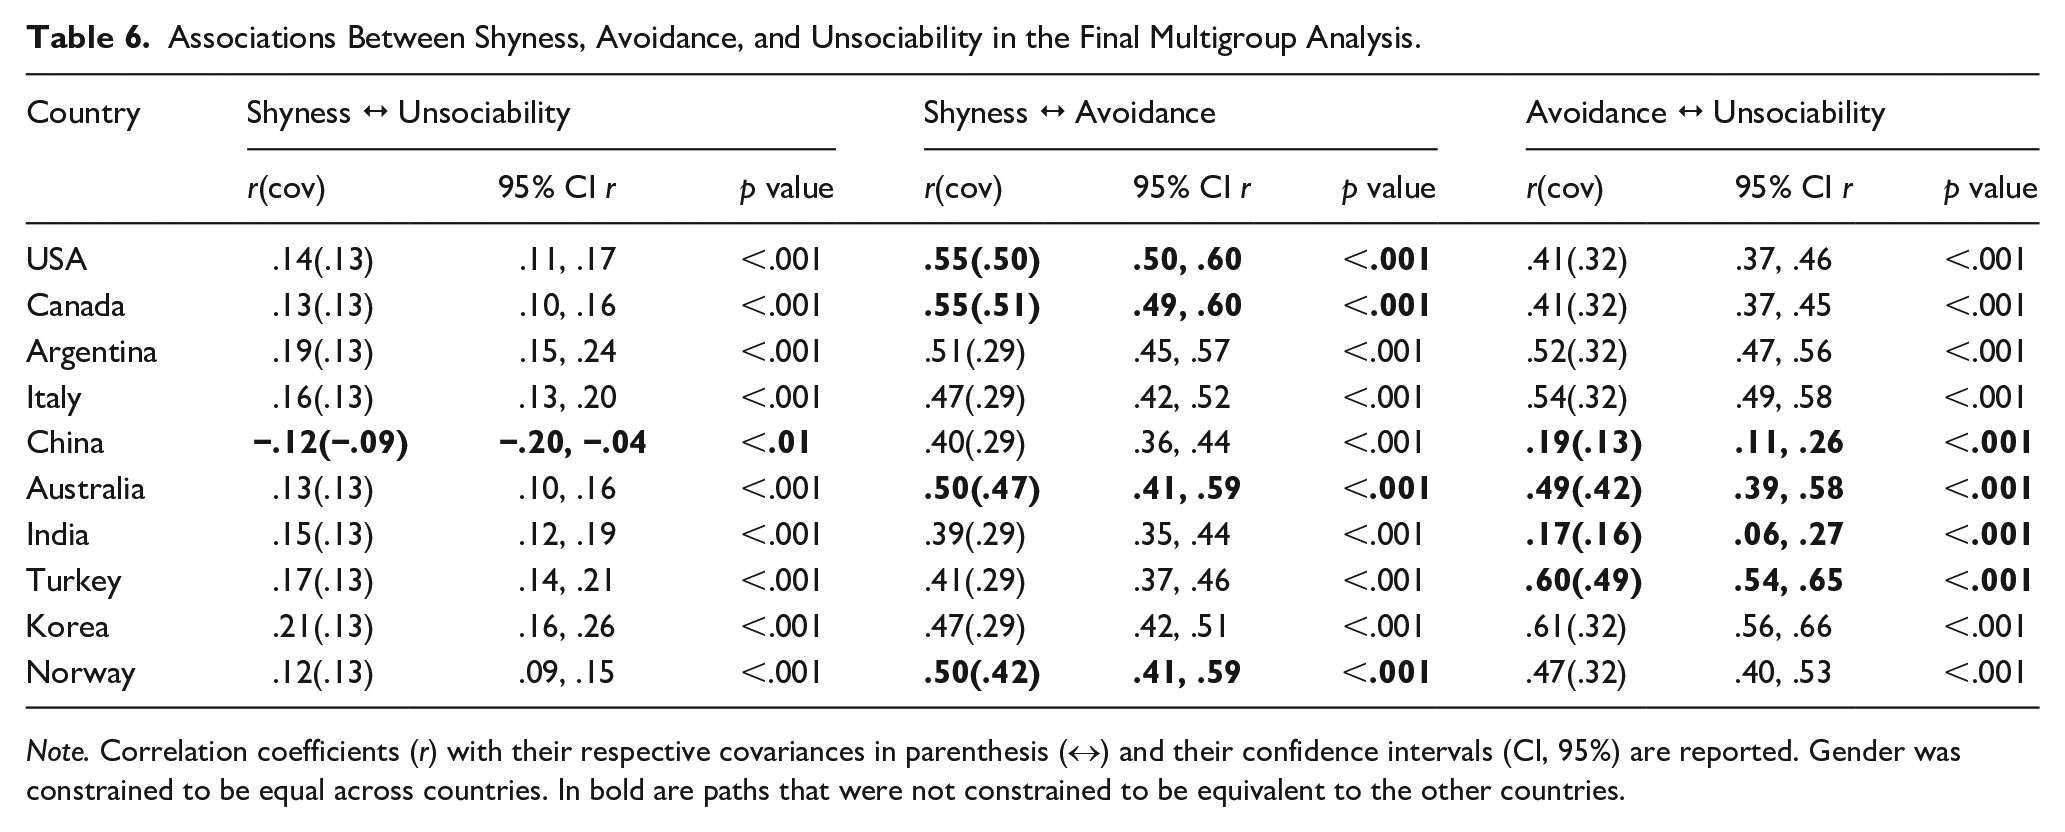
Note. Correlation coefficients (r) with their respective covariances in parenthesis (↔) and their confidence intervals (CI, 95%) are reported. Gender was constrained to be equal across countries. In bold are paths that were not constrained to be equivalent to the other countries.
Multivariate Multigroup Regression Analysis
The unconstrained model showed a good fit, χ2(12) = 13.316, p = .35, CFI = .998, TLI = .995, RMSEA = .015, 90% CI = [.001, .050], but it was statistically different, Δχ2(18) = 40.972, p < .001, from the constrained model, χ2(30) = 54.288, p = .01, CFI = .970, TLI = .965, RMSEA = .041, 90% CI = [.023, .058], suggesting cultural differences in the parameters estimated. 5 Based on the modification indexes and the chi-square contribution, we relaxed some parameters in India, Italy, and the United States. The partially constrained model, χ2(27) = 33.885, p = .17, CFI = .991, TLI = .989, RMSEA = .023, 90% CI = [.001, .044], did not differ from the unconstrained model, as indicated by the nonsignificant chi-square difference test, Δχ2(15) = 20.569, p = .15. Results of the partially constrained model revealed that shyness and avoidance were associated positively with loneliness in all country groups (representing initial evidence of concurrent validity), but the magnitude of the association between shyness and loneliness was different in Italy (stronger) and India (weaker) compared with the other groups. In addition, the association between unsociability and loneliness was significant and positive in the United States but not in the other groups (Table 7).
Links Between Shyness, Avoidance, Unsociability, and Loneliness in the Final Multigroup Regression Analysis.
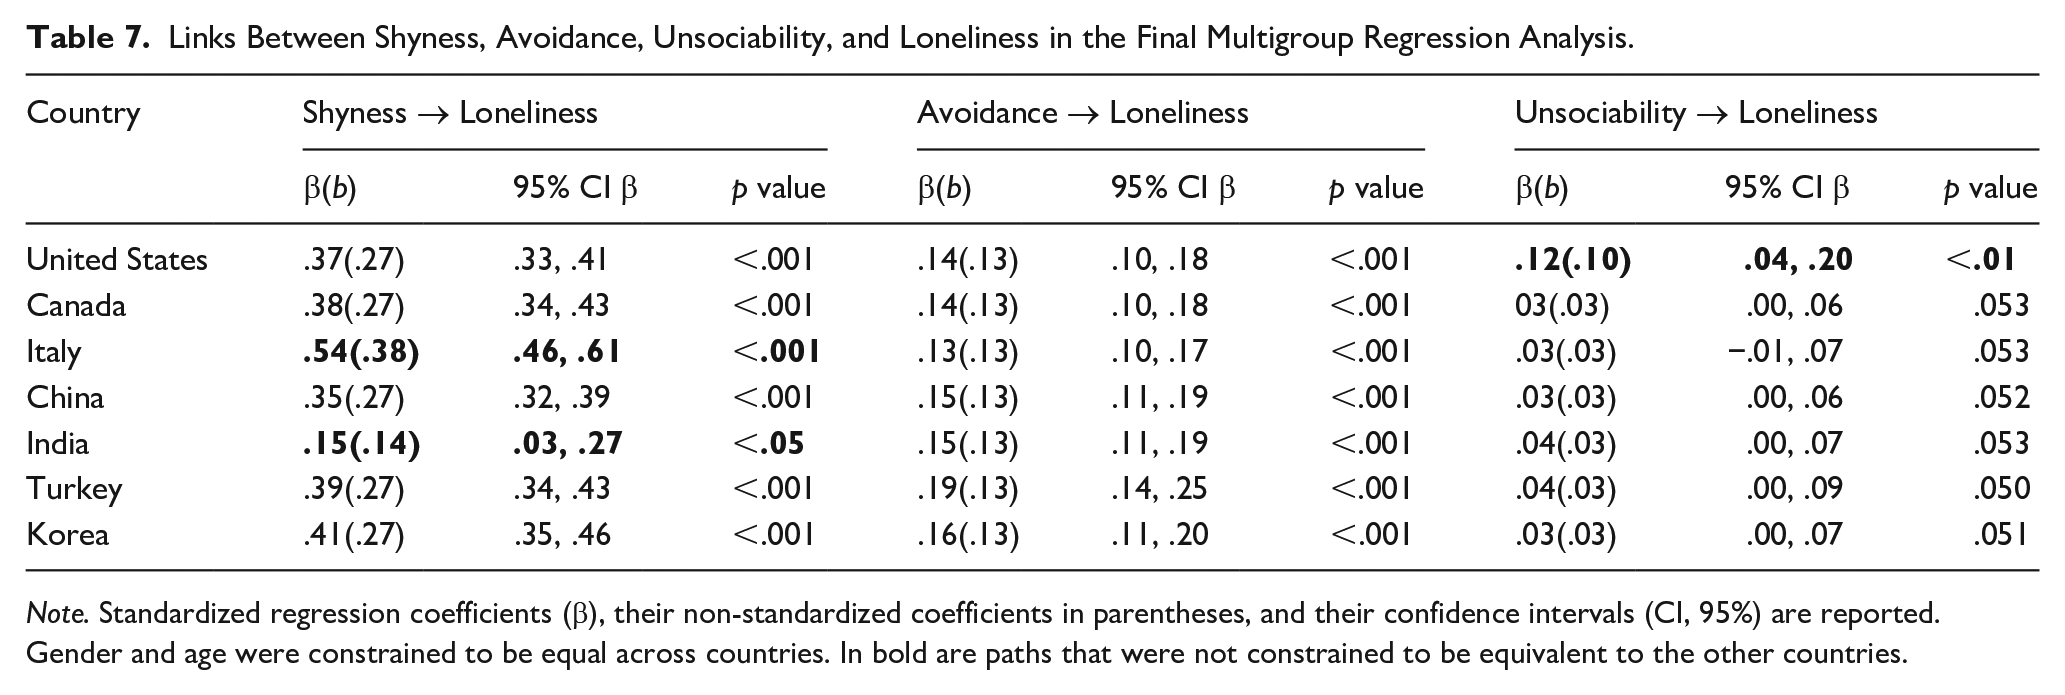
Note. Standardized regression coefficients (β), their non-standardized coefficients in parentheses, and their confidence intervals (CI, 95%) are reported. Gender and age were constrained to be equal across countries. In bold are paths that were not constrained to be equivalent to the other countries.
Discussion
The current study investigated whether the newly adapted SPS-R measure is appropriate for the assessment of social withdrawal motivations during emerging adulthood in different cultures. To do so, we utilized the multiple-group factor analysis alignment (Asparouhov & Muthén, 2014; Muthén & Asparouhov, 2018), which is particularly suitable for evaluating approximate measurement invariance across a large number of groups. In a sample of more than 4,000 university students, results showed evidence of measurement invariance for the SPS-R across the 10 country groups. These findings are significant as they are the first to suggest that the SPS-R may be used to meaningfully compare levels of social withdrawal motivations across different countries. Measurement invariance was evinced for a 3-factor model of shyness, avoidance, and unsociability, consistent with the commonly analyzed three CSPS-R factors. Leading theory in this area of research also typically distinguishes between shyness, unsociability, and avoidance (although there have been some exceptions, such as Wang et al., 2013). Thus, it is noteworthy that the findings herein confirm, for the first time, that across cultures, it appears accurate, at least when using the SPS-R, to distinguish between motivations for withdrawal rooted in strong approach and avoidance motivations (shyness), weak approach and avoidance motivations (unsociability), and weak approach and strong avoidance motivations (avoidance).
Also noteworthy were findings showing several mean country group differences. For example, Korean and Chinese university students reported the highest means on shyness, avoidance, and unsociability, perhaps due to social and cultural norms and values in each country which emphasize modesty and humility (Korea) and reflection and solitude (China) (Gelfand et al., 2011; Inglehart & Welzel, 2005). Of course, it is difficult to generalize across entire countries (and the lack of a direct assessment of culture was a significant limitation of our study), such as Korea and China, which are diverse in many ways, including in their prevailing cultural norms and values.
Another notable country difference emerged: shyness was found to be more strongly related to loneliness in Italy relative to the other country groups, perhaps due to the unique expectations for social assertion and connectedness in many regions of Italy. Regardless, we think it is important to emphasize that for the first time, with factors found to be invariant across cultures, we found that both shyness and avoidance were related uniquely and positively to reports of loneliness, which underscores the importance of considering both social withdrawal motivations in studies of social withdrawal and its negative psychosocial concomitants across cultures. Perhaps increased globalization, stronger international communication, and more shared global values in recent years is increasing risks associated with strong avoidant motivations (as evident in both shyness and avoidance) to spend time alone across cultures. Consistent with prevailing notions about and earlier findings suggesting that unsociability may be relatively benign, our findings also suggest that those who lack strong desires for interaction, perhaps due to non-fearful preferences for solitude, might not suffer psychologically from the lack of social interaction—unless they reside in the United States. This finding was not expected, but may be because unsociability and its lack of social initiation contrasts sharply with ever-growing independent and assertive cultural goals in the United States. Of course, future research will be needed to replicate our study findings and longitudinal data should be utilized to evaluate the stability of the factors over time as well as the direction of effects. Of note, in its current form, the SPS-R unsociability scale comprises 2 reverse-scored items that pertain to enjoyment of, and preference for, social interaction. It would be of interest in the future to consider additional items descriptive of the non-fearful preference for solitude aspect of unsociability (i.e., enjoyment of solitude). Notwithstanding, we hope that this study will set the stage for future cross-cultural work on social withdrawal motivations and that the multiple-group factor analysis alignment method will be useful for developmental scientists around the globe.
Supplemental Material
sj-docx-1-jbd-10.1177_01650254221132774 – Supplemental material for Cross-cultural measurement of social withdrawal motivations across 10 countries using multiple-group factor analysis alignment
Supplemental material, sj-docx-1-jbd-10.1177_01650254221132774 for Cross-cultural measurement of social withdrawal motivations across 10 countries using multiple-group factor analysis alignment by Julie C. Bowker, Stefania Sette, Laura L. Ooi, Sevgi Bayram-Ozdemir, Nora Braathu, Evalill Bølstad, Karen Noel Castillo, Aysun Dogan, Carolina Greco, Shanmukh Kamble, Hyoun K. Kim, Yunhee Kim, Junsheng Liu, Wonjung Oh, Ronald M. Rapee, Quincy J. J. Wong, Bowen Xiao, Antonio Zuffianò and Robert J. Coplan in International Journal of Behavioral Development
Supplemental Material
sj-docx-2-jbd-10.1177_01650254221132774 – Supplemental material for Cross-cultural measurement of social withdrawal motivations across 10 countries using multiple-group factor analysis alignment
Supplemental material, sj-docx-2-jbd-10.1177_01650254221132774 for Cross-cultural measurement of social withdrawal motivations across 10 countries using multiple-group factor analysis alignment by Julie C. Bowker, Stefania Sette, Laura L. Ooi, Sevgi Bayram-Ozdemir, Nora Braathu, Evalill Bølstad, Karen Noel Castillo, Aysun Dogan, Carolina Greco, Shanmukh Kamble, Hyoun K. Kim, Yunhee Kim, Junsheng Liu, Wonjung Oh, Ronald M. Rapee, Quincy J. J. Wong, Bowen Xiao, Antonio Zuffianò and Robert J. Coplan in International Journal of Behavioral Development
Footnotes
Appendix 1
The institutions that granted ethics approvals, and dates of these approval (and also approval numbers, where available), were as follows: Carleton University, 14 August 2014 (#14-130); Ege University, 10 April 2017 (#101-2017); Macquarie University, 4 October 2016 (#52012000029); Sapienza University, 8 March 2017; Shanghai Normal University, 1 November 2016; University at Buffalo, 15 January 2015; University of Oslo, 14 March 2018 (#2795534); and Yonsei University, 31 July 2017 (#7001988-201807-HR-251-03). Approval for the sites in Argentina and India were obtained with the Canadian (Carleton University) and United States (University at Buffalo) universities, respectively.
Declaration of Conflicting Interests
The author(s) declared no potential conflicts of interest with respect to the research, authorship, and/or publication of this article.
Funding
The author(s) disclosed receipt of the following financial support for the research, authorship, and/or publication of this article: This research was supported, in part, by a Social Science and Humanities Research Council of Canada Insight Grant (435-2017-0849) to authors R.J.C. and J.C.B.
Supplemental material
Supplemental material for this article is available online.
Notes
References
Supplementary Material
Please find the following supplemental material available below.
For Open Access articles published under a Creative Commons License, all supplemental material carries the same license as the article it is associated with.
For non-Open Access articles published, all supplemental material carries a non-exclusive license, and permission requests for re-use of supplemental material or any part of supplemental material shall be sent directly to the copyright owner as specified in the copyright notice associated with the article.