
Abstract
The present study investigates topic coverage and sentiment dynamics of two different media sources, Twitter and news publications, on the hot health issue of Ebola. We conduct content and sentiment analysis by: (1) applying vocabulary control to collected datasets; (2) employing the n-gram LDA topic modeling technique; (3) adopting entity extraction and entity network; and (4) introducing the concept of topic-based sentiment scores. With the query term ‘Ebola’ or ‘Ebola virus’, we collected 16,189 news articles from 1006 different publications and 7,106,297 tweets with the Twitter stream API. The experiments indicate that topic coverage of Twitter is narrower and more blurry than that of the news media. In terms of sentiment dynamics, the life span and variance of sentiment on Twitter is shorter and smaller than in the news. In addition, we observe that news articles focus more on event-related entities such as person, organization and location, whereas Twitter covers more time-oriented entities. Based on the results, we report on the characteristics of Twitter and news media as two distinct news outlets in terms of content coverage and sentiment dynamics.
1. Introduction
Traditional news media used to be the only outlet by which news was disseminated. However, with the advent and fast growth of microblogging services such as Twitter, there has been a considerable change in the news landscape and the news-consumption behaviours of readers [1]. Stemming from the diversification of news outlets, the conventional perception that media consumption divides largely along generational or ideological lines is no longer valid. At the same time, social media does not replace traditional news outlets [2]. People are open to getting news in any way that is convenient. With the increasingly blurred distinction between traditional news media and microblogging services in terms of news consumption, it is worth investigating how content differs between news providers.
A general assumption is that different news outlets have their own unique characteristics. For example, Bubela and Caufield [3] argue that news articles convey more objective stories even though they tend to underreport risks and overstress benefits. On the other hand, Twitter has become a go-to source for breaking news. Due to the spatial constraint of 140 characters per tweet, Twitter users presumably exaggerate or oversimplify the story or their opinions. From the perspective of personal emotion or sentiment, the microblogging service may be a better channel for conveying more subjective stories than word of mouth (WOM) communication [4].
The present study analyses the content of different media outlets to better understand the focus of each in disseminating news. We examine coverage and trends of major topics and expressed sentiments on Twitter posts and in news articles. The specific research questions explored are:
What characterizes articles published by news press and Twitter posts published by individuals? Is there a difference in topic coverage between the two, and what is the main focus of each medium?
Are there differences in the sentiments of Twitter posts and news articles? Does the degree of sentiments change over time?
To this end, we chose a seasonal, sensitive health-related topic: Ebola. The Ebola virus disease (EVD) has an average fatality rate of around 50%. EVD first occurred in 1976 in Sudan and Democratic Republic of Congo [5]. We collected news articles from Factiva and Twitter posts using the Twitter stream API. We then applied four steps: (1) vocabulary control; (2) topic modeling; (3) entity extraction and entity network; and (4) calculation of topic-based sentiment scores. A series of experiments showed that each news medium is distinctively engaged in the Ebola event, with differences regarding discussions of its cumulative significance and inflections of the sentiment dynamics of those discussions.
The rest of the paper is organized as follows: the related work section discusses some previous research on sentiment mining analysis and topic discovery. In the section on methodology, we describe our data collection, preprocessing and sentiment measurement techniques. The results and discussion section reports and interprets the experiment results. In the conclusion section, we summarize the contributions of our work and present future directions.
2. Related work
One of the aims in our study was to explore unique and common characteristics of Twitter posts and traditional news media. Therefore, we first conducted a literature review of general topic discovery and Twitter-specific research. Then, we looked into related work on sentiment- or opinion-mining analysis of news media and Twitter.
2.1. Topic discovery in news media
One of the primary goals in topic detection is identifying the sub-topics of issues. As the amount of news data is fast-growing, topic detection in textual materials from a variety of broadcast and news press sites has been widely researched. For example, the topical structure of reported news was actively studied through the Text REtrieval Conference (TREC; http://trec.nist.gov/) and the Topic Detection and Tracking (TDT) project [6–10]. For the TDT project, the majority of the studies focused on developing the topic detection system. Jin et al. [7] utilized the probability-based model to detect topics, and Walls et al. [9] proposed a topic-tracking system that adopts unsupervised grouping of news articles in the TDT project.
In general, topic discovery in traditional news media adopts clustering or machine-learning techniques to classify similar news topics and track emerging issues. Yang et al. [10] employed modified kNN clustering for topic detection, whereas Pons-Porrata et al. [11] presented a new clustering algorithm constructing temporal references by building a hierarchy of topics and events. Makkonen et al. [12] proposed a simple semantic approach to topic discovery. They categorized terms as names, locations, temporal expressions or normal terms, and then used these term groups to measure similarity of news article pairs. Carthy [13] built sequences of associated words using WordNet and combined the sequences with keywords in topic tracking. Nallapati et al. [14] constructed a model using the structure and dependencies in a news topic to capture latent topics. In recent work, Dai et al. [15] focused on the applications of previous techniques to various domains. They developed the system to provide the financial field with the emerging issues related to the stock market by tracking the online financial topics using feature terms of news headlines.
Probabilistic topic models introduced by Blei et al. [16] have been widely implemented to discover hidden topics in news by machine-learning approaches. Newman et al. [17] presented the combination model of topic modeling and developed entity-recognition techniques to extract the topic, topic trend and related entities automatically from The New York Times news data. Canini et al. [18] proposed the modified the Latent Dirichlet allocation (LDA) algorithm. They adopted the Rao Blackwellized online inference algorithm to more effectively discover hidden topics in news.
2.2. Topic discovery in Twitter
Since the appearance of Twitter in 2006, topic detection research has entered a new phase. Twitter users generate more than 400 million tweets every day, and the rate of growth is increasing. The language used in Twitter is quite distinct from that of traditional media. The length of a tweet is limited to 140 characters, and various slang terms, emoticons and abbreviations are included. These unique characteristics pose a data-analysis challenge, but one that many scientists have taken on in recent years.
In studies of Twitter, the influential factor in social networks is most actively researched. Statistical approaches for measuring parameters such as number of tweets, number of followers and number of retweets are adopted in most studies [19, 20]. Kwak et al. [1] also used a PageRank algorithm to evaluate social networks on Twitter and identify influential users. Hong et al. [21] analysed tweets to predict the influence of messages. For content and topic analysis of Twitter posts, most studies used LDA and its variations [22, 23]. Hong and Davison [22] proposed Twitter-specific schemes to train a standard topic model and measured the quality and effectiveness of their approach against a real world dataset. Ramage et al. [23] implemented the partial supervised learning model Labeled LDA, which maps content by social characteristics. Zhao et al. [24] developed a Twitter-LDA model and compared Twitter and traditional media empirically. Their findings confirm the observation in previous studies that the number of retweets is an influential factor. Furthermore, they found that entity-oriented topics, e.g. Michael Jackson, have lower topic coverage on Twitter than in traditional news media.
2.3. Sentiment analysis
Traditionally, sentiment or opinion-mining analysis has mainly focused on the classification of sentiment polarity, i.e. positive or negative, typically detected by a machine-learning approach [25–29]. Some studies use an external sentiment resource-based lexicon for measuring a text’s sentiment score. SentiWordNet (http://sentiwordnet.isti.cnr.it), a lexicon that attributes a sentiment score of positive and negative based on synsets of WordNet (http://wordnet.princeton.edu/), is a popular sentiment dictionary that outperforms traditional machine-learning approaches [30–32]. Wilson et al. [29] introduced the Opinion Finder lexicon, which labels English words as positive or negative. Bradley and Lang [33] released another lexicon called Affective Norms of English Words (ANEW). Thelwall et al. [34] proposed the SentiStrength algorithm to extract sentiment strength from informal English text. Taboada et al. [35] developed the Semantic Orientation CALculator (SO-CAL) based on the lexicon-based approach to calculating a sentiment score. In their dictionary, each word has a semantic orientation and strength.
In a sentiment analysis of news media texts, Godbole et al. [36] presented an opinion-tracking system to identify the sentiments of specific entities in news articles. Balahur-Dobrescu et al. [37] also considered various sentiment dictionaries to identify the sentiment of a word co-locating with entities in news articles. As an application study of sentiment analysis, Zhang and Skiena [38] proposed a sentiment-based stock-trading strategy involving the extraction of sentiment words from news media. Ruiz-Martínez et al. [39] focused on opinion extraction using sentiment polarity of news for financial decision support systems. In their study, Ruiz-Martínez et al. [39] created financial-specific sentiment lexicons. In sentiment analysis in social media texts, Go et al. [40] used positive and negative emoticons to opinion mine Twitter data. Barbosa and Feng [41] implemented opinion polarity predictions to train a model measuring noisy labels. They demonstrated the usefulness of syntax features like retweet, hashtags, link and punctuation. Naveed et al. [42] constructed a predictive model that estimates when a message on Twitter is worth retweeting. They conducted dictionary-based sentiment analysis using ANEW and found that bad news tends to spread fast on Twitter. Zhao et al. [24] analysed the opinion of topics on Twitter and in news articles. They built 50 sentiment words manually from Twitter data and measured opinion proportions in topic such as business and education.
Unlike the study of Zhao et al. [24], we focus on specific issues that the public is currently interested in. We aim to discover related topics of a particular event and analyse the sentiments regarding that topic over time. In our study, we detect subjective words at a sentence-level and modify the SO-CAL formula to estimate sentiment scores.
3. Methodology
3.1. Data collection
Using ‘Ebola virus’ and ‘Ebola’ as query terms, we collected news articles and tweets published between 1 June and 31 August 2014. For news collection, we used the Factiva Press Release Service (Online) database is a news source that provides worldwide articles from more than 2500 different kinds of news outlets. The distribution of the collected data over 3 months is shown in Figure 1. Ebola-related news articles and tweets were steadily published until the middle of July and sharply increase at the end of July when the news about infected Americans returning to the U.S. was first reported.
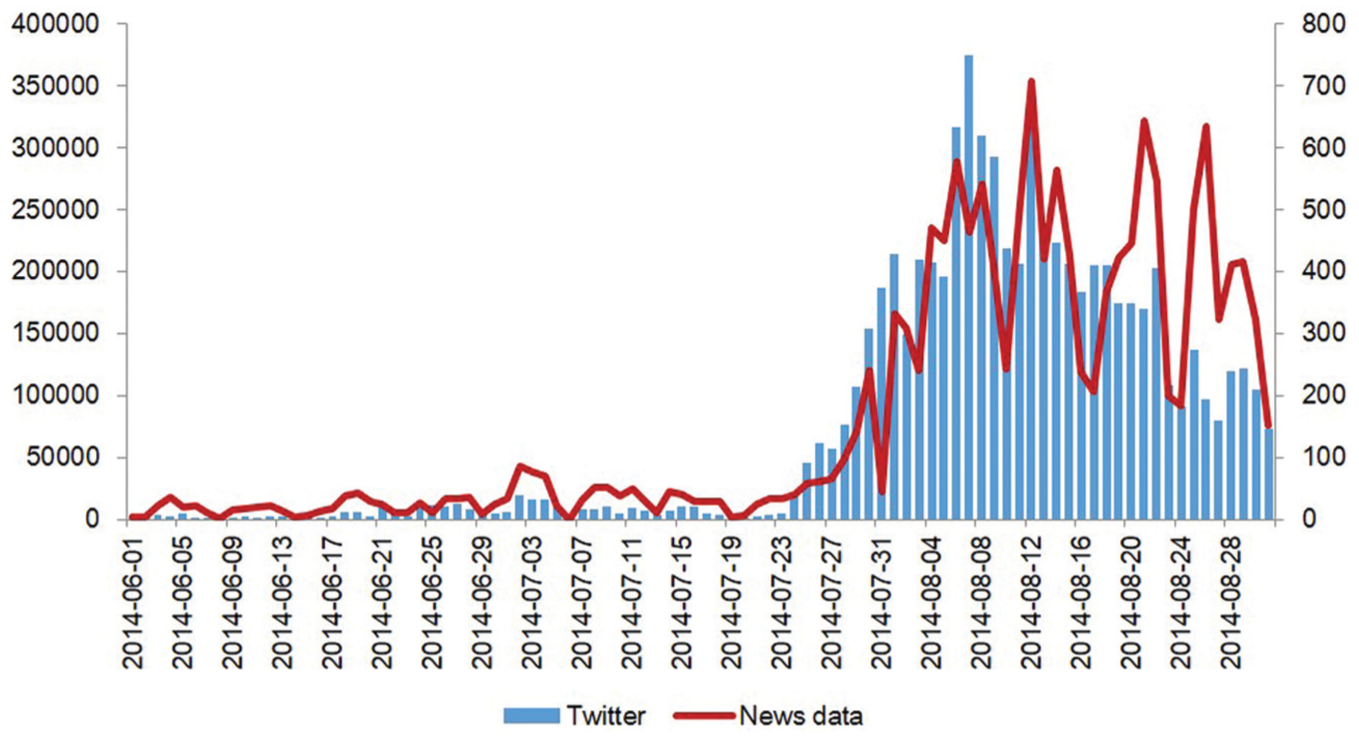
Distribution of Ebola-related news articles and tweets published between 1 June and 31 August 2014.
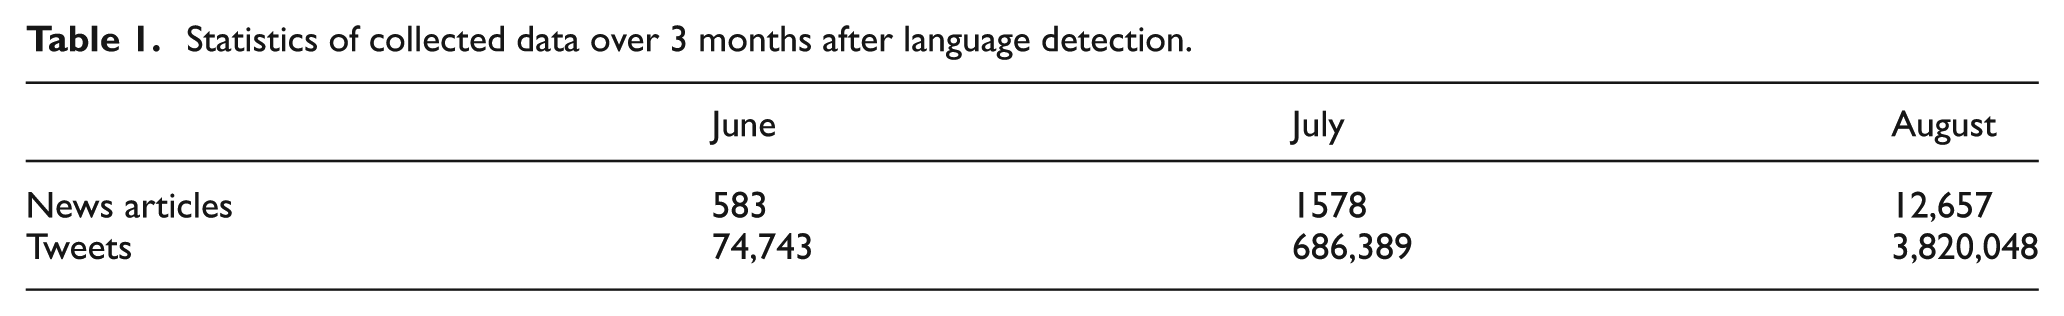
We collected 16,189 news articles from 1006 publications and 7,106,297 tweets. We filtered out only those written in English, leaving us with 14,818 news articles and 4,581,181 tweets. Tables 1 and 2 show the basic statistics of the collected data. We divided a month into 4 weeks (the last weeks of July and August are 8 days). We applied stopword removal, lemmatization and tokenization in preprocessing. Before lemmatization and tokenization, we split a text into sentences and assigned part-of-speech (POS) tags using Stanford NLP (http://nlp.stanford.edu/).
Statistics of collected data over 3 months after language detection.
Statistics of tokens on weekly basis used in experiments.
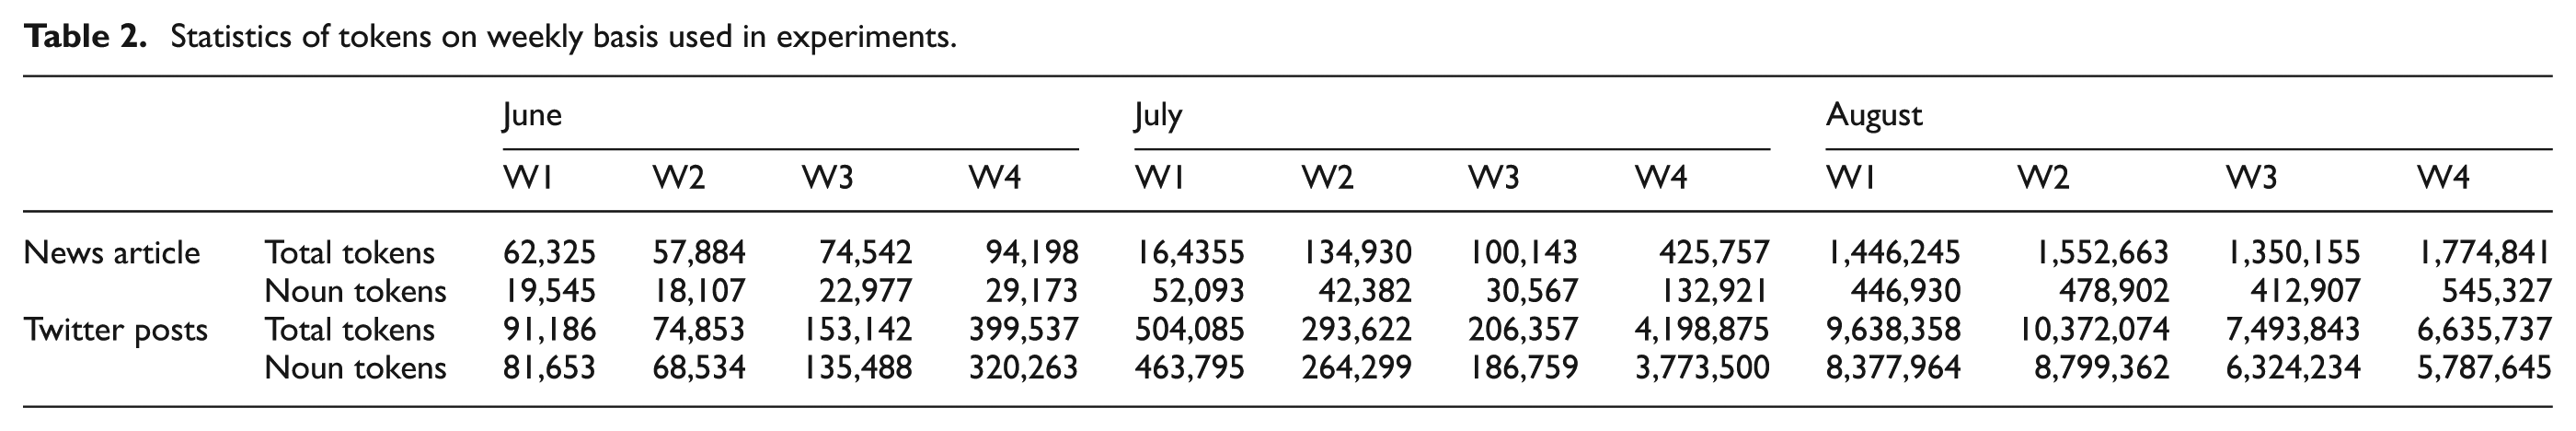
The weekly distribution of the total number of parsed tokens and extracted nouns is described in Table 2. There was considerable discrepancy in the number of tokens per week. One major difference between Twitter posts and news articles is that the sharp increase in the number of tokens as well as noun tokens stopped and went down after second week of August on Twitter, whereas a steadfast increase continued in news articles. This may imply that the life span of a news event on Twitter is shorter than in news media.
3.2. Proposed approach
Figure 2 illustrates the overview of our approach to analyse topics and sentiments. Our experiment was carried out in four major steps: vocabulary control, topic modeling, entity extraction and network, and calculation of topic-based sentiment scores. Each of these steps is described in the subsequent section more in depth.
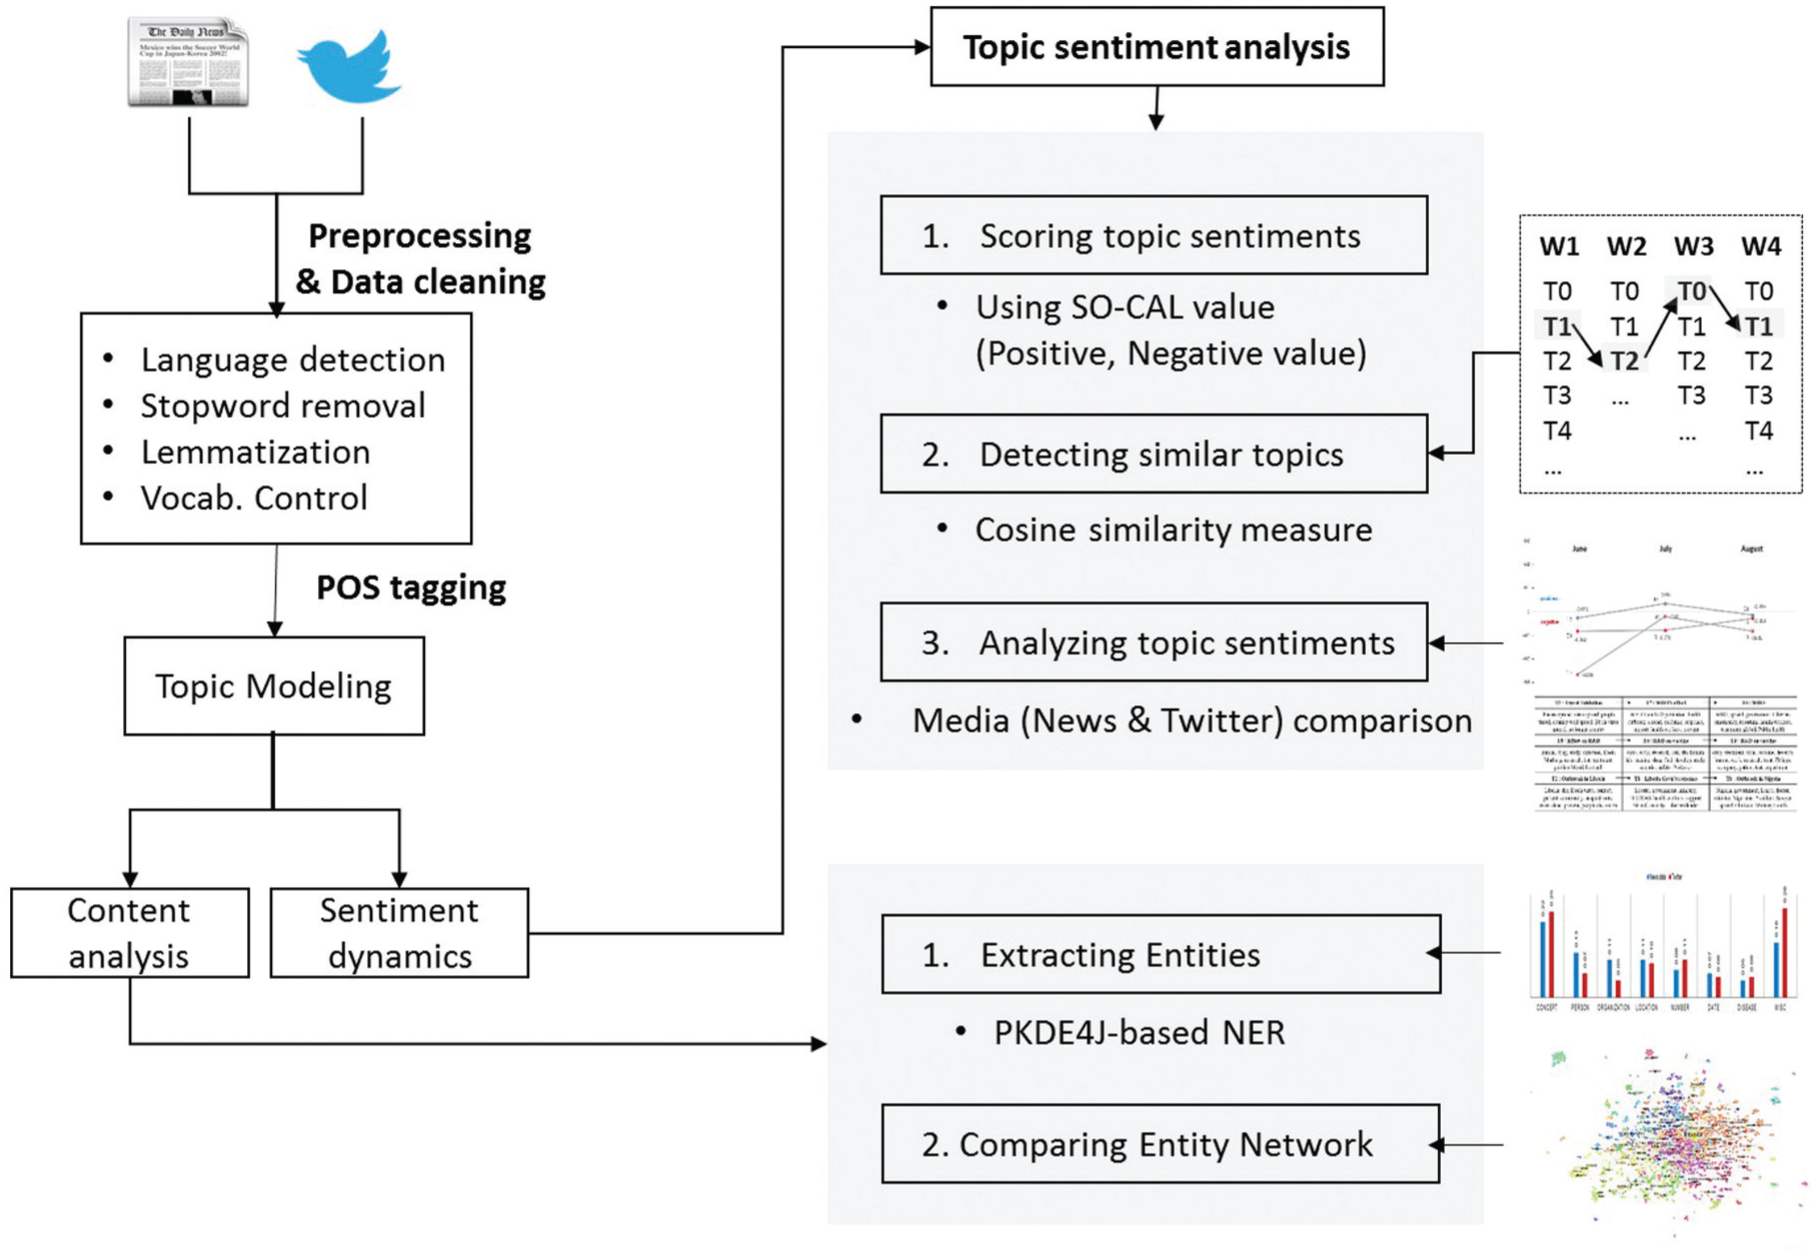
The overview of topic and sentiment analysis.
First, we collected the news article and tweets with the keywords, ‘Ebola’ and ‘Ebola virus’, which resulted in 16,189 news articles and 7,106,297 tweets. Since the retrieved results contain non-English tweets, we removed them by the language detection technique. After that, we preprocessed the dataset with stopword removal and lemmatization techniques. In addition, since tweets are likely to contain jargons and acronyms, we applied the vocabulary control technique to minimize term variation problems. We conducted content analysis with the topic modeling technique for identifying the specific topics, and we also employed sentiment analysis for tracking sentiment changes of each topics. In content analysis, we used noun phrases extracted based on POS tagging to identify the specific sub-topics related with Ebola. We also constructed the key concept networks consisting of extracted entities such as person, organization, location, date and disease names. In sentiment analysis, we scrutinized the sentiment changes of each topic as to the main theme of ‘Ebola virus’. These analyses allowed us to grasp the different aspects of news media and Twitter.
3.3. Vocabulary control
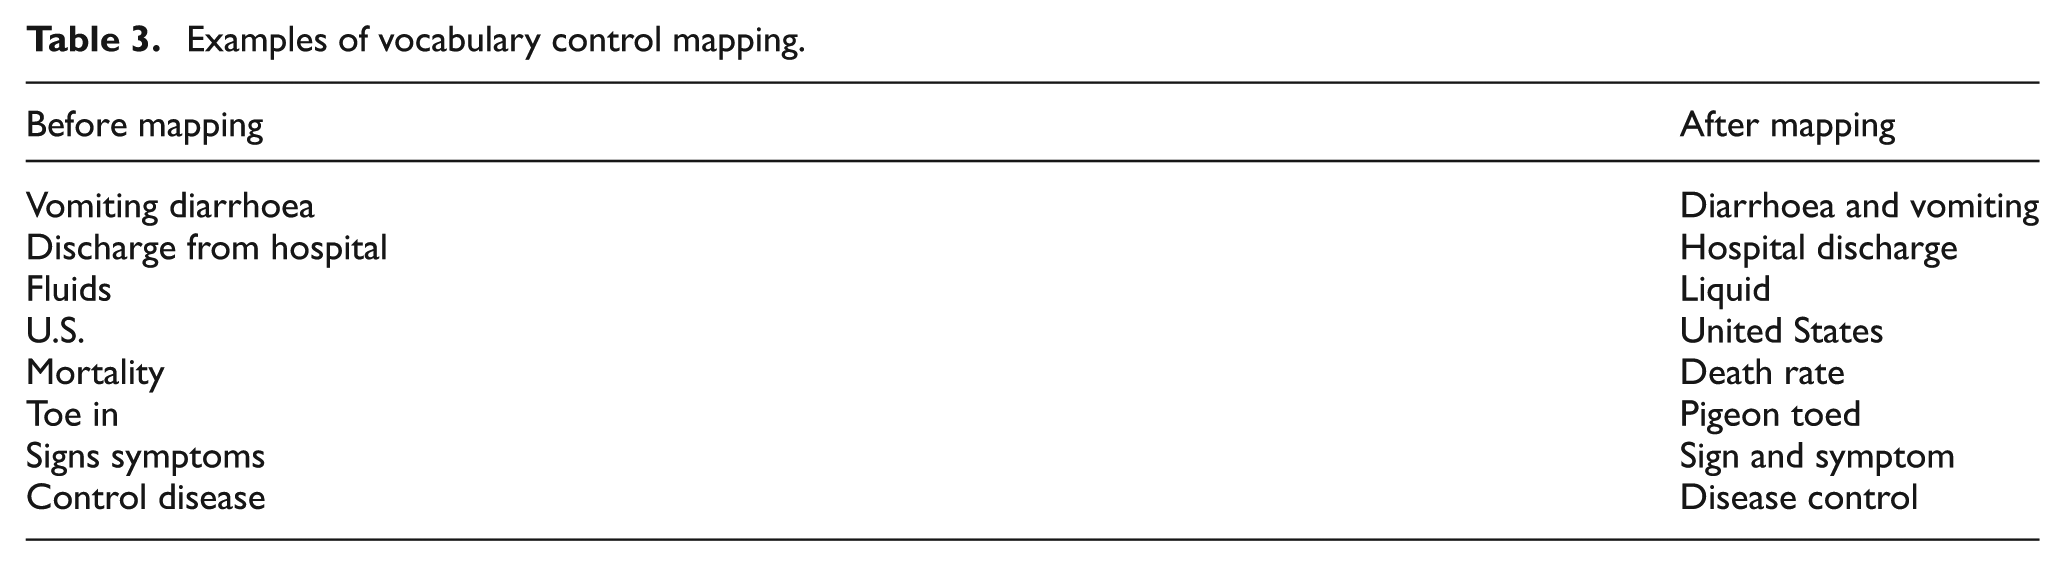
Natural language text is, by nature, an uncontrolled vocabulary, resulting in term variation problems. For example, the term ‘joint disease’ can be expressed as ‘arthropathic’, ‘arthropathies’, ‘arthropathy’, ‘arthropathy nos’, ‘arthrosis’, ‘arthrosys’ or ‘articular disease’. To tackle this, we adopted the idea of vocabulary control in information retrieval (IR). Vocabulary control is one of methods to increase recall in IR system by matching differently expressed terms for the same concept. Since our research purpose is to compare the contents of two distinct media, we considered vocabulary control to link term variants referring to the same concept within bounds that do not hurt uniqueness of two media for further examination. Another approach to tackle this problem is to use the stopword list before feeding the input texts into Topic Modeling techniques. In our study, we chose the control vocabulary approach in that compiling the optimal stopword list requires numerous iterative adjustments. To control the vocabulary in the text we analysed, we employed the Consumer Health Vocabulary (CHV), which is designed to map consumers’ expressions to domain experts’ jargon [43]. In the process of CHV-based translation, we detected sentence blocks from the text and matched words or word phrases with the CHV dictionary term to be converted. Sentences containing the controlled terms became the input text for our analysis. Table 3 shows an example of term mapping by CHV.
Examples of vocabulary control mapping.
3.4. Topic modeling and topic similarity
We adopted n-gram Latent Dirichlet allocation (LDA) [16] to identify topic trends about Ebola in news articles and tweets published between June and August 2014. LDA topic models uncover latent topics using multinomial probability distributions of terms in unstructured documents. In the present paper, we modeled topics into three parts.
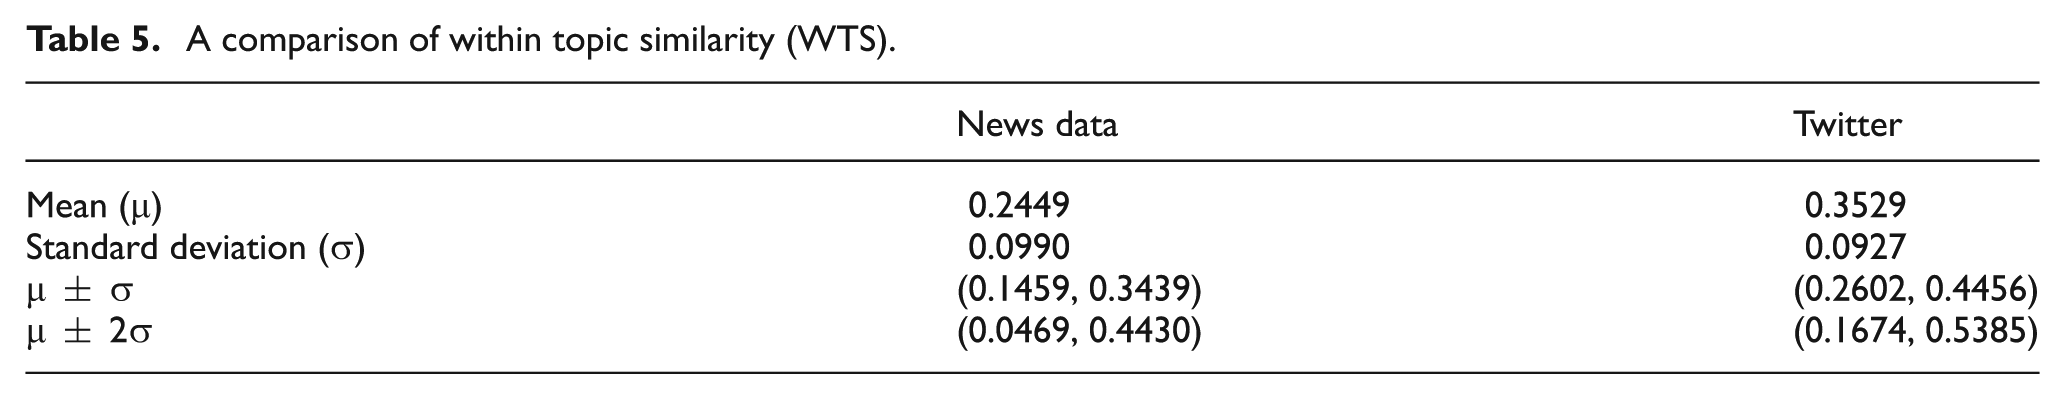
First, we discovered topics distributed in tweets and news articles over the entire 3-month period and compare the topics between the two media. For analysis of differences in topic coverage, we measured the within-topic similarity (WTS) proposed by Song et al. [44] for each dataset.
The WTS formula is as follows:

where
Second, we discovered topics on a monthly basis and connect topics from June to July to August to trace continuity of a topic over time. In this step, we used the between-topic similarity (BTS) proposed by Song et al. [44] to measure the discovered topic similarity between any given two topics.
The BTS formula is described as below:

where
Third, due to the tremendous expansion of data in August, we discovered topics on a weekly basis for this month, allowing us to zoom in topic trends and changes over those 4 weeks. We used the same similarity measure (BTS) to detect topic continuity during this period.
3.5. Entity extraction and network
We considered the set of Ebola-related entities and their relations to understand what major themes are co-mentioned in the context of the Ebola event. For entity extraction, we adopted a dictionary-based entity extraction tool, PKDE4J [45]. PKDE4J is a flexible entity extraction system that extracts entities and their relations from unstructured text. PKDE4J extends Stanford CoreNLP written in Java [46]. PKDE4J provides a pipeline-based architecture that allows for various combinations of text-processing components to be plugged in for different tasks. Moreover, entities can be extracted either by dictionary only or by a combination of supervised-learning and dictionary. For the experiments, we adopted the hybrid version of PKDE4J. To extract general entity types such as person, organization, date, location, number and concept, we used the supervised learning-based entity-extraction approach, whereas for domain-specific entity types such as gene and disease, we used the dictionary-based entity extraction approach provided by PKDE4J. We then built two entity networks with extracted entities and their relations from Twitter posts and news articles. For network visualization, we used the Gephi visualization tool (http://www.gephi.org).
3.6. Calculation of topic-based sentiment score
To examine sentiments in tweets and news articles, we first split a sentence into tokens along with Part-Of-Speech (POS) tags. We then refined the sentence containing nouns, verbs, adjectives and adverbs ready for analysis of the sentiment orientation. We calculated sentiment scores with the SO-CAL developed by Taboada et al. [35]. Semantic orientation (SO) is a lexical-based and human-annotated sentiment dictionary. It consists of 2067 positive terms and 3610 negative terms. Unlike other sentiment dictionaries, terms are not concentrated on adjectives, but include other parts of speech such as noun, verb and adverb. As suggested in the study by Taboada et al. [35], we adopted the SO value for each topic word. We used the probability value of a word in a topic generated over the topic-word distributions as the term weight of the word. For this model, topic sentiment score is calculated as

A topic sentiment score is computed by multiplying the SO value by the probability of words and summing the products in a given topic. The same topical words could be allocated in multiple topics with different probability values. Due to these characteristics, the sentiment score of a topic would be distinguished from others even if the same set of words for the topic appear in different topics.
For example, sentence (a) refers to an original sentence and sentence (b) refers to the refined sentence as the preprocessed input text in this experiment: stopword removal, lemmatization and vocabulary control. We then applied the formula to topic modeling results (c) to calculate sentiment orientations.
Original sentence: Does influenza virus pose a threat to human health?
Refined sentence: virus disease threat human health
Results of topic models: virus (Topic 0), disease (Topic 0, Topic 1), threat (Topic 0), human (Topic 1), health (Topic 1)
In sentence (b), each of the five words has its own probability value in a given topic. To calculate the sentence’s sentiment orientation, we multiplied the probability value of each word by the SO value for that word and summed the products. Table 4 shows the calculated sentiment scores of the topic modeling results. If ‘Disease’ was included in both Topic 0 and Topic 1, the overall sentiment scores of each topic are −0.2196 and 0.0262, respectively.
Example of calculation of topic-sentiment score.

4. Result
4.1. Overall topic distribution
In general, the number of topics, k, is predefined in probabilistic topic modeling algorithms. We set k to 10 for LDA topic modeling through the iterative process.
We selected eight highly related topics among 10 topics as a result of topic modeling. Figure 3 presents how topics are interrelated, along with the top five words in discovered topics in news data and Twitter posts. The size of the word reflects its distribution over the topic. Interrelatedness was determined by WTS. Connections between topics were made based on the average (μ) and the standard deviation (σ) of topic similarity (see Table 5). Topics were linked to each other if the topic similarity exceeds the average (μ). For news articles, a thick edge denotes a topic similarity exceeding 0.3439, average + standard deviation (μ+σ). If the topic similarity was below 0.1459, average–standard deviation (μ–σ), an edge was not created. If topic similarity was within the range of average ± standard deviation (μ±σ), a normal line was used as an edge. In the same manner, we created edges for Twitter. If topic similarity was above 0.4456 (μ+σ), thick edges were used, and edges were not created if topic similarity is below 0.2602 (μ–σ).
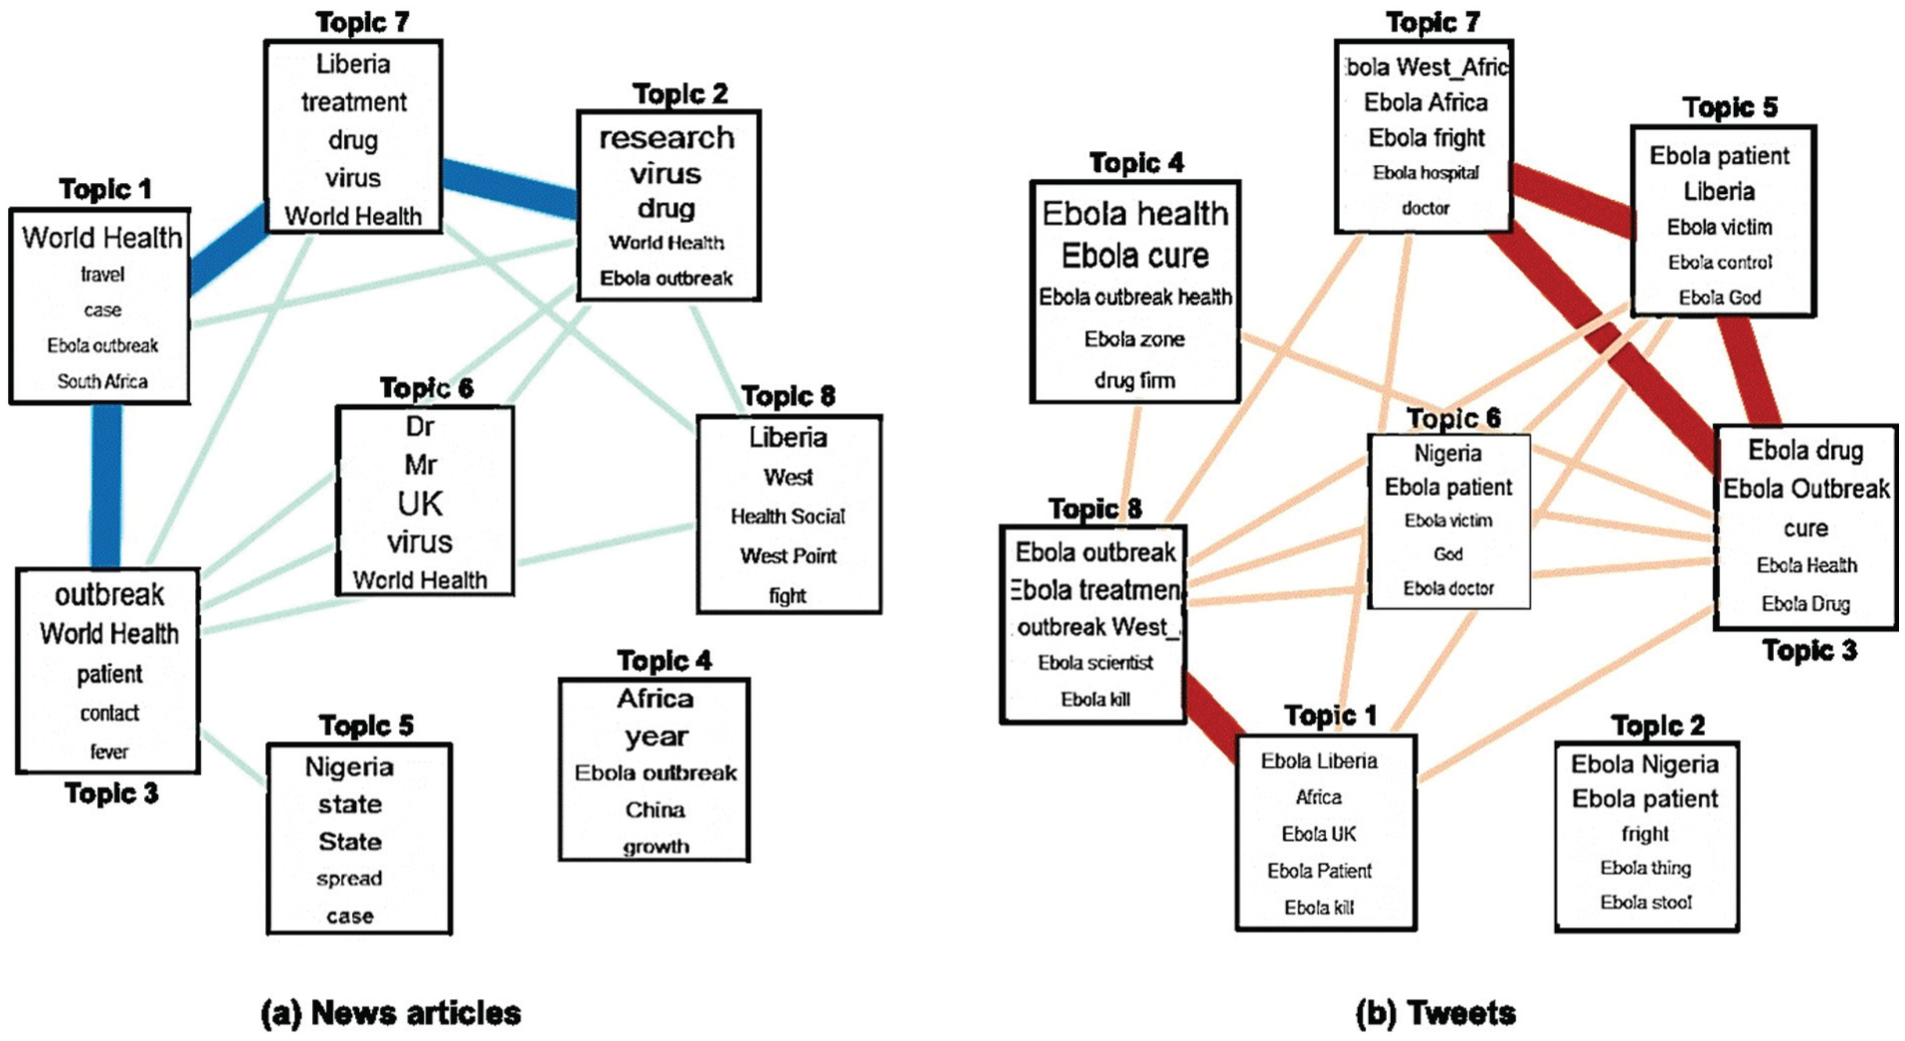
Topic modeling result in Ebola topic-related news articles and tweets.
A comparison of within topic similarity (WTS).
As shown in Figure 3(a), topics 1 and 3, 1 and 7, and 2 and 7 are linked to each other with a thick edge. These topics include the terms Ebola outbreak, travel prohibition, treatment, experimental drugs and infection route. Topic 4, which includes the terms China and growth, has no link with other topics. For Twitter posts, two major topics are shown in Figure 3(b). Topics 1 and 8 are linked to each other with a thick edge, as are topics 3, 5 and 7. The major theme of topics 1 and 8 includes the terms patient, spread, test, treatment and scientist. Topics 3, 5 and 7 share common terms such as cure, victim, control and clinic. On Twitter, negative words like ‘fright’, ‘panic’ and ‘scare’ are observed as top words in most discovered topics on Twitter. As mentioned above, we used a controlled vocabulary. Thus, the term ‘fears’ was converted to ‘fright’ in the CHV translation process. We found many words appear repeatedly across topics, making it difficult to distinguish the specific subjects. ‘Ebola Panic LOL’ is the most frequent phrase among the top 15 words (see Appendix 2). Overall, Figure 3 shows that Twitter has more edges than news articles. It implies that, at least in the case of the Ebola issue, the topic coverage of Twitter is somewhat narrower than news media.
To compare coverage breadth between Twitter and news media, we measured WTS for each dataset. As shown in Table 5, the mean (μ) of news articles is lower than that of Twitter, while the standard deviation (σ) is higher. Both are significantly different (p <0.001). The lower similarity and higher standard deviation signify that there are more distinct topics covered in news articles. Indeed, the top 10 topics in Ebola-related news articles contain more diverse subjects, while Twitter posts appear to cover more restrictive subjects about Ebola, such as drugs and the death toll (see Appendix 1, 2).
4.2. Entity distribution and network
The total number of extracted entities from news articles and Twitter is 532,020 and 5,369,249, respectively. As shown in Figure 4, three entity types – person, organization and location – are frequently mentioned in news articles. On the contrary, miscellaneous entity type and time-related entities such as date and number are highly referred to on Twitter. This distribution of entity types in the two datasets provides us with a lens to understand what themes are more intensely covered in each media.

Distributions of entity types in news articles and tweets.
In addition to these frequently mentioned entities, the following entity types are mentioned infrequently in both news articles and tweets: duration, ordinal, set, time, drug, money, gene and percent. Figure 4 indicates that news articles focus more on the event-related entities, whereas Twitter covers time-oriented entities more widely. In addition, entity types tagged as miscellaneous are more frequently mentioned on Twitter.
To analyse entities by network topology, we generated an entity network from each dataset. The network for news articles includes 31,654 nodes and 165,075 edges, and the network from Twitter posts has 82,920 nodes and 292,752 edges. To make the visualization readable, we reduced each network by removing edges that have a weight of 10 or less. Table 6 shows the statistics of each entity network.
Entity networks properties of news article and Twitter.
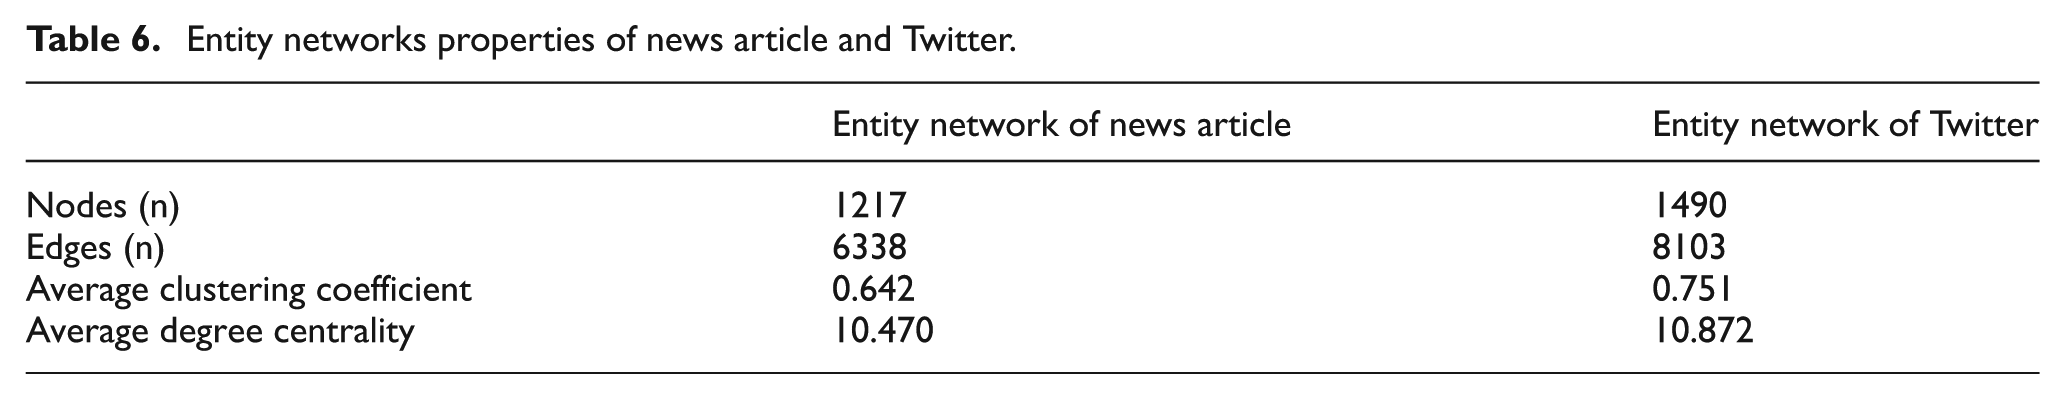
To understand the agglomerate tendency between vertices, we measured two network properties: clustering coefficient and degree centrality. Clustering coefficient describes how nodes are clustered together, and degree centrality is defined as the number of links. The entity network of Twitter has larger topological parameters than the network of news articles (Clustering Coefficient: 0.751; Degree centrality: 10.872). The high clustering coefficient and degree centrality of the Twitter network indicate that the nodes were densely connected with one another. Especially for the ‘Ebola’ node, degree centrality is 986 out of 1490 (66.17%) in the Twitter network, and 569 out of 1217 (46.75%) in the news article network. This indicates that the nodes in the Twitter network are lumped together and directly connected to ‘Ebola’ node, and do not form a separate group. Overall, these observations support the notion that the entities extracted from Twitter posts focus on specific topics and have narrower coverage than those of the news media do.
Figures 5 and 6 are visualizations of the reduced entity networks created with news articles and Twitter posts. In Figure 5, African countries hit by the Ebola outbreak appear on the right side of the network, whereas the left side of network includes victims of EVD. At the bottom of the network, Western countries such as the United States, Canada and the U.K. are co-located with entities like research, FDA, science and hospital.
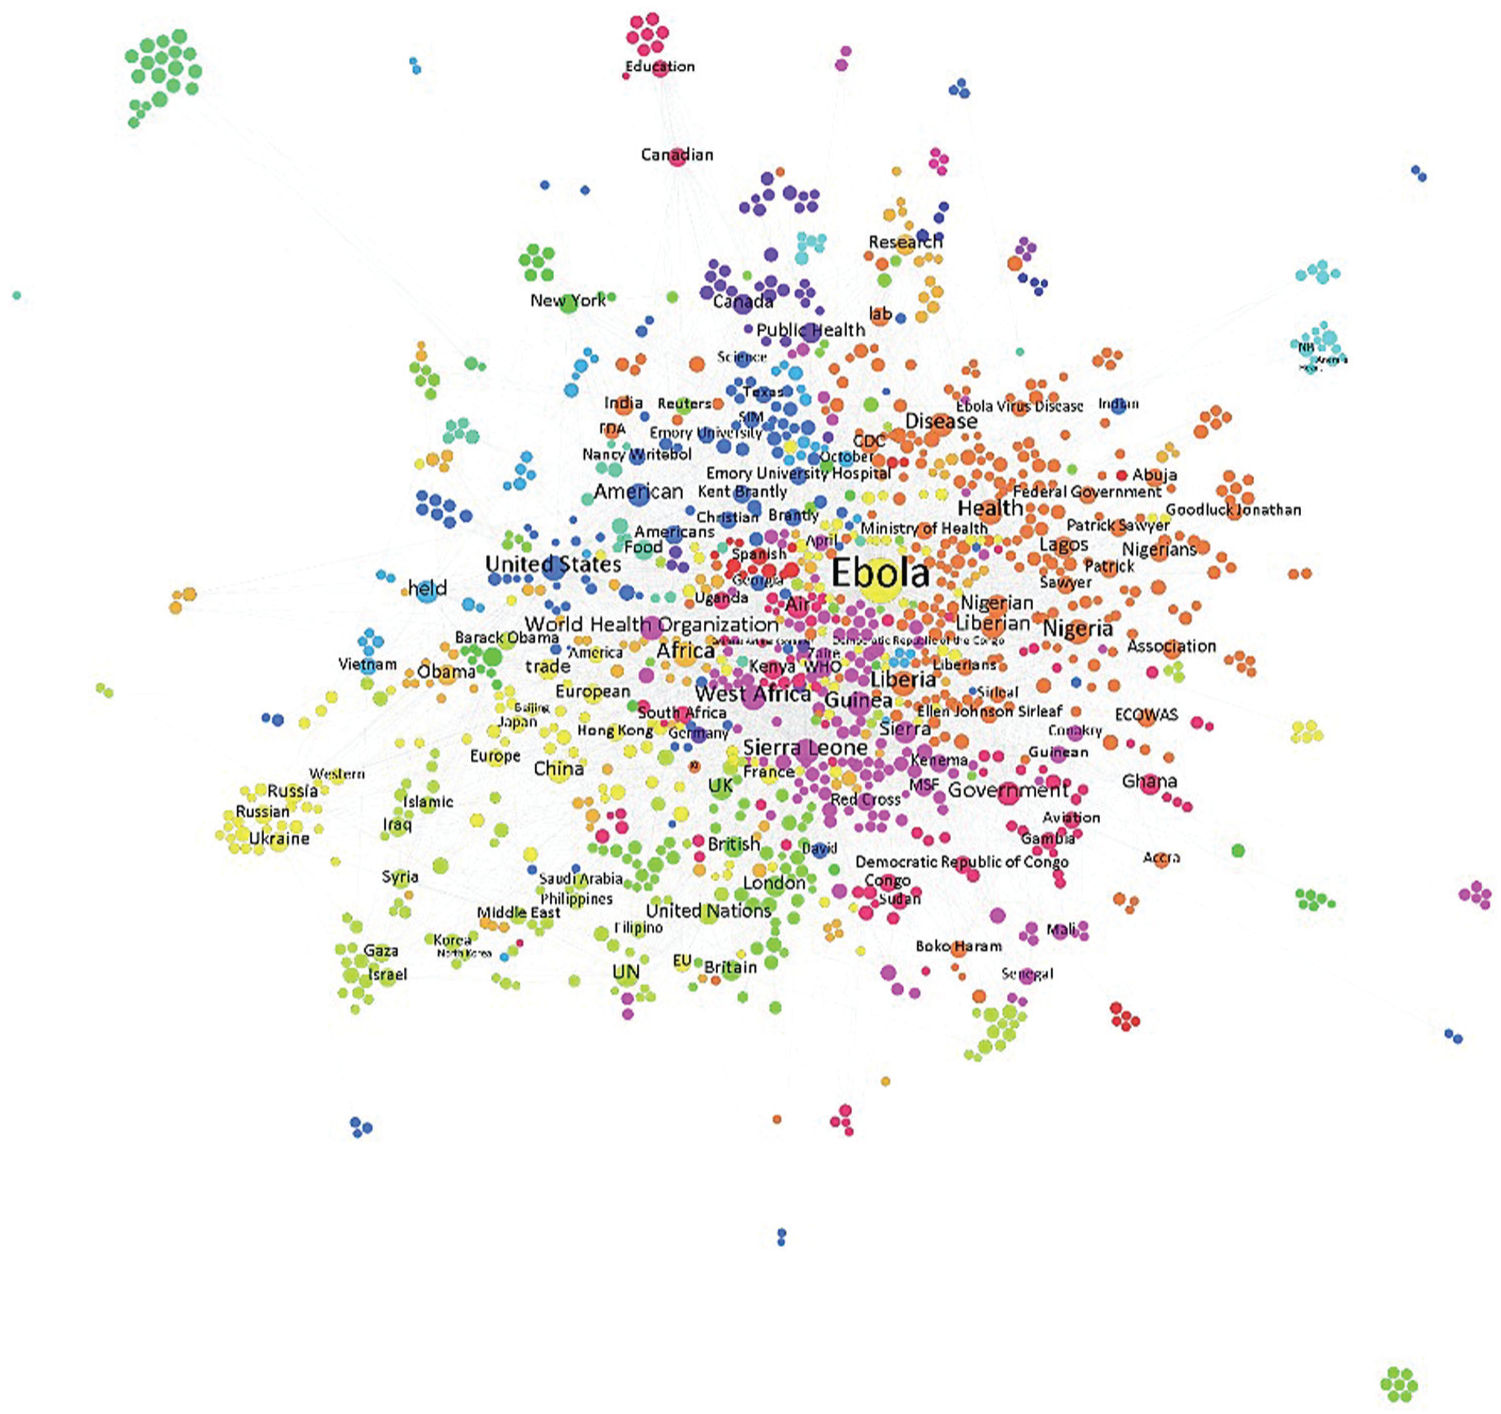
Entity network in Ebola-related news articles.
Entity network in Ebola-related tweets.
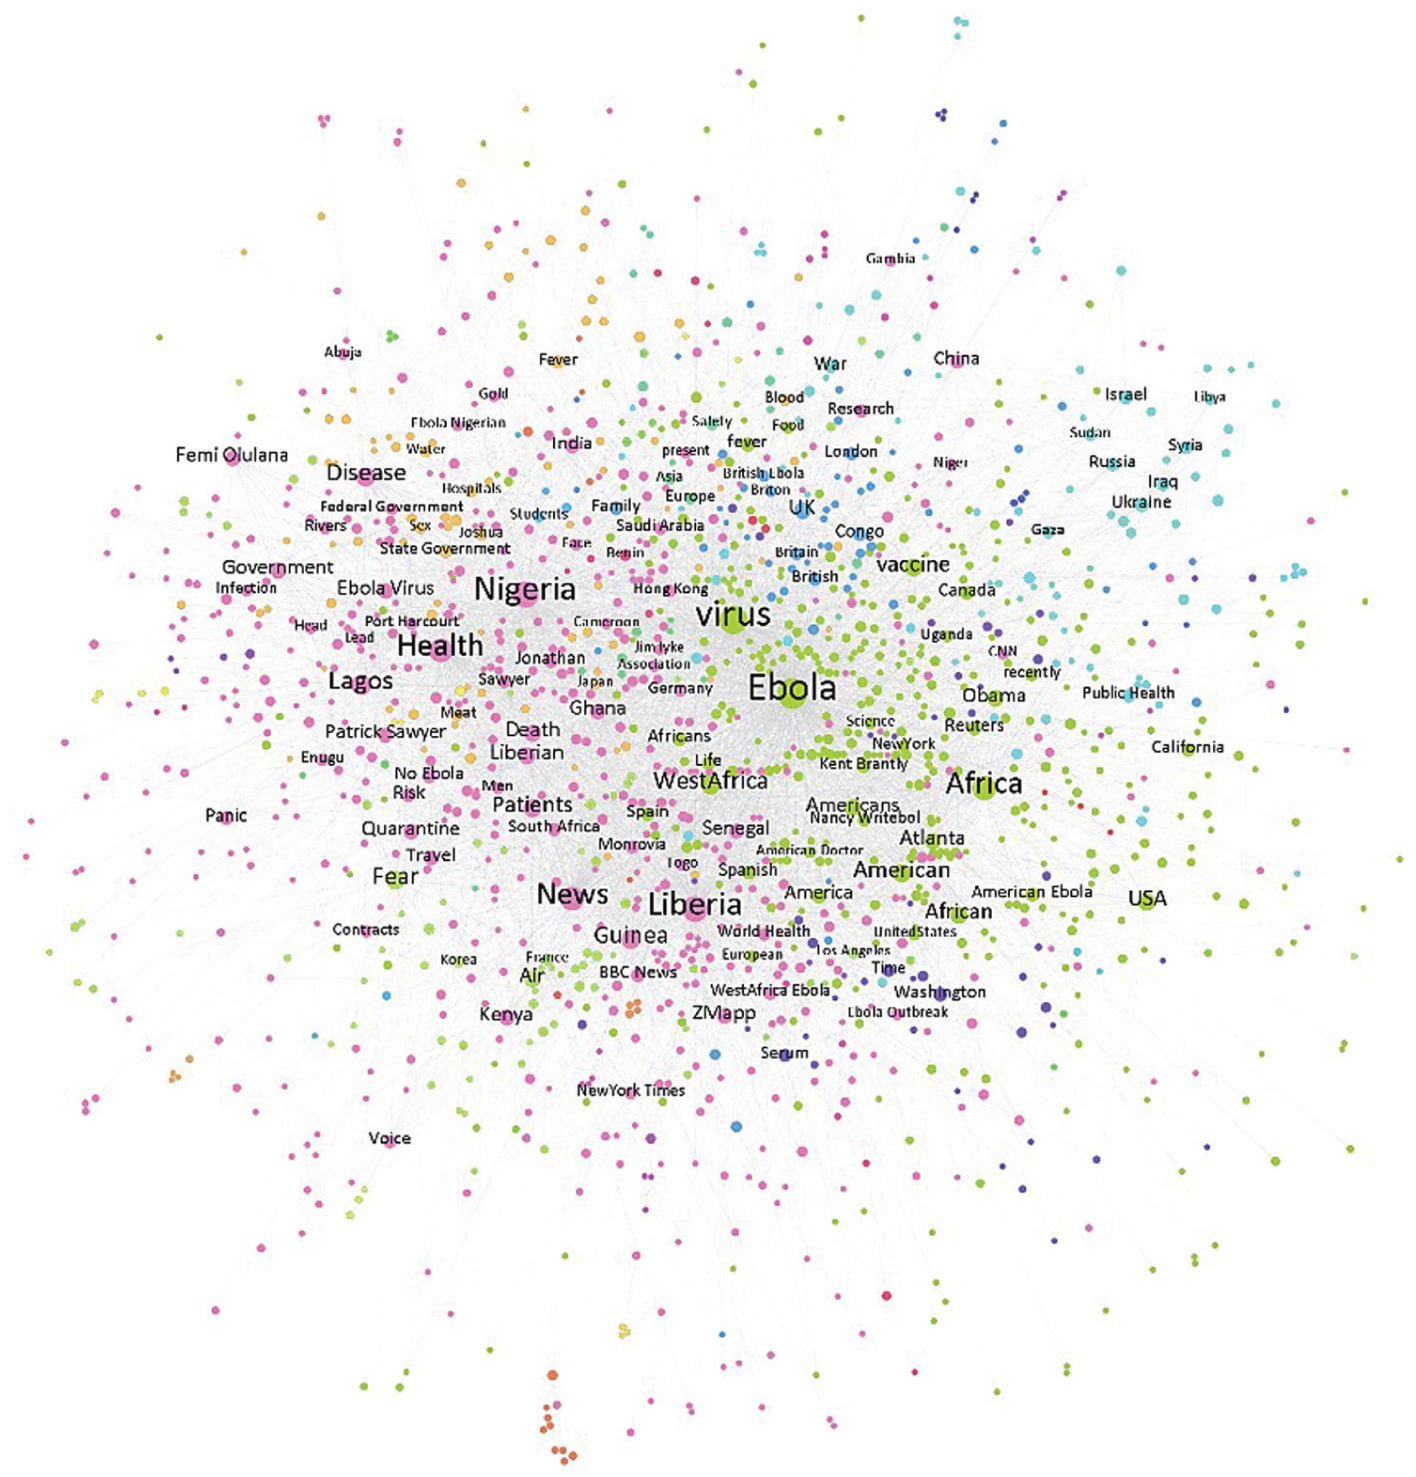
In Figure 6, the entity network of Twitter posts focuses densely on the term Ebola. African countries and regions directly influenced by Ebola outbreak are located on the left side of the network. One unique characteristic of the Twitter entity network is that emotional terms such as death and panic are included in top terms.
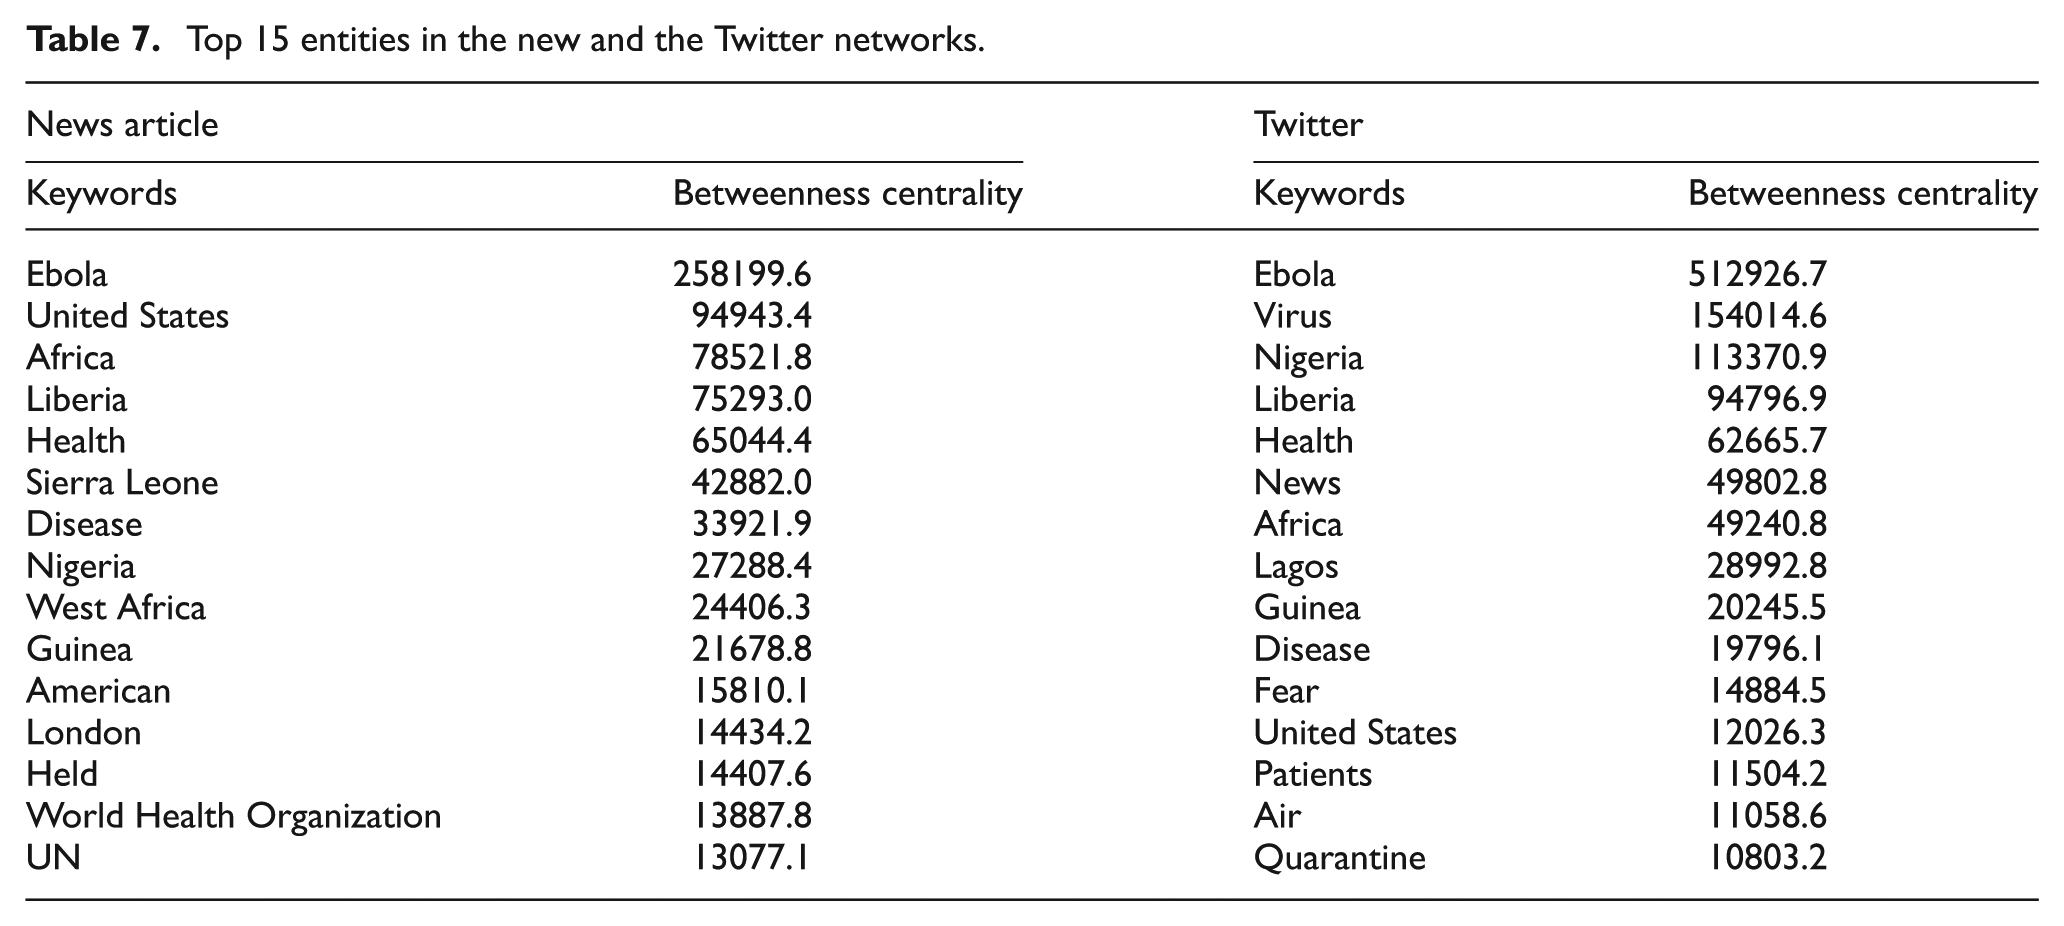
Table 7 shows the top 15 entities from both networks by betweenness centrality. The higher the betweenness centrality value of an entity, the more strongly linked it is with other entities. The top-ranked entities appearing both in news articles and on Twitter are country names and the term Ebola. The interesting observation, however, is that for the news entity network, Table 7 coincides with the characteristic of news articles, namely, emphasizing event-oriented entities. On the contrary, in the Twitter network, emotional terms such as death and panic appear in top 15 entities.
Top 15 entities in the new and the Twitter networks.
4.3. Topic and sentiment changes
Applying LDA to monthly data results in an optimal number of topics of 9 and 5 for news articles and Twitter, respectively. We used BTS to calculate the topic continuity from June to August. We set the threshold of 0.3 both for news articles and for Twitter. For the continued topics, we calculated the topic sentiment values. Figure 7 shows the topic changes about Ebola virus in news articles. Three of nine topics generated by n-gram LDA topic modeling were published in all 3 months. The average sentiment score for news articles is −0.0389, whereas the average sentiment score of Twitter is −0.0371, but the difference is not significant. This is a surprising result; we had assumed that Twitter posts convey more emotional expression than news articles do.

Sentiment dynamics analysis in topic change (Ebola-related articles).
Path 1 (T3 (–0.265) → T7 (–0.02) → T0 (–0.028)) starts with a very negative sentiment, changing to close to neutral but still negative, and then to slightly more negative. This path is related to a general topic about the World Health Organization’s (WHO) response to the Ebola outbreak. Travel prohibition recommended by the WHO is reflected in the extremely negative sentiment in June, which is the early stage of the Ebola event. As the WHO’s effort to quell the Ebola epidemic continued, the negative sentiment weakened. Path 2 (T0 (–0.082) → T0 (–0.078) → T4 (–0.028)) shows a steady, mild negative sentiment on the topic. The path is related to the topic of R&D efforts to develop an Ebola vaccine. The ongoing efforts in vaccine development have a positive influence on the initially negative concern. Path 3 (T2 (–0.026) → T8 (0.034) → T8 (–0.014)) shows the most positive sentiment among sentiment dynamics of topics over the 3 months. The major theme of path 3 is the Liberia’s response to stop the Ebola outbreak. Liberia’s effort to prohibit the spread of Ebola outside the country gains a positive opinion. Although in Nigeria, a neighbouring country of Liberia, additional Ebola patients were found and a nurse was infected, Liberia’s continuous effort and a vaccine test in Nigeria help maintain the initial sentiment level.
On Twitter, overall distribution of topics shows that topics are lumped together (Figure 8). The main topic in June is Ebola outbreak. July’s main topic is the dispatch of medical staff, and August’s main topic is efforts of that medical staff. Path 1 (T2 (–0.067) → T1 (–0.051) → T1 (–0.012)) starts with mild negative sentiment and slowly moves to positive opinion. The main theme of this path is related to the Ebola outbreak death toll and medical staff’s effort. Path 2 (T3 (–0.172) → T1 (–0.051) → T1 (–0.012)) is almost identical to path 1 except for June topic (districts of Ebola outbreak). Path 3 (T1 (–0.082) → T4 (–0.065) → T1 (–0.012)) starts with the most negative sentiment, then moves to more neutral sentiment and then to positive sentiment. The main theme of this path is outbreak control and doctors’ efforts to help Ebola patients. Compared to the sentiment dynamics of news articles, Twitter topics are merged into one major topic and show more positive sentiments toward the Ebola-related issues in August.
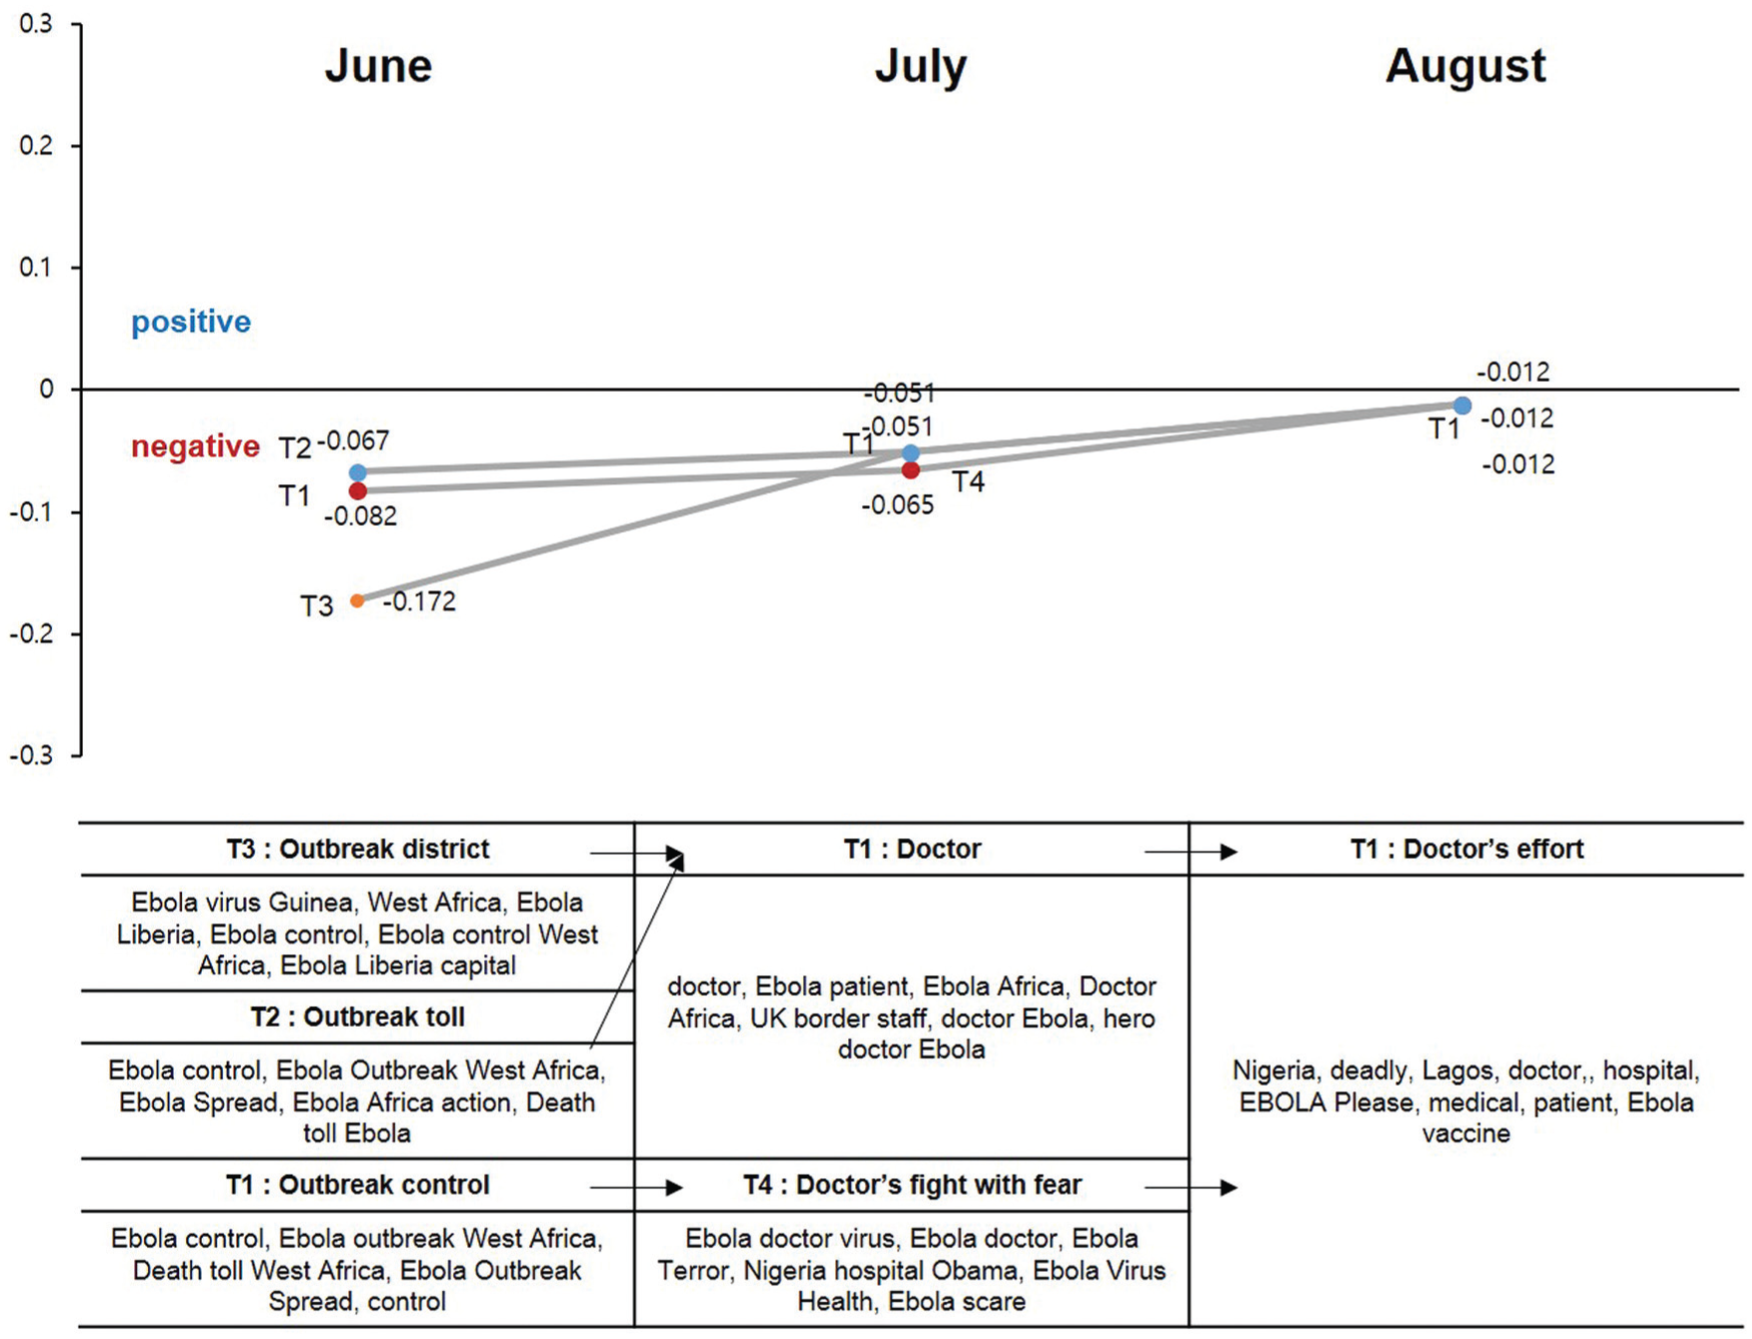
Sentiment dynamics analysis in topic change (Ebola-related tweets).
To further examine the difference between two media, we conducted another experiment by splitting August data into weeks and calculating sentiment scores for topics gained by LDA on weekly data. By applying BTS, we traced the topic similarity among topics between consecutive weeks. We set thresholds of 0.45 and 0.28 for connecting two topics in news articles and Twitter posts, respectively. Table 8 shows similarity among topics between weeks by BTS. Topic similarity scores in news articles are higher than those in Twitter posts. The sentiment score of a topic for each week is included in parentheses next to the label of a topic.
BTS and topic sentiment scores in August news data and Twitter.

5. Discussion
Throughout our experiments, we identified several distinct characteristics of Twitter and news media. The first major difference is that topic distinction is blurred on Twitter, whereas in news topic boundary is relatively clear. Because Twitter is a personal microblogging service, systematic division of covered topics is not enforced. Rather, personal thoughts on a particular issue are freely expressed and shared. On the contrary, news articles tend to convey specific and detailed facts about a given topic.
Second, from the perspective of topic coverage, news articles deal with various topics whereas Twitter’s topic coverage is somewhat limited. News media delivers facts in established areas such as culture, politics and health, and the results of topic modeling confirm this diverse coverage of news media. On the other hand, Twitter does not show a fixed pattern of merging or splitting of topics. In addition, Twitter’s topics are scattered, and only couple major topics show consistent topic similarity and are merged together at the end of August. From the perspective of entity types mentioned in each news medium, event-oriented entities predominate in news media, whereas on Twitter miscellaneous entities and time-related entities are the major concepts. An independent samples t-test confirms that, at p <0.05 level, there are significant differences between two media types by frequency of organization, person and concept, and representative entities for event and concept.
Third, we observe that, on Twitter, issues seem to have a shorter life span than in news media. Figure 9 shows the distribution of entities for each media type from June to August. We observe that both share a similar pattern until the second week of August. After the second week of August, the proportion of entities mentioned on Twitter drastically dropped, whereas news media maintained a consistent pattern. The number of tweets posted during the last 2 weeks of August is 1,339,857. This is about 29.3% of the total number of tweets used for the experiments. In case of news articles, the number of articles published during that period is 5773, which is about 38.8% of the entire news articles used for the experiment. This statistic indicates that the number of tweets posted during the last weeks of August decreased compared with the first 2 weeks of August (51%). The number of concept- and time-related entities also dropped significantly. We argue that this is an evidence of the tendency of Twitter posts on a particular issue to have a shorter life span, although the issue is still ongoing and unresolved. This tendency was not observed in the news media.
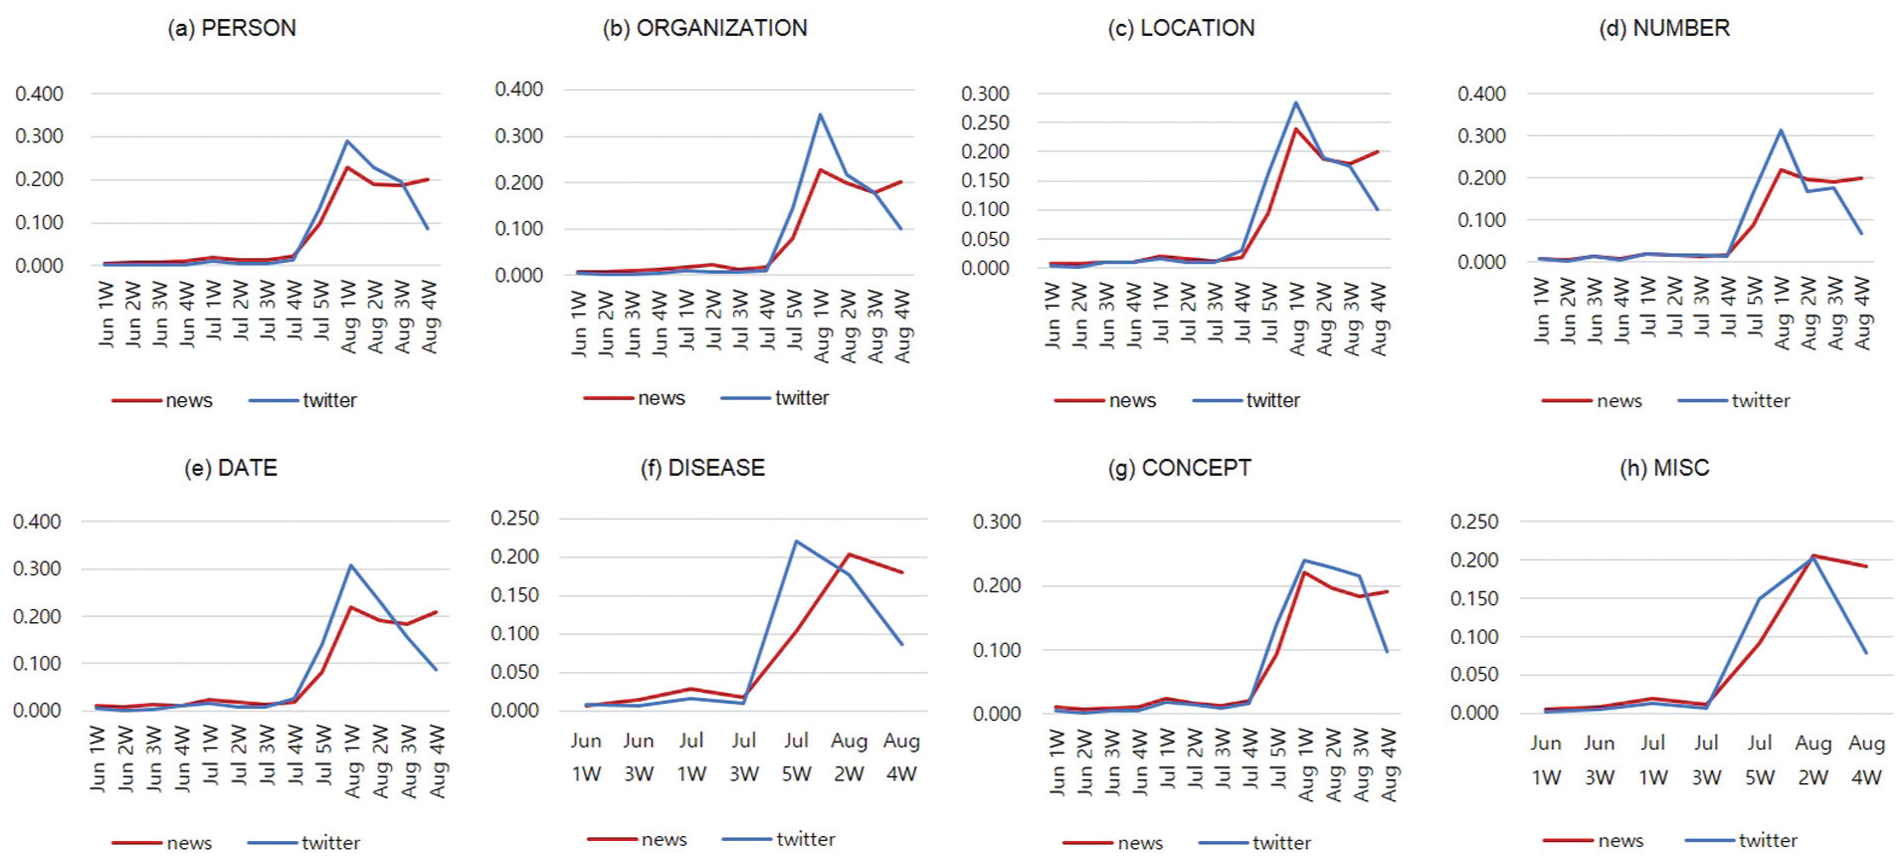
Entity distribution classified by entity types.
Fourth, sentiment dynamics of news articles are wider than those of Twitter posts. It seems that news articles strive to deliver news on a specific issue in a simple and clear manner; for each specific issue, news articles express sentiment straightforwardly. On the contrary, Twitter reflects many different individual opinions.
We further examine sentiment dynamics by the degree of variance. Figure 10 shows overall sentiment changes over 3 months as well as within the month of August. The red-coloured area signifies the degree of sentiment variance on Twitter and the blue-coloured area denotes news articles’ degree of sentiment variance. For the entire period, variance of sentiment on Twitter ranges from 0.107 (June) to 0.02 (August), whereas in news articles the variance of sentiment ranges from 0.43 (June) to 0.105 (August). For the month of August, variance of sentiment on Twitter goes from 0.035 (1st week) to 0.028 (4th week), whereas news articles’ variance of sentiment goes from 0.168 (1st week) to 0.076 (4th week). The common feature in both Figures is that the degree of sentiment variance of Twitter is quite narrower than news media’s. This observation conforms with Thelwall et al.’ findings [47] that the average changes in sentiment strength of Twitter for popular events are quite small. In the same vein, Salathé and Khandelwal [48] report that the number of tweets and sentiment strength on the issue of influenza A (H1N1) vaccine declined over a 5-month period. This surprising result remains to be further investigated to uncover what makes variance of sentiment small.

The degree of sentiment variance.
6. Conclusion
The present study investigates topic coverage and sentiment dynamics of the hot health issue of Ebola virus in two different media, Twitter and news publications. We conducted content and sentiment analysis by: (1) applying vocabulary control to collected datasets; (2) employing the n-gram topic modeling technique; (3) adopting entity extraction and network; and (4) introducing the concepts of topic-based sentiment scores to facilitate our analysis of the topical and sentimental differences between Twitter and traditional news media.
The results reported in this paper indicate that Twitter and news media function as two distinct news outlets. This investigation sheds light on the content of each news medium during a time when news consumption behaviours are undergoing major changes, increasingly relying on the participation of audiences. In addition, we analysed the topical distribution and the sentiment dynamics of news articles and Twitter posts.
Although this study was designed to determine whether differences exist in the content and sentiment of two different media, a major limitation was that we collected the datasets for a relatively short period of time – only the first 3 months of Ebola outbreak. Thus, as a follow-up study, we plan to trace sentiment dynamics over a longer period. In addition, we plan to investigate how news retweets are propagated in Twitter and how they influence on sentiment dynamics.
Footnotes
Appendices
Result of topic modeling in Twitter.
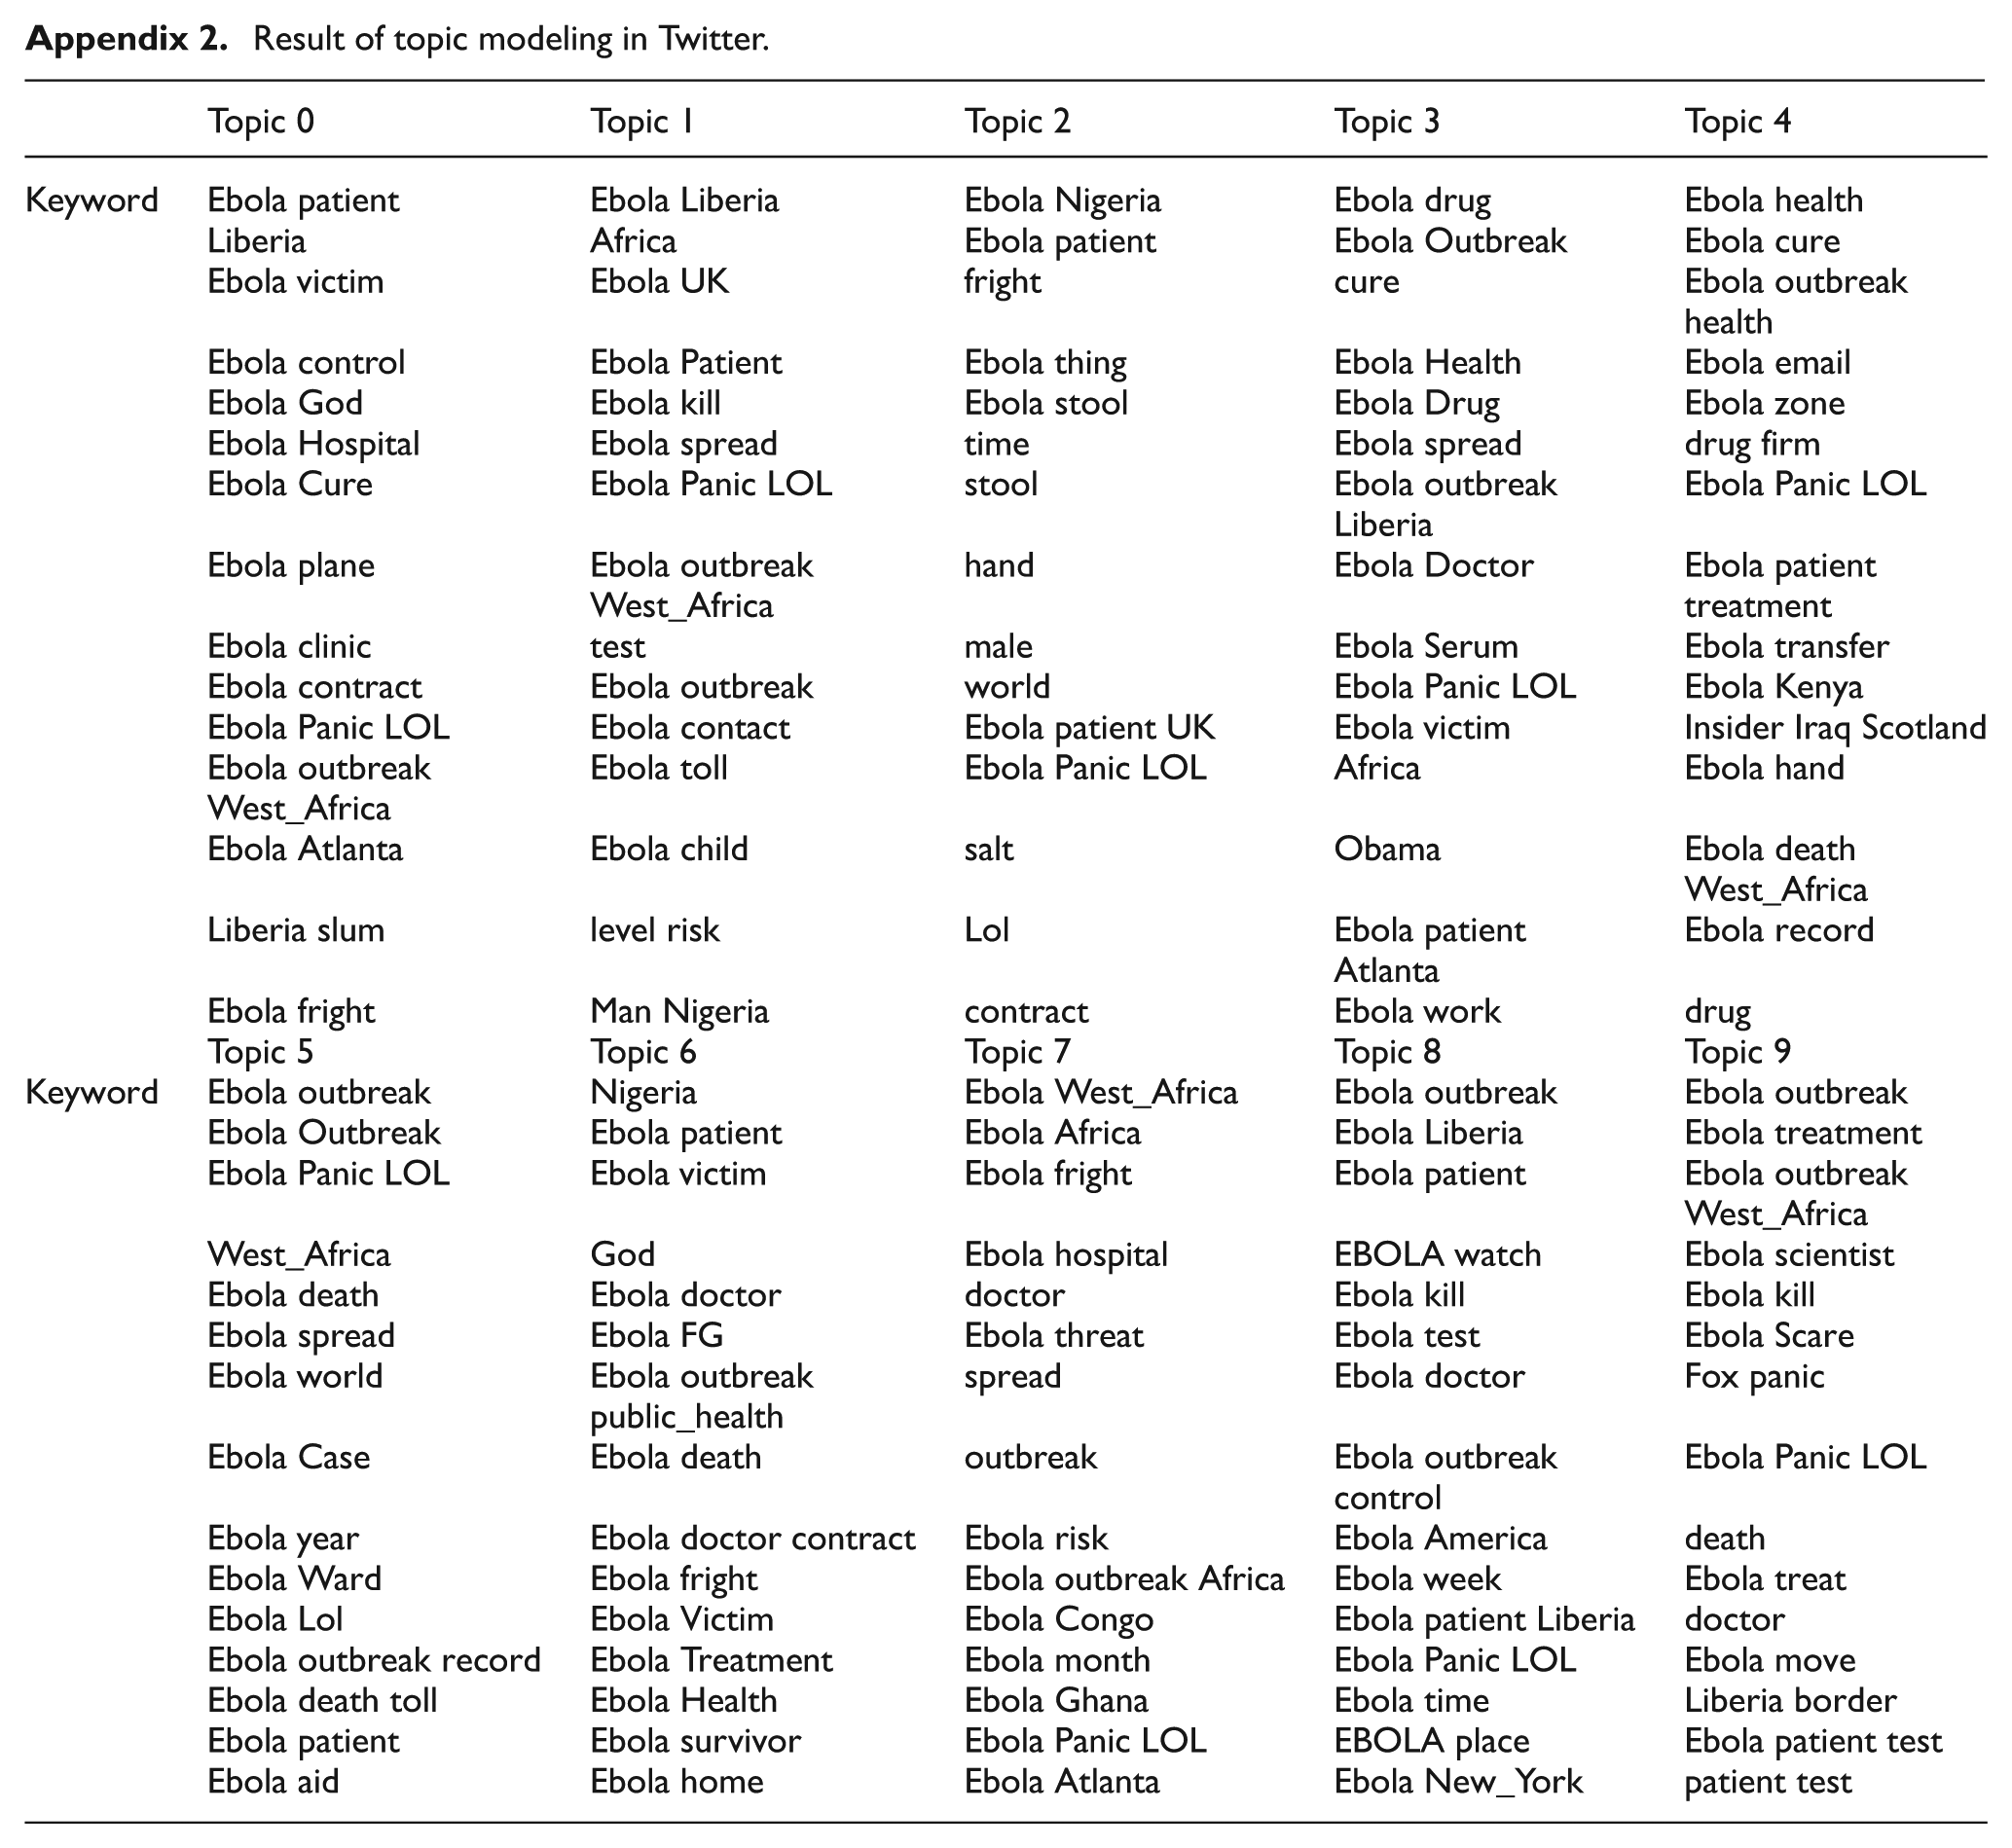
| Topic 0 | Topic 1 | Topic 2 | Topic 3 | Topic 4 | |
|---|---|---|---|---|---|
| Keyword | Ebola patient | Ebola Liberia | Ebola Nigeria | Ebola drug | Ebola health |
| Liberia | Africa | Ebola patient | Ebola Outbreak | Ebola cure | |
| Ebola victim | Ebola UK | fright | cure | Ebola outbreak health | |
| Ebola control | Ebola Patient | Ebola thing | Ebola Health | Ebola email | |
| Ebola God | Ebola kill | Ebola stool | Ebola Drug | Ebola zone | |
| Ebola Hospital | Ebola spread | time | Ebola spread | drug firm | |
| Ebola Cure | Ebola Panic LOL | stool | Ebola outbreak Liberia | Ebola Panic LOL | |
| Ebola plane | Ebola outbreak West_Africa | hand | Ebola Doctor | Ebola patient treatment | |
| Ebola clinic | test | male | Ebola Serum | Ebola transfer | |
| Ebola contract | Ebola outbreak | world | Ebola Panic LOL | Ebola Kenya | |
| Ebola Panic LOL | Ebola contact | Ebola patient UK | Ebola victim | Insider Iraq Scotland | |
| Ebola outbreak West_Africa | Ebola toll | Ebola Panic LOL | Africa | Ebola hand | |
| Ebola Atlanta | Ebola child | salt | Obama | Ebola death West_Africa | |
| Liberia slum | level risk | Lol | Ebola patient Atlanta | Ebola record | |
| Ebola fright | Man Nigeria | contract | Ebola work | drug | |
| Topic 5 | Topic 6 | Topic 7 | Topic 8 | Topic 9 | |
| Keyword | Ebola outbreak | Nigeria | Ebola West_Africa | Ebola outbreak | Ebola outbreak |
| Ebola Outbreak | Ebola patient | Ebola Africa | Ebola Liberia | Ebola treatment | |
| Ebola Panic LOL | Ebola victim | Ebola fright | Ebola patient | Ebola outbreak West_Africa | |
| West_Africa | God | Ebola hospital | EBOLA watch | Ebola scientist | |
| Ebola death | Ebola doctor | doctor | Ebola kill | Ebola kill | |
| Ebola spread | Ebola FG | Ebola threat | Ebola test | Ebola Scare | |
| Ebola world | Ebola outbreak public_health | spread | Ebola doctor | Fox panic | |
| Ebola Case | Ebola death | outbreak | Ebola outbreak control | Ebola Panic LOL | |
| Ebola year | Ebola doctor contract | Ebola risk | Ebola America | death | |
| Ebola Ward | Ebola fright | Ebola outbreak Africa | Ebola week | Ebola treat | |
| Ebola Lol | Ebola Victim | Ebola Congo | Ebola patient Liberia | doctor | |
| Ebola outbreak record | Ebola Treatment | Ebola month | Ebola Panic LOL | Ebola move | |
| Ebola death toll | Ebola Health | Ebola Ghana | Ebola time | Liberia border | |
| Ebola patient | Ebola survivor | Ebola Panic LOL | EBOLA place | Ebola patient test | |
| Ebola aid | Ebola home | Ebola Atlanta | Ebola New_York | patient test |
Funding
This work was supported by the National Research Foundation of Korea Grant funded by the Korean Government (NRF-2015S1A3A2046711) and (in part) by the Yonsei University Future-leading Research Initiative of 2014(2014-22-0116).