
Abstract
This research aims to investigate whether multi/inter-disciplinary research activities are related to research impact and publication counts of scholars. Since researchers with very high levels of multi/inter-disciplinarity might be able to target complex problems, we would expect them to receive more credits than their colleagues with a stronger disciplinary orientation. We analysed Web of Science (WoS) indexed publications of all associate and full professors from a random sample of Australian universities in physics, chemistry and biology (1980–2014). Australian Fields of Research (FoR) codes assigned to journals were used to calculate the diversification of authors’ publications. The number of citations in the first 3 years, number of 10% most frequently cited papers, and citation impact percentile were used for impact assessment. A few indicators were used to measure the diversity including ‘extent of diversification (ED)’ (number of distinct FoR codes divided by the number of publications) and ‘diversification ratio (DR)’ (ratio of the publications falling outside the dominant code to the total number of publications). A total of 47.76% of biologists’ publications, 35.23% of physicists’ publications and 20.36% of chemists’ publications were published in journals assigned to fields other than the Australian associate and full professors’ fields. Publications from biologists had the largest values of diversification. Women (compared with men) and associate professors (compared with full professors) in chemistry, biology and overall were more probably to publish diversely. ED was negatively correlated with output and citation impact. DR also had a negative but weak correlation with the number of publications and 10% most frequently cited paper.
Keywords
1. Introduction
Researchers may choose different pathways in their career focusing on one or a few research topics or areas, or they might diversify their research activities. While concentration of research activities can result in accumulation of great expertise, diversification may result in transfer of knowledge and techniques across specialisations that can help to solve complex problems. Diversification of research has gained increasing attention in recent years. Diversification or changing patterns of scientific activity has also been discussed in the context of interdisciplinarity [1]. Interdisciplinarity can be considered as communication or work across academic disciplines [2]. Inter-disciplinary research activities have been promoted during the last decade [3] and there is an assumption that inter-disciplinary research results in better outcomes and higher citation impacts [2,4] more scientific breakthroughs [5]. However, the existing evidence about the relationship between interdisciplinarity or diversification and publication output or citation impact is not conclusive.
A comparison of some past studies in Yegros-Yegros et al. [6] shows that they found different results. It is difficult to draw a conclusion about the relationship between citation impact and diversification, and this requires further research. Therefore, we address this challenge and aim to answer the following research question: Does researchers’ diversification have any effect on their overall research output and citation impact? It is believed that solving complex problems require inter-disciplinary work [7,8]. Therefore, we might expect that researchers with high levels of multi/inter-disciplinarity should be able to address complex real-world problems, and therefore might receive more credits (publication success and wide reception) than their colleagues with a stronger disciplinary orientation.
2. Literature review
In the literature, the terms ‘inter-disciplinarity’ and ‘multi-disciplinarity’ have been used interchangeably. Among very few studies that distinguish these terms, Carayol and Thi [9] and Choi and Pak [10] consider inter-disciplinarity for knowledge or outcome (e.g. publications) based on research from different disciplines and multi-disciplinarity for teams from different disciplines working together towards the outcome.
Here, we first review the existing literature on research diversity and/or inter-/multi-disciplinarity analysing its different levels of analysis and then present and discuss proposed indicators for measuring research diversity in the literature. The review focuses on the research that has used the output/outcome for measuring diversity (as opposed to research team composition). There are also studies that measure diversity or inter-disciplinarity by looking at the disciplinary compositions of grants or projects. For instance, a study of cross-disciplinarity of grant proposals [11] showed that mono-disciplinary projects were very well represented in physics/astronomy; Bromham et al’.s [12] study of Australian national research grants showed that inter-disciplinary research had consistently lower funding success.
2.1. Studies focussing on different levels of analysis for research diversity
2.1.1. Article-level
Rinia et al. [13] considered the percentage of articles for any given field published in journals not classified in that field as the degree of inter-disciplinarity of the article. They looked at physics research in the Netherlands and found that 36% of publications by physicists were not published in physics journals.
Levitt and Thelwall [14] analysed the association between the number of subject categories (SCs) assigned to journals and citation impact of articles. Their results showed that the citation rate of mono-category articles (single subject journals) was roughly twice that of multi-category articles (multi-disciplinary journals) in life sciences, health sciences and physical sciences. No difference was found for social sciences. They concluded that one could not assume that in general, multi-disciplinary research will be more highly cited, and the converse is probably true for many areas of science. In contrast to this research, Larivière and Gingras [15] found that articles with a higher level of inter-disciplinarity (operationalised as the percentage of their citations to journals of other disciplines) in some disciplines received higher citation rates, although no clear correlation was found for all disciplines combined. Moreover, they found that highly disciplinary and highly inter-disciplinary articles in all disciplines had a low citation impact. Therefore, they maintained that there might be an optimum of inter-disciplinarity beyond which the research is too dispersed to find its niche and below which it is too mainstream to have high impact.
Yegros-Yegros et al. [6] found, somewhat confirming Larivière and Gingras [15] findings, that all three dimensions of inter-disciplinarity (i.e. variety, balance and disparity) displayed a curvilinear (inverted U-shape) relationship with citation impact. Wang et al. [16] also investigated the same three dimensions of inter-disciplinarity and showed that long-term (13-year) citations: (1) increased at an increasing rate with variety, (2) decreased with balance and (3) increased at a decreasing rate with disparity. Their results also showed that although variety and disparity had positive effects on long-term citations, they had negative effects on short-term (3-year) citations, and that although balance had a negative effect on long-term citations, its negative effect was statistically insignificant in the short run. Enduri et al. [17] in their study of physics using the Weitzman diversity measure showed that in general high diversity papers receive more citations, but too much diversity can reduce their total citations (again a curvilinear relation).
Pan and Katrenko [18] used SCs of journals in which references of articles are published to measure inter-disciplinarity of publications between 2009 and 2013 and found that inter-disciplinary research was associated with a lower citation impact overall, but a higher level of citations in patent applications. They also reported a correlation between inter-disciplinary research and lower levels of international collaboration, which was more prevalent in emerging countries (e.g. Brazil and China).
On the contrary, Chen et al. [19] found that the top 1% most cited papers exhibit higher levels of inter-disciplinarity than papers in other citation rank classes (in more than 90% of National Science Foundation, NSF, specialties). They concluded that inter-disciplinary research plays a more important role in generating high impact knowledge.
2.1.2. Author-level
Leahey et al. [20] analysing 993 US researchers’ publications in Web of Science (WoS) found that while inter-disciplinary research (considering citing diverse WoS SCs) increased cumulative citation counts to researchers’ articles, it reduced their productivity (i.e. number of publications); a 10% increase in inter-disciplinary research boosted citations by 15.7% and reduced productivity by 9.1% over the course of one’s career. They also found that women were slightly more probably than men to engage in inter-disciplinary research and that young scholars engage in inter-disciplinary research more than middle-age counterparts. They also found that both high- and low-status scientists engage in inter-disciplinary research, whereas middle-status scientists hover towards the more normative, disciplinary core.
Chakraborty et al. [1] found that highly cited researchers typically follow a ‘scatter-gather’ policy in choosing areas and lowly cited researchers work on various areas at a time as well as in the entire career. Scatter-gather policy means that researchers focus on one or two areas at any given time but over their career they study various areas.
Abramo, D’Angelo and Di Costa did a series of studies on research diversity using WoS journal classification, Italian scientific disciplinary codes for researchers and three measures of diversity including extent of diversification (ED), intensity of diversification and relatedness ratio (RR) (defined in the ‘Measuring diversity’ section below). Their findings showed disciplinary differences in diversification as the ED was lowest in mathematics and highest in chemistry, intensity of diversification was lowest in earth sciences and highest in industrial and information engineering and the degree of relatedness was lowest in earth sciences and highest in chemistry [21]. They also showed that age, rank and gender made a difference in diversity, for instance, younger scientists appeared more probably to diversify their research activity than older scientists [22]. They found that diversified publications of scientists are often the result of their collaboration with researchers from other disciplines [23] and that at least in a third of cases, inter-disciplinary authored articles gain more impact than others [24] Furthermore, they reported that diversification (i.e. publishing in journals classified in fields other than the field in which an author publishes most of his or her work) at the aggregate level does not pay off in terms of citation impact (measured by the median of citation frequency distribution, and most-cited publications), with some exceptions in individual disciplines [25]
2.1.3. Institution-level
Bourke and Butler [26] looked at diversity of publications between 1981 and 1994 of academic departments in Australia using the Australian and New Zealand Fields of Research (FoR) classifications for journals and found that 70% of publications of university departments in physical sciences, 71% of chemical sciences and 51% of biological sciences were published in journals classified to the same category and the rest were published in journals of other fields. For instance, for physical sciences, 28% of the articles were published in applied sciences and 25% in mathematical sciences; for chemical sciences, 9% were published in applied sciences; and for biological sciences, 19% were published in agricultural sciences. They suggested that evaluation of universities’ research in a field by analysing publications from a department with the same classification can be seriously misleading. A national level study [27] on agricultural sciences showed that R&D if balanced with diversification could improve research performance and eventually productivity in an agricultural sector.
2.2. Measuring diversity
So far, a few measures have been suggested in the literature to measure diversity. These metrics are calculated at different levels (e.g. article, researcher and institution). Here, we present them under the level for which they have been originally proposed but some of them are applicable to other levels. While the majority of indicators rely on subject classification of journals, a few use other data such as citations (e.g. for co-citation analysis).
2.2.1. Author-level metrics
Specialisation: the spread of SCs in which the works of a given author are published in a specified time period [28].
ED: the number of topics (i.e. WoS SCs assigned to journals) covered in an author’s scientific portfolio [21].
RR: the ratio of the number of papers in the dominant discipline (i.e. the discipline in which the researcher publishes most) to the total number of papers [21].
Intensity of diversification or diversification ratio (DR): the share of the researchers’ output falling outside their sector of specialisation [21]. DR can be considered as ‘1 – RR’.
Plain entropy: the entropy of the number of times an author (a) publishes papers in a particular field (i), for all his or her fields. It can be presented by the following equation (1):
Window entropy – (denoted by
2.2.2. Article-level metrics
Integration: measures the extent to which a research article cites diverse SCs [28].
Weitzman’s diversity index: the sum of distances from each element to its nearest neighbour. In principle, it characterises the degree of dissimilarities between the elements of a set and can be used whenever a clear metric distance is defined between elements of a set. Physics and Astronomy Classification Scheme (PACS) codes of papers were used as the set for calculations [17]. This can be computed at the author level as well as by combining all PACS codes of papers published by an author as the set.
Variety (N): the distribution of WoS SCs in the references of references of an article. To compute this distribution, a frequency list of the journals in which the references of references were published was constructed and converted into a frequency list of SCs using the SC attribution of each journal as given in the Journal Citation Reports [29].
Shannon H: the indicator uses the same concept of plain entropy (as stated above) but for articles [29].
Simpson diversity I: it is defined as 1 – Simpson Index, which is the commonly used measure of concentration (also known as Herfindahl-Hirschman Index in disciplines such as economics) [29].
Stirling index Δ: the indicator ‘can be understood as a Simpson diversity in which the products of proportions of categories are weighted by distance/similarity’ between categories (fields) [29].
Leinster-Cobbold diversity indices: a diversity measure based on third generation of biodiversity measures (the effective numbers) that takes into account the similarity/distance of elements in a system (i.e. references of an article) [30].
2.2.3. Institution-level metrics
Inter-disciplinary profile of the institution’s research: percentage of its publications in each SC [31].
Inter-disciplinary profile of knowledge users: citations received from each SC, and a field-specific breakdown of all publications citing the work of the institution [31].
Spill out: the percentage of publications of university departments published outside the field of their research (measured by journal classification) [26].
3. Methodology
The following subsections explain the data, the research procedures and the indicators used in this study.
3.1. Sampling
Excellence in Research for Australia (ERA) is the Australian national research evaluation process that is undertaken every 3 years, and ERA 2015 is the current one and ERA 2018 is currently under investigation. ERA rates the performance of higher education institutions in a range of subject fields by a specific classification of academic fields known as FoR. A full list of FoR codes is available at http://www.arc.gov.au/rfcd-seo-and-anzsic-codes. The Australian Research Council (ARC) that is responsible for ERA maintains a list of journals with their FoR codes. Each journal can have a maximum of three FoR codes. FoR is increasingly used by the bibliometric community for research purposes [32].
There is no database of all scholars in Australia which could have been used to draw a random sample from the database. Thus, we decided to undertake cluster sampling at the institutional level. To draw our sample, ERA 2015 data were used to identify the universities that are active in research in the three areas of physics, chemistry and biology. Then for each of the three areas four universities were randomly selected. We then extracted the publication lists and attributes such as age and rank of all full professors and associate professors affiliated with the selected universities using their websites.
Overall, the sample included 75 authors from physics, 63 from chemistry and 125 from biology. The data were obtained from Scopus and WoS core collections. In summary, the specifications of our data are as follows:
Document type was restricted to three types ‘Article’, ‘Review’ and ‘Article, conference paper. These were chosen as they are mainly peer-reviewed publications known as substantial items [33].
The period was set as 1980–2014 (inclusive) because some of the indicators used in the study were only available for this period in an in-house database maintained by the Max Planck Society and based on WoS. It is also a reasonable period as it covers 34 years and allows 3–4 citing years at the most recent publication years for receiving citations. The citation window for impact measurements should be at least 3 years [34].
Full and associate professors were included in the study because they are well established in their research and have a sufficient number of publications for a meaningful analysis.
The three broad areas of physics, chemistry and biology were used because citation based bibliometric techniques can be rigorously applied to these fields for research evaluation [35] but not to some other fields (e.g. engineering or social sciences).
3.2. Data collection processes
The website of each university was visited to locate the relevant academic unit (school, department, faculty or research centre) that fell into the given research area. Full and associate professors were identified and their institution, gender, rank and field were recorded. Then the authors were searched in Scopus for their profile. Some further information about each author was recorded based on their Scopus profile including their first year of publication, total number of publications and total citations. A full list of publications for each author was downloaded as tab delimited files. The reason Scopus was used at this stage was that Australian universities have been using Scopus for their research data and for ERA evaluations and, therefore, the majority of Australian academics monitor and maintain their Scopus profile. This makes it an easy and reliable method for obtaining full lists of publications for each author. Scopus author profiles also cover publications from authors’ previous affiliations as well as variations of authors’ names.
Scopus publications lists were randomly checked with the scholars’ university profile and curriculum vitae (CV) of authors to ensure that the publication list was accurate. Once the full lists of publications were obtained, all publications were searched in WoS through their digital object identifier (DOI) or if the publication had no DOI, through a combination of publication title and publication year. Full WoS records for the publications were obtained. Further checks were done to make sure that the publications were not incorrectly assigned to authors in the sample. Then further citation metrics were added to the data from the WoS in-house database.
3.3. Authors’ publication counts and impact indicators
A range of indicators was used in this study for publication counts and citation impact evaluation of researchers. However, authors’ academic age (i.e. the number of years during which an author has published: ‘last year of publication – first year of publication + 1’) was used to normalise some of the indicators. They include the following:
Number of publications: total number of publications for each researcher.
Average publications per year.
TC3: Total citations received in the first 3 years after publications (not including the publication year). The average of publications’ TC3 values for an author was used in our analysis.
Hazen: citation impact percentile calculated by the Hazen formula [36]. The higher the percentile, the more citation impact the publication has received. A percentile of 90 means that the paper belongs to the 10% most frequently cited papers in the corresponding SC and publication year. The median percentile was calculated for each author. Percentile indicators were used since the use of such indicators have been recommended in bibliometrics [37].
P10: number of papers which belong to the 10% most frequently cited papers in the corresponding SC and publication year. The number for each author was divided by the total number of years since publishing the first publication in the dataset (i.e. maximum year of publication – minimum year of publication + 1) in order to normalise the data for authors with different lengths of activity. The result was multiplied by 10.
3.4. Authors’ research diversity indicators
The ARC journals list with their assigned FoR codes were used to assign FoR codes to each publication. In the case of publications where the journals had more than one FoR code, only the first code, as the main code, was included in the analysis. It should be noted that some journals (such as Nature or Science) are classified as multidisciplinary (MD) and we have used specific indicators for such journals. We calculated four measures for diversification in order to cover different aspects. They include the following:
ED: the ratio of distinct FoR codes for each author divided by his or her publication counts. Instead of simply counting the number of FoR codes (similar to Abramo et al. (21)), which does not take into account the number of publications of authors, we divide it by the number of publications so the result shows the ED per publication. This measure does not include publications coded as MD.
Intensity of diversification or DR: the ratio of the publications falling in FoR codes other than the dominant code (i.e. the FoR code in which the researcher has published most) to the total number of publications [21]. This measure does not include publications coded as MD.
MD Ratio: the ratio of publications with MD codes to all publications.
Divergence: FoR codes are integer values and have a logical order. Furthermore, neighbouring disciplines have codes closer. For instance, 02 and 03 are assigned to physical and chemical sciences, respectively, while 08 is assigned to library and information science and 18 to law and legal studies. For measuring divergence in this study, the variance of FoR codes of all publications was calculated. The higher the variance, the higher the diversification as it takes into account the number of distinct FoR codes and their distance.
For the analysis, we have performed regression analysis and correlation. Ordinary least squares (OLS) regression was used to analyse the relationship between rank or gender and diversification indicators. Gender was coded as 1 = male and 0 = female, and rank was coded as 1 = full professor and 0 = associate professor. The assumptions for regression analysis (e.g. normal distribution of residuals, multicollinearity of independent variables etc.) were tested and met.
4. Results
4.1. Output and impact by field
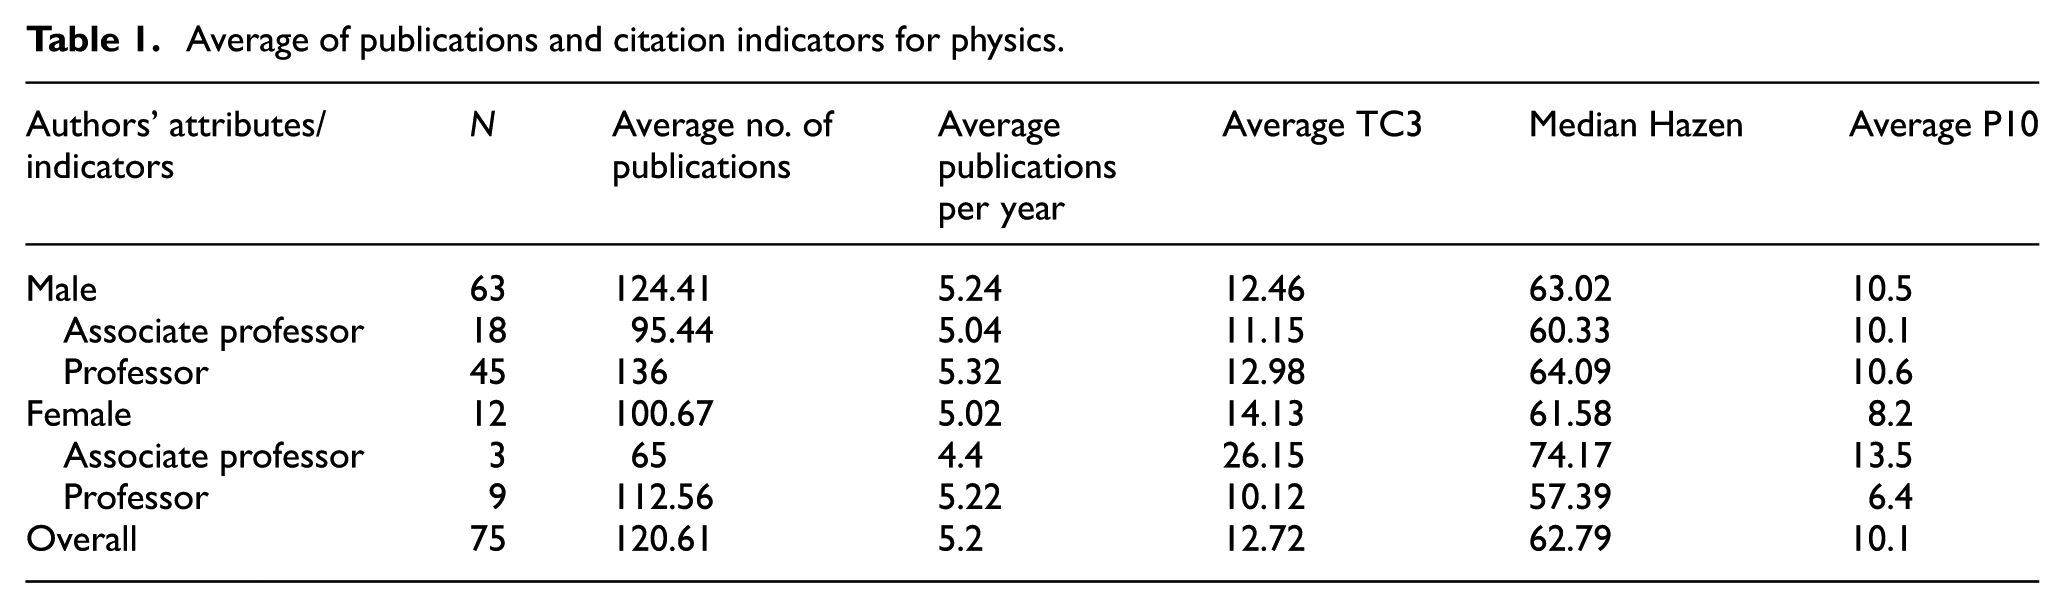
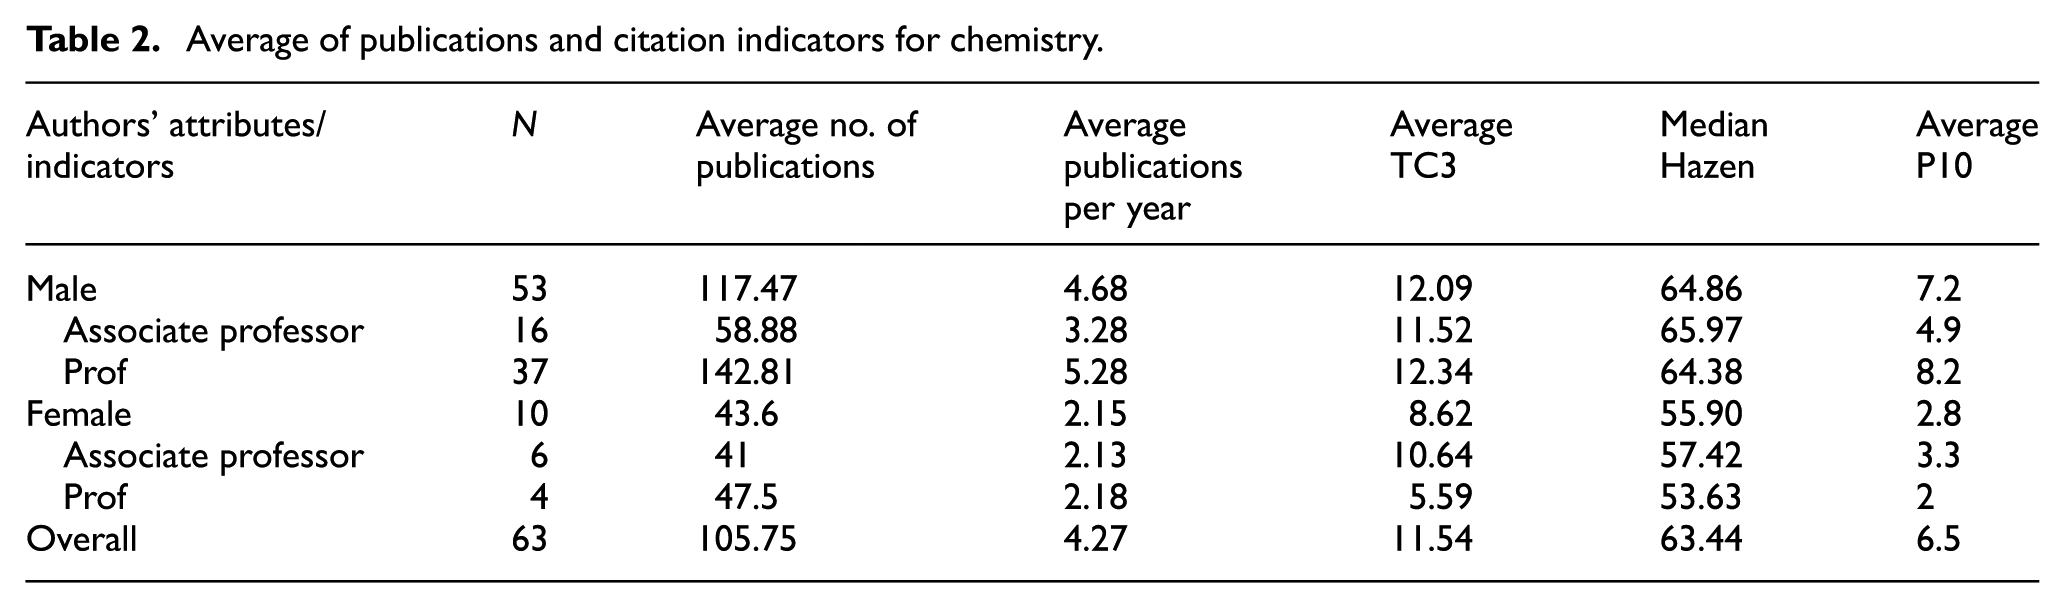
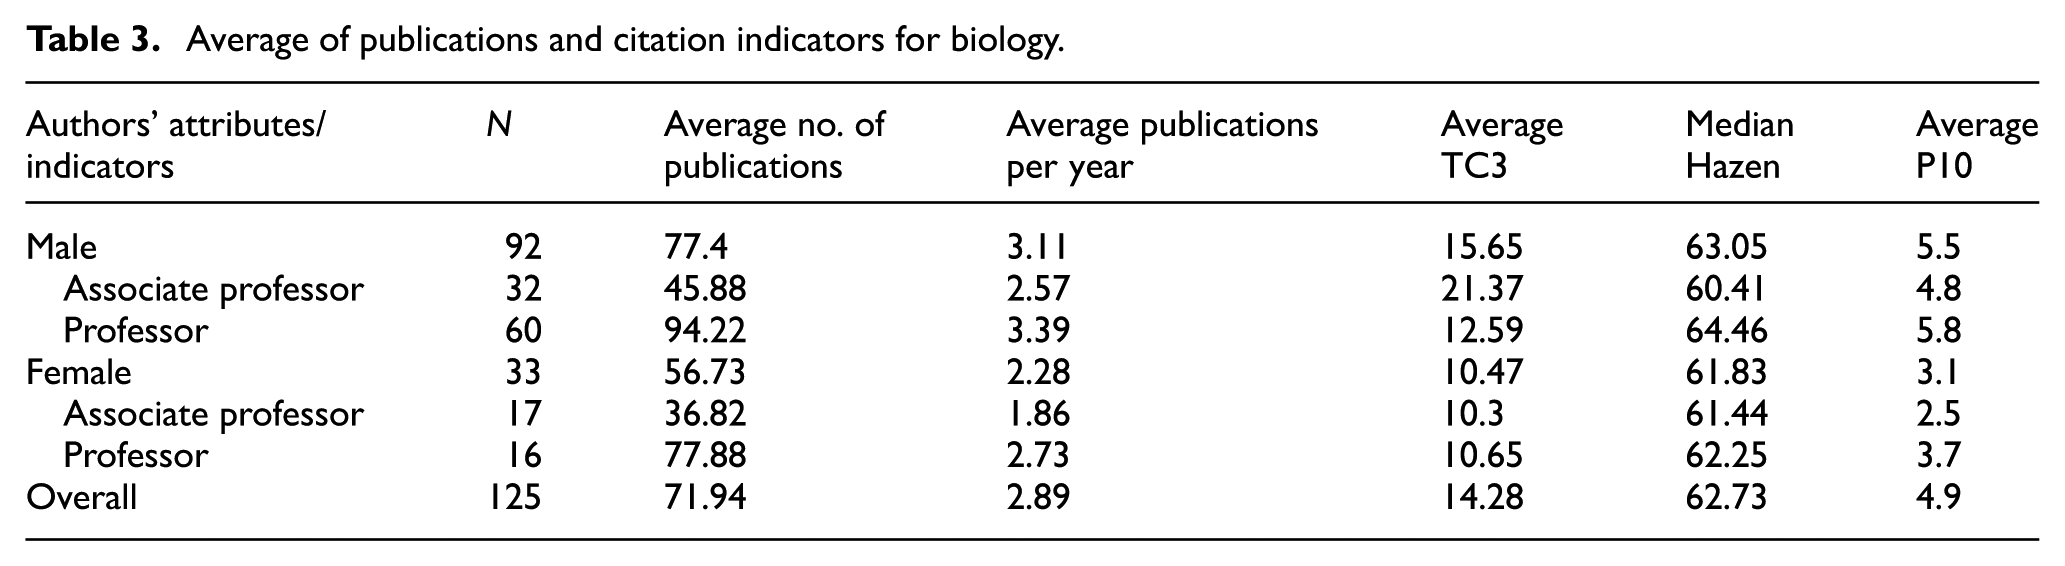
Tables 1–4 show the output and impact indicators (i.e. average number of publications, average of citations received after 3 years for each publication, median of Hazen percentiles and average of P10) for the authors of three fields separately (Tables 1–3 for physics, chemistry and biology, respectively, and combined in Table 4) by gender and rank. The field-normalised citation scores are especially interesting in the overall view across the three fields. The results show that the average number of publications is greatest in physics and is lowest in biology. While TC3 is larger in biology than in chemistry and physics, median Hazen percentiles is larger in chemistry than in physics and biology. P10 is larger in physics than in chemistry and biology. Generally, men performed better than women in all disciplines (and overall) in all indicators, except in one case where TC3 for women in physics (14.13) was slightly higher than men’s (12.46).
Average of publications and citation indicators for physics.
Average of publications and citation indicators for chemistry.
Average of publications and citation indicators for biology.
Average of publications and citation indicators for all three fields combined.

While male physicists published on average more than twice the average of female physicists, their citation impact is close to female physicists and even the average 3-year post-publication citations of females are better than their male counterparts. Female associate professors outperform female professors and even male counterparts in both ranks in some of the impact indicators despite their lower average number of publications. Likewise, female associate professors in chemistry outperform female professors and are very close to male counterparts of either rank despite their lower average number of publications.
Table 5 shows the averages and standard deviations for the authors’ publication counts/impact indicators. Physicists show a better output level, publishing on average more than the other two groups but each field has a different ranking for citation-based indicators. Biologists outperform the other two groups considering the average citations received after 3 years, while chemists outrank others considering Hazen percentiles, and physicists perform the best in terms of P10. Similarly, a clear citation-based impact distinction does not exist for rank, and associate professors have higher TC3 values despite having almost half the number of publications of professors on average. For the other two indicators (Hazen percentiles and P10) professors perform better than associate professors. There is a clear difference between the publication counts and impact of male and female researchers and male scientists outperform female scientists when combining all the fields.
Mean and SD of publication counts and impact indicators by discipline, gender and rank.
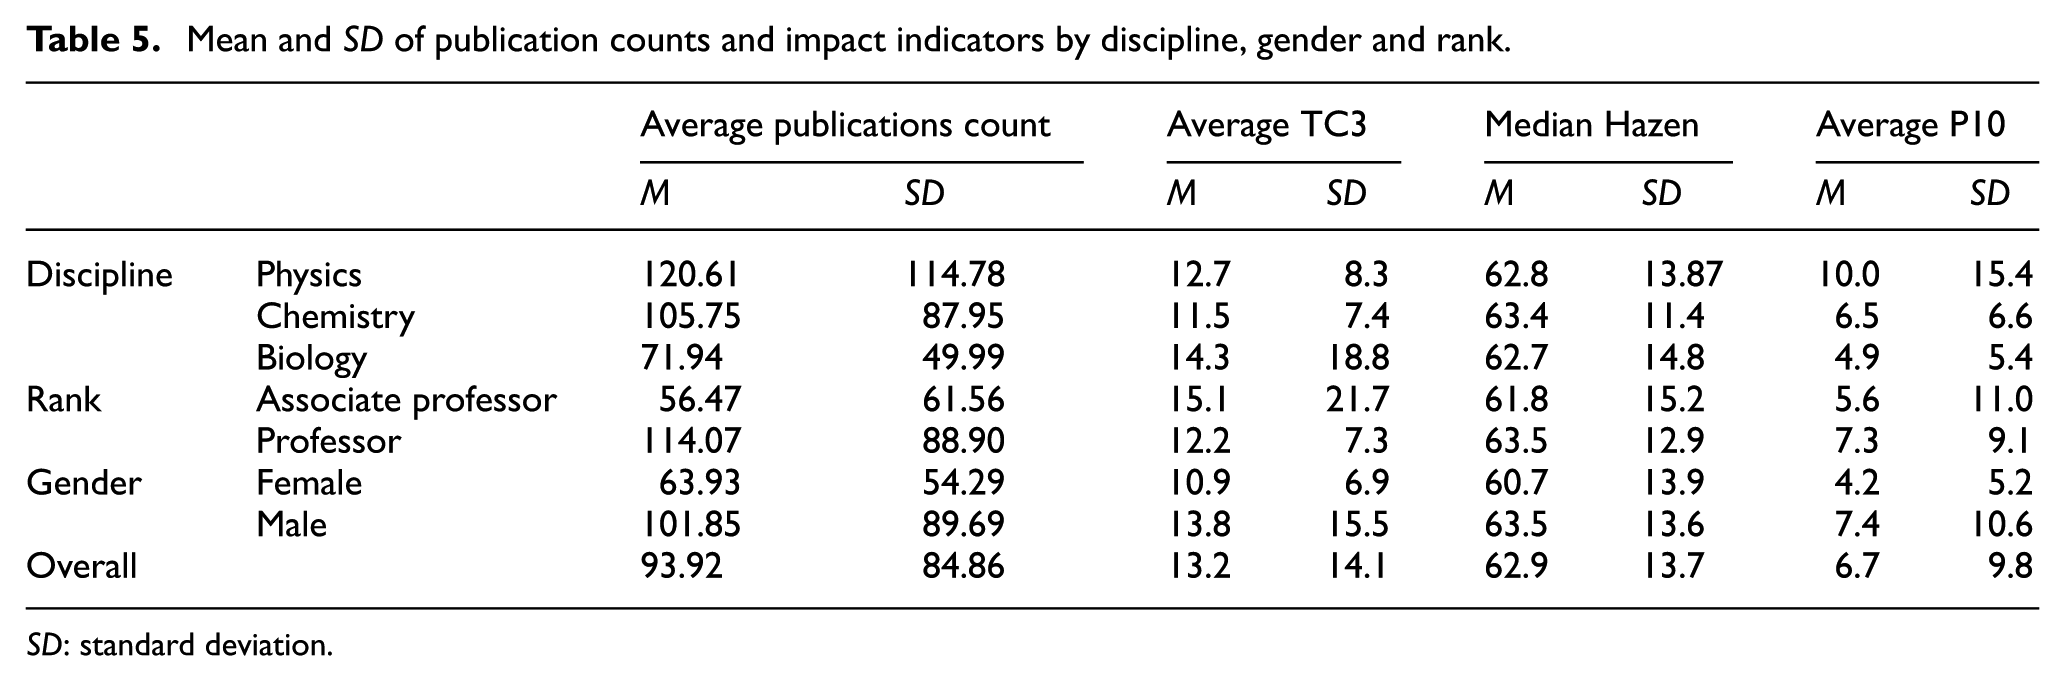
SD: standard deviation.
Table 6 shows the distribution of publications for each of the three disciplines across all discipline fields (FoR codes). The dominant discipline fields are shown in bold for each of the three given disciplines. In physics, 64.77% of the publications were published in journals categorised in physical sciences and 22.21% were published in mathematical sciences. In chemistry, 79.64% were published in chemical sciences journals and 7.91% in physical sciences. In biology, 52.24% were published in biological sciences journals while the rest were published in other fields including 13.71% in environmental sciences. The percentage of publications in MD journals was highest in biology (11.01%) and lowest in chemistry (4.07%).
Percentage of publications in each FoR field by discipline.
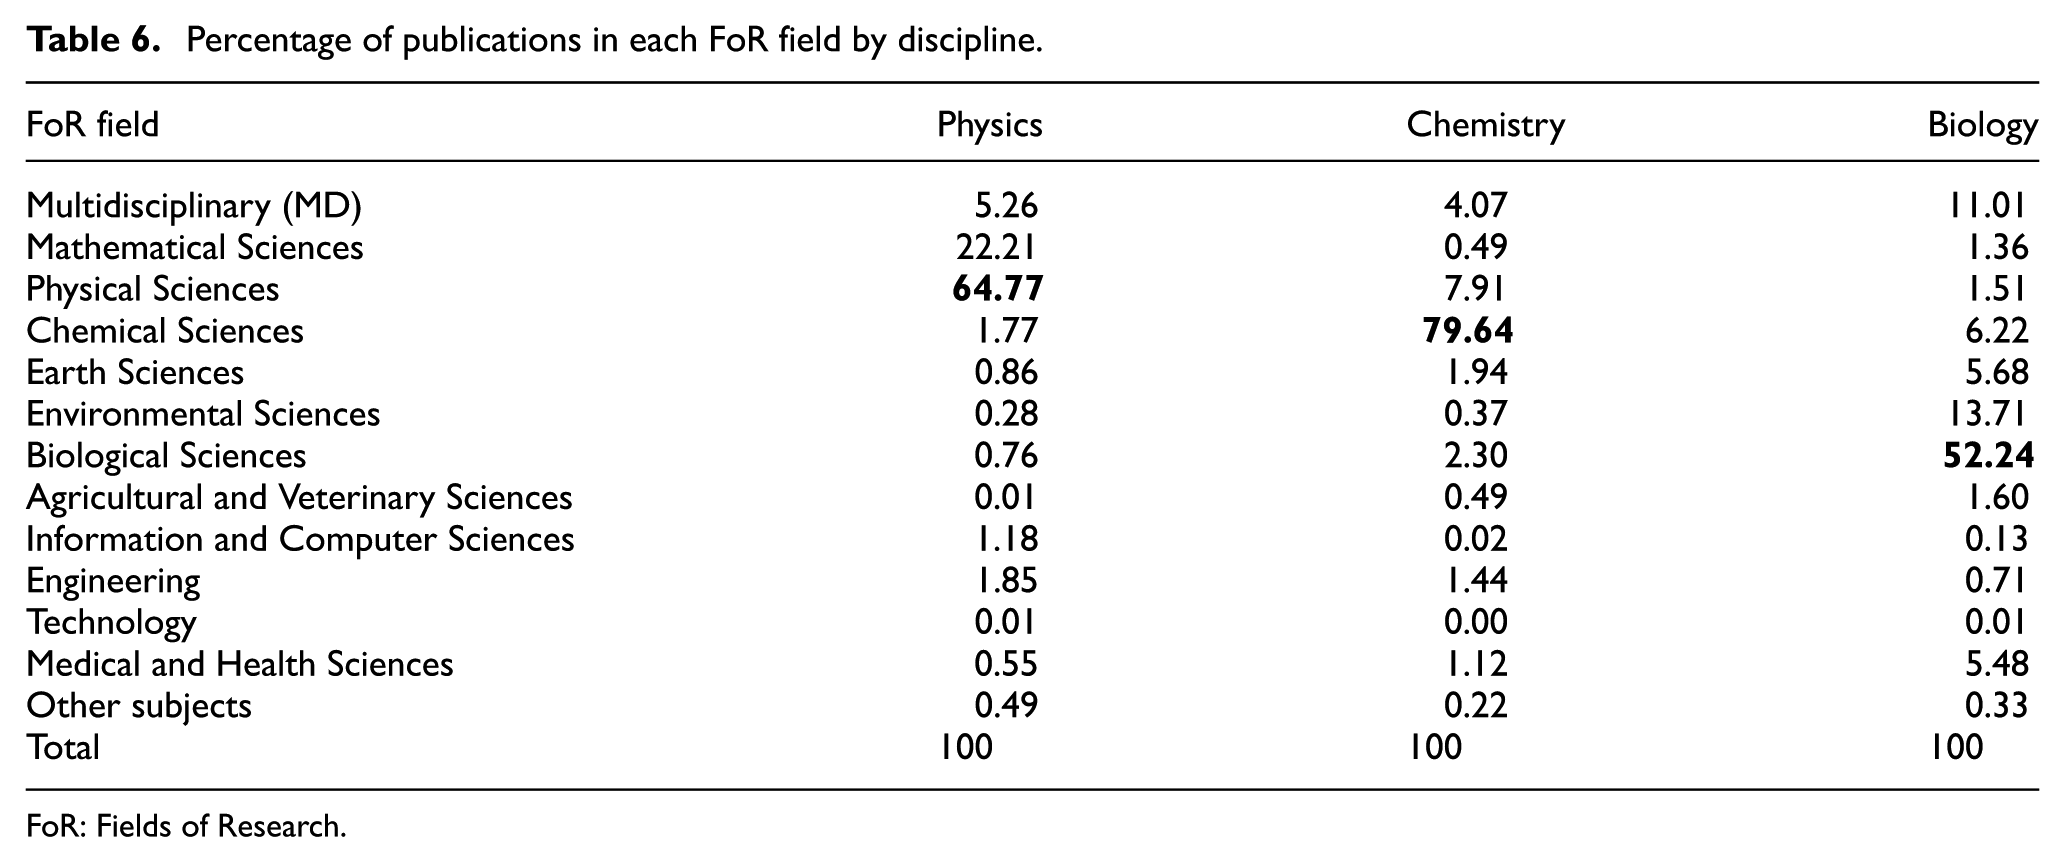
FoR: Fields of Research.
4.2. Diversification by field
Table 7 shows the mean (M) and standard deviation (SD) of the four diversification measures by discipline, gender, rank and overall. Biology scholars appeared to have more diversity in their research compared with scholars in physics and chemistry in all indicators, while there was no clear ranking for chemistry and physics scholars. Physicists have more research diversity considering DR and MD ratio but lower diversity in ED and divergence. Analysing scholars’ rank for all the fields, publications by associate professors included more diversification compared with full professors. While women’s publications had higher ED and DR, men’s publications had larger divergence and a greater ratio of publications in MD journals.
Mean and SD of diversification indicators by discipline, gender and rank.
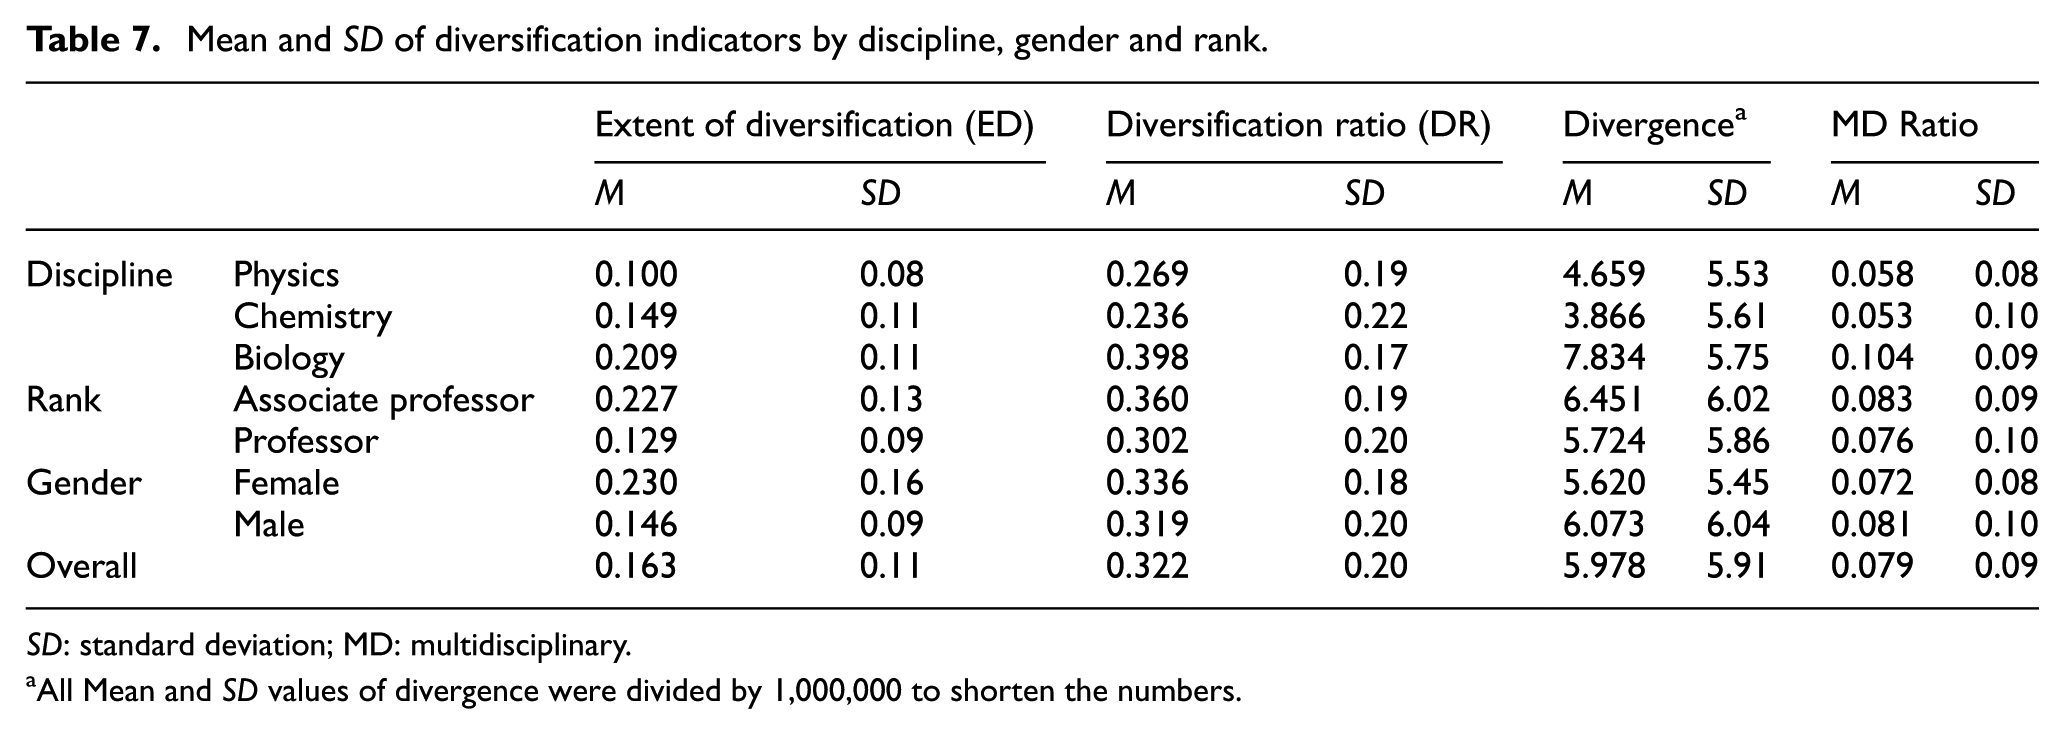
SD: standard deviation; MD: multidisciplinary.
All Mean and SD values of divergence were divided by 1,000,000 to shorten the numbers.
4.3. Diversification, gender and rank
This section presents the results of OLS regressions for diversity indicators versus rank and gender (Tables 8–11). The results show that rank and gender have a statistically significant effect on diversification (ED) for chemistry, biology and overall but not for physics. The coefficients are negative for both rank and gender which means full professors and men have smaller diversification (ED) values.
OLS regression of ED versus gender and rank.
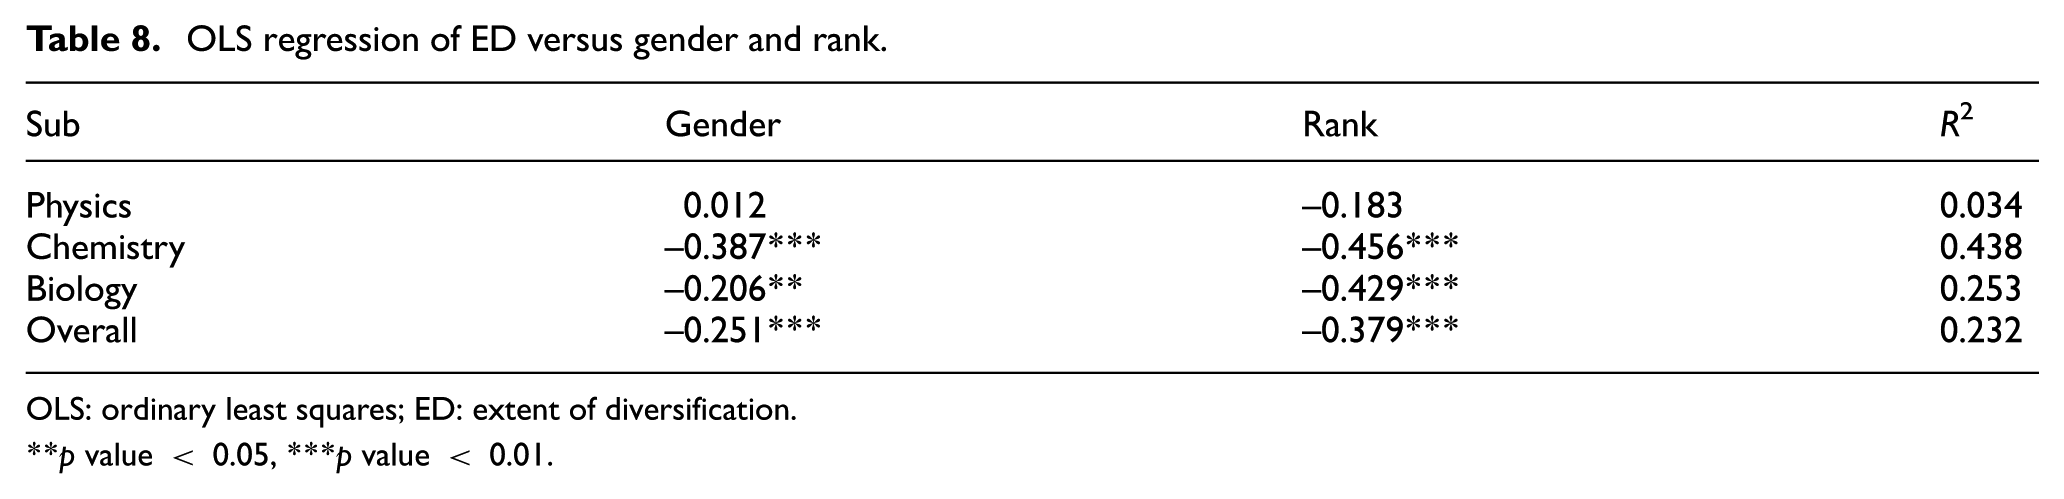
OLS: ordinary least squares; ED: extent of diversification.
p value < 0.05, ***p value < 0.01.
OLS regression of DR versus gender and rank.
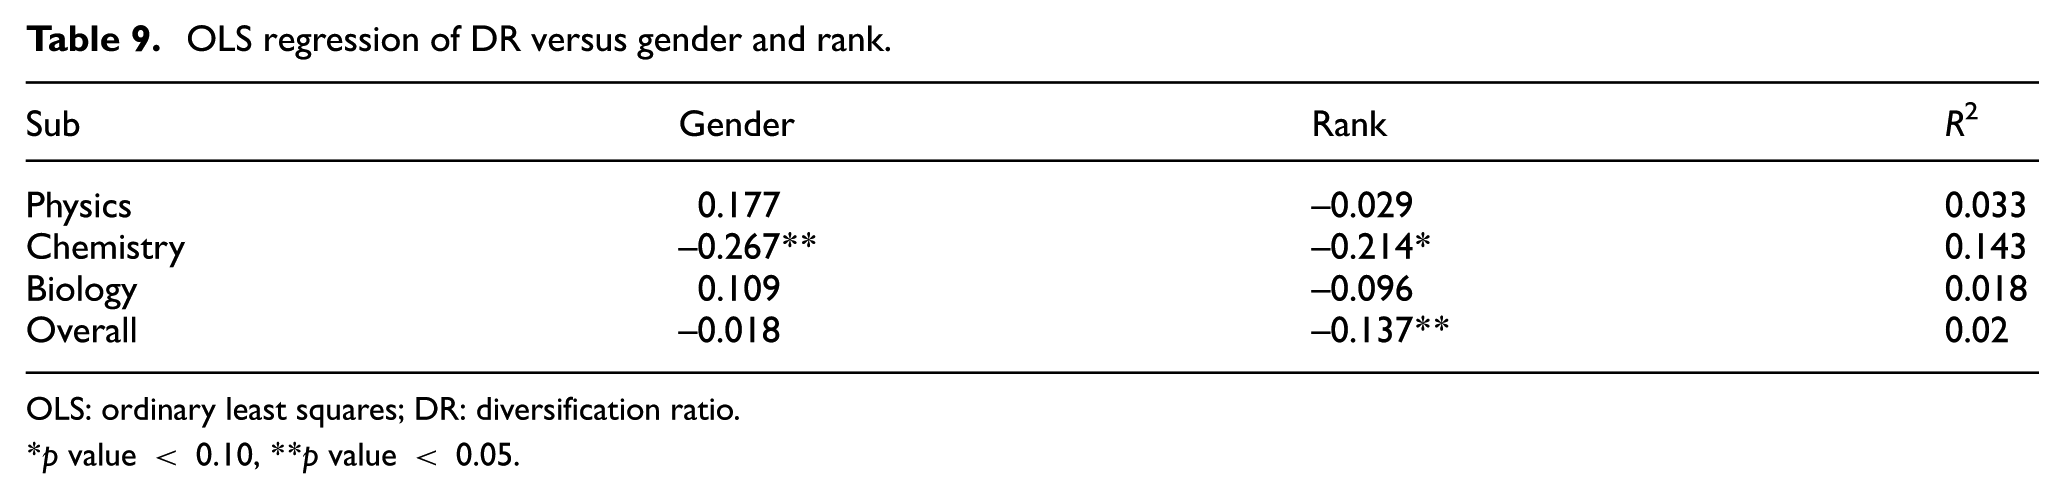
OLS: ordinary least squares; DR: diversification ratio.
p value < 0.10, **p value < 0.05.
OLS regression of divergence versus gender and rank.
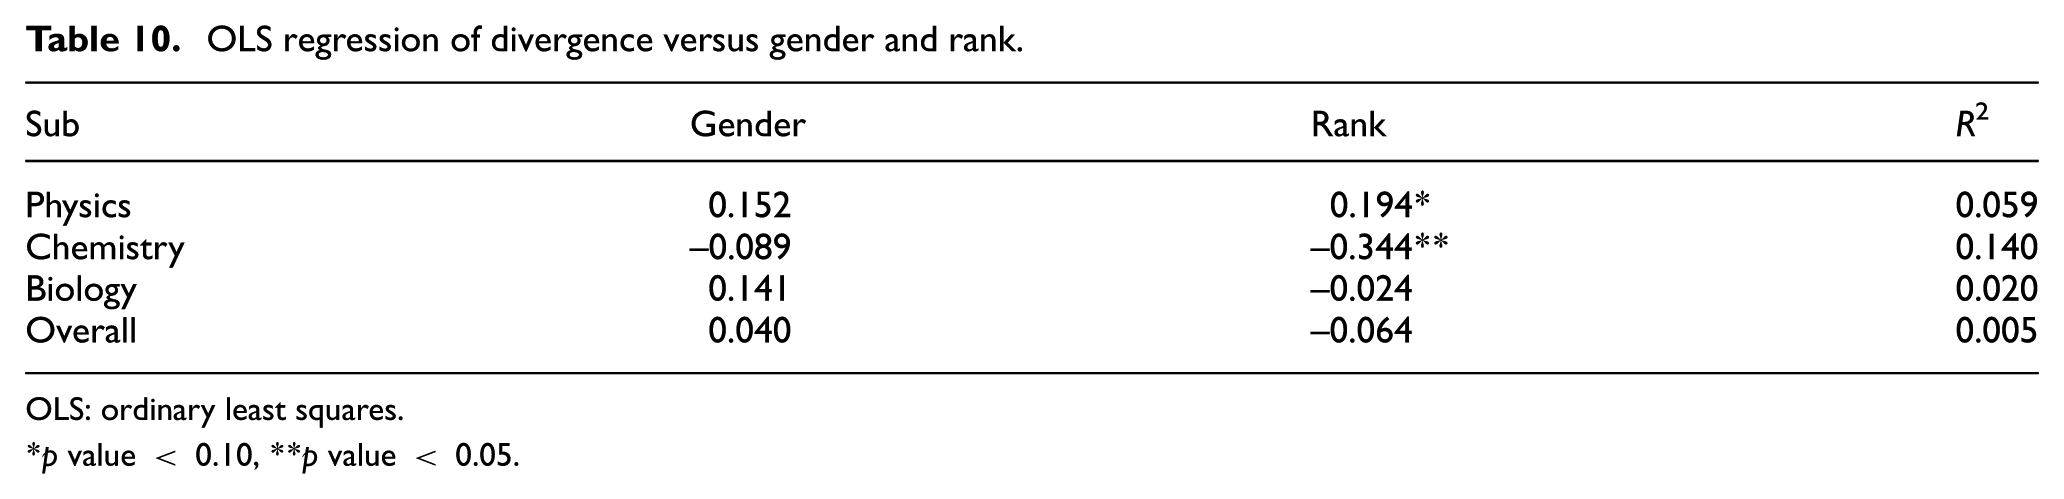
OLS: ordinary least squares.
p value < 0.10, **p value < 0.05.
OLS regression of MD Ratio versus gender and rank.
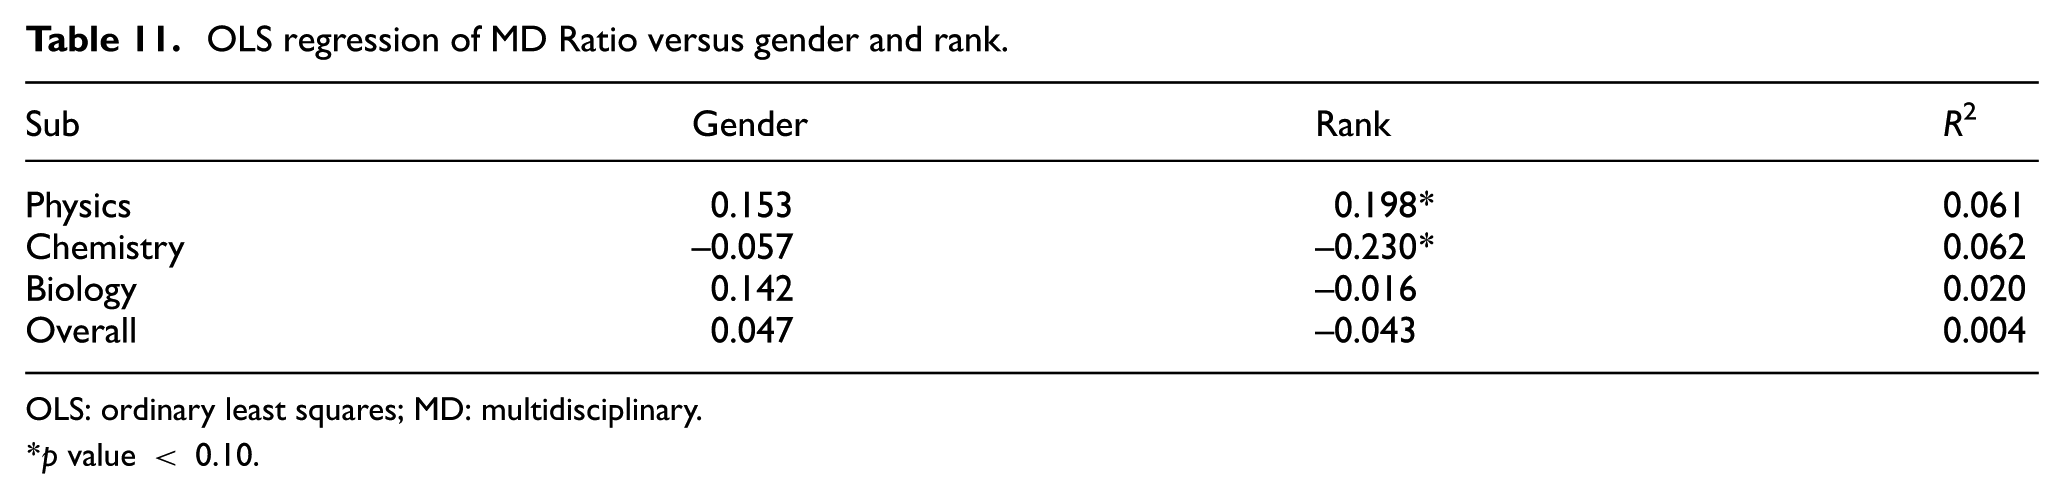
OLS: ordinary least squares; MD: multidisciplinary.
p value < 0.10.
Rank is statistically significantly related to DR in chemistry and overall, but not in physics and biology. Gender also statistically significantly impacts on DR in chemistry. In the case of divergence, rank only has a statistically significant effect in chemistry.
4.4. Diversification and impact
This section shows the Spearman correlation coefficients (as the data were not normally distributed) for output, citation impact and diversification indicators. Figure 1 illustrates the scatter plot matrix and spearman correlation values. Pink/bold cells are significant at 0.01 and grey/bold/italics cells are significant at 0.05. The notable correlations are negative correlations between TC3 and ED, between DR and P10, between ED and P10 and between Hazen percentiles and ED. This generally indicates that those who have a larger ED and DR are less probably to have a larger number of highly cited papers. ED was also negatively correlated with the number of citations received in the first 3 years (TC3).
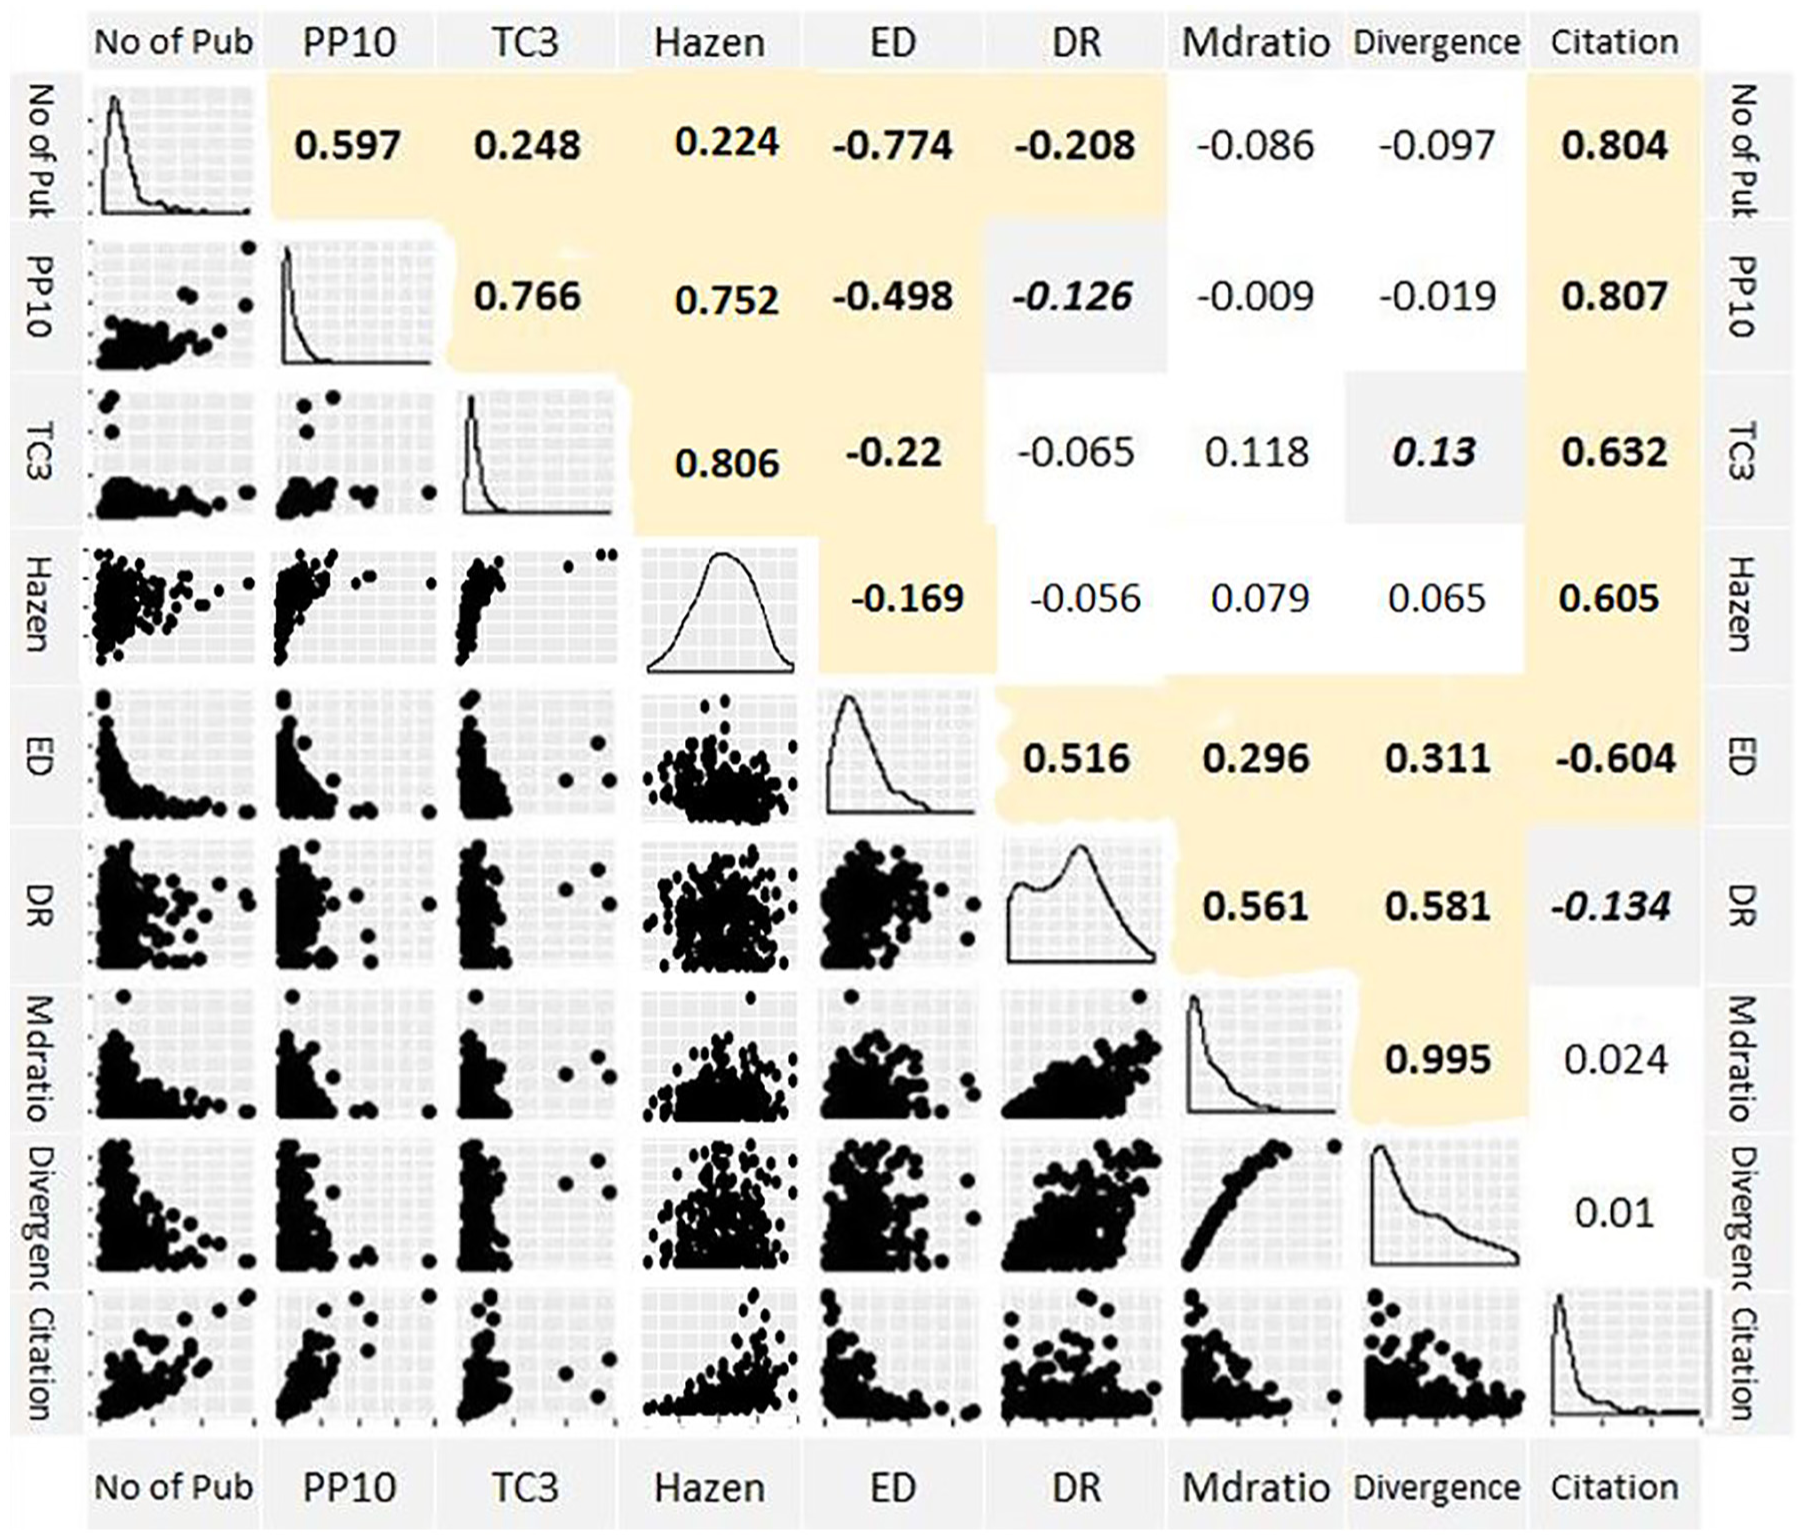
Scatterplot and Spearman correlation between diversity indicators and output/impact indicators.N = 263; pink and bold cells: sig < 0.01, grey and bold and italics cells: sig < 0.05.
As some of the past studies [6] found curvilinear relationships between diversity and citation impact, we tested also for curvilinear relationships. We only found a statistically significant curvilinear relationship between ED and P10, while the statistically significant simple regression equation was F(1, 261) = 41.0, p = 0.000, R2 = 0.136. Adding a quadratic component to the regression of ED and P10 produced a significant increase in fit, with 0.065 in R2 change, F(2, 260) = 32.7, p = 0.000, R2 = 0.201. This indicates that while ED has an initial negative effect on P10, a threshold is reached beyond which higher levels of ED might have positive impact on P10 (U shape). In other words, an initial increase in ED reduces P10 but after a certain threshold, an increase in ED results in an increase in P10.
There is also a very strong correlation between MD ratio and divergence which indicates those who have a higher percentage of articles in MD journals are also more probably to publish articles in journals that are farther apart in the FoR subject classification hierarchy.
5. Conclusion
This research investigated whether multi/inter-disciplinary research activities of scholars in chemistry, biology and physics are related to their research publication counts and (citation-based) impact. The study has implications for research evaluation and policies, but also it shed some light on some other aspects concerning the trends towards interdisciplinarity from the point of view of faculty age, gender and disciplinary origin. Although some studies have been done in the past in this area, the collective evidence was not conclusive and there was a need for more research. Understanding the relationship between diversity and impact has implications both for individual researchers in planning their career and for science policymakers.
The results showed disciplinary differences in the output and impact indicators. While physicists published more than chemists and biologists, the citation rates (TC3) were highest in biology and lowest in chemistry. On the other hand, the normalised citations (Hazen percentiles) were highest in chemistry and lowest in biology. P10 was highest in physics and lowest in chemistry. The distribution of publications in different FoR codes showed that biologists publish almost half (47.7%) of their papers in journals categorised outside biological sciences. This number was 35.23% for physics and 20.3% for chemistry. These findings are in line with those of past studies as physicists in the Netherlands published 36% of their publications outside physics journal [13]. A previous study in Australia [26] also showed similar results with, for example, 49% of biologists’ articles were published in journals outside biology. There were also disciplinary differences in various indicators of diversification. Biology had the highest values in all of the four aspects of diversification including extent and intensity of diversification, MD ratio and divergence. While chemistry had a larger ED, physics had a larger DR, MD ratio and divergence. In contrast to this study and Bourke and Butler [26], Abramo et al. [21] found that chemistry had the highest ED, however, their definition of ED was slightly different as in their calculation, the number of topics was not divided by the number of publications.
Although Abramo et al. [22] did not find gender as a related factor to diversification, our results showed that gender and rank of researchers have a statistically significant effect on aspects of research diversification in some disciplines. Women were more probably than men to have a greater ED in chemistry, biology and overall, and also more probably to have a greater DR in chemistry. In terms of rank, associate professors (compared with full professors) have a greater ED in chemistry, biology and overall, and have a larger DR overall. Furthermore, they have a larger divergence in chemistry. This is in contrast to the findings of Abramo et al. [22] who revealed a higher ED for full professors.
The analysis of the relationship between diversification indicators and output/impact indicators revealed that ED was negatively correlated with both output and impact. The larger the average number of FoR codes, the lower the number of publications and impact indicators (total citations, P10 and TC3). The DR also had a negative but weak correlation with the number of publications, P10 and TC3. MD Ratio also had a weak positive correlation with the number of citations received TC3. Comparing these results with those of past studies is problematic as there is no similar other study that has used similar approaches and indicators. Few studies have used SCs of published articles to study the relationship between diversity and citation impact at author level. Some past studies found positive correlations [20], some negative correlations [18] and some no effect [6].
Some of these differences are due to data and indicators used in the studies. For instance, both studies, Leahey et al. [20] and Yegros-Yegros et al. [6], used SCs of cited references of papers to measure diversity and they found contradicting findings. The former was conducted at author level while the latter was done at article level. A recent study [38] confirmed that different indicators (e.g. disparity vs variety) and methodologies (e.g. using references vs using authors’ affiliations) ‘can produce seriously inconsistent and even contradictory results’ (p. 271). Chakraborty et al. [1] used SCs of publishing journals but the field of their study was computer science which is different by nature from those included in our study. However, there is some similarity between our findings and those of Chakraborty et al. [1] as both studies reveal complexity of the relationship between citation impact and diversity. While Chakraborty et al’.s [1] study implied that diversity is overall good for impact only if it is spread over time and researchers should focus on few fields in each time window, our findings imply that positive or negative effects of diversity on citation impact might partly be influenced by the choice of fields and journals in which researchers contribute. This is because divergence and MD ratio seemed to have some positive effects on impact while other diversity indicators had negative effects on impact. Divergence in this study was measured with variance of FoR codes, but we should note that it is not a perfect measure. FoR numbers assigned to each discipline do not always reflect the cognitive distance between them, especially when one passes from the sciences to the social science, and from the latter to arts and humanities. It is difficult to measure the cognitive distance between different FoR codes (something that should be done in future studies), and some related fields might be farther from one another than expected. Therefore, the divergence values should be interpreted with caution. However, as this study only focused on three disciplines of physics (02), chemistry (03) and biology (06), the impact of the issue related to the cognitive distance on the calculation should not be big.
While the nature and dynamics of the relationship between diversity and impact merit further investigation, the reason for their interaction also needs investigation. We need to know why inter-disciplinary research is more or less cited than non-inter-disciplinary research. For example, Judge et al. [2] maintained that social network variables do a good job of explaining why some inter-disciplinary research is more cited than non-inter-disciplinary research. However, other variables such as quality and readership size of journals could play a role. That needs further research.
This study has some limitations that should be considered when trying to generalise any of the findings. Focusing on one country (Australia) and a lack of data on some variables that could improve the data analysis are among these limitations. Relying on journal classifications also has its own issues as such classifications may not precisely represent the scope of the journals. For instance, while PLoS One is a MD journal, it publishes more articles from life and health sciences than physical sciences. The focus only on three fields and the number of individuals included in the study are other issues that should be taken into account. We should also note that research activity in each university is influenced by the university’s policies, strategies and research culture and these may vary from one university to another.
Footnotes
Acknowledgements
Some of the bibliometric data used in this article are from an in-house database developed and maintained by the Max Planck Digital Library (MPDL, Munich) and derived from the Science Citation Index Expanded (SCI-E), Social Sciences Citation Index (SSCI) and Arts and Humanities Citation Index (AHCI) provided by Clarivate Analytics (Philadelphia, PA, USA).
Declaration of conflicting interests
The author(s) declared no potential conflicts of interest with respect to the research, authorship and/or publication of this article.
Funding
The author(s) received no financial support for the research, authorship and/or publication of this article.