




Abstract
Publishing mobile applications on the official stores is becoming a big business. Many developers are charmed by the billion-dollar success of breakout applications. Thus, in order to ensure success, mobile applications need to sustain top ranking. Previous work on the predictability of mobile applications success aimed to extract from app stores relevant features that influence high rating. In this article, we propose an automated approach to exploit data available on Facebook platform that predicts mobile applications breakout. We collect data from Facebook graph API, then determine sentiment polarity of user comments. We design statistical features to score users sentiment for each post. Then, we compose posts scores with Facebook statistical measures to form a mobile applications breakout dataset. Finally, we use machine learning techniques to build our breakout prediction model. We evaluate our approach with 199 mobile applications and obtain a prediction accuracy of 83.78%. We find that Likes count on a Facebook page is decisive for climbing mobile applications ranking. However, a high rate of negative opinions declines application ranking and deprives mobile application of achieving a breakout. Based on these findings, we provide evidence that user interactions on social networks can influence the success of mobile applications.
1. Introduction
Publishing mobile applications on the official stores, or App stores, is a potentially big business. A mobile application like Candy Crush has grossed over a billion dollars in 2016 [1]. However, mobile applications editors are very concerned about the popularity evolution of their applications. In particular, many developers enter the mobile applications arena because they are charmed by the billion-dollar success of breakout applications like Candy Crush. However, the majority of mobile applications developers are still struggling to maintain fair popularity.
App stores allow users to voice their opinion about the applications in text reviews and rating stars. Predicting the success of a mobile application from user reviews and rating shared in App stores present several limitations [2]. First, the star rating is not informative enough since it represents an average of positive and negative ratings. Second, the reviews are topic independent, so it is hard to categorise opinions by specific topics. To overcome these limitations, we propose to use larger and more structured reviews expressed by users on the Facebook platform.
Facebook has widely inserted itself in the daily life of people of all ages. It is an online social network which collected a huge and rich dataset. Millions of messages, posts and comments are published daily on Facebook pages. These published data describe human social behaviour regarding various domains like art, sport, purchase, games, software and so on. In the case of mobile applications, every popular mobile application on the App store has at least one official Facebook page. Official pages are usually categorised as ‘App Page’ on the Facebook platform. In such pages, users express their interest by posting messages, called posts. Other users may interact by commenting on these posts. These interactions are initiated to bring mobile application users to express their opinions regarding the application usability and its potential new features.
However, users write comments on posts to share their experience with the mobile application. They share opinions on several topics and discuss issues. Users comments can be criticism, admiration, wishes, help request, anger and so on. The content of these comments varies among people, and usually encloses emoticons like ‘☹’ and ‘☺’. In Table 1, we expose typical posts and comments expressing user opinion extracted from Facebook pages of mobile applications.
Samples of Facebook page posts with expressed user opinion.
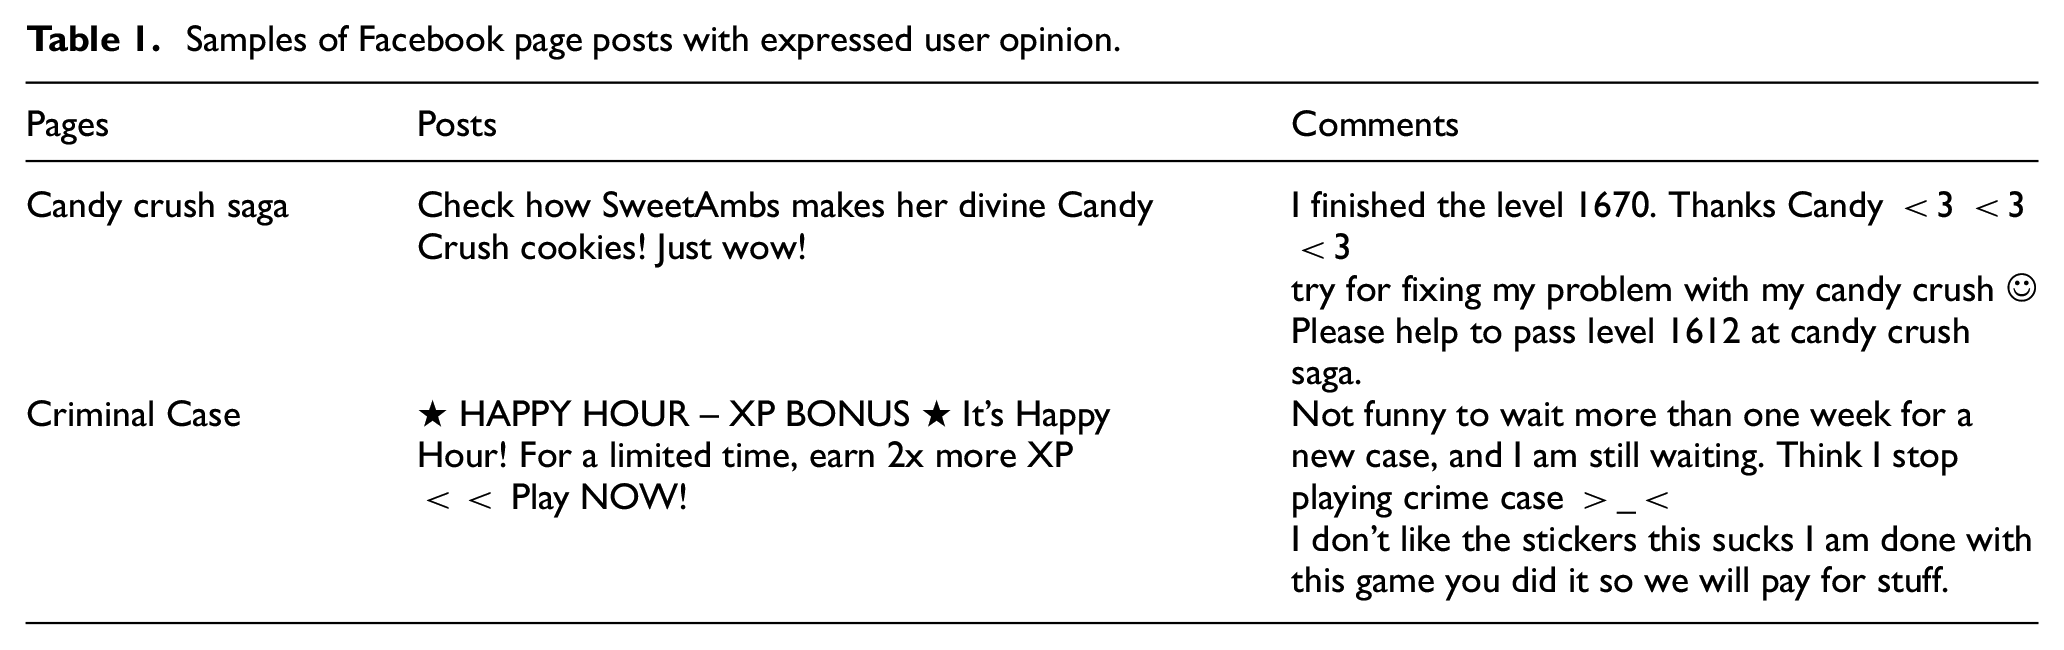
Besides, the Facebook platform provides relevant statistical measures to quantifying users interactions. With these quantitative measures and the qualitative data (users comments), we address the problem of predicting mobile applications success. In particular, it is essential to understand how user interactions can influence the popularity of a mobile application leading to a breakout.
In this work, we define as breakout the fact that a mobile application remains in the Top 50 of popularity ranking 30 consecutive days. Otherwise, we classify the mobile application as a no-breakout application. Notably, an application that remains on the Top 50 for less than 30 consecutive days is called fizzled. Fizzled applications represent an interesting subclass of no-breakout applications since a fizzled application raised the Top 50 but not long enough to achieve a breakout. Figure 1 graphically illustrates the three classes.

Breakout criteria.
In this study, we investigate how we can predict mobile applications breakout form data available on Facebook platform. Our main goal is to build a system that learns from user interactions on Facebook pages to build insights for mobile applications breakout prediction. In this context, we create new statistical features from raw data to improve the prediction power of our system. In our research, we use messages written in the English language because it is the most popular language used on Facebook. However, the proposed model can be applied to other languages with minor changes.
The contributions of this study are as follows. First, it considers user comments from Facebook pages to understand user sentiment, compared with state of the art methods, using user reviews and rating from App stores. Second, we present a method to enrich existing lexicons with terms not contained in the dictionary for better sentiment analysis. Finally, we describe a comprehensive approach of breakout prediction based on data collection, feature engineering, natural language processing and machine learning.
The remainder of this article is organised as follows. Section 2 provides a review of related works focusing on mobile application success prediction and sentiment analysis on online social networks. Section 3 describes the main steps of our methodology of predicting mobile applications breakout. Section 4 reports experimental results. Section 5 discusses the findings and compares our results with literature. Finally, section 6 concludes and presents directions for future work.
2. Related work
Our study aims to explore the feasibility of predicting mobile application breakout based on features extracted from the Facebook platform. Therefore, we first conducted a literature review of mobile application success prediction. Then, we looked into related work on general sentiment analysis and social networks specific research.
2.1. Prediction of mobile application success
Based on user reviews published on the App stores, Guzman and Maalej [2] proposed an automated approach that helps developers filter, aggregate and analyse user reviews. Authors utilise natural language processing techniques to identify fine-grained features in the reviews. Then, they extract the user sentiments of the identified features and give them an overall score across all reviews. Finally, they apply topic modelling techniques to gather fine-grained features into more relevant high-level features. Authors constructed a dataset of 35,000 reviews relating to seven applications from the Apple App Store and Google Play Store. They used this data set to evaluate the proposed approach and obtained a precision of 59% and a recall of 51%. This approach was not able to detect infrequent features. Furthermore, authors presume that the expansion of the dictionary by including jargon common in user reviews could enhance the sentiment analysis performance.
Jiang et al. [3] investigated the quality of mobile applications descriptions from a user perspective. They conducted a user survey on 50 mobile application descriptions to identify the essential attributes to the quality of a description. Authors trained a Support Vector Machine (SVM) with radial kernel on the resultant data and tested on a sample of 100 descriptions, achieving an accuracy of 62%. They also inspected the importance of each feature, finding that the permission, the number of paragraphs and the average number of words are the most three important features.
Tian et al. [4] identified 28 features that might be correlated with mobile applications rating. They used technical features, such as code complexity and API usage, with nontechnical features such as UI complexity and marketing effort. Authors trained a Random Forest classifier on 1492 applications from Google Play to predict whether an app will be high-rated, given the values of the various features. The experimental results show a fair performance with an F-measure of 74% and an area under the curve (AUC) of 81%. The most influential features for predicting high rated apps are the size of the app, the number of images on store page and the target SDK version. Since authors only consider factors extracted from the binary of mobile applications and their pages in the stores, they miss complementary features to build relationships between application characteristics and its popularity.
Sarro et al. [5] proposed a model to predict mobile application rating from its feature and rating information published in the App Store. The proposed model consists of three phases to collect feature claims from descriptions and a fourth phase to predict rating. First, they extract raw data from the app store. Second, they parse raw data to retrieve the available attributes such as price, downloads, ratings and textual descriptions of the application. Third, they apply natural language processing to identify technical information to extract the features from the textual descriptions written in English. In the fourth phase, they apply Case-Based Reasoning to predict application rating. The evaluation of the proposed approach on 11,537 mobile applications indicates a prediction accuracy of 79%. As the remaining challenges, Sarro evoked sentiment analysis of customer text reviews.
2.2. Sentiment analysis
Sentiment analysis has been defined as the computational study of opinions, sentiments and emotions expressed in texts. It is about a statistical linguistic analysis, which is based on natural language processing [6]. The amount of research works on opinion mining, and sentiment analysis is increasing exponentially. However, the majority of research efforts are focused on the Twitter social network. In this section, we briefly present the main techniques used for sentiment analysis and its application to social networks.
2.2.1. Sentiment polarity determination
The template sentiment classification aims to determine the polarity of a sentence. The polarity expresses positive, negative or neutral opinion orientation to the subject expressed in the sentence. Thereby, sentiment classification is also termed as polarity determination which has been performed for product reviews, blogs and so on. Studies carried out under polarity determination are grouped under machine learning based, lexicon based and hybrid approaches [7].
Machine learning–based approach is divided into supervised and unsupervised learning. However, supervised learning is used by most existing techniques for sentiment analysis. Supervised approaches require two sets of annotated data, one dataset for training the classifier and another one for testing its predictions performance.
SVM is the most used technique in sentiment classification. Dang et al. [8] trained SVM on digital camera and multi-domain datasets. They extracted three types of features: domain free, domain dependent and sentiment features. They performed multiple experiments on various combination of features. The results showed that adding the sentiment features can improve Sentiment classification performance significantly.
Zhang et al. [9] used Naïve Bayes (NB) and SVM to classify sentiments for restaurant reviews written in Cantonese. They focused on feature representations to improve classification performance like unigram, unigram_freq, bigram, bigram_freq and trigram. To achieve high accuracy, they used a large number of features, around 1000 features.
Moraes et al. [10] compared SVM and NB with Artificial Neural Network (ANN)-based approach for sentiment classification in a context of unbalanced ratio of positive and negative reviews. Results indicated that SVM is more robust to data imbalance. In term of accuracy, ANN performed slightly better than SVM with larger execution time.
Sheydai et al. [11] proposed a new approach based on association rule mining for text classification. They reduced documents dimensionality by applying feature selection techniques. They used a clustering algorithm to aggregate informative features based on their class labels. The performance of the classification scheme was compared with K-nearest neighbour, NB and SVM classifier. Experimental results showed that the proposed approach outperforms NB and SVM classifiers.
Onan and Korukoğlu [12] used an ensemble approach for feature selection. In a first step, they apply different feature selection methods producing various lists of features. Then, they use a genetic algorithm to aggregate the produced lists to build a more robust and efficient feature subset. The experimental results yield better performance on sentiment classification while using the ensemble approach for feature selection.
Furthermore, these methods need data labelling for each specific domain. However, a classifier trained on data from a specific domain often performs poorly when it performs predictions on sentiment data from a different domain [13]. In addition, a machine learning approach is more suitable for document-level sentiment classification, where the features (words) dimensionality is high. To perform sentiment analysis in social networks, at a sentence level, a sentiment lexicon is needed.
The lexicon-based approach determines the sentiment polarity by applying some functions of opinion words in the sentence (or document). It uses a dictionary to determine sentiment orientation. The dictionary is a collection of opinion words with their sentiment description. Construction of a lexicon may be performed in either a manual or an automatic way. The manual construction is time consuming and requires human resources. Mohammad and Turney [14] used Amazon’s Mechanical Turk 1 crowdsourcing platform to speed up manual lexicon construction. A crowdsourcing platform enables researchers to engage a pool of annotators. Mohammad and Turney [14] annotated more than 10,000 words with sentiment polarity using Mechanical Turk.
Unlike manual construction, the automatic construction needs less time and resources. The main approach is bootstrapping a sentiment lexicon from a set of seed words, and adapting a lexicon from a domain to another. Starting with a small set of seed words, the bootstrapping method is able to produce large lexicons [15,16]. Turney [15] used pointwise mutual information and bootstrapping to construct a sentiment lexicon. He started by creating a set of seed words, that are explicitly negative or positive. Then, he uses these seed words to determine the sentiment polarity of words extracted from a large set product reviews. The idea is based on words cooccurrence. The polarity orientation of a word is estimated by determining if it is cooccurring more positive seed words than negative seed words.
Hu and Liu [17] created manually a small, domain-independent set of seed adjectives tagged with positive or negative labels. They used the bootstrapping approach to grow these seeds using WordNet [18]. They searched WordNet and the seed words for each target adjective word to predict its orientation. They constructed a lexicon containing 2006 positive words and 4783 negative words. A recent study [19] showed that Hu and Liu opinion lexicon obtained the best accuracy with a simple-minded approach of counting positive and negative words, for sentence level sentiment categorization.
There are also some approaches that use both lexicon and machine learning approaches. For example, Ortigosa et al. [20] performed sentiment classification on Facebook comments using a hybrid approach. They used a sentiment lexicon to analyse messages written in Spanish. For experimental evaluation, authors employed Naive Bayes, SVM and decision tree (C4.5) in order to classify 3000 status messages. They classified each message as positive, negative, or neutral. The dataset contains 1000 message of each class. Through this hybrid approach, the reached accuracy was 83.27%.
2.2.2. Sentiment analysis on social networks
In social networks, if someone is linked to following a community or a public figure, it means that the person has a positive or a negative feeling towards the followed entity [7]. Developing tools and techniques for social media sentiment analysis, however, remains a daunting challenge.
Sobkowicz et al. [21] proposed an opinion formation framework based on content analysis of social media and sociophysical system modelling. They used agent technology to capture opinions based on the effects of leadership, dynamic social structure and effects of social distance. Authors recommended application scenarios for political discussion in Poland, governance of Java standard, and BP oil spill emails.
In the same context, Rabelo et al. [22] used link mining and user-centric approach to get sentiment expressed by social network users. The idea behind is to infer users opinions whenever we know the opinion polarity of part of them. The inference model is based on how users connect and interact with each other. Preliminary experiments on a Twitter corpus have shown promising results. They collected 8000 posts containing selected hashtags to get 97,000 nodes and almost one million edges for the graph to apply collective classification algorithm.
Sentiment analysis from social networks is a challenging problem. However, most of the research efforts focused on Twitter [13,20,23–25] even though Facebook is a more popular social media. We assume that the lack of free tools and the complexity of the Facebook platform drive efforts to Twitter.
Kim et al. [26] investigated topic coverage and sentiment dynamics of the first 3 months of Ebola virus outbreak in Twitter and news publications. They analysed contents and sentiments analysis by employing the n-gram topic modelling technique. They used topic-based sentiment scores to facilitate the analysis of the topical and sentimental differences between Twitter and traditional news media. They used a sentiment lexicon to compute the topic sentiment score. Results showed that news articles express sentiment straightforwardly while Twitter reflects many different individual opinions.
Mostafa [27] showed that Twitter can be used as a reliable source for analysing attitudes towards global brands. To conduct the analysis, he used a manual annotated lexicon including around 6800 seed adjectives tagged with positive or negative labels. Mostafa analysed sentiment polarity of more than 3500 social media tweets expressing opinions towards 16 global brands. Results pointed a generally positive consumer sentiment towards several famous brands. In this work, the distribution of computed sentiment scores is presented and discussed. However, the accuracy of the computed polarity is not mentioned. Mostafa used Hu and Liu [17] opinion lexicon to determine sentiment polarity. Since this lexicon contains English words, it was inefficient when dealing with non-English terms.
3. Methodology
3.1. Sentiment analysis on Facebook
Social media natural language processing (including Facebook) poses several challenges like invented terms (loool, mdr, etc.), colloquial expressions and wrong spelling (luve, kute, etc.). In this case, the lexicon-based approach will classify such messages as neutral while a machine learning–based approach should yield to better results. Machine learning requires a labelled training set, which is a time-consuming task.
Moreover, using predefined labelled data is not a good solution. First, because every day there are newly invented terms. Second, the labelling depends on the examined domain.
Our solution consists of constructing an additional lexicon which will overcome the issues of invented terms and familial expressions. Concretely, we can rely on emoticons. A happy emoticon reveals a positive message, while a negative message contains an angry emoticon. Based on emoticons, we become able to process terms that are not contained in the dictionary. For example, the following messages ‘I luvvv this <3’ and ‘Candyyyyyyy ☺’ will infer two new positive terms ‘luvvv’ and ‘Candyyyyyyy’. Here, we notice that writing the name of the application ‘Candy’ as ‘Candyyyyyyy’ expresses a positive sentiment. However, using a spell checker infers the name of the mobile application that can be judged neutral. We illustrate the main methodology of constructing additional lexicon in Figure 2.

Main methodology of constructing additional lexicon.
As shown in Figure 2, the first step consists in extracting messages (comments) containing emoticons from a set of Facebook pages. The second step is concerned about classifying messages into two classes positive and negative regarding emoticons polarity. In order to avoid ambiguity, we ignore comments containing both positive and negative emotions. Afterwards, we pre-process the two resulted lists by deleting stop words (the, this, of, for, etc.) and punctuation. If a term exists in the two lists, we compare its occurrence count to decide about its polarity. When a term is more frequent in the negative class than in the positive class, we identify it as negative.
At the end of this process, we obtain an additional lexicon containing new terms. We merge this new lexicon with a general opinion lexicon. In this work, we used the Hu and Liu [17] general opinion lexicon as recommended by Khoo and Johnkhan [19].
Besides users comments, Facebook provides several statistical measures such as page total likes, comment likes, comment shares and comments count by post. Considering these metrics may reinforce the insights derived from sentiment polarity analysis. More precisely, a post which has positive comments should have a high count of likes and shares. The share and like counts serve as a meter for the sentiment polarity. A post with positive comments is positive. However, with a high number of shares and likes, it is judged very positive. So, we distinguish between positive and very positive, respectively, negative and very negative, based on the number of shares and likes. The number of shares and the number of likes metrics represent explicit opinions. By liking or sharing a post, users explicitly state that they agree with the expressed opinion. Contrariwise, if a post has a low number of shares and counts, the sentiment it expresses is weak. In this work, we embed these metrics in the proposed model as a sentiment bias.
3.2. Proposed approach
Our approach to breakout prediction consists of three phases shown in Figure 3. First, data collection is performed on a ranking website to identify the top-ranked mobile applications. Then, we gather posts and comments published on the mobile applications official pages using the Facebook graph API. In the next step, we extract and process relevant features to meet our characterisation goals. By this means, we obtain features that are more effective for breakout prediction. Based on the most relevant features, we produce the breakout dataset. Finally, we train and evaluate different classification algorithms on this dataset to find the best breakout prediction model.

A three phases breakout prediction approach.
3.3. Data collection process
We gathered data in two steps. The first step consisted of crawling a ranking website (apptrace.com) in the period from 2 March 2015 to 1 March 2016. The wrote the crawler in python based on the scrapy framework [28]. The resulted data are a daily ranking of 200 mobile applications for a whole year. Based on the breakout criteria, an application should be on the Top 50 for 30 consecutive days; we labelled each application as breakout or no-breakout.
In the second step, we focus on the anonymised activity and opinions data of the users of each mobile application. For each mobile application gathered in the first step, we extracted the identifier of its official Facebook page using Facebook graph API. Mastering a list of Facebook page identifiers, we extracted global measures and the identifiers of the different posts. Finally, for each post identifier, we extracted users reviews, engagement indicators (likes, shares and comments count) and relative information like time of comment publishing and time of post creation. All the extracted data are stored in a MongoDB instance in JSON format for further processing.
A cleaning process was necessary to remove duplicates and entries with missing attributes. Furthermore, we did not consider de facto mobile applications such as default installed, mailing and social mobile applications. It is obvious that they will be ranked at the top of the popularity list.
In total, we identified 1768 mobile applications that entered the Top 200 from 2 March 2015 to 1 March 2016. However, only 13.4% (237) of these applications entered at least once in the Top 50 ranking. To minimise data noise and the unbalance between breakout and no-breakout classes, we consider from the no-breakout class only fizzled applications. We ignored all other applications that did not enter the Top 50. We also filtered de facto applications like Google applications and Facebook Messenger. Finally, we obtained 199 mobile applications: 32 are labelled as breakout, and 167 are labelled as no-breakout. From the official Facebook API, we were able to capture 31,015 posts and 1,882,136 comments. As the study focused on the English language, in subsequent analyses, we discarded all non-English posts and comments. The average number of words used in the comments is 9, and the maximum number of words goes up to 2033.
3.4. Feature engineering
Predictive features are considered as one of the major elements affecting the performance of supervised learning. Feature engineering attempts to create new predictive features from raw data that enhance the predictive power of machine learning algorithms [29]. Feature engineering is an informal topic, but it is considered essential in applied machine learning [28]. In quest of good features, feature engineering involves two processes. First, we need to understand the properties of the problem and how they might interact with the strengths and the limitations of the learning algorithm we are using. Second, experimentally evaluate the relevance of the newly created features [29].
The global statistical measures provided by the Facebook platform are not sufficient to achieve good prediction performance. These measures are likes count and talking about count. The talking about count is a more meaningful measure because it counts the number of users who are engaged and interacting with that Facebook page. Engagement and interaction comprise page like, page share, post like, post commenting, question answering, event reply and photo tagging. These two global measures are complementary to give us information about popularity and the persistence of popularity.
To characterise a Facebook page, we start by characterising each post it contains. We design a set of features to score users sentiment of each post. Then, we compose posts scores with the global statistical measures to form our mobile applications breakout dataset.
3.4.1. Post features
Analysing posts reviews and engagement indicators is crucial to evaluate a Facebook page popularity evolution and persistence. To characterise a Facebook page, we start by characterising each post it contains.
For this aim, we derive five features as follows:
Sentiment: it represents the opinions expressed by users on the post. When a post receives comments with opposite opinions, we consider the majority opinion. We identify the opinion polarity via a statistical linguistic analysis. This analysis uses the enriched opinion lexicon introduced in section 3. We identify each comment as positive, negative or neutral.
Shares count: it reflects the strength of the user’s interest in the post. It also reflects addictiveness towards the mobile application. To identify the polarity of this feature, we compare its value to the shares count quadratic average of the whole posts published in a single page.
Life cycle: it measures how much the post persists and remains popular by knowing how long the content can drive user attention and engagement. We calculate the life cycle as follows

The life cycle values are comprised between 0 and 1. We judge the polarity positive, if the value is greater than 0.5.
Comments count: it measures how much users interacted with this post. A high number of comments shows that the sentiment is strong. This feature helps to distinguish between positive (or negative) and very positive (or very negative) sentiments. We identify the polarity of this feature by comparing its value to the comments count quadratic average of the posts belonging to the same page.
Likes count: it represents the number of users that liked the post. Likes count is informative because many users do not express their opinions by commenting on the post. They just hit the like icon to show that they agree with the post opinion. As we realise that there are robots designed to make likes on Facebook posts, we assign to this feature the lowest weight. To identify the polarity of this feature, we compare its value to the likes count quadratic average of the whole posts published in a single page.
As discussed above, we designed five features to characterise each post. Each feature can be valued as 1 or −1 to express its polarity. However, we recall that the main objective is to characterise the page containing all these posts. Hence, we consolidate all these features to score the post by a value expressing its weighted sentiment polarity distributed in the interval [−1, 1].
For this aim, we propose a method which attributes a score to each post based on a weighted combination of its features. The most important feature sentiment has 24 as weight while the least important one likes count has 20. The shares count, life cycle and comments count features have, respectively, 23, 22 and 21 as weights. Formally, we calculate the sentiment score as follows

By applying formula (2), a post score falls in the interval [−1, 1]. The polarity of a post is identified as very negative, negative, neutral, positive or very positive if the score is, respectively, in the interval [−1, −0.5[, [−0.5, 0[, {0}, ]0, 0.5] or ]−0.5, 1]. Since neutral sentiments are not informative, we do not consider this class as a feature in our dataset design.
3.4.2. Page features
Now with all posts scored, we can characterise the mobile applications pages. Let assume that a page P contains N posts. By applying our scoring strategy, each post falls in one of the five classes: very negative, negative, neutral, positive and very positive. The number of posts N is not the same for the various pages. Thus, standardisation is required. For each page P, we divide the number of posts belonging to a class C by N the total number of posts. We obtain percentages of posts belonging to each class rather than raw numbers.
In summary, we characterise each Facebook page by the six following features:
Likes: the number of total likes of the page.
Talking about: the number of people talking about the page count.
VNeg: the percentage of very negative posts.
Neg: the percentage of negative posts.
Pos: the percentage of positive posts.
VPos: the percentage of very positive posts.
3.5. Learning phase
To find the best breakout classification model, we train a set of classification algorithms on our dataset. We evaluate their prediction performances to pick up the best model. We use the Nearest Neighbours, Radial Basis Function kernel Support Vector Machines (RBF SVMs), Decision Tree, Random Forest, ANN, AdaBoost, Naive Bayes and Logistic Regression classification algorithms [30] to perform our breakout analysis. We use 10-fold cross-validation to improve generalisation and avoid overfitting.
We compare the performance of the classification models based on predicted classes (accuracy and F-measure) and predicted probabilities (AUC). Accuracy is the percentage of samples that model predicted correct class for them. F-measure is the harmonic means between precision and recall. It combines both of them into a single number, which is useful for ranking or comparing methods [31]. The AUC is an adequate performance measure in case of scoring classification models. It does not rely on the cut-off values of the posterior probabilities. The values of the AUC range from 0.5 to 1. An AUC of 0.5 means that the model is not able to do better than a random selection, while a value of 1 indicates a perfect prediction [31].
4. Experimental evaluation
In this section, we first try to prove the relevance of the designed features. Second, we compare the performance of several supervised classification algorithms to select the best one. From the best algorithm, we derive our prediction model and evaluate its performance. In our experiments, we used machine learning algorithms from scikit-learn package [32].
4.1. Features quality
In polarity detection, there can be a coarse-grained (positive and negative) or a fine-grained (very negative, negative, neutral, positive and very positive) set of polarity classes. In this work, we choose the fine-grained polarity because it reflects the intensity of the sentiment.
To confirm the relevance of the designed and selected features, we trained decision tree model on four different datasets. The first dataset DS1 contains the whole features, where the three other datasets contain a different features subset, as detailed in Table 2. The second dataset uses a coarse-grained polarity: one negative class (VNeg + Neg) and one positive class (Pos + VPos). In the third dataset, we deleted the talking about feature. Moreover, in the last dataset, we deleted the feature Likes.
Constructed datasets.

The empirical results reported in Table 3 show that the dataset DS1 yields the best accuracy, F-measure and AUC. The coarse-grained polarity, used in DS2, decreases the prediction performance which argues in favour of coarse-grained polarity. We also note that removing the feature Talking about (DS3) decreases the prediction performance slightly. Also, the lowest performance is achieved in the absence of the feature Likes (DS4). We conclude that Likes is a more important feature than Talking about. Furthermore, both of them affect the prediction performance.
Comparison of results obtained on the different datasets.

AUC: area under the curve. Bold values in the table shows best performances.
Whereas the experiments show that DS1 yields to the best classification performance, in the rest of the experimental study we keep using the six features composing the data set DS1.
4.2. Learning quality
Before starting the learning step, we need to fix a critical issue in our dataset: class imbalance. The no-breakout class has much more examples (167) than the breakout class (32).
In our work, what we are interested in is the minority class (breakout) other than the majority class (no-breakout). Existing classification algorithms do not take into consideration the distribution of the data sets. They are not able to produce fair predictions for the minority class. We address this class imbalance issue; we use the borderline-SMOTE1 (borderline synthetic minority oversampling technique) method [33]. This method balances the distribution of the dataset by increasing the number of examples in the minority class (breakout class in our case). Since our dataset balanced, we perform the learning phase with confidence to obtain a model that fairly fits our data.
Table 4 reports accuracy, F-measure and AUC of each classification algorithm. It shows that Random Forest achieves the best performance followed by AdaBoost, Decision Tree algorithms and Nearest Neighbours, while RBF SVM and ANNs perform poorly. As we can see, Random Forest performs slightly higher than AdaBoost. However, the difference is significant compared with the other algorithms. It is expected that ensemble methods (Random Forest and AdaBoost) perform better than single classifiers.
Performance comparison of various classification algorithms.
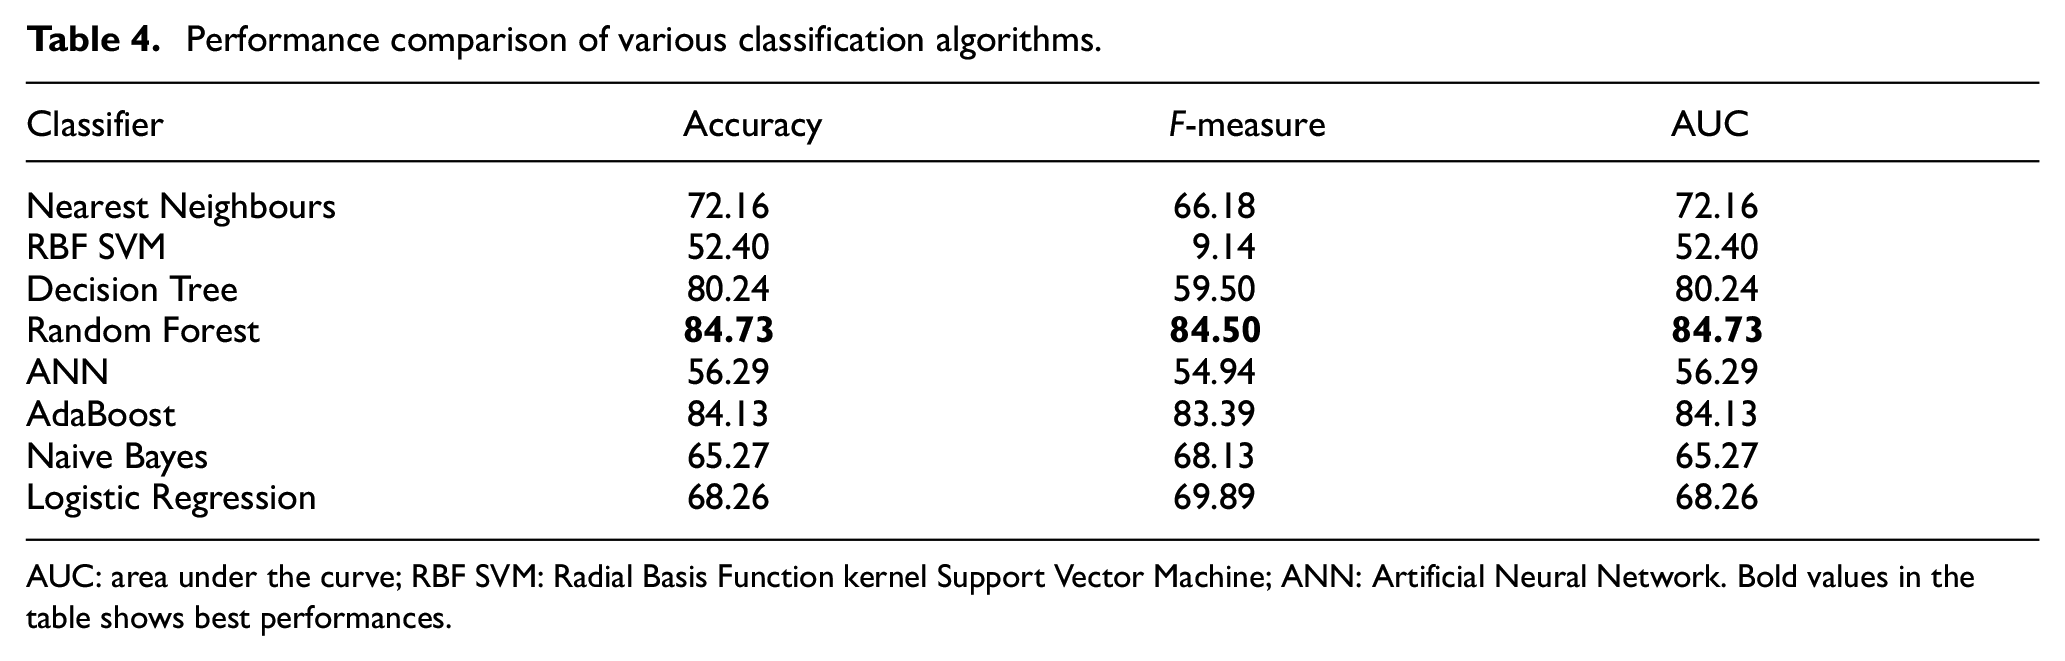
AUC: area under the curve; RBF SVM: Radial Basis Function kernel Support Vector Machine; ANN: Artificial Neural Network. Bold values in the table shows best performances.
To better understand classifiers performance, we examine how classifiers label test data. In Table 5, we list True Positive (TP) and True Negative (TN) rates generated by each classifier. In our case, TPs represent the number of examples correctly labelled as a breakout. Moreover, TNs represent the number of examples correctly labelled as no-breakout. We obtain the rates by dividing the number of labelled examples during the test phase. From Table 5, we can observe that RBF SVM perfectly predicts the breakout class (100% TP), while it poorly predicts the no-breakout class (4.79% TN).
True Positive and True Negative rates of different classifiers.

TP: True Positive; TN: True Negative; RBF SVM: Radial Basis Function kernel Support Vector Machine. Bold values in the table shows best performances.
As the final dataset contains 334 examples, we can conclude that RBF SVM classified 0.97% of test samples as breakout class. This lack of distinction between the two classes explains why its performance is very low. Hence, a good classifier should do well for both classes. As Table 4 shows, Random Forest is the best classifier followed by AdaBoost. However, in Table 5, we see that AdaBoost performs better than Random Forest in predicting breakout class with respective TP rates 88.62% and 86.23%. In the same time, Random Forest performs better with no-breakout class 83.23% versus 79.64% as respective TN rates. Finally, we cannot argue that one of these two algorithms performs better than the other.
Upon visual inspection, we plot in the same graphics the receiver operating characteristic (ROC) curve of each classifier, as illustrated in Figure 4. We can observe that Random Forest is slightly better than AdaBoost with respective AUC 0.85 and 0.84. Decision Tree is following in the third place with 0.80 AUC. From Figure 4, we observe that the curve of Random Forest classifier is closer than other classifiers to the upper-left corner of the ROC space. So, we conclude that Random Forest classifier has the best trade-off between sensitivity (TP rate) and specificity (1 – False positive rate). It shows the best performance to correctly predict the breakout class with minimal false alarms (False Positives).

ROC curve comparing the performances of the different classifiers.
After that, we use the Random Forest classifier for further predictions. It showed the best classification performance as argued above.
4.3. Prediction quality
Since we identified Random Forest as the best classifier, we split the dataset into 2/3 training data and 1/3 test data. Our classifier achieved an accuracy of 83.78%, an F-measure of 83.64% and an AUC of 83.80. The TP rate is 85.45%, and the TN rate is 82.14%. These performances are slightly lower than those achieved with the 10-fold training, as reported in Tables 4 and 5.
Now, we focus on the 17.86% false negatives to understand why our model is not able to classify them correctly. These applications are misclassified as no-breakout, while they achieved breakouts. For example, in the case of the ‘Buddyman’ mobile application, 100% of the expressed sentiments as very negative. We naturally think that this application will be at the bottom of the ranking. However, it was able to stay more than 30 consecutive days in the Top 50. Most of the words are synonyms of ‘Explode, destroy, fire, shoot and freeze’. Our model was right since the comments contain this kind of words, all the posts are judged very negative. However, the context is different: ‘Buddyman’ is an aggressive game. Now everything seems clear, the posts we judge very negative are very positive in this context.
‘Color Switch’ is another interesting false negative case. It performs a breakout with 12.5%, 25.0%, 8.33% and 54.16% of, respectively, very positive, positive, negative and very negative posts and only 356 Talking about. Exploring deeper, we found that this game is Top 2 in Senegal with 124 posts and 1097 comments. In total, 70% of the comments contain only names of the users. As a comment containing a name is judged neutral, in this case, it should be perceived as very positive. Here, the community is not very active, only 1097 comments, and interacts unusually by writing their names. Such a case is not common, and we consider it as an outlier.
For the false positive cases, a high Likes count (of the page) forces the classifier to classify the applications as a breakout. For example, ‘Pandora’ application has 6,869,928 Likes, 29,603 Talking about and 3.55%, 16.57%, 7.1 % and 72.78% of, respectively, very positive, positive, negative and very negative posts. In this case, despite the high level of very negative posts, the count of Likes remains very high. For more comprehension of this distortion phenomena, in Figure 5, we draw the feature importance plot in Random Forest classification.
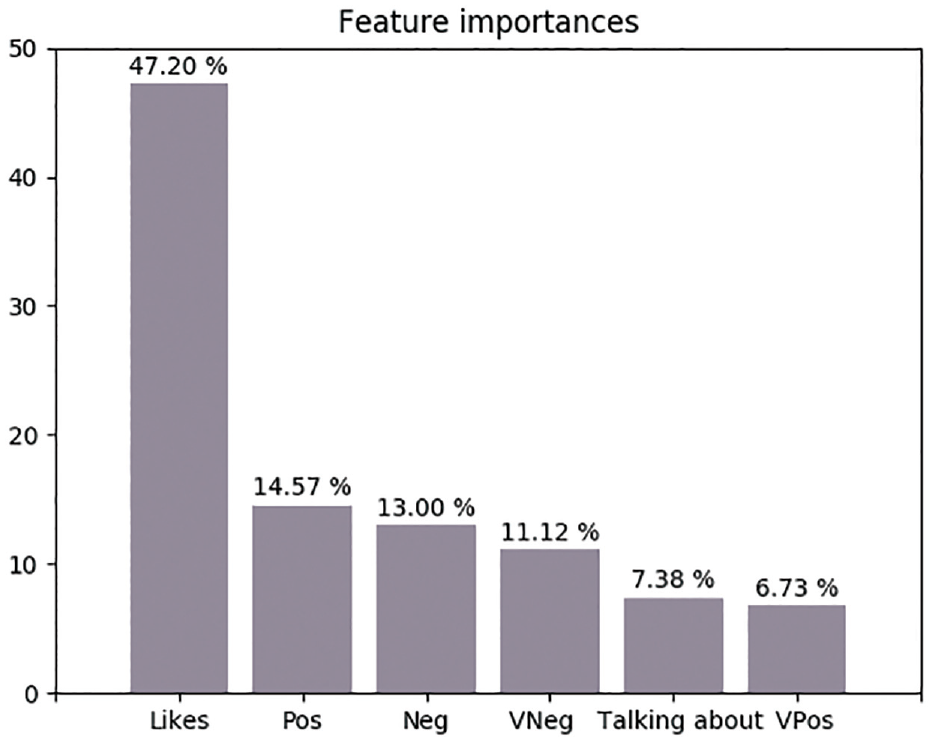
Feature importance in Random Forest classification.
In the plot of Figure 5, we observe that the Likes feature is the most important feature. The Likes feature is more important than the rest of the features with more than three orders of magnitude. Therefore, when the value of the Likes feature is distinctly higher than its median value, it overwhelms all other features. The Likes feature is the most important feature that influences our random forest model.
Sentiment features are more influential than the Talking about feature. The positive (POS) feature is more important than negative (NEG) and very negative (VNEG) features. However, negative sentiment features (NEG and VNEG) with an importance of 24.12% are more influential than positive sentiment features (POS and VPOS) with 21.30% of importance. These results suggest that negative sentiments influence mobile applications breakout more than positive sentiments.
5. Discussion
Our findings provide evidence to suggest that the combination of Facebook statistical features and sentiment polarity analysis via natural language processing introduced in this article allows us to predict mobile applications breakout accurately. Our sentiment scoring system is based on statistical features related to user interactions on each post during the time. To overcome the issues of analysing sentiment polarity of invented terms, familial expressions and non-English terms, we constructed an additional lexicon.
Research studies of the same area obtained similar results with different application domains. Ortigosa et al. [16] extracted from Facebook comments written in Spanish by students. Following a hybrid approach, they obtained 83.27% of accuracy. Investing sentiment dynamics of Ebola virus outbreak in Twitter and news publications, Kim et al. [26] showed that Twitter reflects many different individual opinions. Kim et al. focused on comparing sentiment dynamics on Twitter and news. They did not address the possibility of predicting future sentiments. Based on the Hu and Liu [17] opinion lexicon, Mostafa [27] analysed consumer brand sentiments on tweets. Regarding the computed sentiment scores, statistical results are presented, but no predictive analytics are conducted. This work faced a limitation when dealing with terms not included in the lexicon.
Even if there no works, in our knowledge, that address directly the predictability of mobile applications breakout, there are some efforts that consider the predictability of application success. Previous study aimed to extract features that influence high rating of mobile applications [2–5]. Features have been extracted from application descriptions [2,3], application size [2,4], API usage [4], requirements list [5], categories [5], permissions [3] and user reviews [2,5]. In all previous study, authors provide evidence of the correlation between the extracted features and application rating. Our findings agree of those in Guzman and Maalej [2] and Sarro et al. [5]; user reviews are relevant to applications success. In Guzman and Maalej [2] and Sarro et al. [5], authors extract user reviews from the app store, while our approach extracts user comments from the Facebook platform. Moreover, instead of using the star rating, our approach utilises the Likes and Talking about counts.
Guzman and Maalej [2] extract the user sentiments and give them a score across all reviews. They obtain a precision of 59% and a recall of 51%. Sarro et al. [5] apply natural language processing to extract features. They achieve a prediction accuracy of 79% and AUC of 81%. In our approach, we apply sentiment analysis of user reviews as evoked by Sarro et al. [5]. We also enhance the sentiment analysis performance by extending the sentiment lexicon as presumed by Guzman and Maalej [2]. Finally, we obtain better prediction performance with an accuracy of 84.73% and AUC of 83.80.
Compared with previous work, the most important feature that we find (Likes count) is never mentioned in previous studies. Furthermore, experiments show that the sentiment polarity of a user comment (review) actively impacts mobile applications success that leads to breakout.
We think that our prediction model performed well with an accuracy of 84.73%. We observed that misclassified applications are very specific cases with non-common contexts. The performed prediction accuracy demonstrates that the interactions performed by users on Facebook can be used to provide insights for predicting mobile applications breakout.
6. Conclusion
In this article, we proposed a method for automatic extraction and analysis of users interactions to produce useful insights to predict of mobile application breakout. Our method makes predictions through three steps. First, it collects web data to identify top-ranked mobile applications. Second, it gathers relative data from the Facebook graph API, then extracts relevant features to build a sentiment-based dataset. Third, different classification algorithms are trained and evaluated on this dataset to find the best breakout prediction model.
Predictions based on our model show a clear way of predicting mobile applications breakout based on user sentiment analysis. We observed that the Likes count on a Facebook page is decisive for climbing mobile applications ranking. However, a high rate of negative opinions declines application ranking and deprives the mobile application of standing in the Top 50.
After analysing misclassified applications, we noticed that sentiment identifying sentiment polarity is sensible to the mobile application context. When the application is an aggressive game, negative words express positive sentiment. We propose as future work, to use a context feature during the sentiment polarity identification phase. This feature will invert the sentiment polarity in case of aggressive games and similar applications.
There are also many fruitful avenues for future work. In particular, there is a significant opportunity to include other languages. As we noted, mobile applications ranking differs from a country to another. Moreover, it would be worthwhile to enlarge the dataset by extracting more data. A larger dataset will reduce data skewness and improve prediction performances.
Footnotes
Declaration of conflicting interests
The author(s) declared no potential conflicts of interest with respect to the research, authorship and/or publication of this article.
Funding
The author(s) received no financial support for the research, authorship and/or publication of this article.
