
Abstract
There are various models, methodologies and algorithms that can be used today for document classification, information retrieval and other text mining applications and systems. One of them is the vector space–based models, where distance metrics or similarity measures lie at the core of such models. Vector space–based model is one of the fast and simple alternatives for the processing of textual data; however, its accuracy, precision and reliability still need significant improvements. In this study, a new similarity measure is proposed, which can be effectively used for vector space models and related algorithms such as k-nearest neighbours (k-NN) and Rocchio as well as some clustering algorithms such as K-means. The proposed similarity measure is tested with some universal benchmark data sets in Turkish and English, and the results are compared with some other standard metrics such as Euclidean distance, Manhattan distance, Chebyshev distance, Canberra distance, Bray–Curtis dissimilarity, Pearson correlation coefficient and Cosine similarity. Some successful and promising results have been obtained, which show that this proposed similarity measure could be alternatively used within all suitable algorithms and models for information retrieval, document clustering and text classification.
1. Introduction
Text classification or document categorization is one of the main research and application areas in text mining and information retrieval today. Text classification can simply be defined as the task of assigning pre-defined categories or classes to texts based on the contents of the documents [1]. The significant increase in the amount and usage of digital text data, such as electronic news articles, digital libraries and blogs, has enabled text classification to become a key player in text-based knowledge applications and management information systems. Document classification problems can be solved by applying supervised learning algorithms to train classification models with a collection of previous examples.
Some important issues make text classification different from classification approaches in data mining. One of them is the raw textual data that are much more unstructured than the data used in classical data mining. This aspect causes some additional data pre-processing phases for text mining and document classification, such as tokenization, stemming, stop word elimination, lemmatization and some other computational linguistics methodologies [2,3]. Second, in most cases, the number of documents or instances and the number of features are significantly higher in text mining applications when compared with ordinary data mining cases. This brings about two new necessities such as one of them is the need for very high data storage and fast computational capacities and the other is the extreme importance and effect of feature reduction or selection [4]. It should also be noted that most of the data sets in text mining have a sparsity problem because of the nature of textual data [2,3].
Accurate prediction of new test documents and assigning them to the correct classes or queries is one of the primary aims in information retrieval. There are different machine learning algorithms and models that are used in document classification, information retrieval and other text mining applications and systems. One of the oldest machine learning approaches for information retrieval and text classification, which is still in use today, is Naïve Bayes classifier [5]. However, if there are more than two categories or classes, then different versions of Naïve Bayes are implemented and used more effectively. Multinomial Naïve Bayes algorithm is one of such approaches [2,6]. There are also some other approaches that are based on Naïve Bayes and its adaptation to text categorization problems, such as complement Naïve Bayes [7] and negation Naïve Bayes [8].
Some kernel-based functions that are used in machine learning are also implemented for document classification. Some different studies have implemented and used support vector machine (SVM) for text classification [9,10]. Some other models have been adapted and used for document classification such as artificial neural networks and clustering. For instance, learning vector quantization (LVQ), which is a type of simple neural network, is used for text classification [11]. Hierarchical perceptrons, which are based on a hierarchical array of artificial neural networks, are designed and implemented for text categorization [12,13]. It should be noted that hierarchical topic classification or text categorization is one of the most challenging areas in document classification. This is due to the fact that the document is multi-labelled with different categories in a hierarchical manner. Also, the goal is to classify each document correctly for all different categories and sub-categories that it belongs to. Adaptation of clustering methodology for text classification can be considered as another unique approach [14]. Some recent studies implement word embeddings and deep learning models to classify documents such as user tweets [15].
Another type of algorithm that is implemented for document classification and information retrieval systems (including recommender systems as well), is k-nearest neighbours (k-NN), which is an instance-based learner that uses the vector representations of documents and tries to classify the documents using some similarity measures [16]. Rocchio classifier is another instance-based learning algorithm that uses centroids and vector space models with similarity measures [17].
Holzinger et al. [18] have made a detailed research and literature survey in biomedical text mining and text classification, where they have elaborated on some open problems and future challenges. They stated one of the open problems and future challenges to be the improvement of similarity metrics that are used in vector space models of biomedical text mining and other types of document categorization [18]. The primary aim of this study is to propose a new similarity measure, which improves the classification performance and accuracy of classifiers based on vector space models that are used in text categorization and information retrieval. This study proposes a novel similarity measure that can be easily implemented and used for text classification, which also provides some promising results that improve the relevant algorithms’ performance in terms of classification accuracy. It should be noted that there are various text classification algorithms, but if the similarities between different texts/documents/records are to be analysed using each feature’s value using vector values in a hyper-space, then k-NN and Rocchio algorithms are mostly used. Hence, these two algorithms with relevant similarity measures were used and comparatively analysed with this novel method in the experiments.
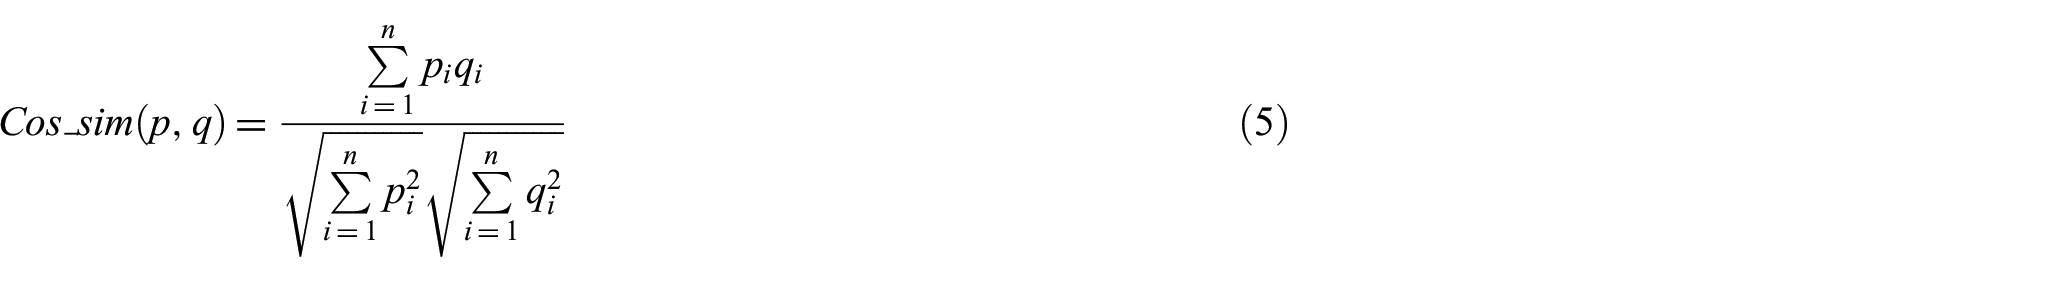
There are various similarity measures and distance metrics that are used in text classification, document clustering and information retrieval where the most popular ones are given shortly in this section. Cosine similarity is one of these, which measures the cosine angle between two documents’ vector values that gives the similarity between two documents [2,3]. If the two documents are exactly the same, then their Cosine similarity value will be 1, and if they are different, the similarity value will be less than 1 and closer to −1 [2,3]. Cosine similarity is used in text mining when the data are suitable for vector representation and when data are asymmetric, it has the advantage of being independent of the length of the documents, and it is also easy to implement [17,19]. However, if most of the attributes of both documents are zero or most of the term values in the document are unknown, then Cosine similarity might be less accurate and biased [19].
Another common measure used in text mining is Euclidean distance, which measures the distance between two documents in any dimension of space and it can be any value ranging from 0 to plus infinity [17]. When two documents are more similar, then their Euclidean distance will be closer to 0. When the data are dense or continuous, Euclidean distance is observed to be highly efficient. However, when the data are sparse with very high dimensions, Euclidean distance is usually observed to be less accurate [20]. Manhattan distance is another similarity/dissimilarity measure that can also be used in text mining and it is very similar to Euclidean distance. Manhattan distance calculates the absolute differences between the coordinates of a pair of data objects or documents [21]. Manhattan distance is known to be more robust than Euclidean distance with high-dimensional data, and it requires less computation time than Euclidean distance [21]. However, Manhattan distance is observed to be inaccurate in most of the text classification problems with sparse data, and it depends upon the rotation of the coordinate system, which makes it disadvantageous for document clustering problems [21]. Chebyshev distance calculates the maximum of the absolute differences between the features of a pair of data points and it is sometimes used in text mining [21]. It is one of the measures that require the least amount of time; however, it is usually observed to be inaccurate in most of the text classification problems with high dimensions or sparse data.
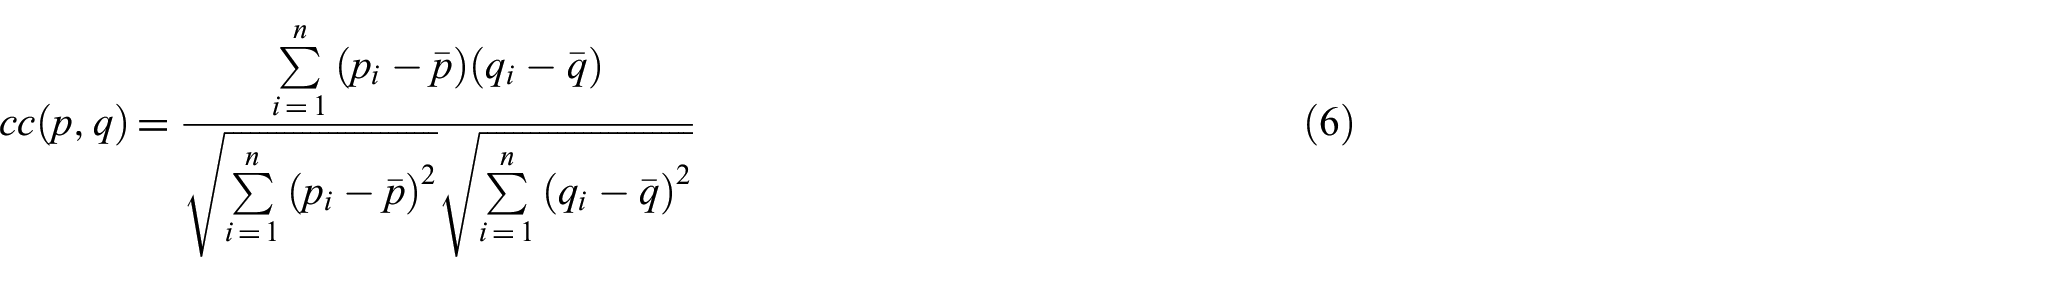
Pearson correlation coefficient (Pearson cc) measures the strength and the direction of the linear relationship between two variables, which can also be used as a similarity measure between two documents. Pearson cc can get any value between −1 and +1, where −1 suggests a strong inverse relation, 0 suggests no relation and +1 suggests a strong linear relation [3,19]. This measure is also used in text classification, document clustering and information retrieval systems and it is invariant to both scaling and translation of the coordinate system [21]. However, when the term values of the two documents are not linearly related or the data are highly sparse, Pearson cc can be sometimes inaccurate.
Jaccard coefficient can also be implemented and used in text mining problems as a similarity/dissimilarity measure. Jaccard coefficient is based on the presence or absence of terms in documents and it is calculated by dividing the total number of common terms between two documents by the entire number of terms that exist in at least one of the two documents [22]. The degree of similarity in Jaccard coefficient is between 0 and 1, where 0 suggests that the two documents are entirely dissimilar and 1 suggests that they are exactly similar. However, this property might mislead or cause less accurate results in most of the text mining applications, because the Jaccard coefficient does not use term frequencies among documents [19]. Hence, it is mostly preferred in market basket analysis rather than text mining problems.
Kullback–Leibler divergence (KL divergence) is a measure of relative entropy; however, it is also implemented and used as a similarity measure for document clustering [2]. The similarity of two documents is measured as the distance between the two corresponding probability distributions, where each document is considered as a probability distribution of the terms in that document [2]. Unlike most of the similarity measures and distance metrics, KL divergence is asymmetric; thus, KL divergence from document a to document b can be different from KL divergence from document b to document a. In order to improve efficiency and to make it suitable for the document clustering problems, KL divergence has been converted into a symmetric measure, which is named as averaged KL divergence [22].
Canberra distance measures the sum of absolute fractional differences between the features of a pair of data points in vector space [21]. Canberra distance can also be used in text mining as a similarity measure where it is sensitive to a small change when both coordinates are near to zero. Canberra distance might provide accurate results in some text mining problems; however, it might also be inaccurate sometimes. Bray–Curtis distance or dissimilarity can also be used as an alternative similarity measure in text mining [21]. Bray–Curtis dissimilarity of two documents can be obtained by computing the absolute differences divided by the summation and its values can be between 0 and 1, where a Bray–Curtis dissimilarity equivalent to 0 suggests that two documents are the same, and Bray–Curtis dissimilarity equivalent to 1 suggests that two documents are entirely different. The main drawback of this measure is that it is undefined if both data points are near zero values [21].
There are some other similarity measures that rank the similarity of documents according to different computational approaches. Best matching 25 (BM25) is one of these different approaches where it is based on a probabilistic retrieval framework to estimate the relevance of documents for a query [2]. BM25 is mostly used in information retrieval systems and search engines, which is a probabilistic model based on the query terms appearing in each document, while not introducing too many additional parameters into the model [2].
2. Materials and methods
As it was mentioned previously, a new similarity measure is proposed, implemented and used among different data sets that are derived from Turkish and English texts. The proposed similarity measure can be used as an alternative metric in text mining and document classification where the attribute values are composed of non-negative numerical values that were derived from raw term frequencies, ‘term frequency × inverse document frequency’ (tf–idf) and other statistical measures of words in the documents. This novel similarity measure is elaborated in the following sections, and the relevant methodologies, algorithms, experimental settings, performance evaluation metrics and materials are also elaborated.
2.1. Vector space models in text classification
The basic similarity measures and the relevant classification algorithms based on ‘vector space models’ [23,24] are explained in this section. k-NN is one of the well-known algorithms that is also used as a vector space model for text classification and recommender systems [25]. It is an instance-based machine learning algorithm where ‘a set of labelled training examples is used to predict the new example’s label within the range of its nearest k neighbour(s) that are identified using a similarity or distance measure’ [26]. This machine learning algorithm can be used for regression, binary or multi-classification problems.
It is known that if k-NN is to be used for text categorization or document classification, Cosine similarity, Euclidean distance and Pearson cc are some common term–based similarity measures [16,17,19,20,25,27]. It is usually recommended not only to use the closest single neighbour (k = 1) but also it might be experimented and observed for k = 2, 3 and so on.
Rocchio [28] classifier is another instance-based learning algorithm that is mostly used for document classification. Although this algorithm was originally designed for information retrieval systems, it was converted to a text classifier algorithm later on. Rocchio algorithm for classification can be simply described as ‘a centroid-based classifier that calculates representative vectors of each class to define the class boundaries, where the representative vectors (centroids) are given by the average vector of the training documents assigned to the represented class’ [17]. Since the similarity measures in Rocchio algorithm are mostly preferred as Euclidean distance and Cosine similarity, these two were also used and comparatively analysed with the proposed similarity measure. The centroid of each class is calculated according to equation (1). A new document or record will be assigned to the closest centroid’s class, where the closeness is measured by either Euclidean distance or Cosine similarity.
The centroid of class c is calculated as follows

where
The distance metrics and similarity measures are used to calculate the similarity or dissimilarity between records in vector space–based classification algorithms. Euclidean distance, Cosine similarity, Pearson cc, Manhattan distance and Canberra distance are some of the most well-known metrics [22], which were also used in the experiments in this study for comparative analysis. It should be noted that the coordinates of vectors are the records, instances or documents and consequently, vector elements or values are the values of the features or attributes of that instance, which constitute the relevant vector space.
2.2. Proposed similarity measure
The novel similarity measure proposed in this study is defined in equation (3). The dissimilarity coefficient between the two instances is calculated first, which is given in equation (2), and then the similarity value is obtained. The similarity scores that can be obtained by this new method can be of any continuous value between zero and one. If the similarity is 1, this shows that both records are identical, which is also true for Cosine similarity and Pearson cc. However, according to the new similarity measure, if and only if all attributes are non-zero and identical, the similarity is 1. This is an important aspect that provides more accurate and robust similarity measurements in text classification and other text mining applications. However, in all the other standard metrics, even if some attributes are both zero and the other attributes’ values are identical, then similarity will be calculated as 1. The proposed measure also decreases the similarity score whenever there are 0 values in both records’ same attributes; hence, the more 0’s in both records’ corresponding features, the less the similarity score is. However, for the most dissimilar vector or records, this method produces a very small value close to zero. If both records’ all attributes are equal to zero, then this new method does not make any calculation and directly sets the similarity between those two instances as zero. It should be noted that in one of the recent research works, a similar dissimilarity coefficient calculation was used [29]. However, in that study, the similarity equation was entirely different, which provided different performance scores, fewer comparative distance metrics were included and fewer benchmark data sets were used [29]

where


For two instances (texts or records) ai and aj and n attributes, s is the total number of attributes that suffice
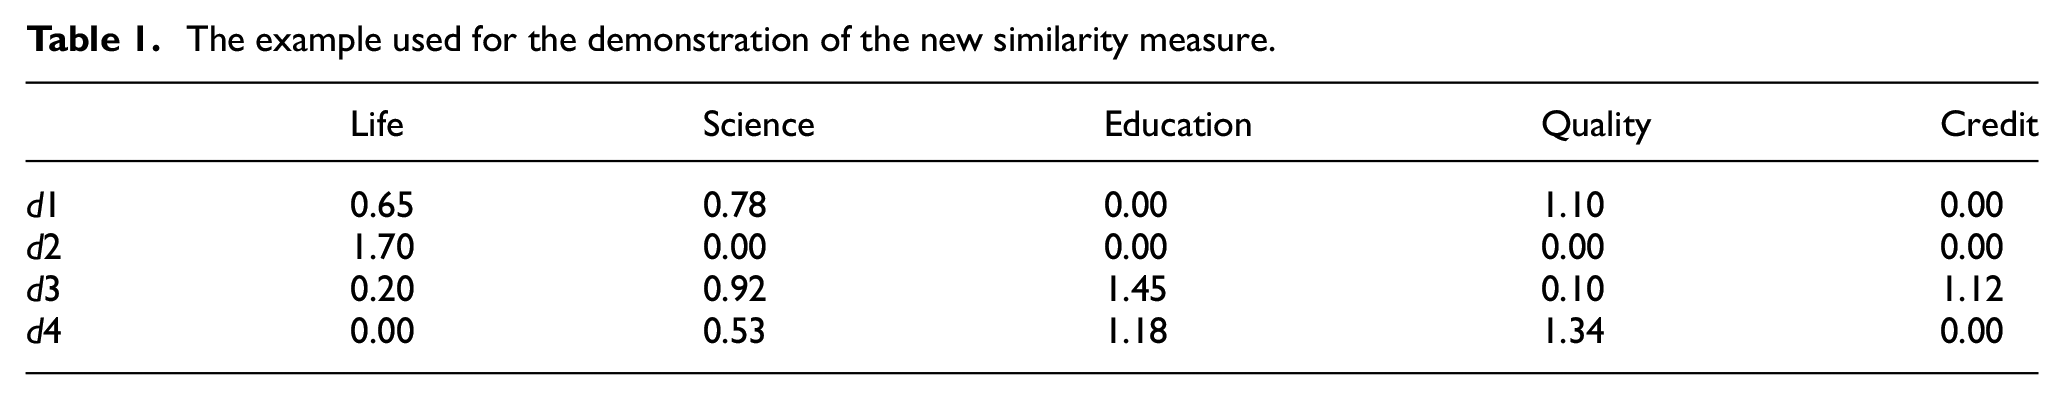
The similarity measure proposed in this study can also be demonstrated with a simple example. For instance, suppose that there are four different documents d1, d2, d3 and d4 with five attributes, where each attribute is a specific word and its numerical value stands for its normalised tf–idf value, which is given in Table 1. Suppose that d1 is a document related with life sciences and their impact on life quality, d2 comprises some philosophical quotes about life, d3 is an educational programme catalogue in life sciences having course descriptions with credits and d4 is a short analysis of some scientific articles related with quality assurance and education.
The example used for the demonstration of the new similarity measure.
After making the calculations according to equation (2), the dissimilarity coefficient between d1 and d2 will be calculated as follows

According to the definitions in equations (2) and (3), s will be set to 1, t will be 3, n will be set to 5, and the similarity between d1 and d2 will be calculated as follows

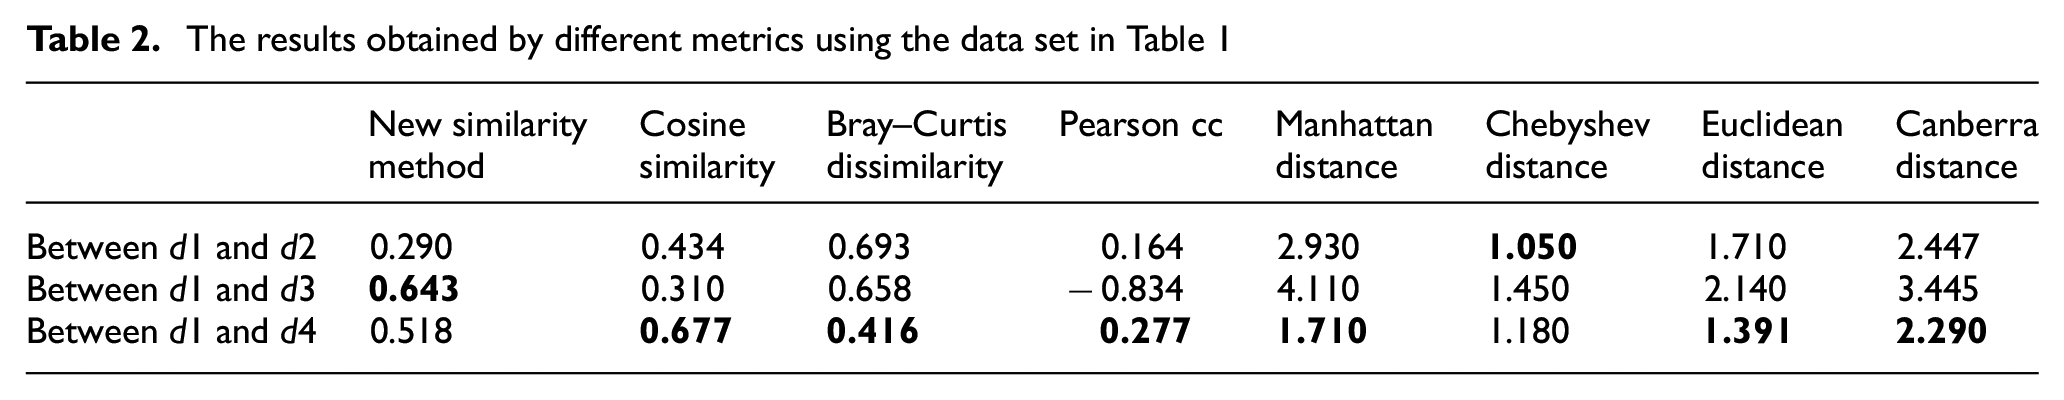
The similarity between d1 and d2 will be obtained as 0.290. Using the same equations, the similarity between d1 and d3 will be found out as 0.643, and the similarity measure between d1 and d4 will be 0.518. Thus, document d3 will be the most similar one to d1, and d4 will be the second most similar document to d1 according to the new similarity measure. However, using the same data in this example, document d4 will be the most similar one/closest one to d1 according to all the other metrics except Chebyshev distance. If Chebyshev distance is used, then document d2 will be the closest/most similar one to d1. The results of all of these metrics using the data in this example are also given in Table 2, where the most similar or the closest one is marked with bold font. In this example, the most accurate and realistic result can only be achieved by the new similarity measure.
The results obtained by different metrics using the data set in Table 1
It should be noted that this novel measure could only be used for data sets having non-negative numerical values. This is due to the fact that this similarity measure is especially aimed and implemented for document classification where the representative vector values of each document can only be 0 or positive continuous numbers. This new method is also designed to obtain more accurate and realistic similarity scores for data with high sparsity and with many attributes that have zero in both records, which makes it especially a promising alternative for text mining, document classification, document clustering and recommender systems.
The coefficient value (0.5) in equation (2) is used to assure that the similarity scores do not exceed 1 whenever the attribute values are very similar among two instances, and if the documents are very different, then it could produce similarity scores closer to 0. Hence, it is used to provide more distinctive, balanced and consistent similarity scores. For instance, suppose that we have two documents with five terms having tf–idf values such as d1 [1.0, 0.4, 2.1, 1.3, 4.5] and d2 [0.9, 0.1, 2.0, 1.2, 3.7]. The similarity between these two documents will be calculated as 0.97 with the proposed method. However, if this coefficient is not used, then it will be calculated as 1.94. This does not change the accuracy of the algorithm, since, if 1.94 was used instead of 0.97, it would not have changed the classification prediction. However, the similarity score would have exceeded 1. Since the similarity measures in the literature are mostly between 0 and 1 for non-negative values as a common property [20,22], this novel measure was designed to conform to this property as well.
2.3. Other similarity measures and distance metrics
The mathematical definitions of the similarity measures and distance metrics are given in this section, which are the ones chosen and used in this study. Euclidean distance, Cosine similarity, Pearson cc, Manhattan distance, Chebyshev distance, Canberra distance and Bray–Curtis dissimilarity are given in equations (4)–(10). It should be noted that the coordinates of vectors are the records, instances or documents, and vector elements or values are the values of the features or attributes of that instance.
Let
Euclidean distance between p and q is

Cosine similarity between p and q is
Pearson cc between p and q is
where
Manhattan distance between p and q is

Chebyshev distance between p and q is

Canberra distance between p and q is

Bray–Curtis dissimilarity between p and q is

2.4. Data sets and evaluation methods
Several data sets were used in this research to compare the performance of classifiers with standard similarity measures versus this novel similarity measure. One of them is ‘TTC-3600’, which is a collection of Turkish news and articles including categorised 3600 text documents from well-known news portals in Turkey [30]. There are six classes/categories in ‘TTC-3600’, where each category has 600 instances. Kılınç et al. derived four different data sets from the raw text data, which all of them were also tested in this study. One of these alternatives is the original data set with 3600 instances and 7507 features (words). Another data set with 5692 features was constructed using the Zemberek stemmer [31]. Zemberek is one of the well-known and most preferred stemmer algorithm and tool for stemming Turkish lexicons. Two additional data sets were also constructed in the same manner using different stemmers, namely, F5 and F7 [30]. The data set constructed by the F5 stemmer had 3208 features and the one constructed by the F7 stemmer had 4812 features. Another data set that was included in this study is ‘1150 Turkish news’, which has five classes and 1150 documents, where each class has 230 records [32]. The original data set has 39,700 attributes (words); however, after text pre-processing with stop words and Zemberek stemmer, 8171 terms were left, and this data set is used with 1150 instances and 8171 attributes in this study. Two different universal text mining benchmark data sets that were derived from English texts were also used in this study. One of them is ‘BBC News’, which consists of 2225 documents from the BBC News website in five different categories [33]. The raw data in ‘BBC News’ have more than 10,000 terms; however, the version with 9636 features that was provided by the authors [33] was used in this study. The other English data set that was included in this study is ‘The Irish Times’, which is a corpus of news articles published by the daily Irish newspaper and the Irish Times [34]. It is composed of 3246 documents, 4823 terms, and seven categories. It should be mentioned that both ‘BBC News’ and ‘The Irish Times’ are imbalanced, so the number of records among each class is not equivalent in these two data sets.
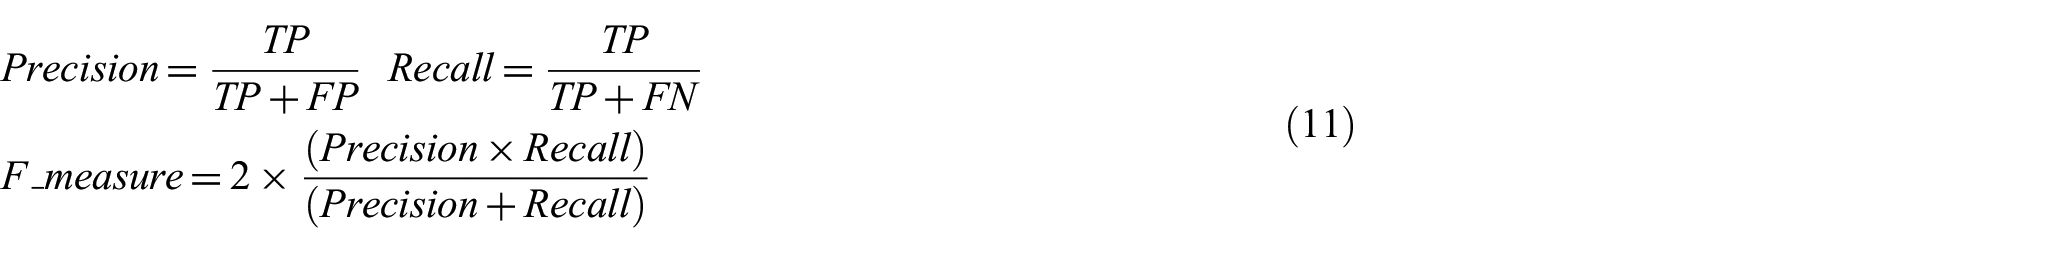
The prediction performance and the accuracy of classifier algorithms in text mining and document classification are mostly evaluated by calculating precision, recall and F-measure [2,35]. These performance measures are also given in equation (11), where TP stands for true positive (intersection of relevant and retrieved documents), FP stands for false positive (incorrectly retrieved documents that were not relevant) and FN is for false negative (relevant documents that were incorrectly missed)
Since there are more than two categories in most of the text classification problems, the average of precision, recall and F-measure scores should also be calculated. There are two different methods, namely, macro average and micro average [36]. The macro average provides the arithmetic mean of independently calculated performance scores for each class. Hence, the macro average ‘measures the classification effectiveness for each class, considered independently and equally important’ [37]. The micro average is also known as ‘the weighted average of all classes where the overall value is dominated by the more frequent class’ [2]. Thus, if the number of instances for each class is equal, then macro and micro average values will also be the same.
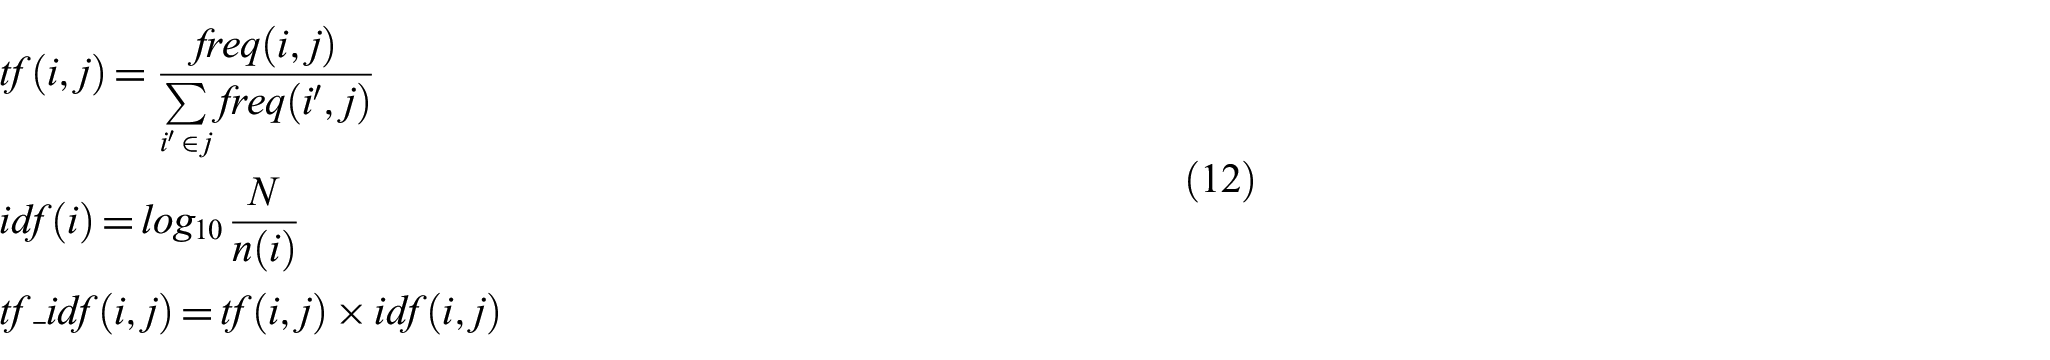
As it was mentioned in the previous paragraphs, the data sets used in this study are composed of tf–idf values of words in the documents, which is one of the most common frequency-based metrics among text and document classification tasks [2]. It should be noted that tf–idf is derived from simple statistical frequency measures and does not contain any latent or explicit semantic values or weights. The tf–idf calculation is given in equation (12). However, if the length of the documents in a data set varies significantly, then augmented (double-normalised) tf–idf is usually used to prevent the bias towards longer documents [3]. The augmented tf–idf is given in equation (13)
where

where
3. Results
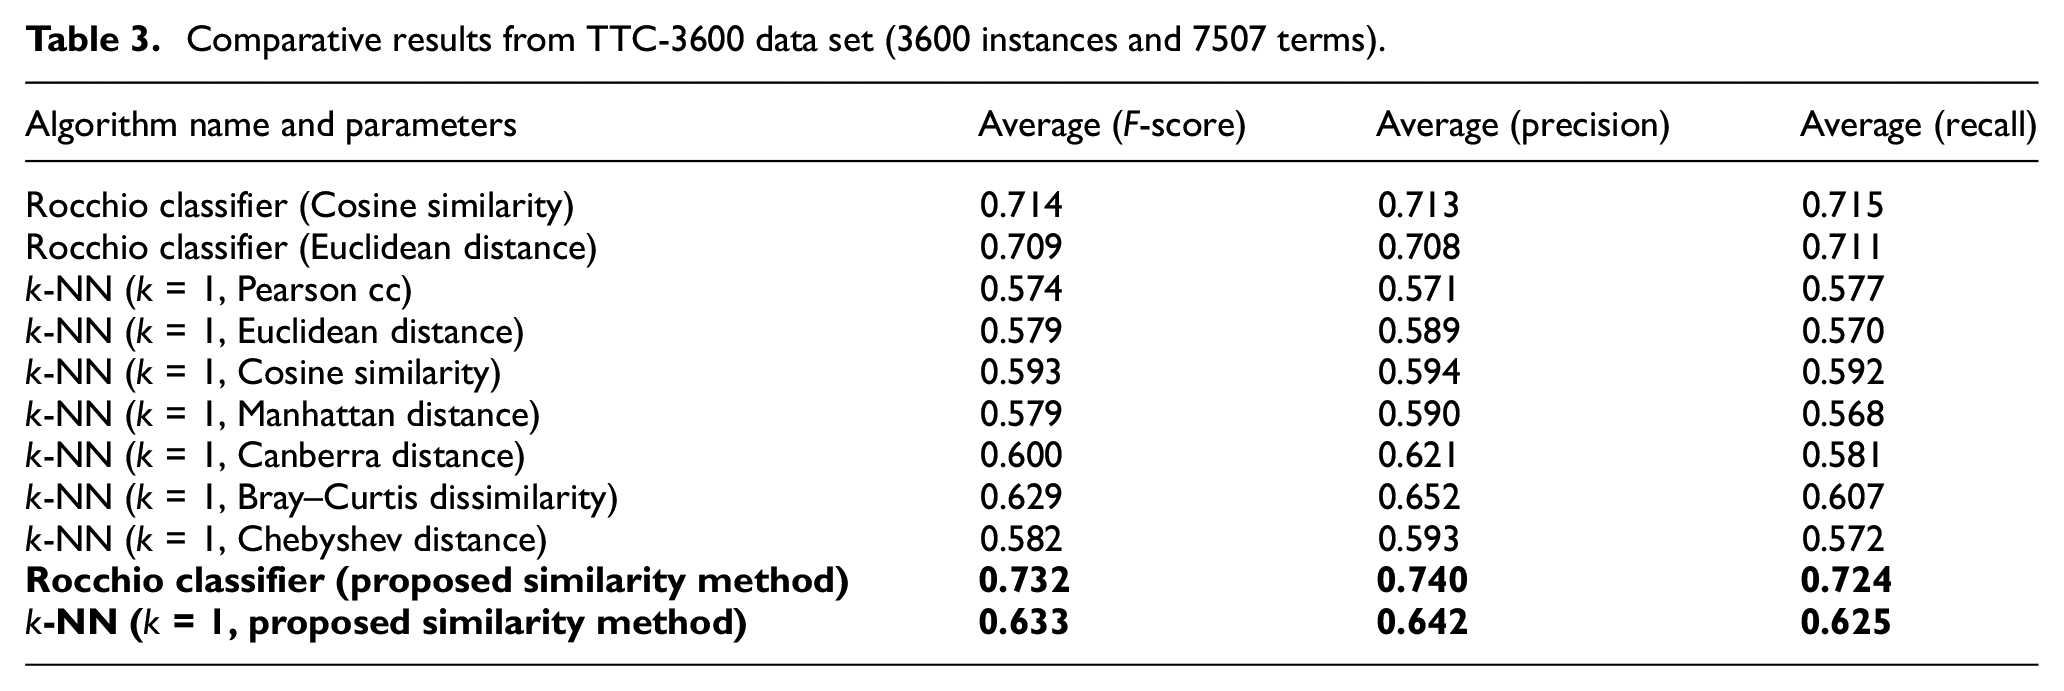
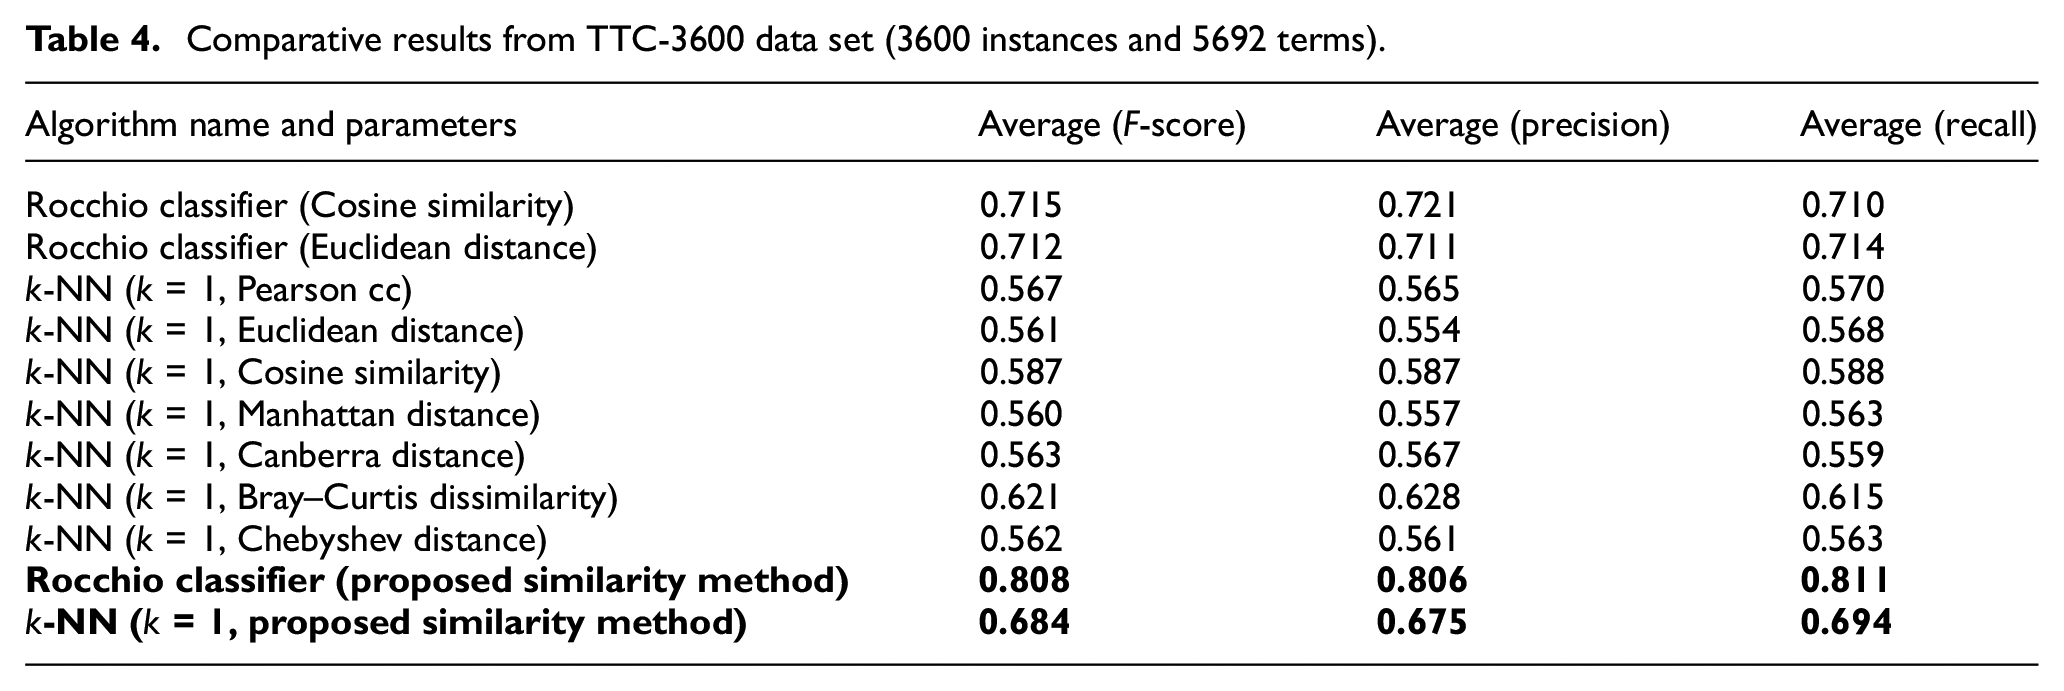
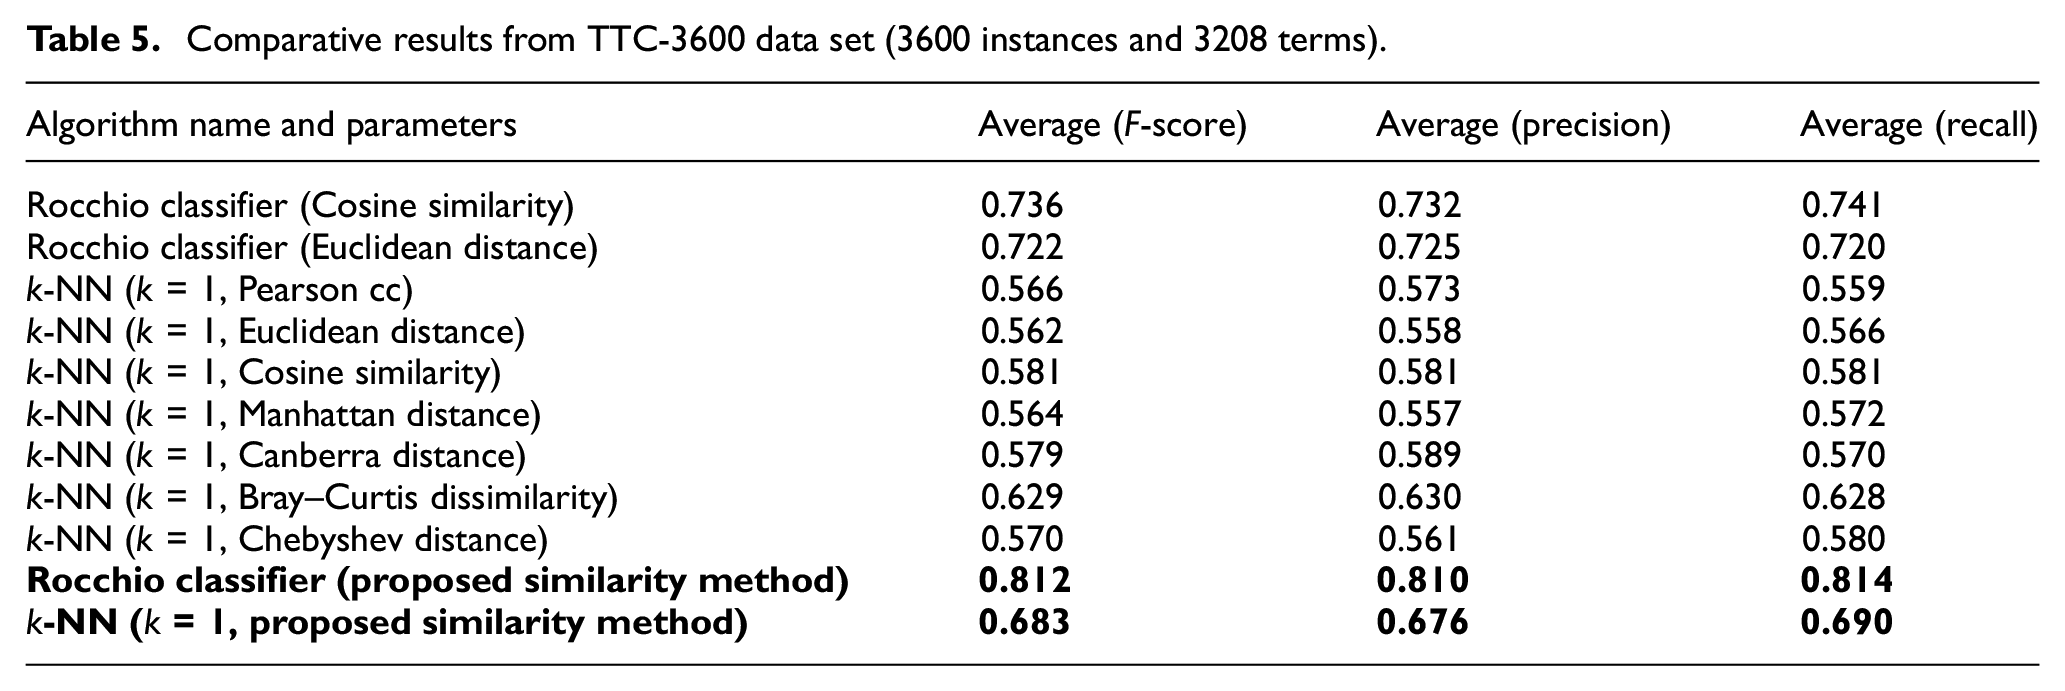
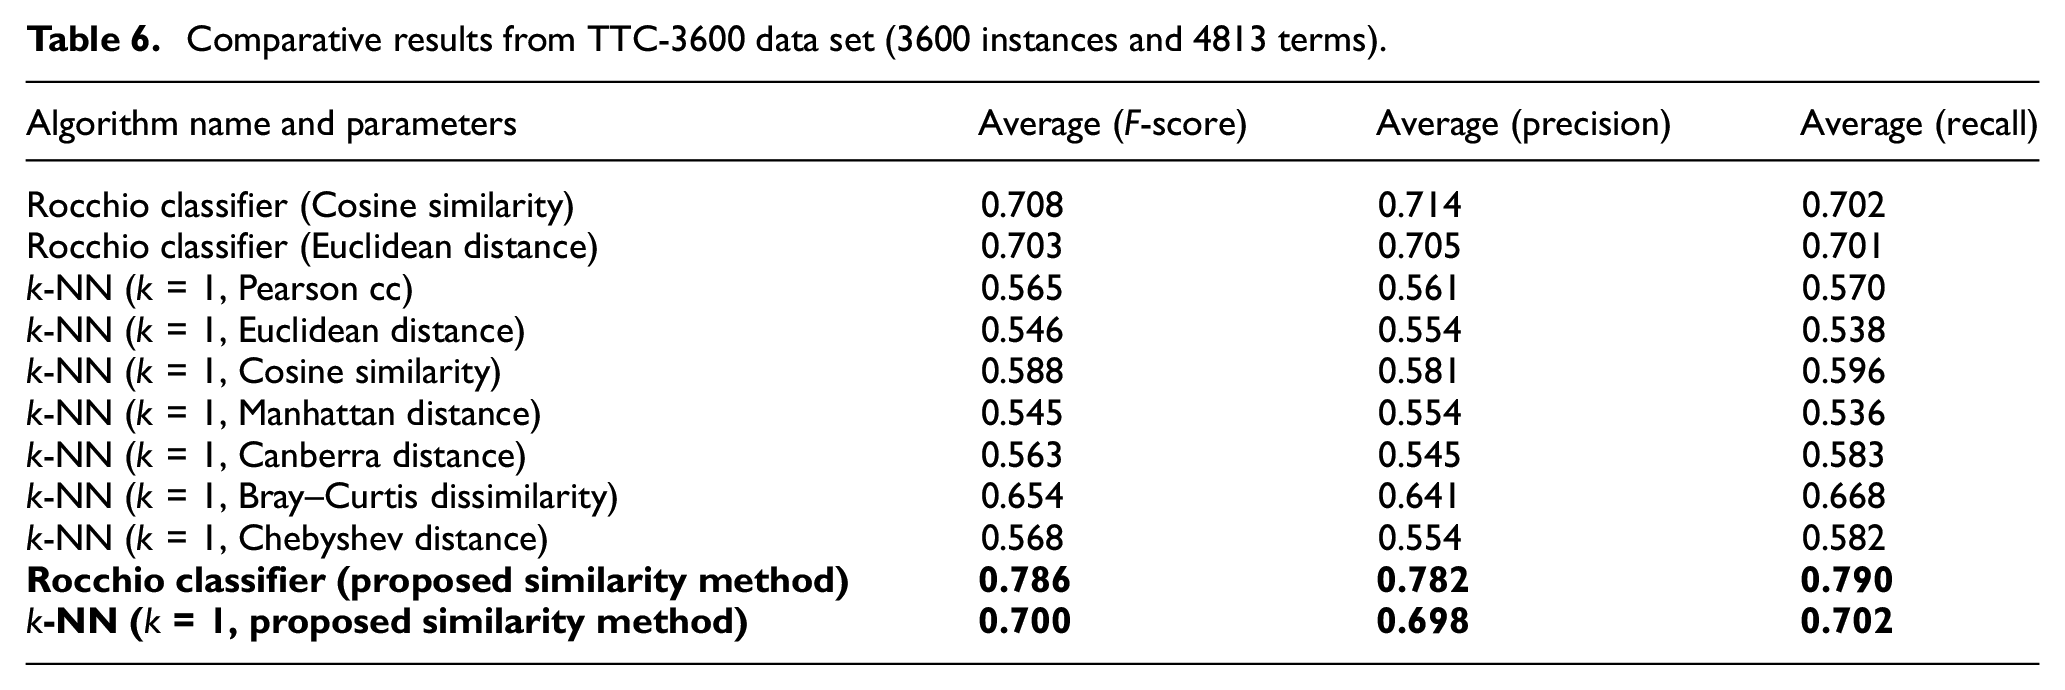
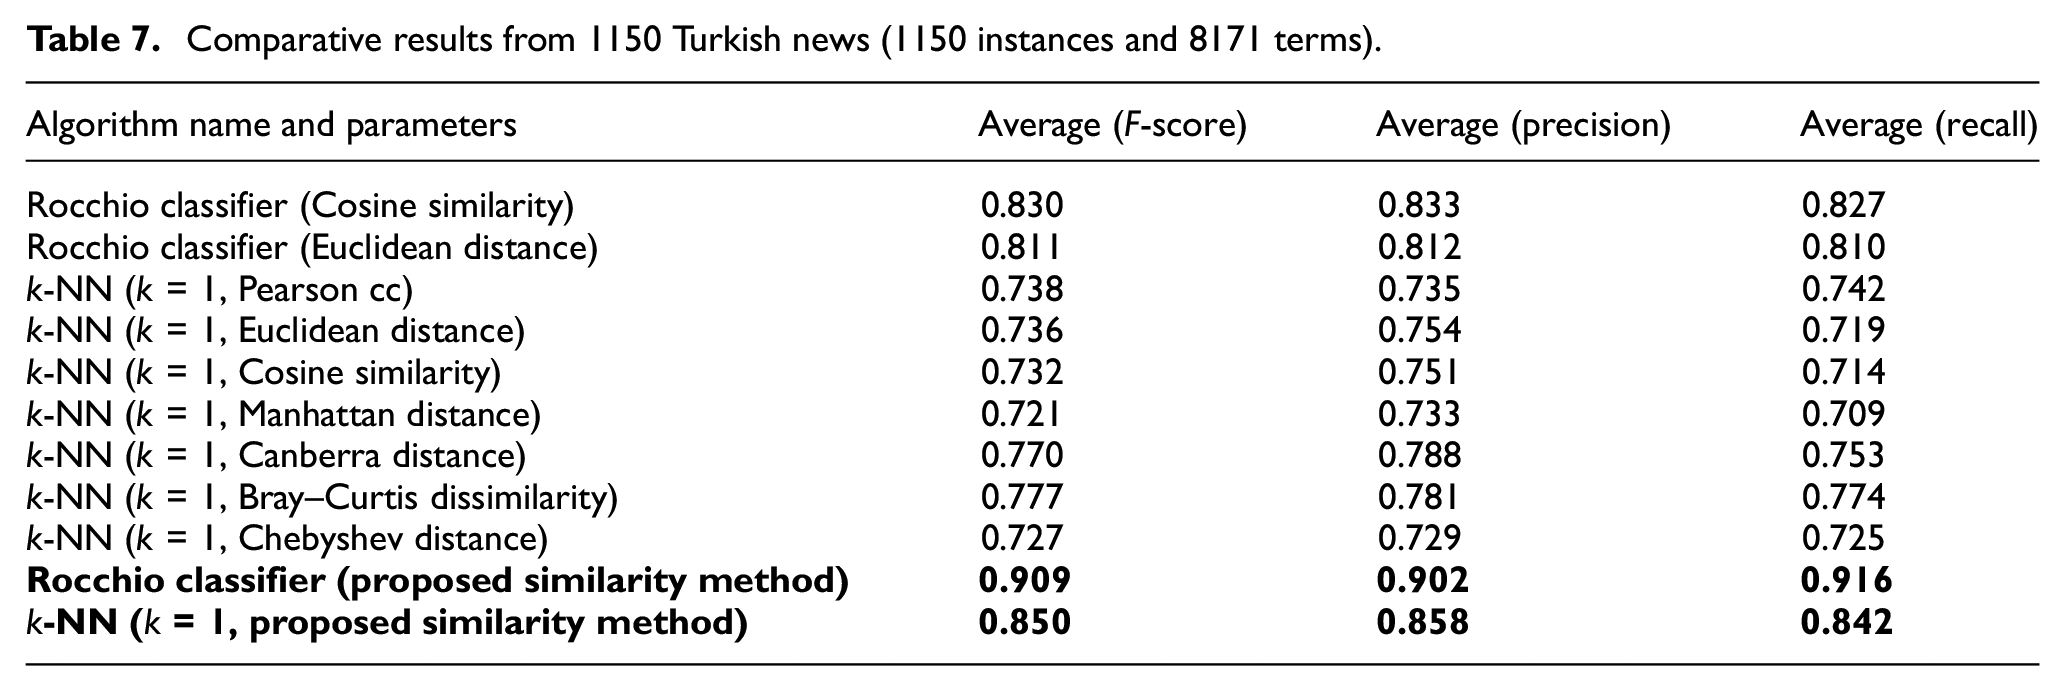
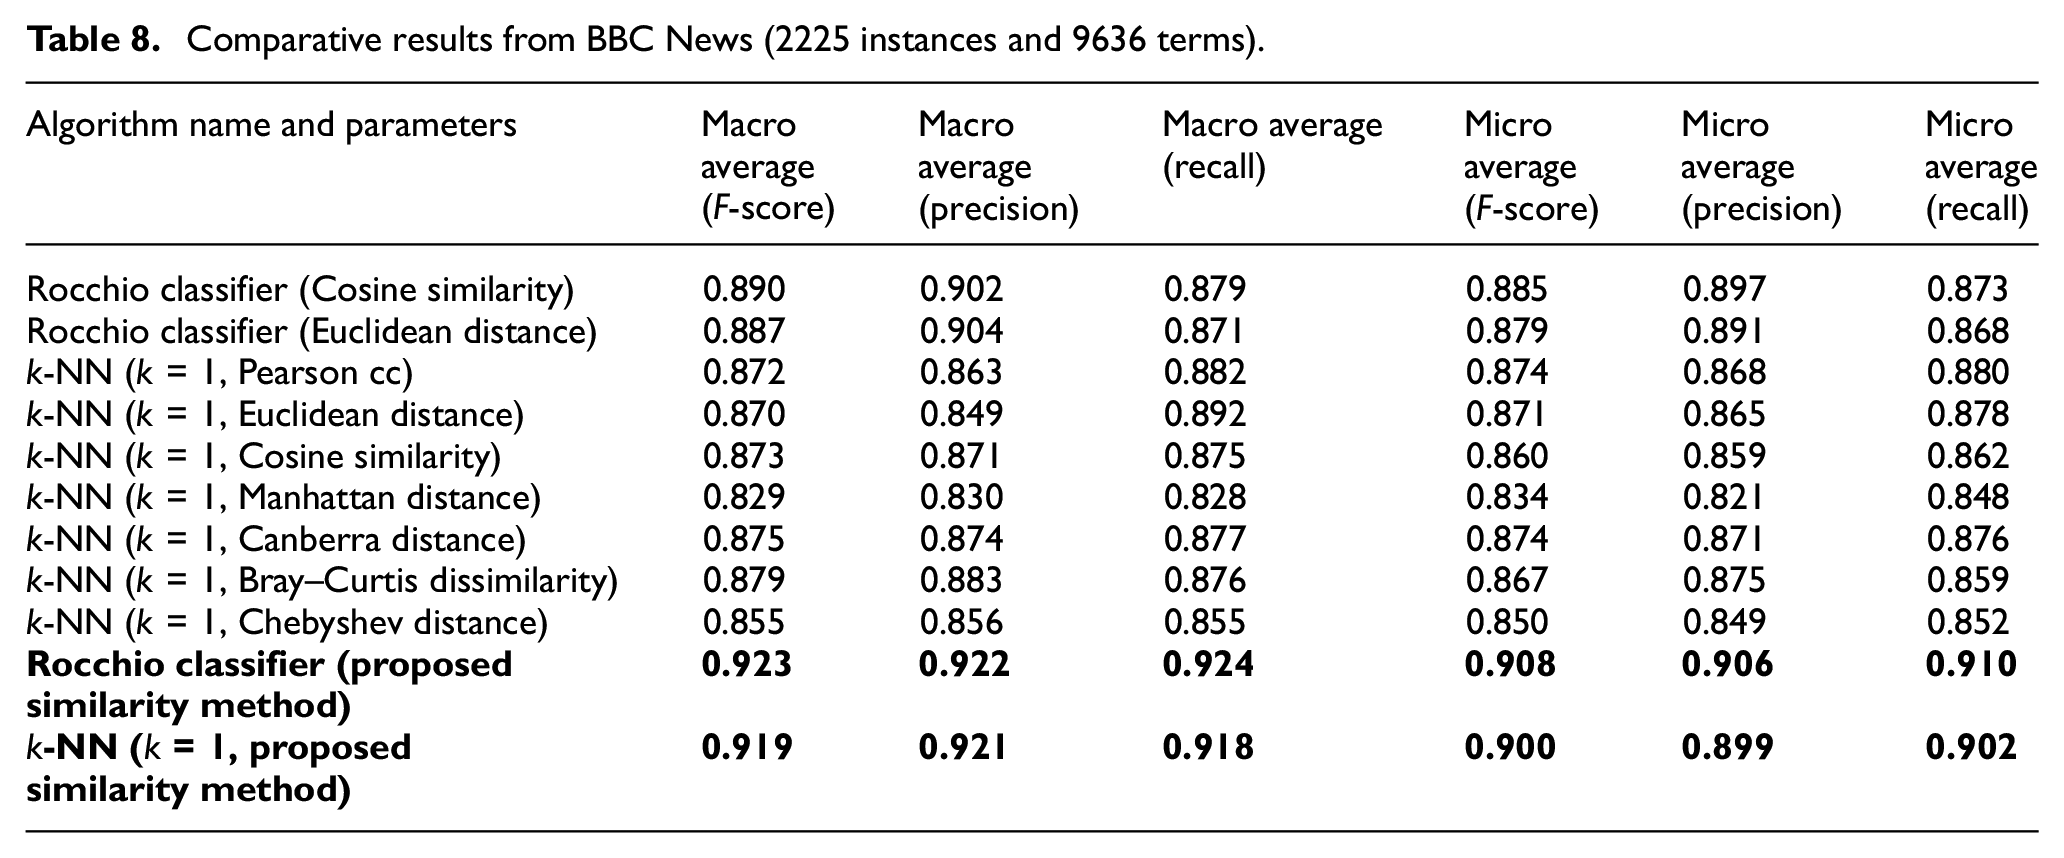
The results within the experiments conducted on different data sets were obtained by stratified tenfolds cross-validation. Cross-validation is one of the most reliable and accurate techniques when the data have to be separated into train and test data sets [38]. In ‘k-fold cross-validation’, the initial data set is partitioned into k‘mutually exclusive subsets’ or ‘folds’ [39]. The comparative results obtained from the experiments conducted with four different data sets of TTC-3600 are given in Tables 3–6. Each of these data sets has a different number of terms according to the stemmers used in the relevant study [30], which are given and discussed previously in section ‘Data sets and evaluation methods’. The results obtained from the 1150 Turkish news data set are given in Table 7. The comparative results obtained using ‘BBC News’ and ‘The Irish Times’ are given in Tables 8 and 9. It should be noted that there is an equivalent number of instances among each category in ‘TTC-3600’ and ‘1150 Turkish news’ data sets; hence, the micro and macro averages are exactly equal. However, since ‘BBC News’ and ‘The Irish Times’ data sets are imbalanced, macro and micro averages are both observed, which are given in Tables 8 and 9. The results obtained by the new similarity measure is boldfaced in these tables.
Comparative results from TTC-3600 data set (3600 instances and 7507 terms).
Comparative results from TTC-3600 data set (3600 instances and 5692 terms).
Comparative results from TTC-3600 data set (3600 instances and 3208 terms).
Comparative results from TTC-3600 data set (3600 instances and 4813 terms).
Comparative results from 1150 Turkish news (1150 instances and 8171 terms).
Comparative results from BBC News (2225 instances and 9636 terms).
Comparative results from The Irish Times (3246 instances and 4823 terms).
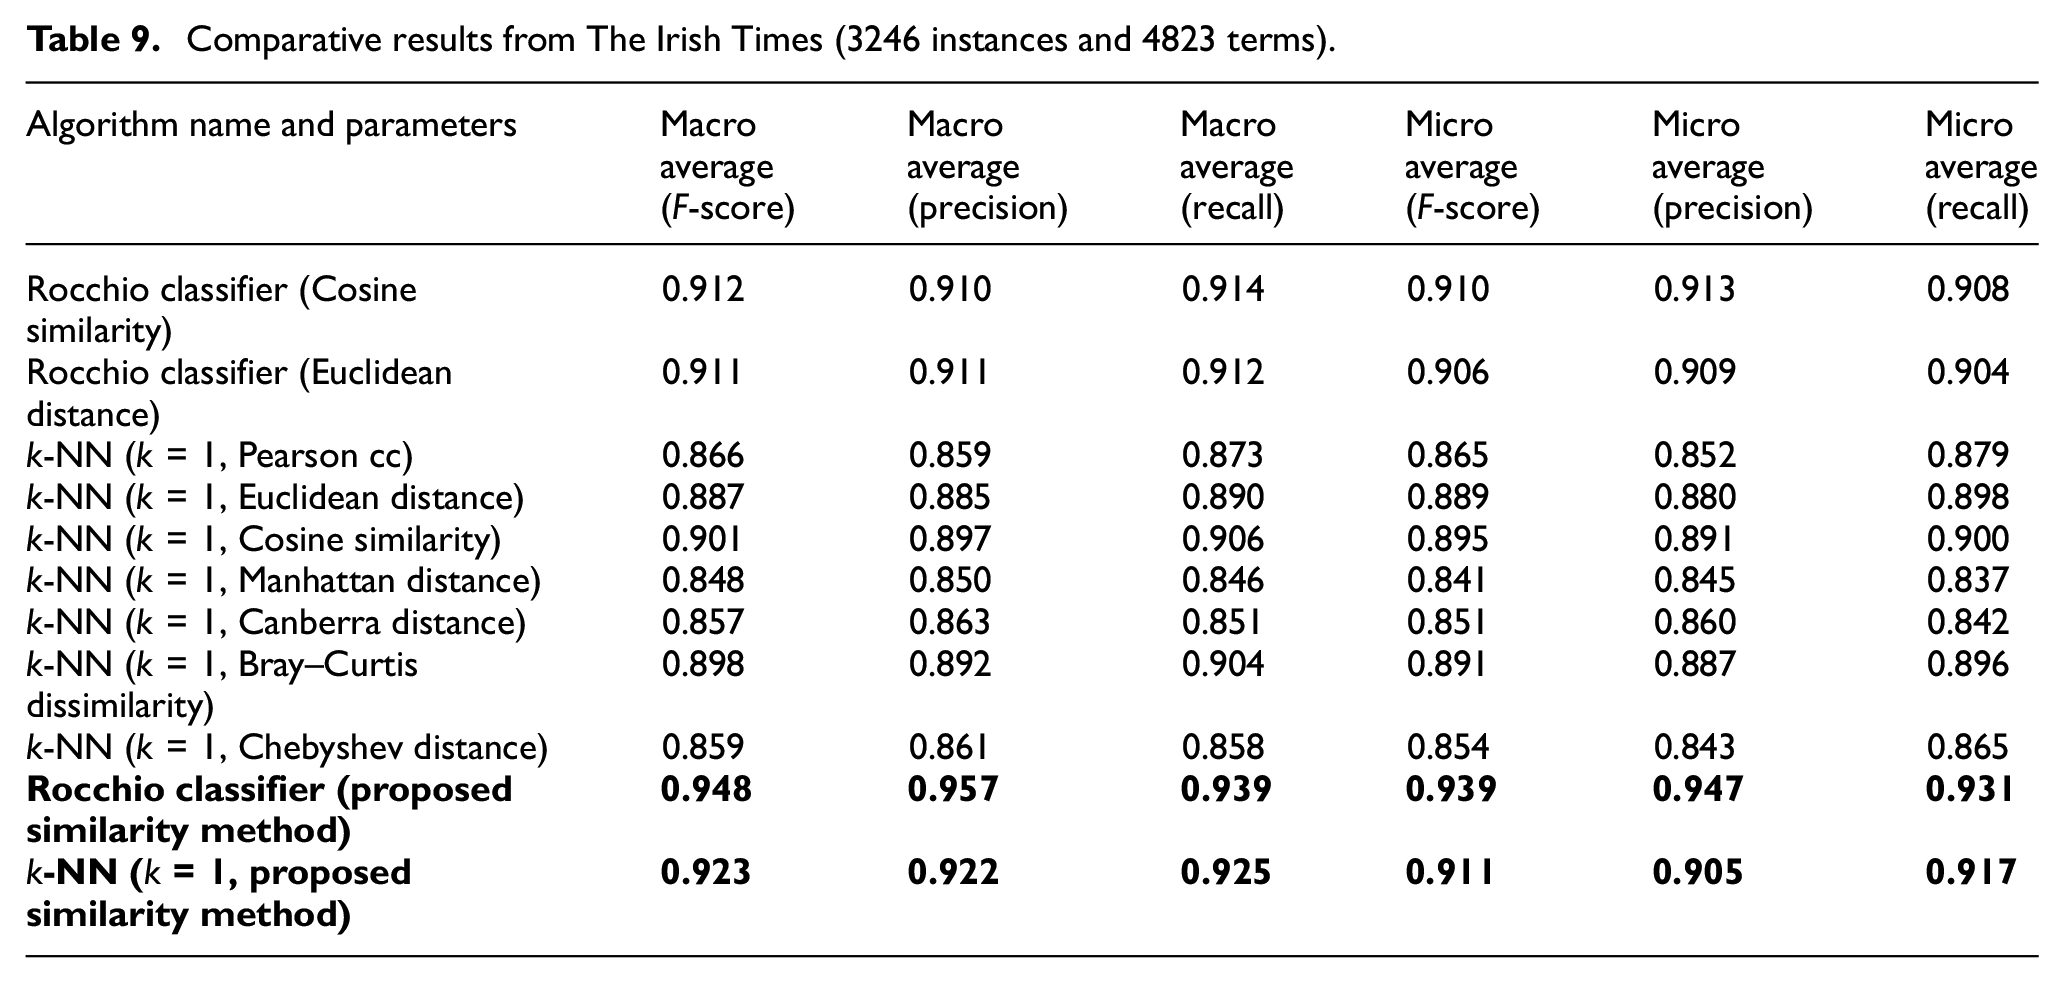
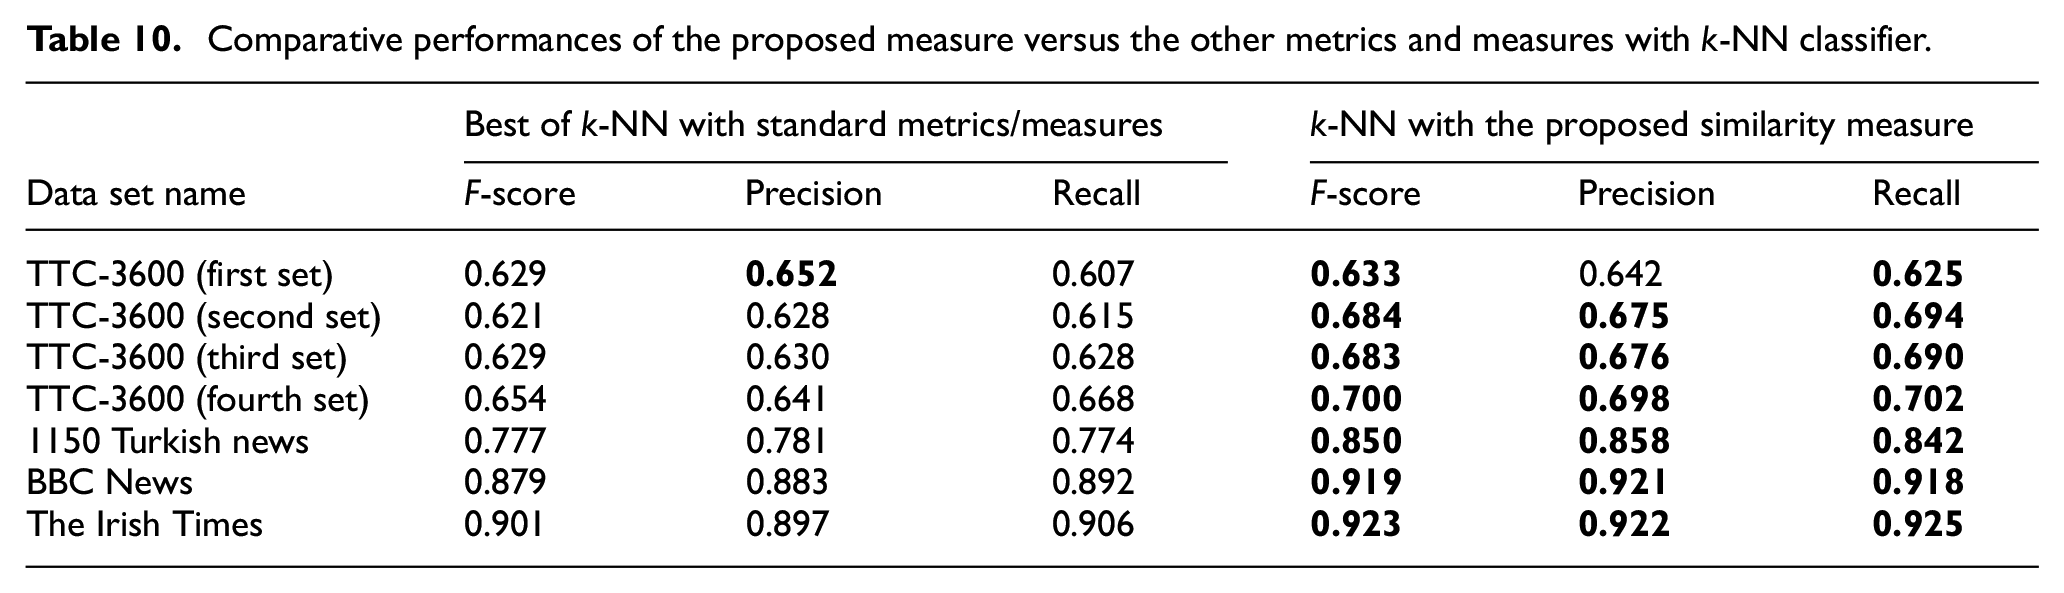
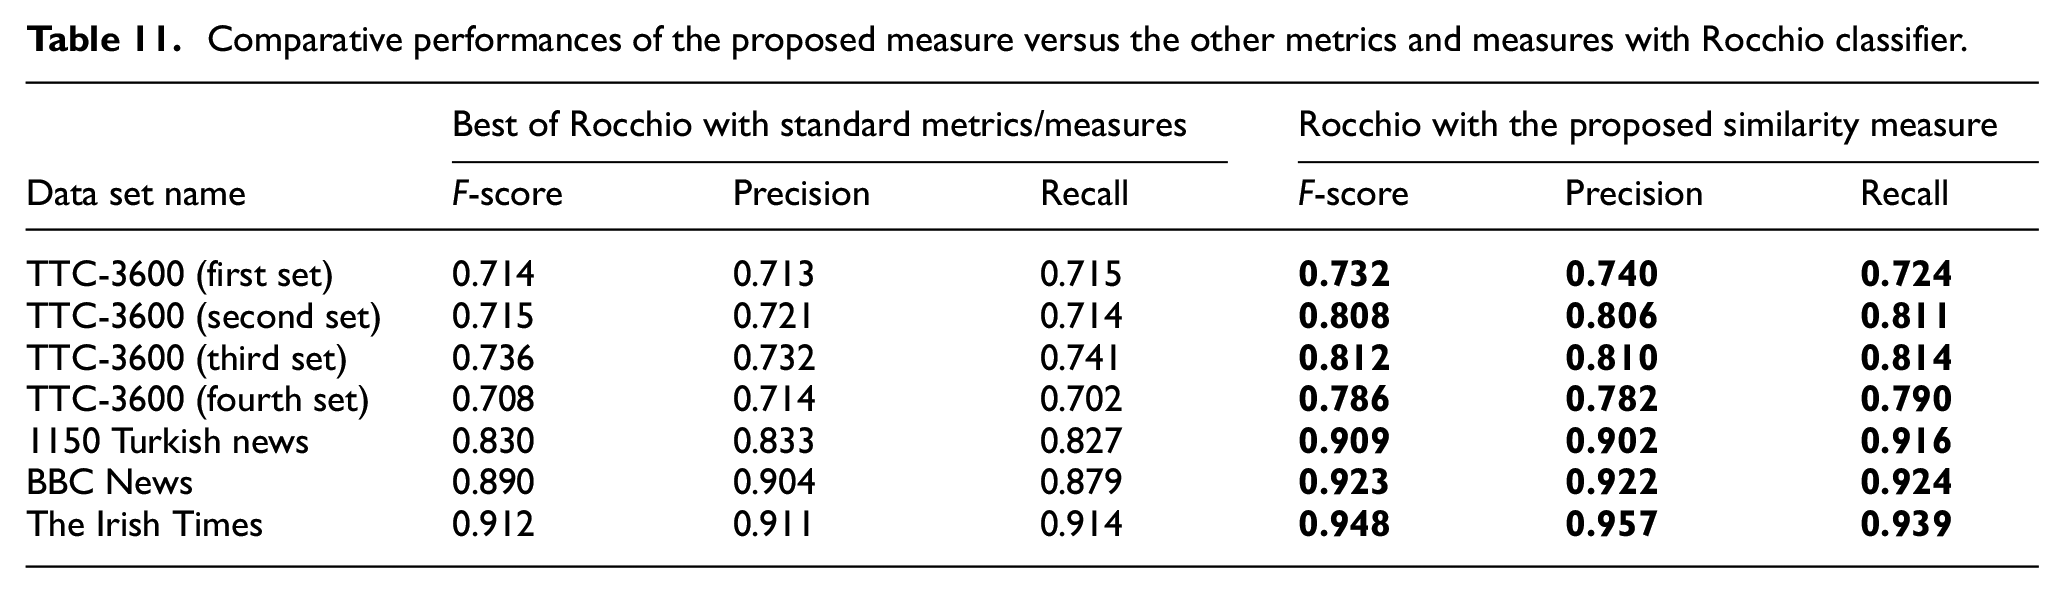
The positive outcome of the proposed new similarity measure can also be observed in Tables 10 and 11, where the best results obtained by standard metrics and the new measure among all the data sets covered in this study are comparatively summarised. The highest observations among macro averages in Tables 10 and 11 are only denoted for the imbalanced data sets, ‘BBC News’ and ‘The Irish Times’.
Comparative performances of the proposed measure versus the other metrics and measures with k-NN classifier.
Comparative performances of the proposed measure versus the other metrics and measures with Rocchio classifier.
It should be mentioned that when k was set to a higher value than one for the k-NN algorithm, the performance values degraded for all the data sets with any of the alternative similarity metrics. It is known that when k is increased, more dissimilar or more distant neighbours are also included as the nearest ones, which decreases accuracy in some cases. The similar issue is experienced in this study, which is probably due to the fact that the data sets and the values of the attributes used in this study caused a negative impact such that even k is 2 or 3, many dissimilar neighbours were included as the nearest neighbour producing an increase in bias and classification errors. Several experiments with the k-NN algorithm were carried out among the data sets by setting k between 2 and 10. The best accuracy scores were obtained when k was set to one. Thus, only the experimental results for k = 1 is included in this article.
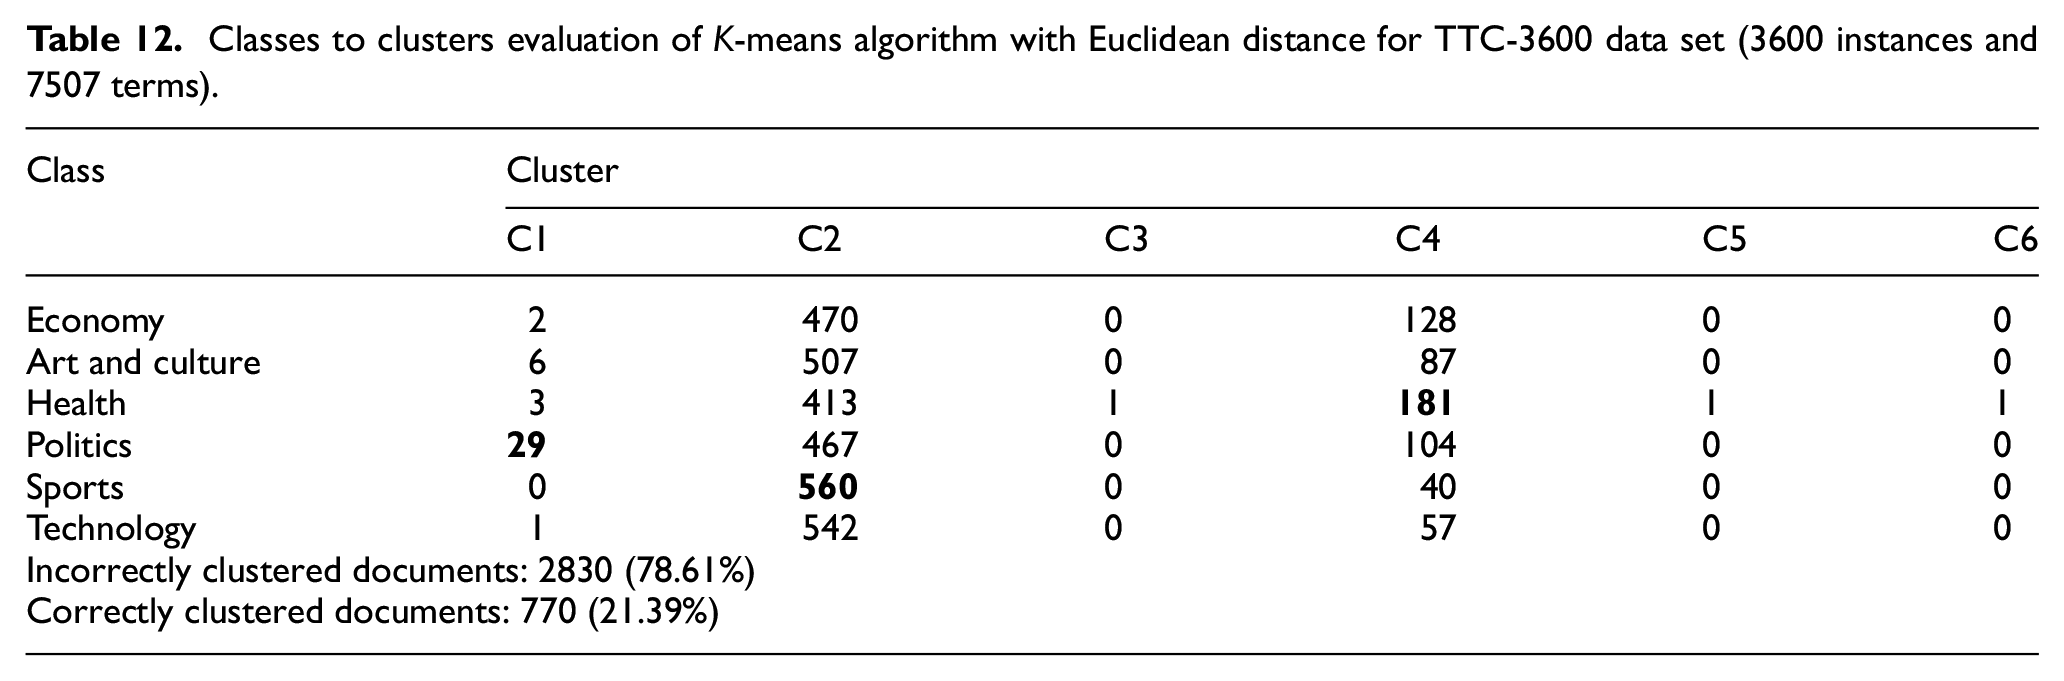
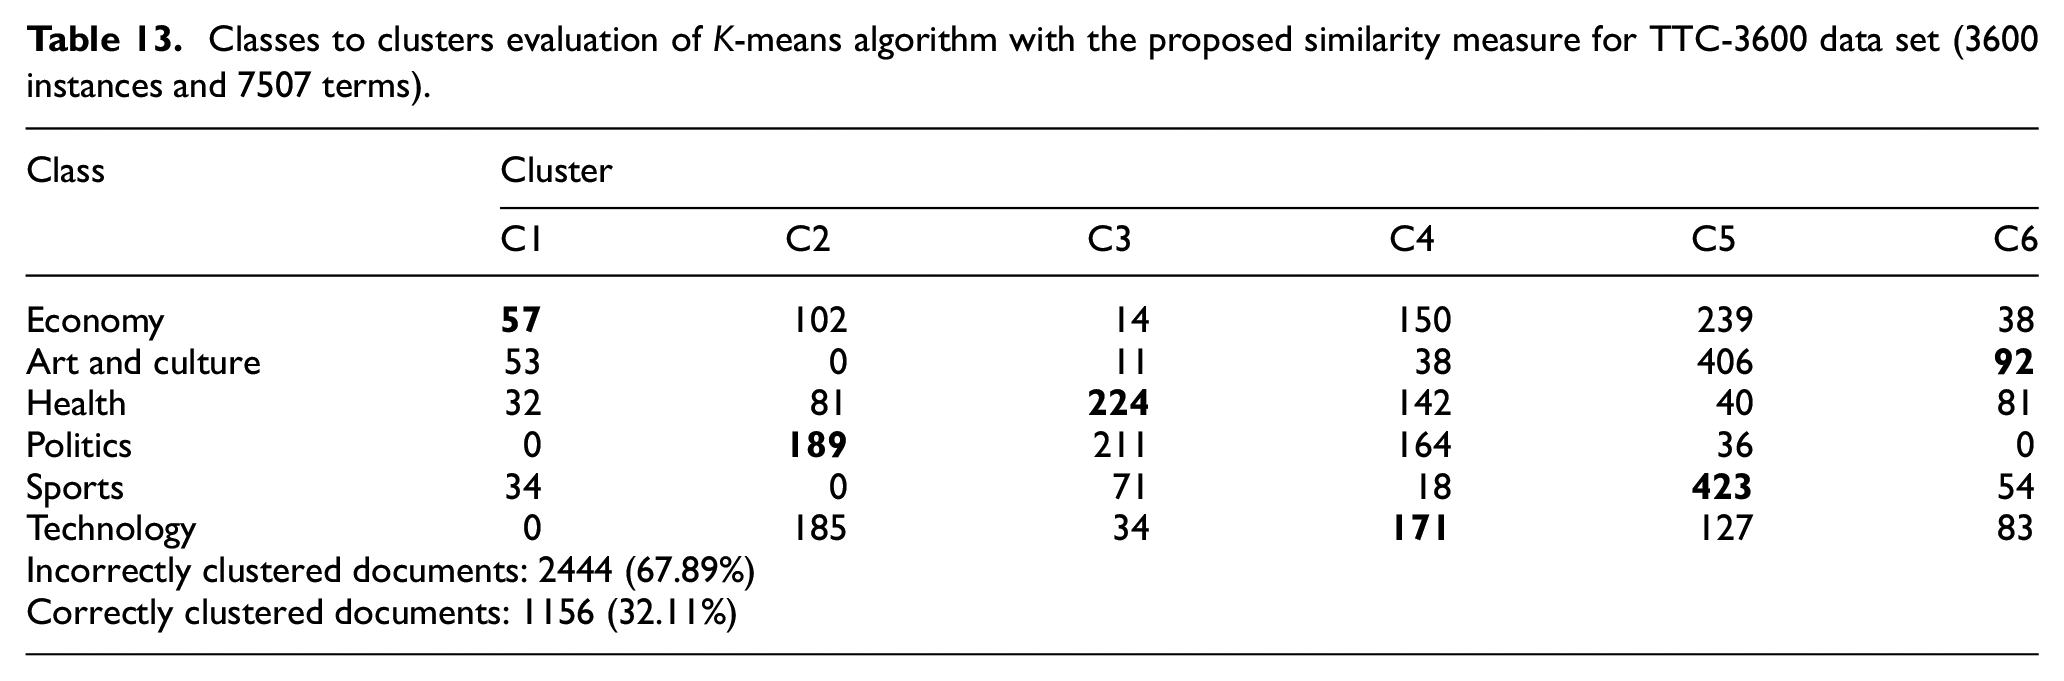
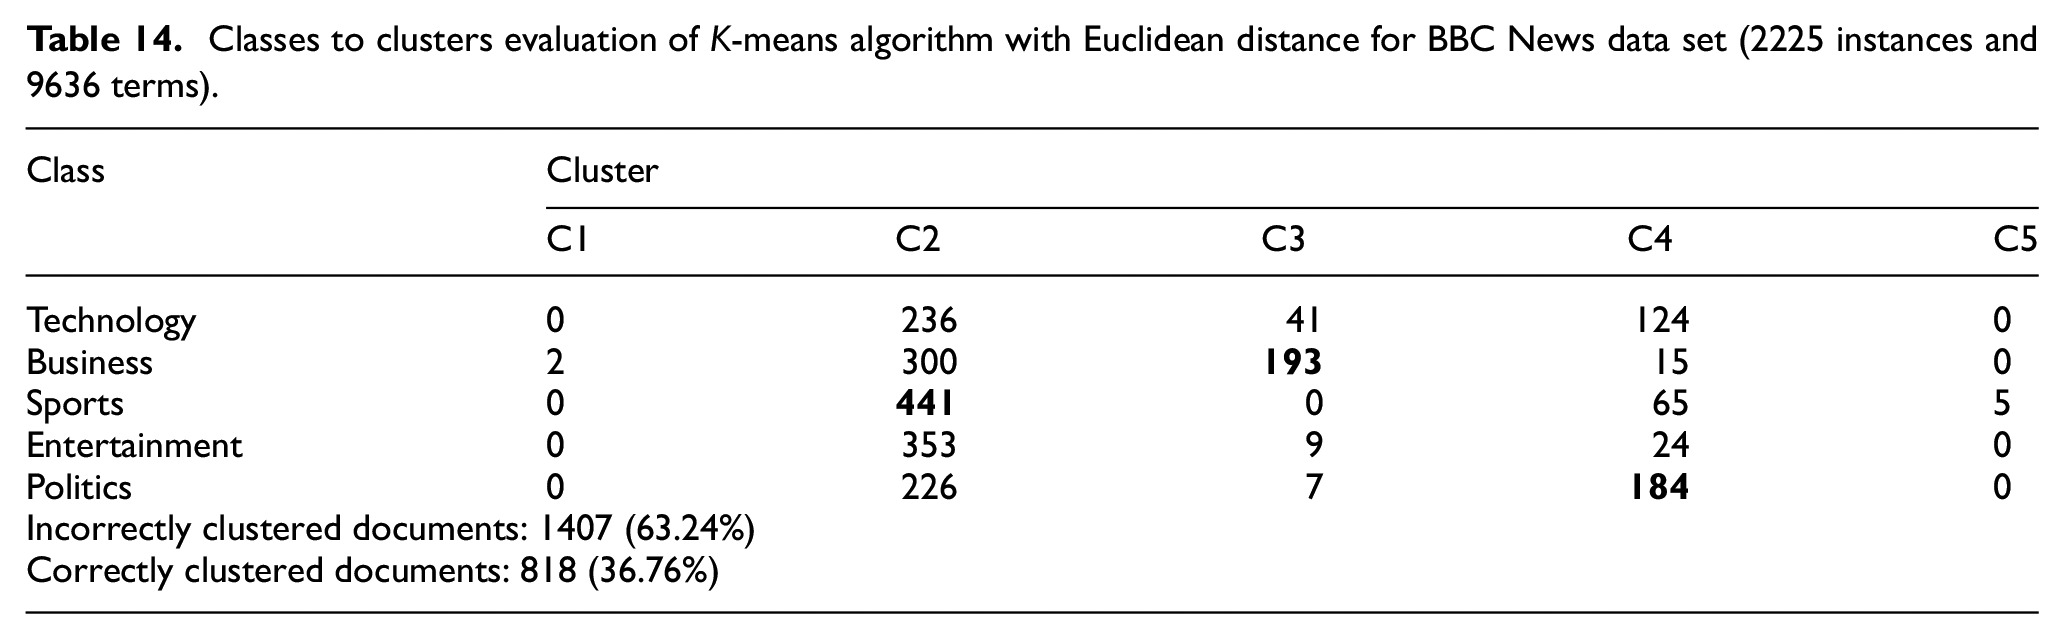
The primary aim of this study is to show the success and efficiency of the proposed similarity measure for text classification among vector space-based algorithms. Some additional experiments have been conducted to observe the performance of this new measure for document clustering problems. Clustering algorithms create a set of documents into subsets or clusters, which are coherent internally, but different from each other [17]. Hence, documents within a cluster should be as similar as possible and they should be as dissimilar as possible from documents in other clusters [17,22]. K-means is one of these algorithms and its objective is to minimise the average squared Euclidean distance of texts or documents from their cluster centres where a cluster centre is defined as the mean or centroid of the documents in a cluster [17,22]. The proposed similarity measure is also adapted and implemented for K-means algorithm, and the results are comparatively analysed with the one obtained by K-means using Euclidean distance. BBC News and TTC-3600 data sets were chosen and used in these experiments. In order to measure and compare the accuracy performance of K-means, ‘classes to clusters evaluation’ method is used [39]. Since the labels or classes of instances are already known in these data sets, this methodology is chosen. In order to evaluate the performance of the clustering algorithm, the documents’ labels are discarded during clustering operation and then each document within a cluster is compared with the original class of that document. The results are given in Tables 12–15 where the proposed similarity measure is observed to improve the accuracy of the K-means algorithm such that more documents are assigned to their correct clusters.
Classes to clusters evaluation of K-means algorithm with Euclidean distance for TTC-3600 data set (3600 instances and 7507 terms).
Classes to clusters evaluation of K-means algorithm with the proposed similarity measure for TTC-3600 data set (3600 instances and 7507 terms).
Classes to clusters evaluation of K-means algorithm with Euclidean distance for BBC News data set (2225 instances and 9636 terms).
Classes to clusters evaluation of K-means algorithm with the proposed similarity measure for BBC News data set (2225 instances and 9636 terms).
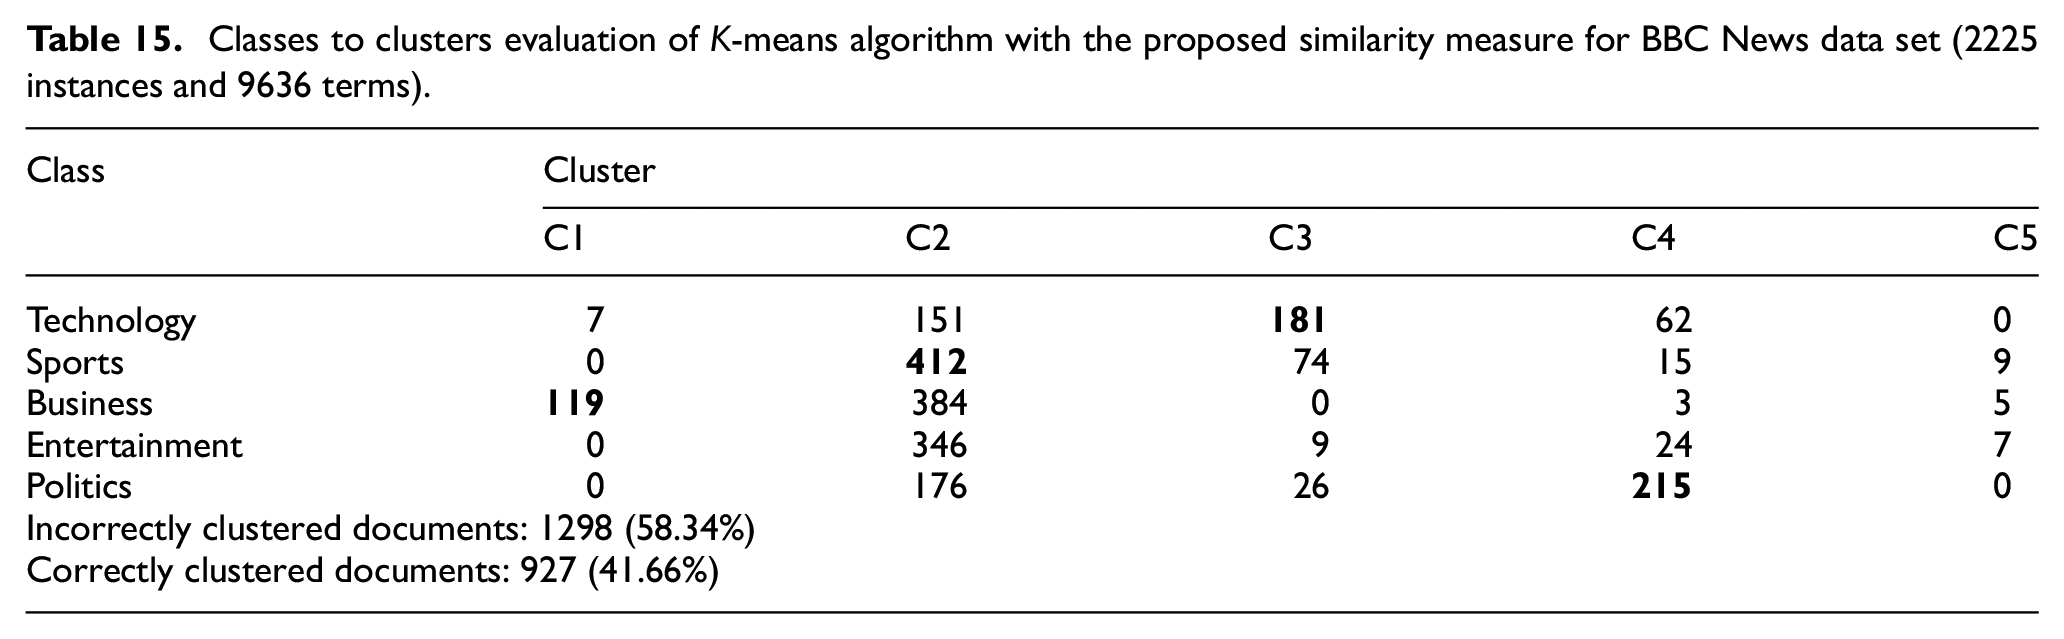
It could be observed from Tables 12 and 13 that the K-means algorithm with Euclidean distance could only cluster three out of six classes with an accuracy rate of 21.39%; however, K-means with the proposed similarity measure could cluster all of the six classes with an accuracy rate of 32.11%. Similarly, K-means with Euclidean distance could only cluster three out of five classes with an accuracy rate of 36.76%; however, K-means with the proposed similarity measure could cluster four out of five classes with an accuracy rate of 41.66%, which can be seen in Tables 14 and 15.
It should be mentioned that only the Euclidean distance was used with K-means algorithm in this study. This is due to the fact that Euclidean distance is mostly used as the distance measure with K-means clustering algorithm [17,38–40]. K-means algorithm minimises within-cluster variances, which are also squared Euclidean distances. In contrast to hierarchical and some other clustering algorithms, K-means algorithm does not explicitly use pairwise distances between data points. K-means is implicitly based on pairwise Euclidean distances between data points because the sum of squared deviations from centroid is equal to the sum of pairwise squared Euclidean distances divided by the number of points.
4. Conclusion and future works
It can be seen from all of the results and corresponding tables that the new similarity measure significantly improves the performance scores within both classifier algorithms, namely, k-NN and Rocchio. It can also be concluded that the highest F-score, precision and recall values were obtained using the proposed similarity measure with the Rocchio classifier among all the data sets. Also, in almost all the cases, the F-score, precision and recall scores obtained by the k-NN algorithm with the new similarity measure are higher than the ones observed using the other measures or distance metrics. The results observed in this study show that the proposed new similarity measure could be considered and used as an alternative similarity measure for text classification among different languages. It can be concluded that the new similarity measure improves the classification accuracy of instance-based algorithms and vector space models such as k-NN and Rocchio. Besides, according to the results obtained with the K-means algorithm, this new measure might also be considered as an alternative measure for some document clustering algorithms.
This novel similarity measure might be adapted flexibly and used within all suitable algorithms, methods and models for text mining, document classification and relevant knowledge management systems. It should be noted that the data types are limited to non-negative numerical values for the proposed similarity measure. However, new alternatives to this measure could be implemented if it is to be used for data mining purposes with categorical attributes or negative numbers.
As a future work, this novel similarity measure is planned to be adapted for document clustering problems and recommender systems. It is planned to be tested and comparatively analysed among different universal benchmark data sets for K-means and some other distance metric-based document clustering algorithms. Another future work might be considered the implementation of an alternative version of this new measure using standard distance metrics instead of the dissimilarity coefficient used in this study.
The primary aim of this new measure is document classification with basic statistical term frequencies and sparse data. However, another future work might be testing this new measure among dense representations and dense features without sparsity such as C-BOW, skip-gram, Word2Vec, GloVe or some other approaches such as non-negative matrix factorization or latent semantic analysis.
The benchmark data sets used in this study were balanced or slightly imbalanced. Another future study is planned to conduct new experiments with this new measure among imbalanced data sets such as Reuters-21578 and to compare these results with their balanced versions.
Footnotes
Declaration of conflicting interests
The author(s) declared no potential conflicts of interest with respect to the research, authorship and/or publication of this article.
Funding
The author received no financial support for the research, authorship and/or publication of this article.