
Abstract
Similarity metrics are critical to identifying the relationships between patents. While many bibliometric methods such as co-citation and co-classification fail to use the vast majority of technical information existing in the text, most text mining methods focus on keywords in only one text field of the patent document. This article aims to leverage various text fields to measure pairwise patent similarity according to their technological bases. A novel approach called semantic embedding with attention for patent similarity (SEA-PS) is proposed. First, the method identifies technological bases and models the semantic relatedness. To achieve this, we put forward an additional patent stop-word list to help extract technical terms with an n-gram-based statistical method. The technical terms are then mapped into a vector space using word embedding. Second, we propose a graph-based method to allocate weights to distinguish the technical focus, considering the linkages between technologies. Finally, we assess the feasibility of the text fields, and integrate their semantics at the patent-level with an attention layer to conduct similarity metrics. The validations are from two perspectives: content validity (coverage of technical information, the validity of semantic representations and effectiveness of text field combinations), and external validity against existing methods via an expert panel. The results demonstrate the superiority of SEA-PS to existing methods, and suggest that ‘abstracts’, ‘claims’ and ‘technical descriptions’ are more effective than ‘titles’. SEA-PS is a fundamental tool for patent retrieval and classification. It also has a broad range of practical applications in innovation and strategy studies, including identifying technological frontiers and studying knowledge spillovers.
1. Introduction
Patents are one of the most effective ways to protect technology innovation achievements, that is, intellectual property. The essential parts of technical details are covered in a patent to distinguish it from other inventions and prevent patent infringement. Thus, it provides a reliable technical information source. Measuring patent similarity is increasingly contributing to innovation and strategy research. Aharonson and Schilling [1] used patent similarity to depict the technological overlap, similarity and proximity between firms’ technological footprints, based on which they explored technology agglomeration and knowledge spillovers. Luo et al. [2] represented the space of technologies by patent similarity metric to identify paths for novel opportunities. Arts et al. [3] proposed a text-matching similarity metric to study the localisation of knowledge spillovers. Eilers et al. [4] identified the process of one-way and two-way technology convergence by measuring patent portfolios’ similarity within the technology sector.
There are two main kinds of classical non-textual similarity methods: citation and classification analysis. Yan and Luo [5] compare citation-based, classification-based and bibliographic information-based methods in building patent networks and measuring technological distance. The citation analysis assumes that new patents are influenced by previous works, captured by patent forward and backward citations [6,7]. Most citation methods calculate similarity by the overlap ratio (e.g. Jaccard Index) of cited patents in first-order neighbourhoods [8]. Unlike academic papers, which generally contain dozens of citations, patent citation shows sparsity. Moreover, many patents have no citation record, leading to the inability to measure their similarity to other patents. The classification methods are based on the co-classification analysis of patents [9–11], where the researchers use International Patent Classification (IPC), US Patent Classification (USPC) and Cooperative Patent Classification (CPC). While classification-based methods also face the challenge of sparsity, the method’s main shortcoming is that it fails to differentiate patents within a specific class.
However, the vast majority of unexplored technical information exists in the form of unstructured text data. An obstacle is accurate feature recognition for unstructured text. With the rapid development of natural language processing (NLP), text elements can be precisely extracted. The recent trend has shifted from bibliometric measures to textual similarity measures [12]. Several types of methods have been proposed, for example, the bag-of-words (also referred to as co-word analysis) model [3], latent semantic analysis [13], vector space model [14], thesaurus-based method [15] and subject-action-object (SAO) model [16]. Text mining approaches manage to measure pairwise patent similarity, when patents are in the same class or lack citation records. However, two main gaps in these methods still exist. First, most of them rely on overlapping words or terms: on one hand, close semantic relatedness between similar words cannot be recognised, for example, ‘car’ and ‘automobile’; on the other hand, bias is introduced by disguised terms, which aim to cover more areas than the inventive technology itself for legal defensiveness and strategic reasons [17]. Second, these methods leverage only a single text field to measure similarity. In previous studies, which text field is the most appropriate remains controversial [14,16]. Arts et al. [3] state in their research: ‘… the title and abstract arguably provide the necessary information on the technical content of a patent. Nevertheless, future research could take the description of claims into account’. The challenge lies in the semantic representations and the information fusion of different text fields.
Machine learning and neural network models have shown their great potential in NLP semantic analysis tasks [18]. Mikolov et al. [19] proposed skip-gram with a negative sampling model, which can effectively learn high-quality word embeddings from a large corpus. With word embedding, Bahdanau et al. [20] achieved great success in applying an attention mechanism in machine translation, which first brings an attention mechanism into NLP tasks. Skip-gram and continuous bag-of-words (CBOW) have proven adequate in modelling semantic relations in technical aspects [21]. This opens a new era for semantic analysis such as patent classification and academic paper embedding [22]. Yang et al. [23] proposed a hierarchical attention network (HAN) model to map documents into a single low-dimensional vector space for classification tasks. HAN utilises two levels of attention mechanisms at the word level and sentence level to aggregate word embeddings into sentence embeddings and then into document embeddings. These methods provide the possibility to model and integrate textual information at different levels of granularity.
This article aims to leverage various text fields to measure pairwise patent similarity according to their technological bases. We propose a Semantic Embedding with Attention to measuring Patent Similarity (SEA-PS) model. The main contributions of this article are threefold. First, we enforce additional constraints on n-gram-based statistical method by proposing an additional stop-word list for patent similarity, and showcase how to identify the technological bases and model the semantic relatedness between them. This forms the basis of downstream information fusion tasks. Second, we utilise a graph-based method to distinguish the technical focus considering the linkages between technologies. Third, SEA-PS manages to leverage various text fields (i.e. ‘abstract’, ‘claims’, and ‘technical description’) with an attention layer to derive pairwise patent similarity metrics.
The remainder of this study is organised as follows. In sections 2 and 3, we review previous studies, summarise the gaps in existing research and clarify the research objectives of this article. We propose the SEA-PS model and illustrate the critical steps in section 4. Section 5 evaluates the proposed model on a dataset of 4149 patents of intelligent machine tools from the Derwent World Patents Index (DWPI) database. In section 6, we discuss the implications and possible applications of SEA-PS. Finally, we conclude the article, discuss the method’s strengths and limitations and discuss future directions in section 7.
2. Related works
2.1. Textual patent characteristics
Patents as technical information sources have several advantages over other documents [24]. First, the inner composition and discussed aspects are unified and given by patent law. Second, the unified structure in the patent database (e.g. DWPI) allows patents to be analysed as a whole or by four clearly defined fields: ‘title’, ‘abstract’, ‘claims’ and ‘technical description’. Third, patents are technical documents containing technical vocabulary without emotional or ornamental context, and therefore suitable for technological similarity.
Among the four major text fields, ‘title’ exists in most patent records, while other textual fields might be missing (see Table 1). Magerman et al. [13] consider titles as a widely and readily available information source. However, titles are short and thus uninformative of technical content. ‘Abstract’ is probably the most important data source [3,16], which summarises the invention and is intentionally rich with content keywords. Nevertheless, the editorial process of condensing text down can introduce selection effects that reduce precision or otherwise bias the analysis. ‘Claims’ defines the legally protected invention element by element, and provides a clean account of relationships between the protected elements [24,25]. However, patent claims are developed by lawyers and use disguised terms to cover broader areas for legal defensiveness and strategic reasons. ‘Technical description’ is also used in textual patent similarity analysis [14], which describes all technical details of the invention. When adopted in technological similarity measurement between patents, technical descriptions face the issue of containing broader content about contexts, backgrounds and technologies other than the technology itself. Due to the different characteristics of text fields, this article aims to explore which text fields are suitable for similarity measurement.
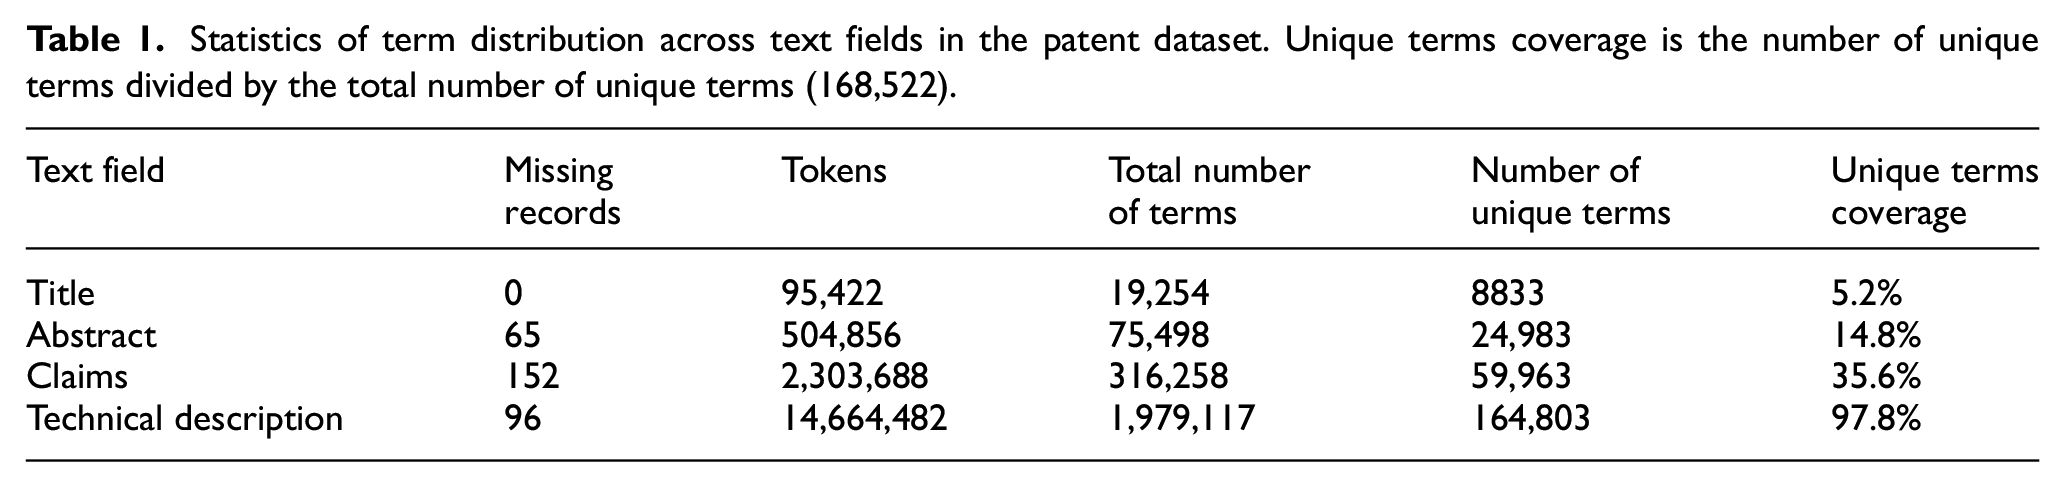
Statistics of term distribution across text fields in the patent dataset. Unique terms coverage is the number of unique terms divided by the total number of unique terms (168,522).
Stop-word removal is a necessary procedure in all the methods in textual patent studies. However, the inherent textual characteristics of patents are quite different from a general corpus [26]. A stop-word list of the common text might be fruitful for patent similarity analysis [27], but its lack of consideration of textual patent patterns limits the performance.
2.2. Textual patent similarity
The initial ideas of textual patent similarity focus on statistical distributions of keywords in patent documents [3]. Typically, the bag-of-words model collects unique keywords representing the patent’s technical content and computes the Jaccard similarity or overlap coefficient. The vector space model then considers the weight of keywords using term frequency-inverse document frequency (TF-IDF), which filters out common words and preserves more meaningful ones [14,28]. These methods request specific words to derive high similarity. To make the model more robust, latent semantic analysis (LSA) constructs a concept-by-document matrix using a low-rank approximation of the term-by-document matrix [13]. LSA merges dimension-associated terms into ‘concepts’ and relies on context rather than specific keywords. Thesaurus-based methods introduce expert knowledge through thesauruses such as WordNet [15], which contains relationships between words. The relationships in thesaurus then serve to denote semantic relatedness. The subject-action-object (SAO) model [16] further integrates syntactic information with thesaurus information and reaches a better performance level. However, thesaurus-based methods rely on large amounts of human efforts. In addition, current similarity metrics focus on only one text field, leaving a gap in the information fusion of text fields.
One of the closely related research areas is patent classification. Patent classification focuses less on identifying the most similar ones to a patent but more on the common patterns of a cohort of patents. Clustering and classification machine learning algorithms have been applied in this field, including k-nearest neighbour (KNN) [29], k-means clustering [30], support vector machine (SVM) [31,32], naïve Bayes (NB) [32] and artificial neural network (ANN) [33]. As text exists in the form of sequence data, recurrent neural networks (RNNs) and their variations are outstanding modelling algorithms. Zhu et al. [34] proposed a patent automatic classification method via a symmetric hierarchical convolution neural network named PAC-HCNN, which is more efficient than RNN. Li et al. [22] proposed DeepPatent for patent classification based on convolutional neural networks (CNNs) and word vector embedding. DeepPatent uses only title and abstract information and outperforms other patent classifiers based on description sections and many feature engineering applications. Lee and Hsiang [35] fine-tune the Bidirectional Encoder Representations from Transformers (BERT) language model and apply it to patent classification using patent claims, which is reported to outperform DeepPatent.
2.3. Word embeddings to model semantic relatedness
To preserve syntactic and semantic relationships, word embedding is one of the most potent techniques in natural language processing. Through the assignment of high-dimensional vectors, words are represented in a single and continuous vector space. Then, relatedness analysis could be conducted on these embeddings. Typical implementations of word embedding are Word2vec, GloVe, ELMo and BERT [19,36–38]. GloVe and Word2vec are static word embeddings, that is, the parameters of the models freeze after the training process. ELMo and BERT are contextualised word embedding methods. That is, the word vectors are dynamic according to their context. Liu et al. [39] carefully measured the impact of many key hyperparameters and training data size, and significantly improved the performance of BERT. Beltagy et al. released word embeddings from scientific publications called SciBERT to promote downstream scientific NLP tasks [40]. Tshitoyan et al. [41] successfully captured latent knowledge from the materials science literature with Word2vec, and predicted new thermoelectric materials. These studies demonstrate that word embeddings can capture technical relatedness from the literature.
Before mining technical semantic relatedness, a key is to identify minimum analytical units (e.g. technical terms). A technical term is a word or phrase with a specific meaning within a specific field of expertise. In typical information-theoretic frameworks such as term frequency and inverse document frequency (TFIDF), single words or n-grams make up the minimum analytical units [22]. Prior research shows that n-gram phrase encoding contains more information than a single-word scheme [42]. In addition, combinations of unigrams and n-grams composed of at most three words performed better than unigrams alone [32]. These studies indicate that some of the informative textual features are hidden in bi-grams and tri-grams. However, the majority of these n-grams are not technical terms, leading to noises due to the writing manner of patent applicants; for example, tri-gram ‘invention claims that’ may be used by a group of applicants, and the tri-gram’s frequent appearances cause the similarity degrees among these patents to rise. Therefore, identifying informative technical terms is important before conducting further analysis [17].
2.4. Attention mechanism
The attention model has become an essential architecture in the artificial intelligence community for a wide range of applications in natural language processing, statistical learning, speech recognition and computer vision. The idea behind the attention mechanism is that humans would perceive language or vision selectively. We focus on the critical point while ignoring other irrelevant information.
The attention mechanism was first proposed for machine translation tasks [20]. The basic form computes a scalar score
Another interest in modelling attention is interpretability [46], because it allows us to inspect how opaque neural networks work intuitively. The hypothesis is that weights in the attention layer positively correlate with how important a specific input is.
3. Research objectives
This article aims to leverage various text fields to measure pairwise patent similarity according to their technological bases. Based on these previous studies, we have several summarisations on the gaps in patent similarity research.
First, which text field is the most appropriate for measuring patent similarity remains controversial. There is a gap to quantitatively assess and leverage the technical information in these text fields. Second, the semantic relatedness between technological bases in patents needs to be modelled more accurately. The current thesaurus-based model relies on a massive amount of expert effort, which works only when the technical terms are contained in the thesaurus. Third, uninformative words due to the drafting style of patents raise another challenge when identifying the technological bases. The English stop-word list generally adopted in existing studies is not enough. Fourth, the technical focuses of similar patents differ if the linkages between technology bases are different. From this perspective, an approach to differentiate the representativeness of these technological bases is lacking.
This study uses the technical terms in textual patent content to denote patents’ technological bases. To achieve our research aim and fill in the gaps mentioned above, the research objectives of this study are listed as follows:
To identify the technological bases and model the semantic relatedness between them;
To develop a stop-word list considering the drafting style of patents to improve the quality of technical terms extraction;
To differentiate the importance of the technological bases within a specific patent, inter-technology relationships should be considered;
To assess the technical information in the text fields, and integrate their semantics at the patent level;
To learn pairwise similarity metrics based on semantic representations of patents.
4. Methodology
4.1. Overall framework
Figure 1 depicts the overall framework of the SEA-PS method proposed in this article. The key steps are as follows. First, the original textual data are preprocessed. The textual data require tokenisation and denoising before further analysis. Commas and full stops are retained as they are necessary in technical term extraction and the graph-based model. Second, informative technical terms are extracted and vectorised. Third, the vector representations of text fields are derived by allocating weights to technical terms with a graph-based method. Fourth, vector representations of a patent’s text fields are aggregated through an attention layer, and pairwise patent similarity is computed through cosine distance.
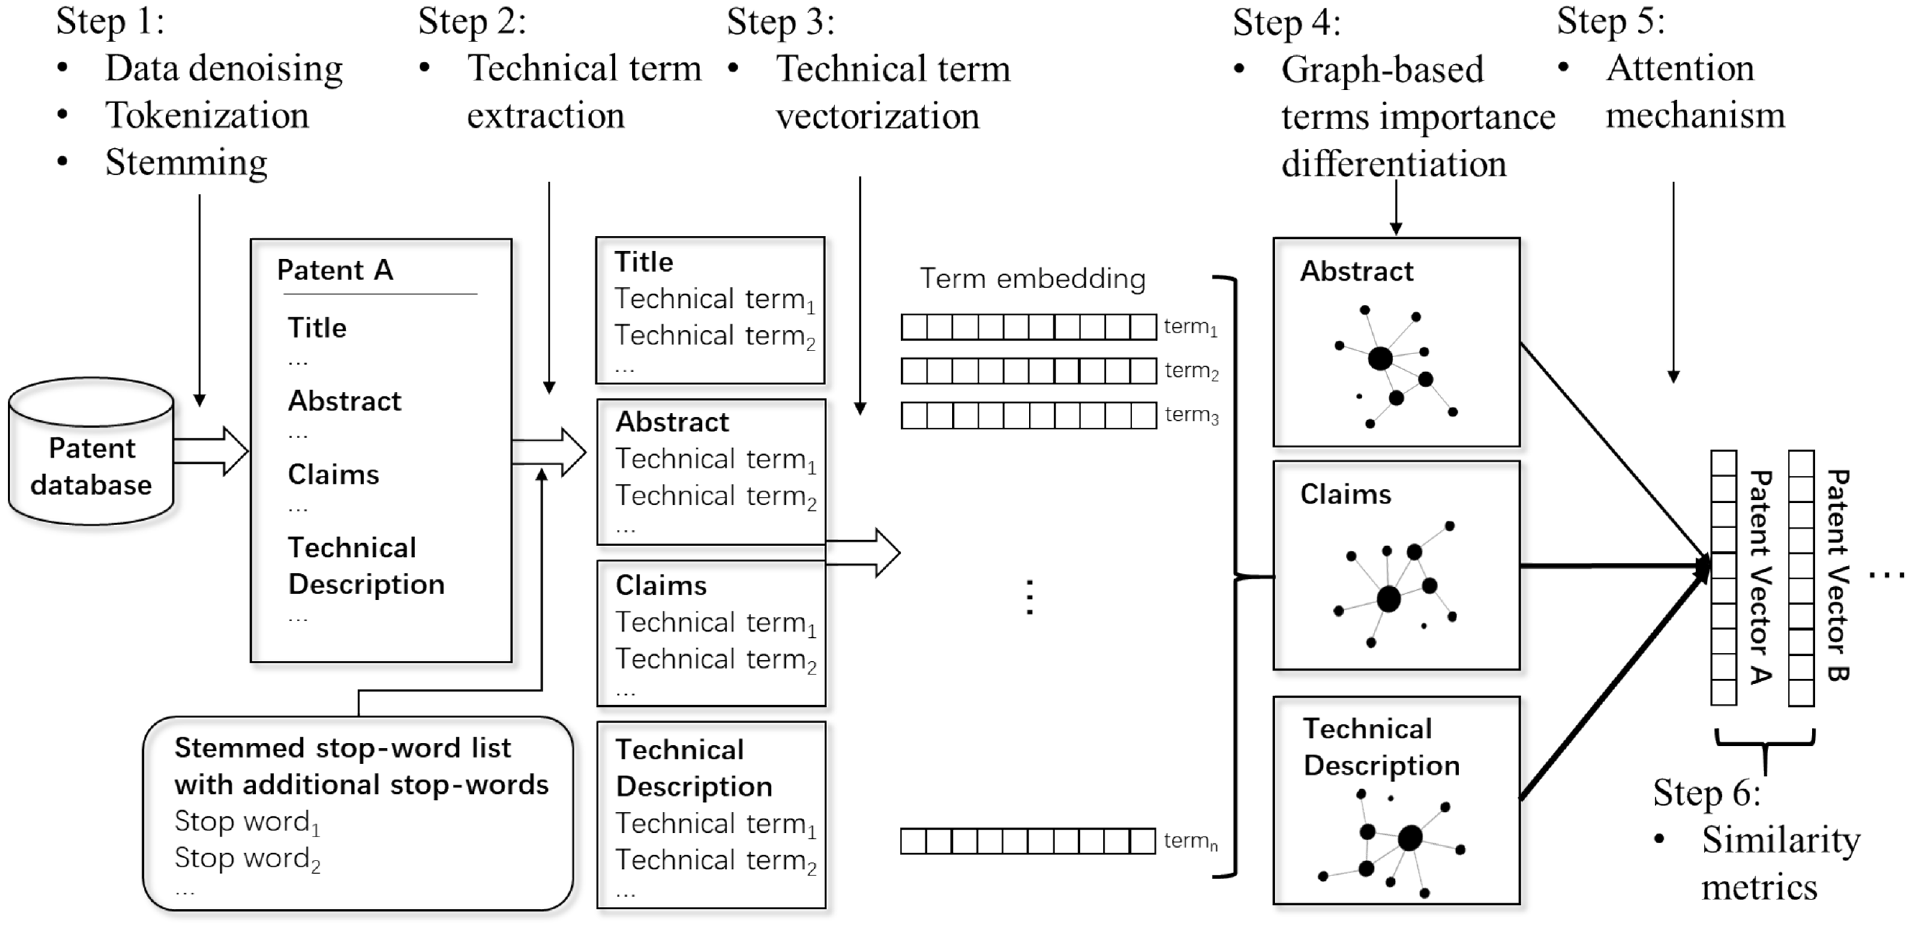
The framework of the semantic embedding model for measuring patent similarity.
4.2. Patent data and preprocessing
As stated in the previous section, which patent field of textual content is the most appropriate for semantic similarity measurement remains controversial. Therefore, this article’s main innovation is to leverage all possible text fields to calculate the semantic similarity between arbitrary pairwise patents. In this study, we select abstract, claim and technical description as patent textual content sources to measure pairwise patent similarity. The raw text contains considerable noise information that hinders subsequent modelling. Therefore, we first perform the preprocessing steps to clean the data, including the following:
Transform the corpus into a line-sentences format while recording the meta-data of these sentences, namely patent number and the fields they belong to;
All the text is normalised to lowercase letters to avoid additional vocabulary;
Retain commas and full stops but remove other punctuations. Remove all the numbers;
Use Porter stemmer to stem all the words.
It is worth mentioning that the stemming process is an effective way of disambiguating words [47–49]. Lemmatisation is an alternative [17,50,51]. However, neither of the two algorithms can perfectly disambiguate words. While stemming raises type II error, lemmatisation raises type I error. That is, we found that terms pointing to the same entity can be missed by lemmatisation. For instance, ‘machine center’ is one of the most common technical terms in our dataset, but some applicants write it as ‘machining center’. When part-of-speech (POS) tagging algorithm does not assign ‘machining’ as a verb in the context, lemmatisation fails. Moreover, morphological analysis of lemmatisation depends heavily on thesaurus such as Wordnet. In contrast, stemming is more robust, so that infrequent technical terms are less likely to be missed and have more corpus to train the word embedding (n-gram-based statistical algorithm requires minimum threshold of appearance of terms). Stemming is used in our method after comparing the performance of two methods.
Although stemming may result in the formation of n-grams that do not exist in reality, the obscure n-grams works well as long as they correctly maps to technical terms. In some tasks that these n-grams matter, a dictionary can be created to recover the n-grams to its original form, that is, technological theme detection.
4.3. An additional stop-word list for patent similarity
Stop-word removal is a necessary procedure in all studies or applications of textual patent similarity, which results in significantly higher performance of the analysis. Depiction of technical details requires diagrams, formulas, which contain specific phrases that bias the similarity calculation. Moreover, claims of patents are usually developed for legal defence by attorneys, and therefore the legal terms must be removed to avoid similarity caused by the drafting style of attorneys. Taking these inherent textual characteristics of patents into account, an additional stop-word list for patent similarity analysis is desired.
To design the stop-word list, we first choose the stop-word list of NLTK (Natural Language Toolkit, developed by the University of Pennsylvania) as a base list. NLTK’s English stop-word list is widely adopted in patent analysis [17,52,53], which contains 179 stop-words, including common conjunctions and prepositions. We aim to determine an extended stop-word list based on NLTK’s list, together with NLTK’s list, to satisfy the task of stop-word removal in patent similarity analysis.
Then a procedure to build such a stop-word list is developed as follows:
Mark all the stop-words in the patent corpus, starting with NLTK’s English stop-word list;
Adopt word2phrase to extract technically meaningful n-gram terms (1-grams are excluded), obviating marked stop-words;
We manually investigate terms ranking in the top 1000 in frequency and terms in 5 randomly selected patents;
Append words to the stop-word list that cause noise in term extraction;
Repeat Steps 1–4 until no new word is found to be a stop-word.
As a result, we build an extended list with 70 words, as shown in Appendix 1, as a stop-word list for patent similarity analysis. When examining the extracted terms, we adhere to the principle that only the words, whose noise-to-signal ratio is relatively high should be considered as stop-words.
Our method suggests an additional stop-word list. Considering that stemming or other preprocessing procedures are necessities, stop-words provided in the list are in basic form. In this case, the plurals, adjectives and alternate verb forms of a word are first transformed to a uniform representation. The base list can be replaced, and more domain-specific uninformative words can be added as the corpus varies.
4.4. Informative terms extraction and vectorisation
One of the keys to textual patent similarity measurement lies in technical terms. With a preprocessed corpus, informative terms are then extracted and mapped into a low-dimensional vector space, which is dense, continuous and therefore practical for modelling the semantic relationships between terms. To identify informative terms, we focused on n-grams from n = 2 up to n = 4 because n-grams encode more information than single words. For example, while single words ‘machine’ and ‘tool’ appear in many patents across engineering sectors, the majority of patents containing ‘machine tool’ are classified in B23 (an IPC code for patent classification); empirically, similarity degrees among patents in the same classification are relatively high, which denotes that ‘machine tool’ encodes more precise technological information.
We enforce additional constraints on a statistical method based on n-grams [19], also known as word2phrase. The original method performs well overall but results in phrases including stop-words. Thus, we adjusted to allow the introduction of stop-words. Given adjacent single words

where parameter
We utilised an unsupervised word embedding method to map all the informative terms into a single continuous vector space. Prior study demonstrated that skip-grams had better performance in semantic analysis tasks [54]. Therefore, we chose skip-gram rather than other embedding methods. With a shallow neural network, the skip-gram model is trained to be capable of reconstructing the context of words. It feeds each current word to a log-linear classifier with a continuous projection layer and attempts to predict the context by optimising a neighbourhood-preserving likelihood objective (Figure 2).
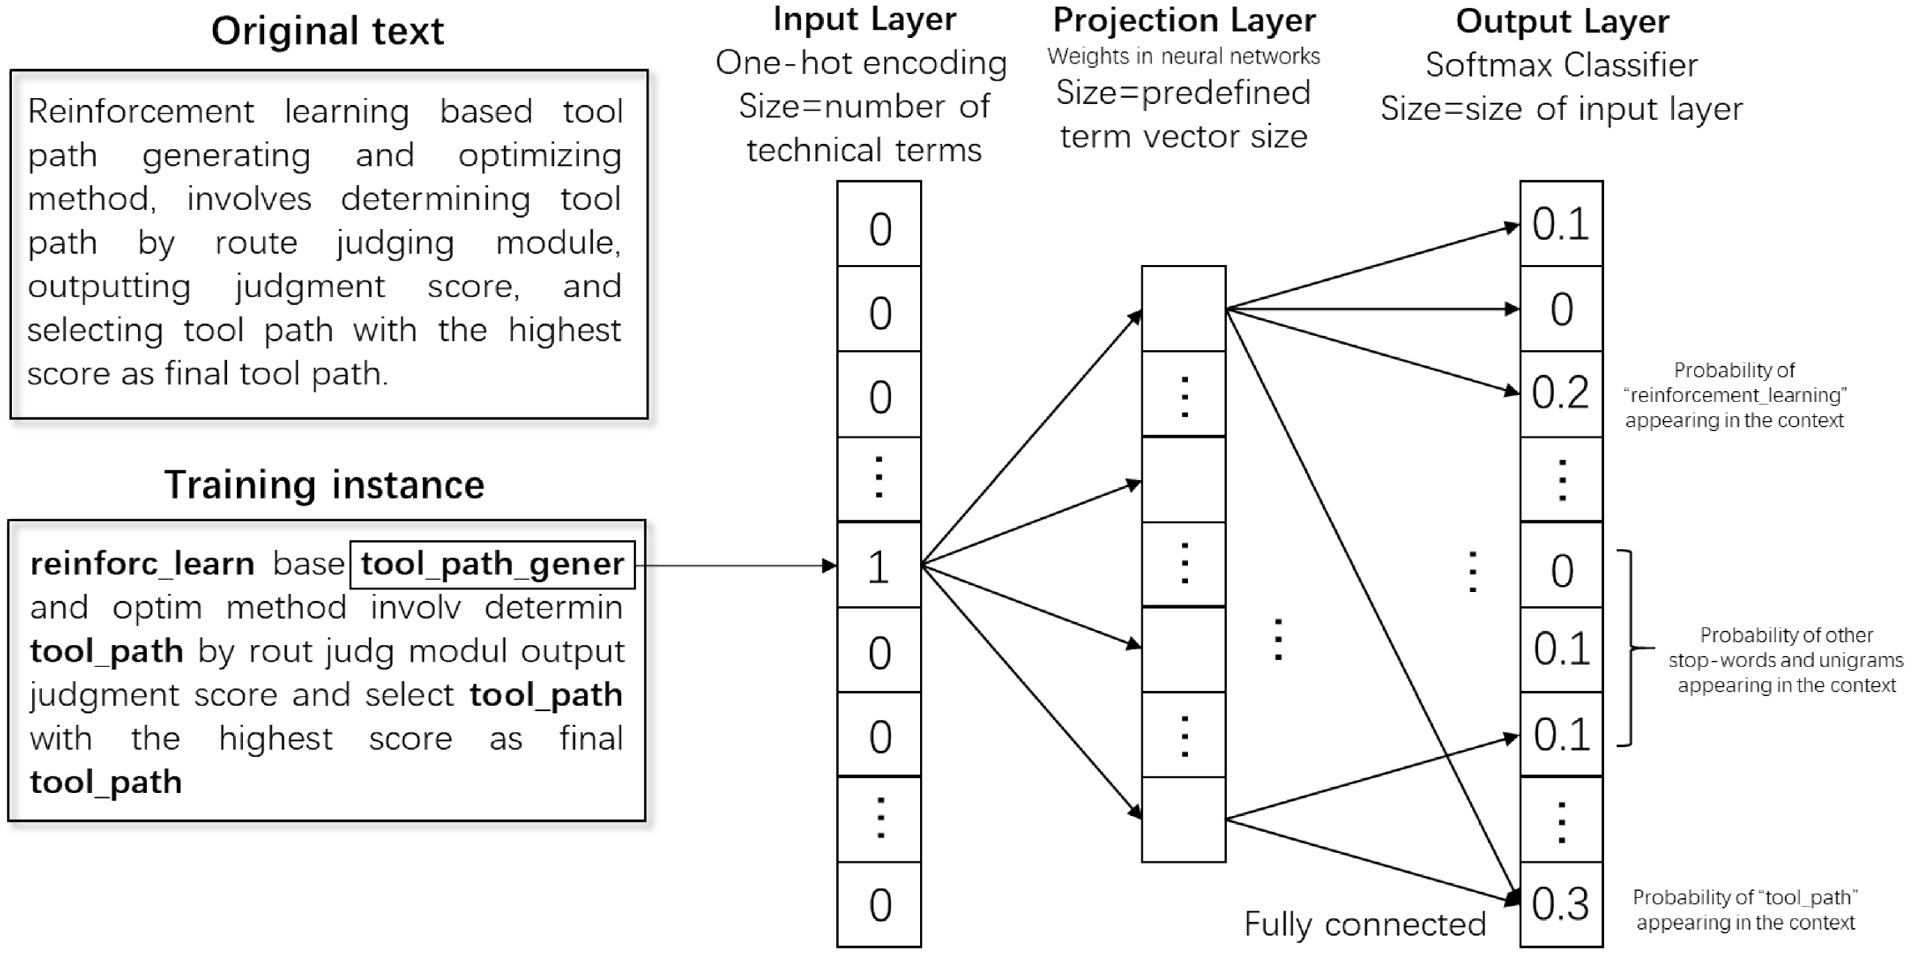
Overview of term embedding trained by the skip-gram architecture.
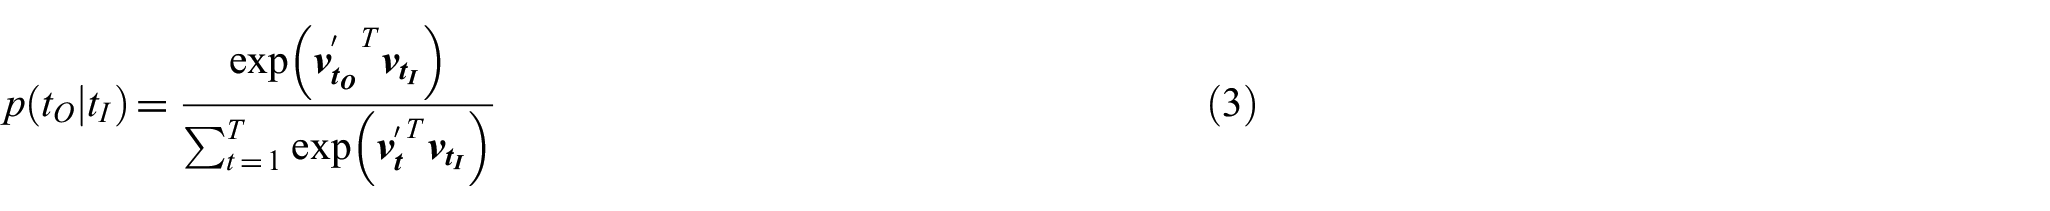
Given the width

where
Note that stop-words and other unigrams, which also provide the necessary information, are kept in the training process. Without eliminating these parts of sentences, more accurate and representative vectorisation can be achieved.
4.5. Patent representation with attention
The highlight of our model is to aggregate various textual information of a patent, namely title, abstract, claims and a technical description. Having informative terms extracted and vectorised, we now move forward to model the textual content representation of different patent fields based on these term embeddings. The key idea is allocating weights to the informative terms.
Existing keyword extraction methods provide insight into the importance ranking of words and phrases. Graph-based ranking algorithms provide a means to decide the importance of a vertex within a graph based on global information recursively drawn from the entire graph. It has been proved that Textrank outperforms simple term frequency in identifying keywords in single document [55]. Therefore, we replace the term frequency in TF-IDF with weights of technical phrases to improve keywords detection in a single text field. There is a slight difference between the approach in this article and Textrank. In this article, the technical phrases are first recognised and then treated as a vertice in the graph.
To build a graph from the textual content, we use co-occurrence relations controlled by the distance between lexical units. The graph’s vertices are composed of words and phrases, while their co-occurrence links within a slide window of a maximum of N-words form the edges. We derived the weights of corresponding lexical units within a patent by ranking the importance of the vertices.
Given

where
When a ‘machine tool’ is identified as one of the key phrases of a particular patent, the phrase is nonsignificant if most patents in the portfolio to be analysed contain a ‘machine tool’. In the information retrieval system, the idea of inverse document frequency provides a concise and effective way to discriminate the weights of specific lexical units across documents. The final weights of tokens

where
Then, let text field

where
Considering that the patents are composed of four different textual content fields, the critical issue is how to aggregate them into a single patent representation. Here we add an attention layer to distinguish the importance of different fields and pay more attention to representative textual content.
Generally, the scoring function of the hidden layer (or intermediate feature vectors) is an activation function, with intermediate matrix

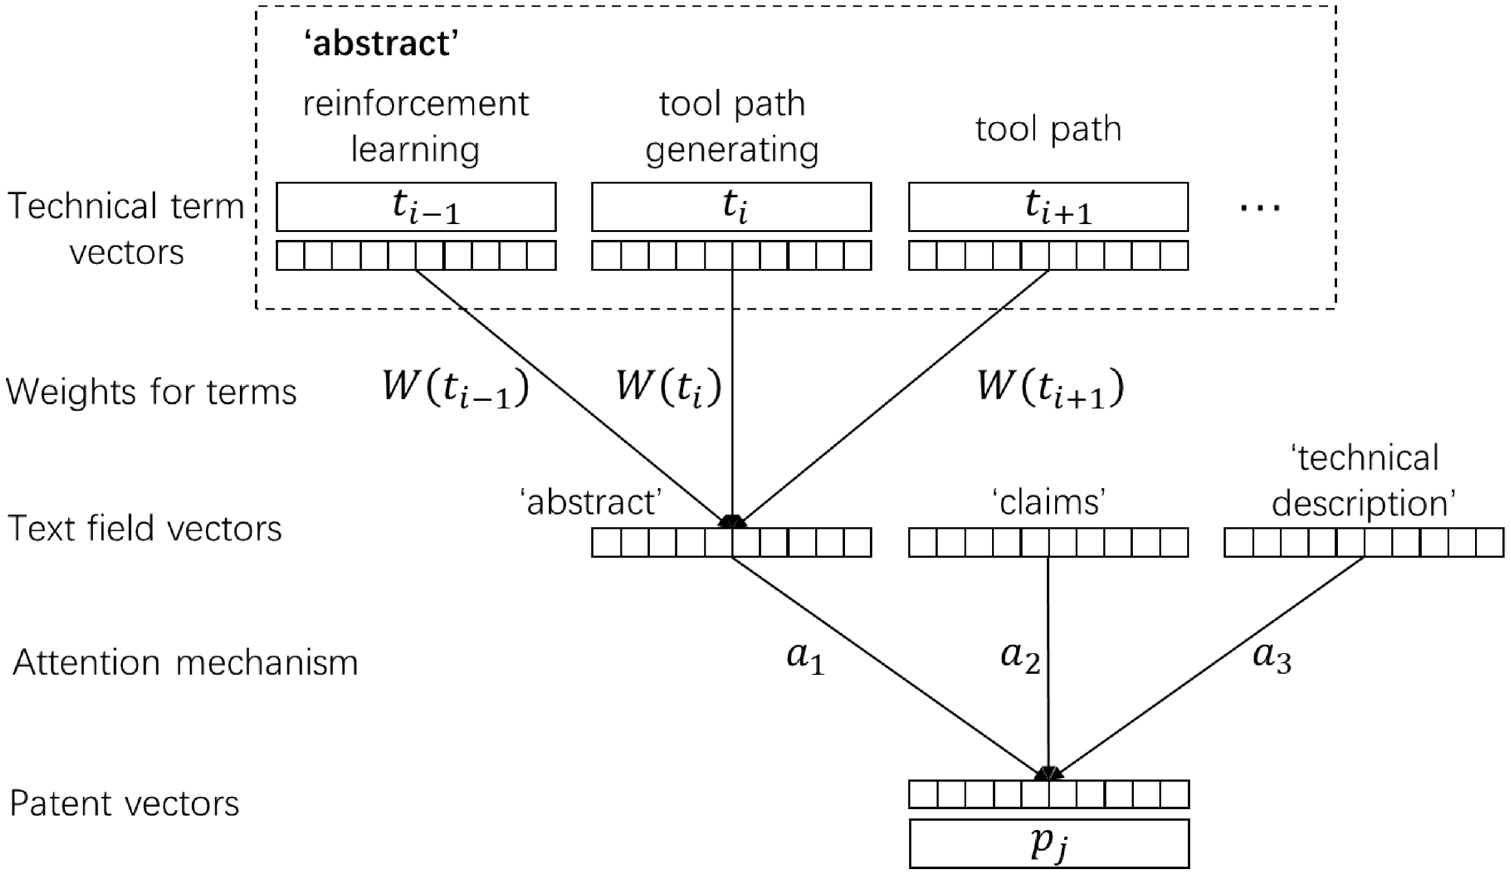
Overview of aggregating text fields into the semantic representation of patents.
First, the vector representations


where
To measure patent similarity, we calculated the cosine of the angular separation

In this way, we have similarity result
5. Experimental results and discussion
To verify the effectiveness of the method proposed in this article, we retrieve patents related to the intelligent machine tool. Machine tools are the essential equipment in the manufacturing industry, and intelligentisation is a significant development trend. The search strategy was made by a group of experts in the machine tool domain through several rounds of discussion. A total of 4149 patents granted between 1 January 1997 and 1 September 2019 were retrieved from the Derwent Innovation patent database.
5.1. Evaluation of technical terms extraction
After the preprocessing of original text data from the four text fields, we extracted the technical terms with the constraint of our proposed stop-word list. The discounting coefficient
The statistics confirm that there are barely any missing records in titles. Considering that only 2266 (54.6%) out of 4149 patents have backward citations, our method is highly reliable compared with traditional citation-based methods. Among the four text fields, technical description has the highest coverage of unique terms at 97.8% (the total number of unique terms is 168,552). Facing the problems of irrelevant technical terms presence and obscureness of the patent’s theme, technical descriptions still have the vast majority of technical information. In contrast, the average number of terms in titles per patent is insufficient, at approximately 4.64. The terms in titles are highly representative, but its sparsity also leads to bias.
A skip-gram is then used to map terms into a dense and continuous vector space. In previous studies [22,57], researchers adopted different hyperparameters in such algorithms, particularly the dimension of vector space and sliding window size. Practical studies on word embedding models vary the vector space dimension from
After the vectorisation of technical terms, we evaluated the performance of the semantic relationship between terms. The primary purpose of mapping the technical terms into the same vector space is to provide a basis for lexical–semantic analysis, such as term similarity and term analogy. The quality of vector representation would affect the representation of text fields and further the similarity results. A classic example is that the analogy ‘king is to queen as man is to woman’ can be inferred by the vector equation
Top 10 related terms of vector ‘numerical control machine tool-machine tool + lathe’.
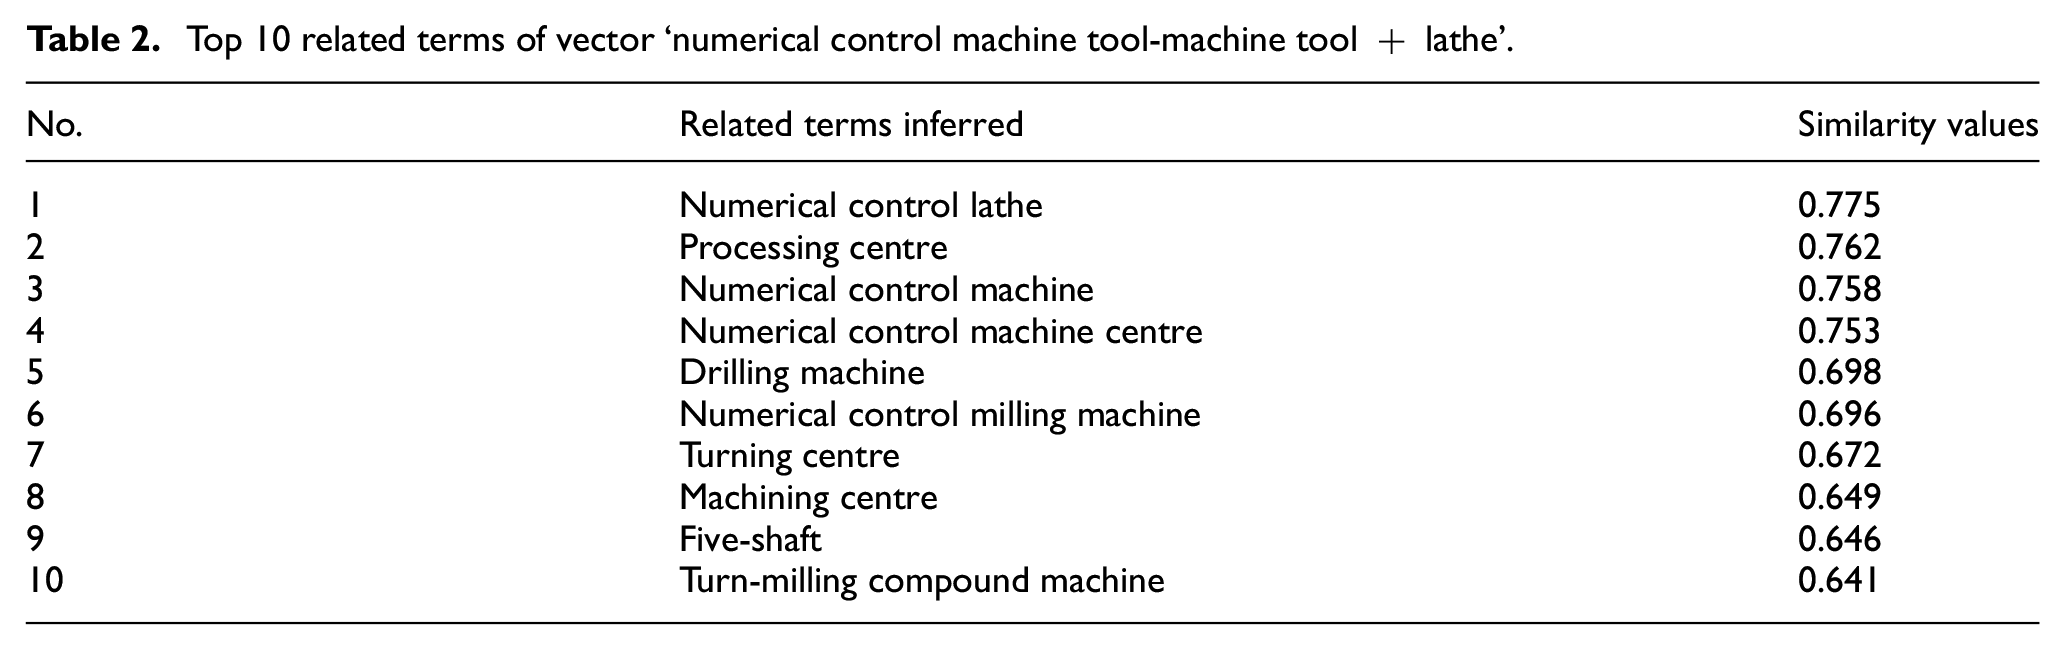
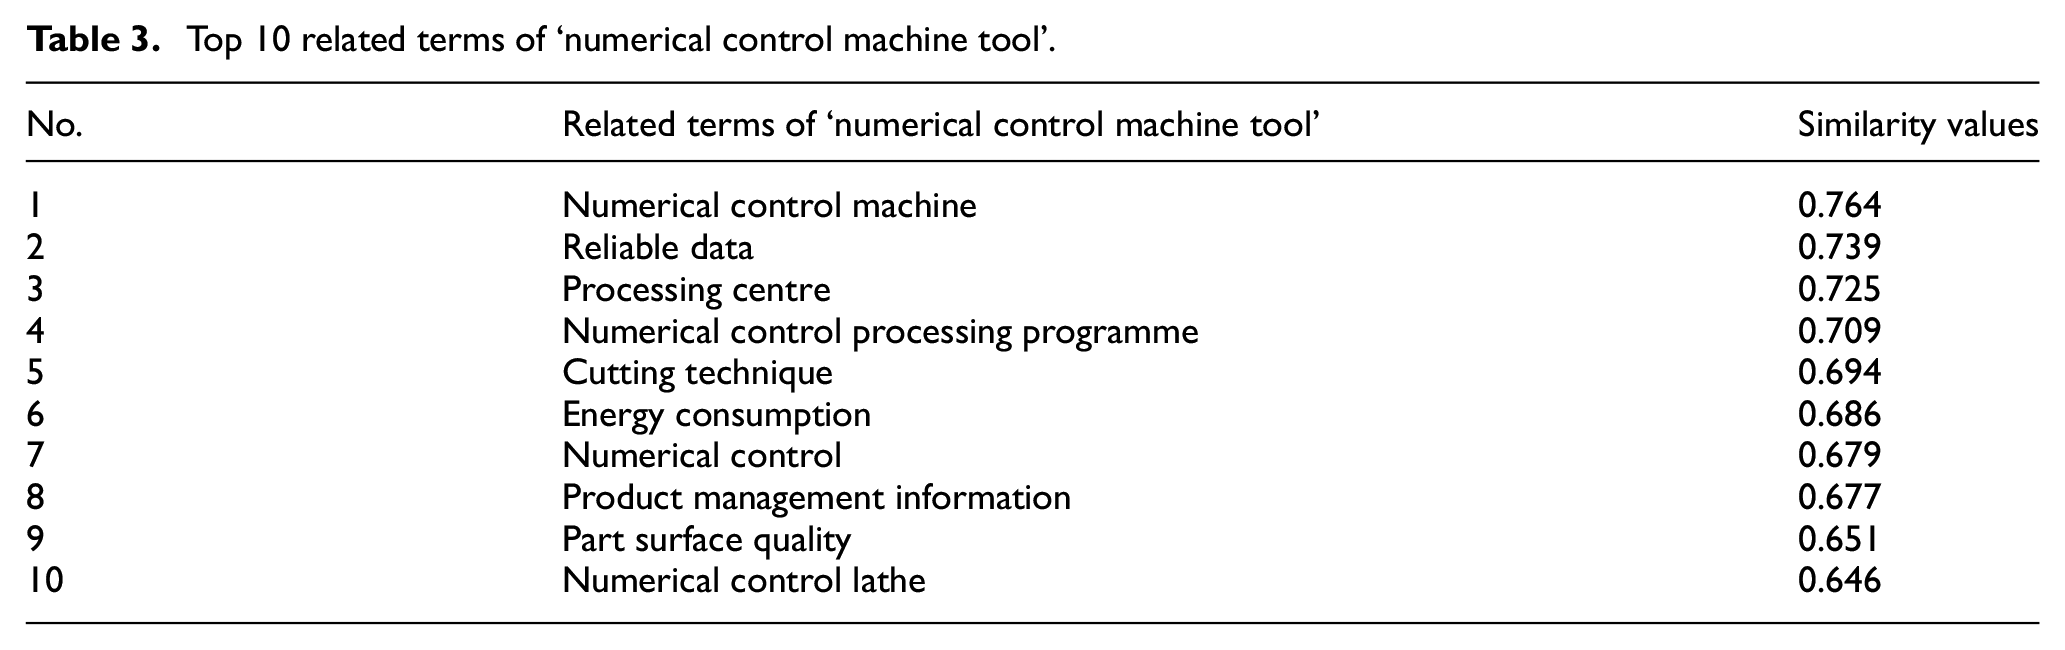
We searched for most related terms of numerical control machine tool (NC-MT) (Table 3). We checked on the original data and found that some applicants use ‘numerical control machine’ instead of ‘numerical control machine tool’, and they actually point to the same entity. Found in the vector space, numerical control machine is the most related term. Another piece of evidence is that the processing centre ranks third in related terms of the NC-MT, with a semantic similarity of 0.725. In some cases the two terms refer to the same entity. Most of the rest terms are technological focuses of NC-MT. This illustrates the power of term representation to identify terms of high semantic relevance with entirely different words. Therefore, it enables the possibility of identifying similar patents with different context words.
Top 10 related terms of ‘numerical control machine tool’.
5.2. Content validity via patent classification
Due to the different characteristics of text fields, there is no consensus on which the text field performs the best in prior research. Thus, content validation evaluates the effectiveness of various text fields for measuring patent similarity.
We cluster the 4149 patents into groups using agglomerative clustering, with single and various combinations of these text fields as input separately. The variable in this experiment is the text fields used. Therefore, the better the clustering performance is, the more effective the input text field(s) is/are. In agglomerative clustering, the distance between patents is denoted by their similarity, while the distance between patent groups is derived by averaging the pairwise patent similarities.
To evaluate the performance of clustering, we extract the 4-digit IPC code of each patent as labels. Patent classification is a system for organising patent documents into hierarchical collections based on their subject matter. Patent authors assign the classification, and the patent attorney may modify or assign additional classification (a patent may be cross-classified into many different classes and subclasses). The IPC codes are thus precious manual annotations. We treated these IPC codes as gold standard to see which combination of text fields output the closest classifications. We set the agglomerative clustering algorithm to cluster patents into 205 groups, as there are 205 4-digit IPC in total. Then, we evaluate the clustering result on three indicators, that is, normalised mutual information (NMI) score, completeness score and homogeneity score. Formally

I is mutual information

where

The completeness score and homogeneity score are proposed by Rosenberg and Hirschberg [60]. Formally, homogeneity score is defined as follows


where
Completeness score is symmetrical to homogeneity, and is defined as follows


Parameter
Effectiveness evaluation of various text fields via patent similarity-based unsupervised hierarchical clustering through 4-digit IPC code. Equal-weighted in parenthesis means the attention layer is replaced by a equal-weighted sum of text field vectors. Bold values are the maximum values of the columns.
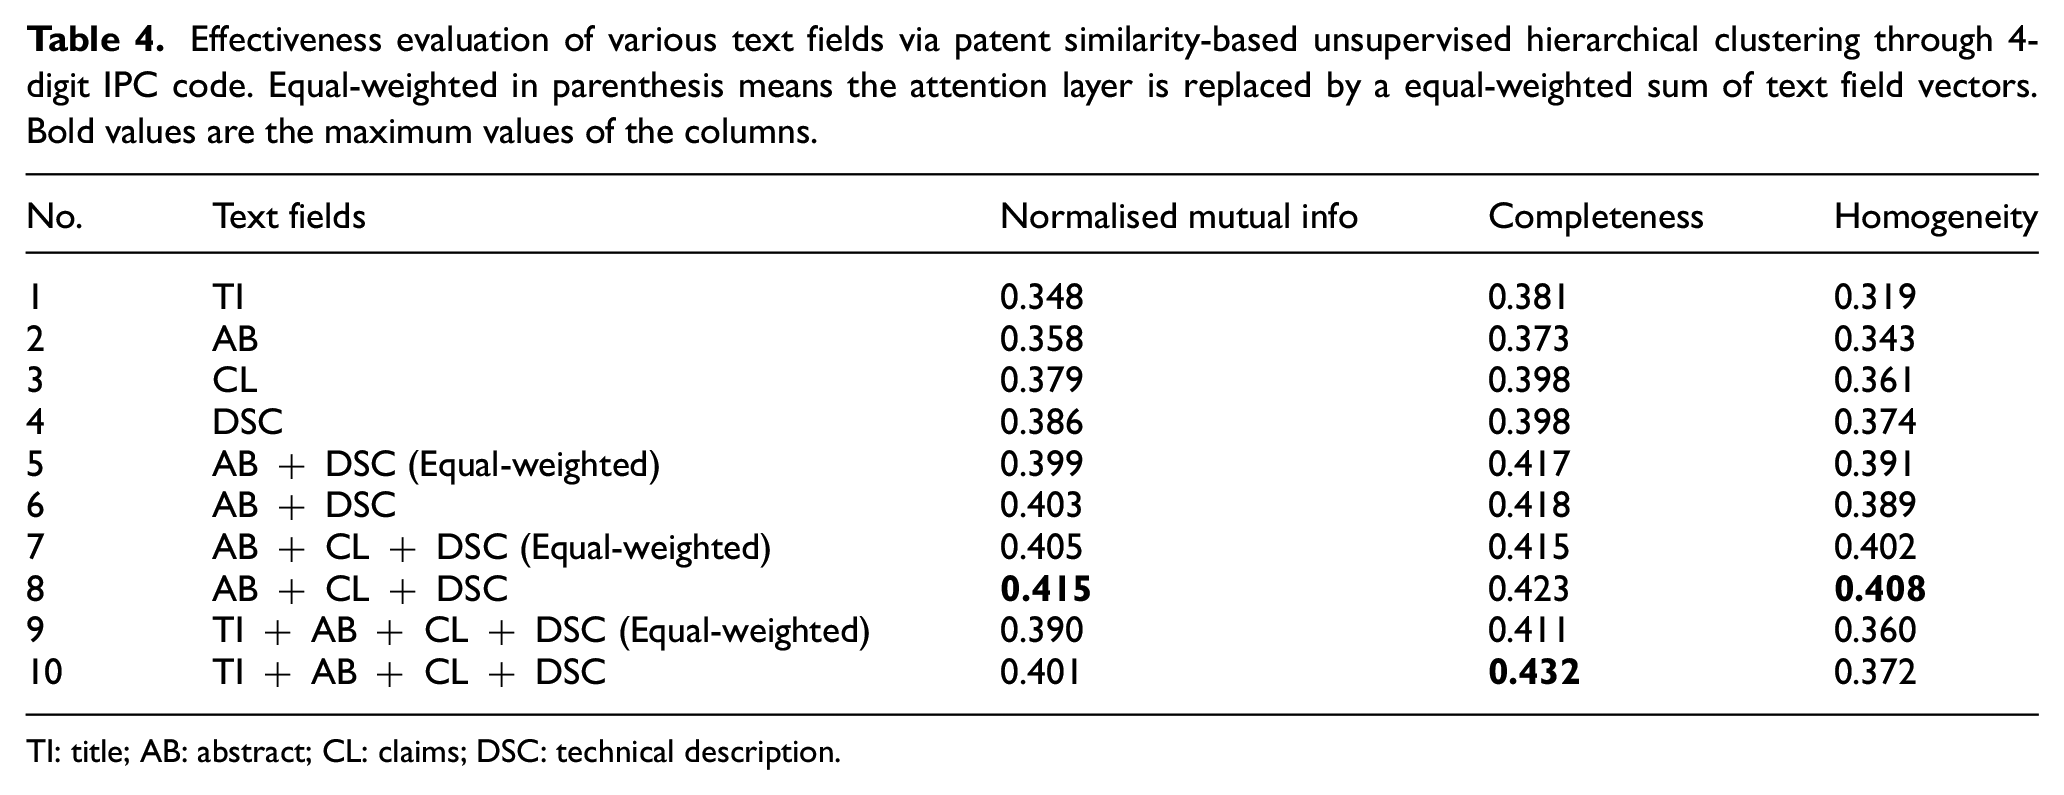
TI: title; AB: abstract; CL: claims; DSC: technical description.
The second content validation is whether SEA-PS scores higher when public perception believes that patents should be more similar. In this case, we bring in patent classification. The goal of classification is to gather highly similar patents together for information retrieval and management. Moreover, two patents within the classification should be more similar at a finer granularity of classification.
Next, we show that the SEA-PS correctly distinguishes granularity. Several standard classification systems exist, while the IPC, organised by the World Intellectual Property Organisation (WIPO), is the most widely utilised in patent analysis. We evaluate the distribution of patent similarity at different levels of IPC granularity. First are the random pair-samples across all classifications in our dataset, with 8,605,026 pairwise similarity results from 4149 patents. Then, from coarse to fine granularity, that is, B23B, B23B0005, B23B000500, we calculate 226,168 results out of 673 patents, 946 results out of 44 patents and 55 results out of 11 patents in these classifications, respectively. We compare SEA-PS with the basic co-classification and co-citation methods. Due to the limited numbers of IPCs and citations of a patent, the similarity distribution using variations of the co-classification and co-citation methods does not change significantly. Formally


where
In Figure 4(a), different greyscales represent the breakdown of similarity values at different levels of IPC granularity. More generally, Figure 4 presents a direct comparison of similarity distributions of text-based methods against the co-classification and co-citation methods. The similarity values of SEA-PS, co-classification method and co-citation method are distributed from −1 to 1, 0 to 1 and 0 to 1, respectively. A high value represents high similarity. The proportion of similarity below 0 virtually vanishes as the granularity decreases, while the proportion of similarity above 0.8 radically increases from 2.9% to approximately 43.6% at the finest granularity. Other text-based measures are expected to have similar distribution close to Figure 4(a). Next, to evaluate whether inter-class similarity differences are significant, we conduct the Mann–Whitney U test [61]. The results are significant in all groups of tests, including random patent pairs-B23B (patent pairs in group B23B), B23B-B23B0005, and B23B0005-B23B000500, at the level of p < 0.01.
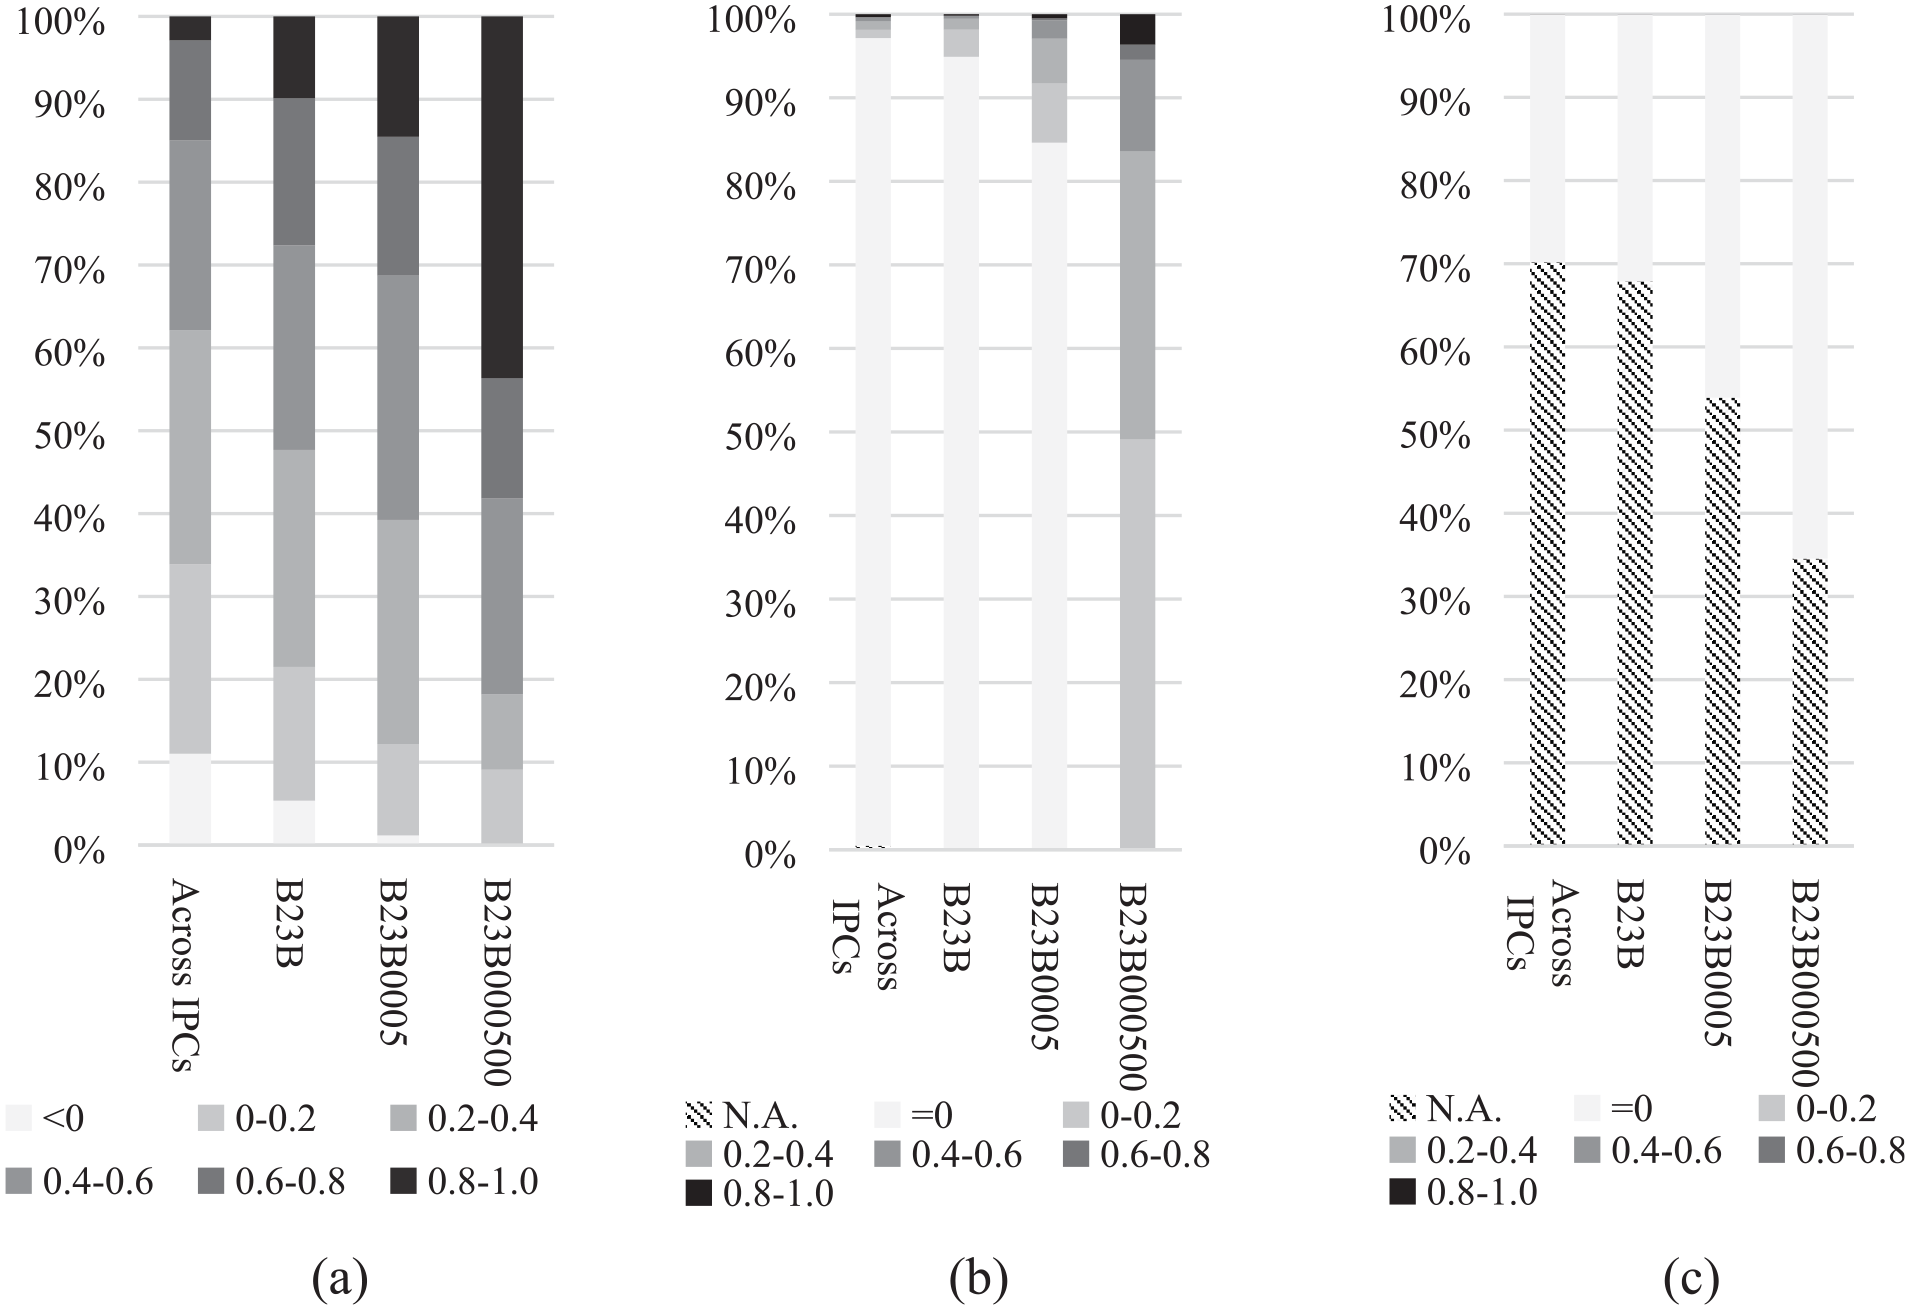
Distribution of pairwise patent similarity values within the same IPC classifications at different levels of granularity. Across IPCs represent random patent pairs in our whole datasets (a) SEA-PS, (b) co-classification method and (c) co-citation method.
In Figure 4(b), the co-classification method also reflects the granularity of classifications. However, a large proportion of pairwise similarity at coarser granularity is zero, when pairwise patents do not have a same IPC code. In fact, these patents cannot be totally irrelevant to each other. This phenomenon can also be seen in the co-citation method in Figure 4(c). Moreover, since a large proportion of patents do not have citation, their similarity cannot be calculated. These two methods are utilised more in measuring similarity of patent portfolios, but their performance of measuring pairwise similarity is not good.
5.3. External validity against human perceptions
To further evaluate the performance, we test the external validity of the SEA-PS method against human perceptions. We invited four experts from Huazhong University of Science and Technology, including two professors and two doctoral students. The experts are highly familiar with the anchor patent domain. The anchor patent is shown in Table 5.
The textual content of anchor patent. The technical terms extracted are phrases connected by underscores.
IPC: international patent classification.
We compare the proposed method with VSM and LSA, which are the existing methods in this field. In addition, we compare the result with an advanced document embedding method [62], namely a paragraph vector with a distributed bag of words (PV-DBOW, also referred to as Doc2vec). Although this method has not been formally applied in patent similarity measurement, it achieves excellent performance in document similarity metrics, classification and sentiment analysis. PV-DBOW predicts words randomly sampled from the paragraph vector in the output and optimises the model’s parameters through iterations of stochastic gradient descent (or other backpropagation algorithms). For the VSM method, we strictly follow previous research [14], which focuses on the technical description. We adopted the LSA method and parameters from another study [13] that measured similarity on titles and abstracts.
BERT model has drawn much attention in the latest researches. The skip-gram model used in this article can be deemed as a module, which can be replaced by other word embedding methods. Therefore, we switch skip-gram to BERT in the framework to test whether the representation power of BERT improves the result. We leverage the uncased BERT pretrained model. 1 The implementation follows the fine-tuning example in the BERT project.
There are some reasons that citation-based, classification-based and SAO methods are not selected for comparison. First, only 2266 (54.6%) out of 4149 patents have backward citations, and 3379 (81.4%) patents have no more than 5 citations. This demonstrates the sparsity of patent citations, which result in the null value and the roughness of similarity measurement. Second, while classification-based methods also face the challenge of sparsity (not enough IPC codes assigned), the method’s main problem is that it fails to differentiate patents within a specific class. Therefore, citation-based and classification-based methods are not suitable for measuring the pairwise similarity of patents. Third, SAO methods rely heavily on the hierarchical structure of terms, requiring a tremendous amount of effort from experts to construct. Thus, the results of the SAO method are unstable due to the expert effort, which cannot be guaranteed in our experiment.
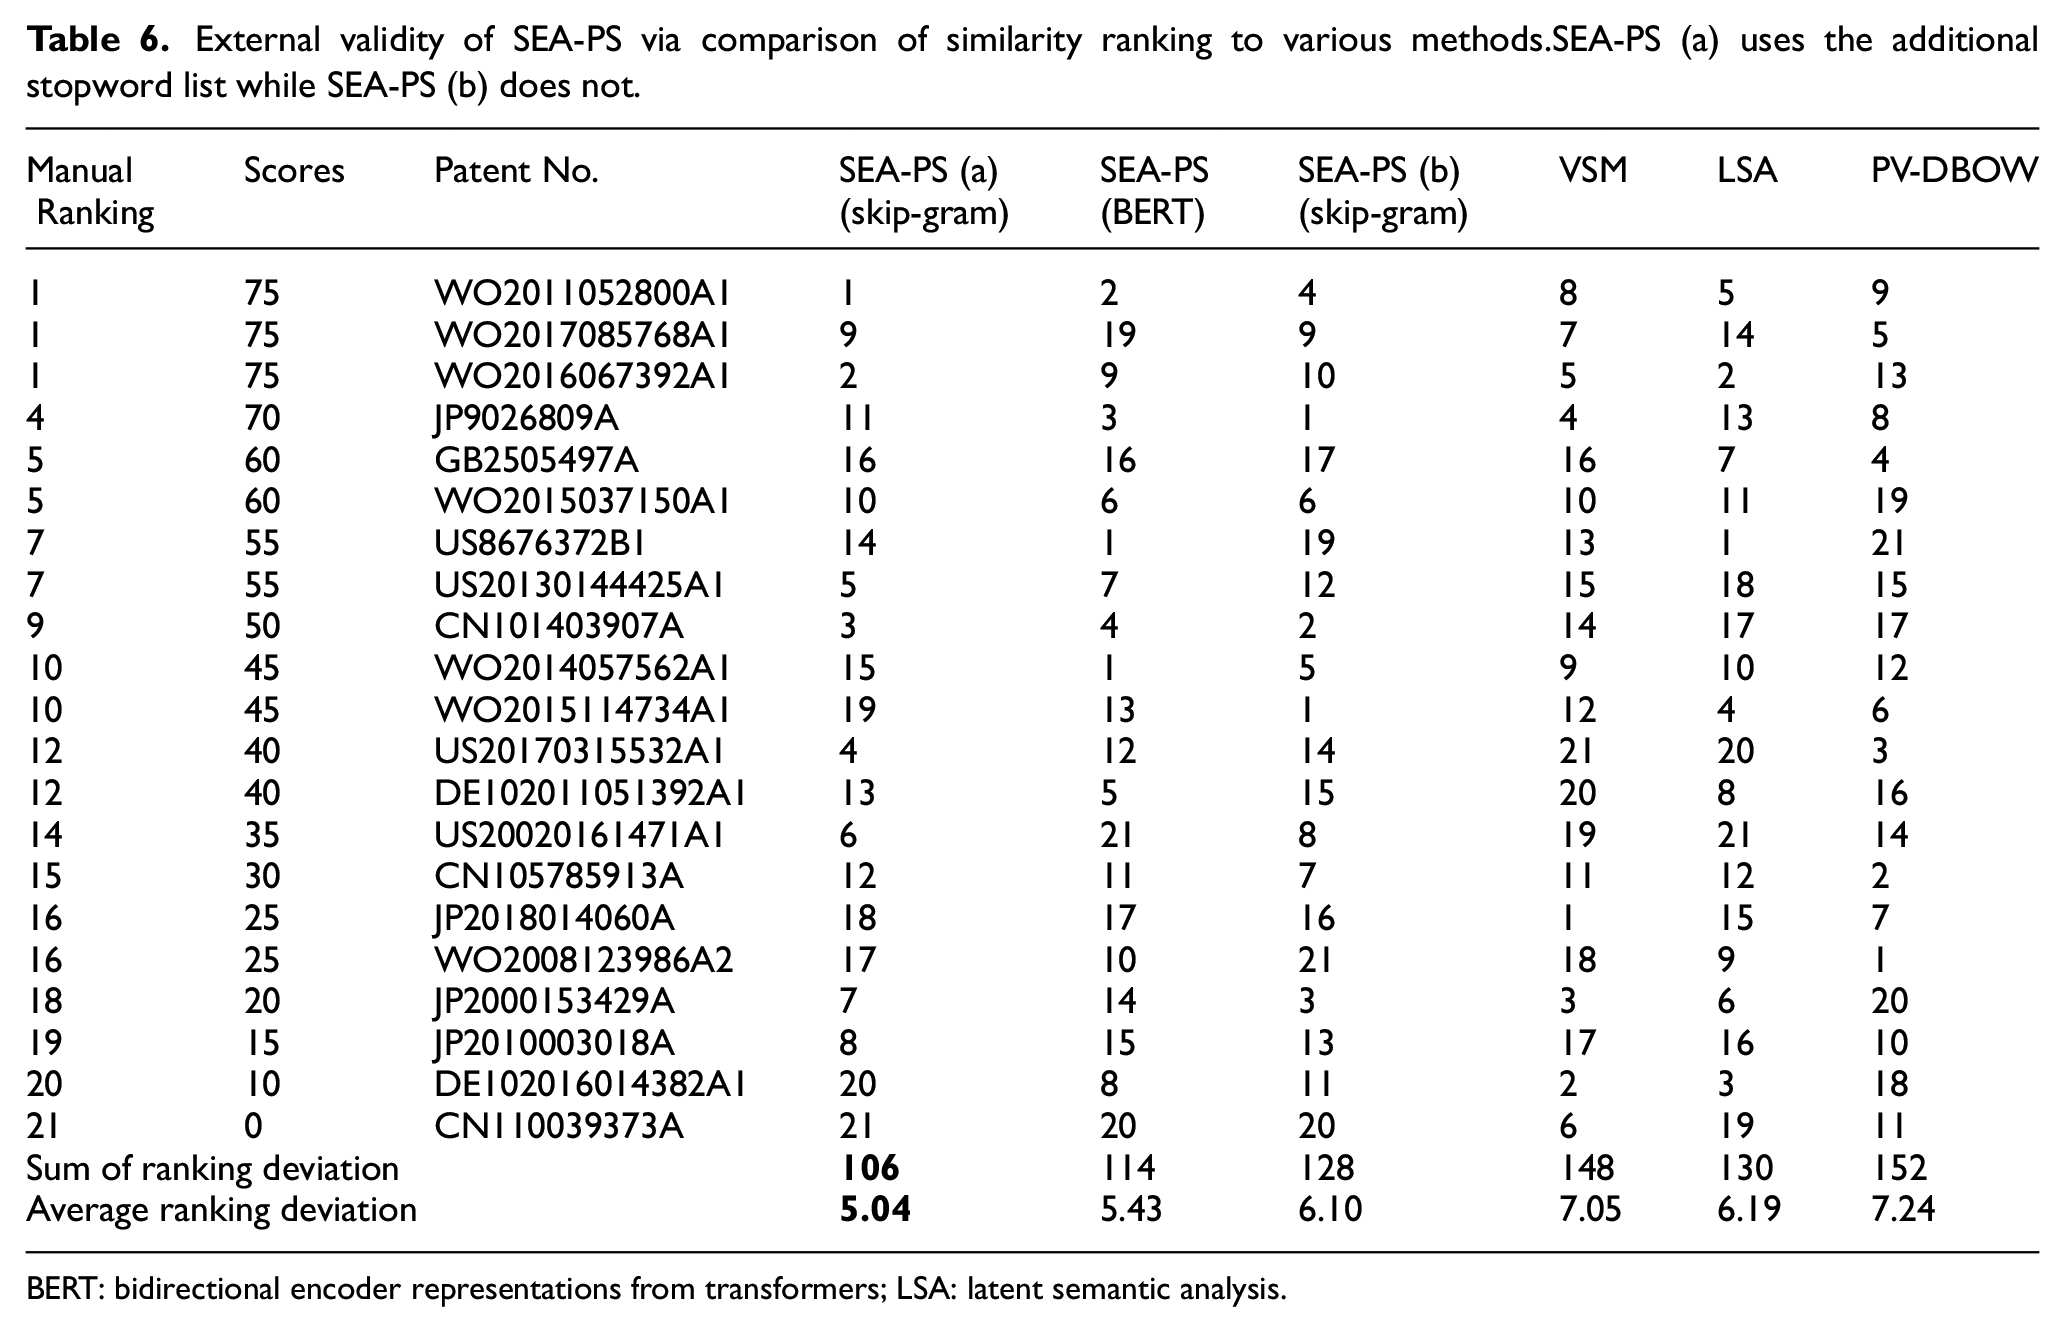
With abstracts of patents as paragraphs input, patents are vectorised, and similarity is calculated by cosine distance between vectors. Surprisingly with various parameter settings, PV-DBOW performs the worst; that is, it can successfully differentiate documents between business and technology, yet it cannot tell the difference between patents within a small technical field. We attribute this to a lack of allocating greater weight to critical technical terms. Finally, the model runs for 50 epochs with the vector size set to 100. The result is shown in Table 6.
External validity of SEA-PS via comparison of similarity ranking to various methods.SEA-PS (a) uses the additional stopword list while SEA-PS (b) does not.
BERT: bidirectional encoder representations from transformers; LSA: latent semantic analysis.
The 10 patents most similar to the anchor patent are derived from SEA-PS, VSM and LSA. A total of 96 (2.3%) patents were excluded from the VSM method, because their technical descriptions were missing. In the LSA method, 65 (1.6%) patents were removed due to a lack of abstracts. After eliminating duplicates, 9 patents were removed and the 21 patents remaining were unique. Here, we argue that only the ranking of similarity can genuinely reflect the performance rather than scoring the similarity. The first reason is that the criteria of scoring from experts and methods are different. The scoring range varies, that is, [−1,1], [0,1], and [0,5], while a 0.6 similarity score from methods indicates that patents are highly similar, the experts may believe that only scores above 0.9 are significant. Second, the fine-tuning of parameters leads to similar but different distribution of similarity values (in average, variance or skewness). So the key is that similarity rankings could correctly identify similar patent. This evaluation strategy has also been adopted in prior research [16].
Title, abstract, claims and technical description of the candidate patents, together with the anchor patent, are provided for the experts. The experts rank the patents well-proportioned, ranging from 0 to 100 based on their discussion of the four textual content fields. Each of the 21 patents is ranked according to its similarity to the anchor patent from high to low. Higher ranking refers to higher similarity. Although some of the scores seem low, the experts agree that they are already very similar to the anchor patent. The manual ranking is derived according to the scores. The sum of the absolute deviation between manual rankings and methods is listed in the table as ‘Sum of ranking deviation’. We highlight the result with an absolute deviation of no more than 3 in bold font, as they are considered to be relatively precise.
As shown in Table 6, the SEA-PS framework with skip-gram achieves the lowest average ranking deviation of approximately 5.04, followed by SEA-PS with BERT, an average ranking deviation of 5.43. BERT is good at modelling dynamic word embedding, that is, polysemy. Yet in most cases, technical terms refer to the same meaning regardless of the context. Therefore, the power of BERT falls back to static modelling in technical documentations. Another reason may be that BERT is finetuned with our data (only 268 Mb in size), and is not the entire patent database. When we test our method without the proposed addition stopword list in SEA-PS (b), the performance decreases significantly. An elaborated stopwords list is necessary in textual patent similarity. In absolute ranking deviation, the SEA-PS framework performs better than VSM and LSA in both the most similar patents and the least similar ones. It is worth noting that the experts conclude that only the patent ‘CN110039373A’ is far from similar to the anchor patent, which is only identified by SEA-PS. ‘CN110039373A’ ranks at approximately the 27th percentile with SEA-PS, while it ranks at approximately the 2nd and 1st percentiles according to LSA and VSM, respectively. This may occur because traditional methods are based on single words and lack deep mining of semantic relationships, leading to the similarity of patents with a similar bag of single words being high. The result illustrates the superiority of SEA-PS compared with other methods.
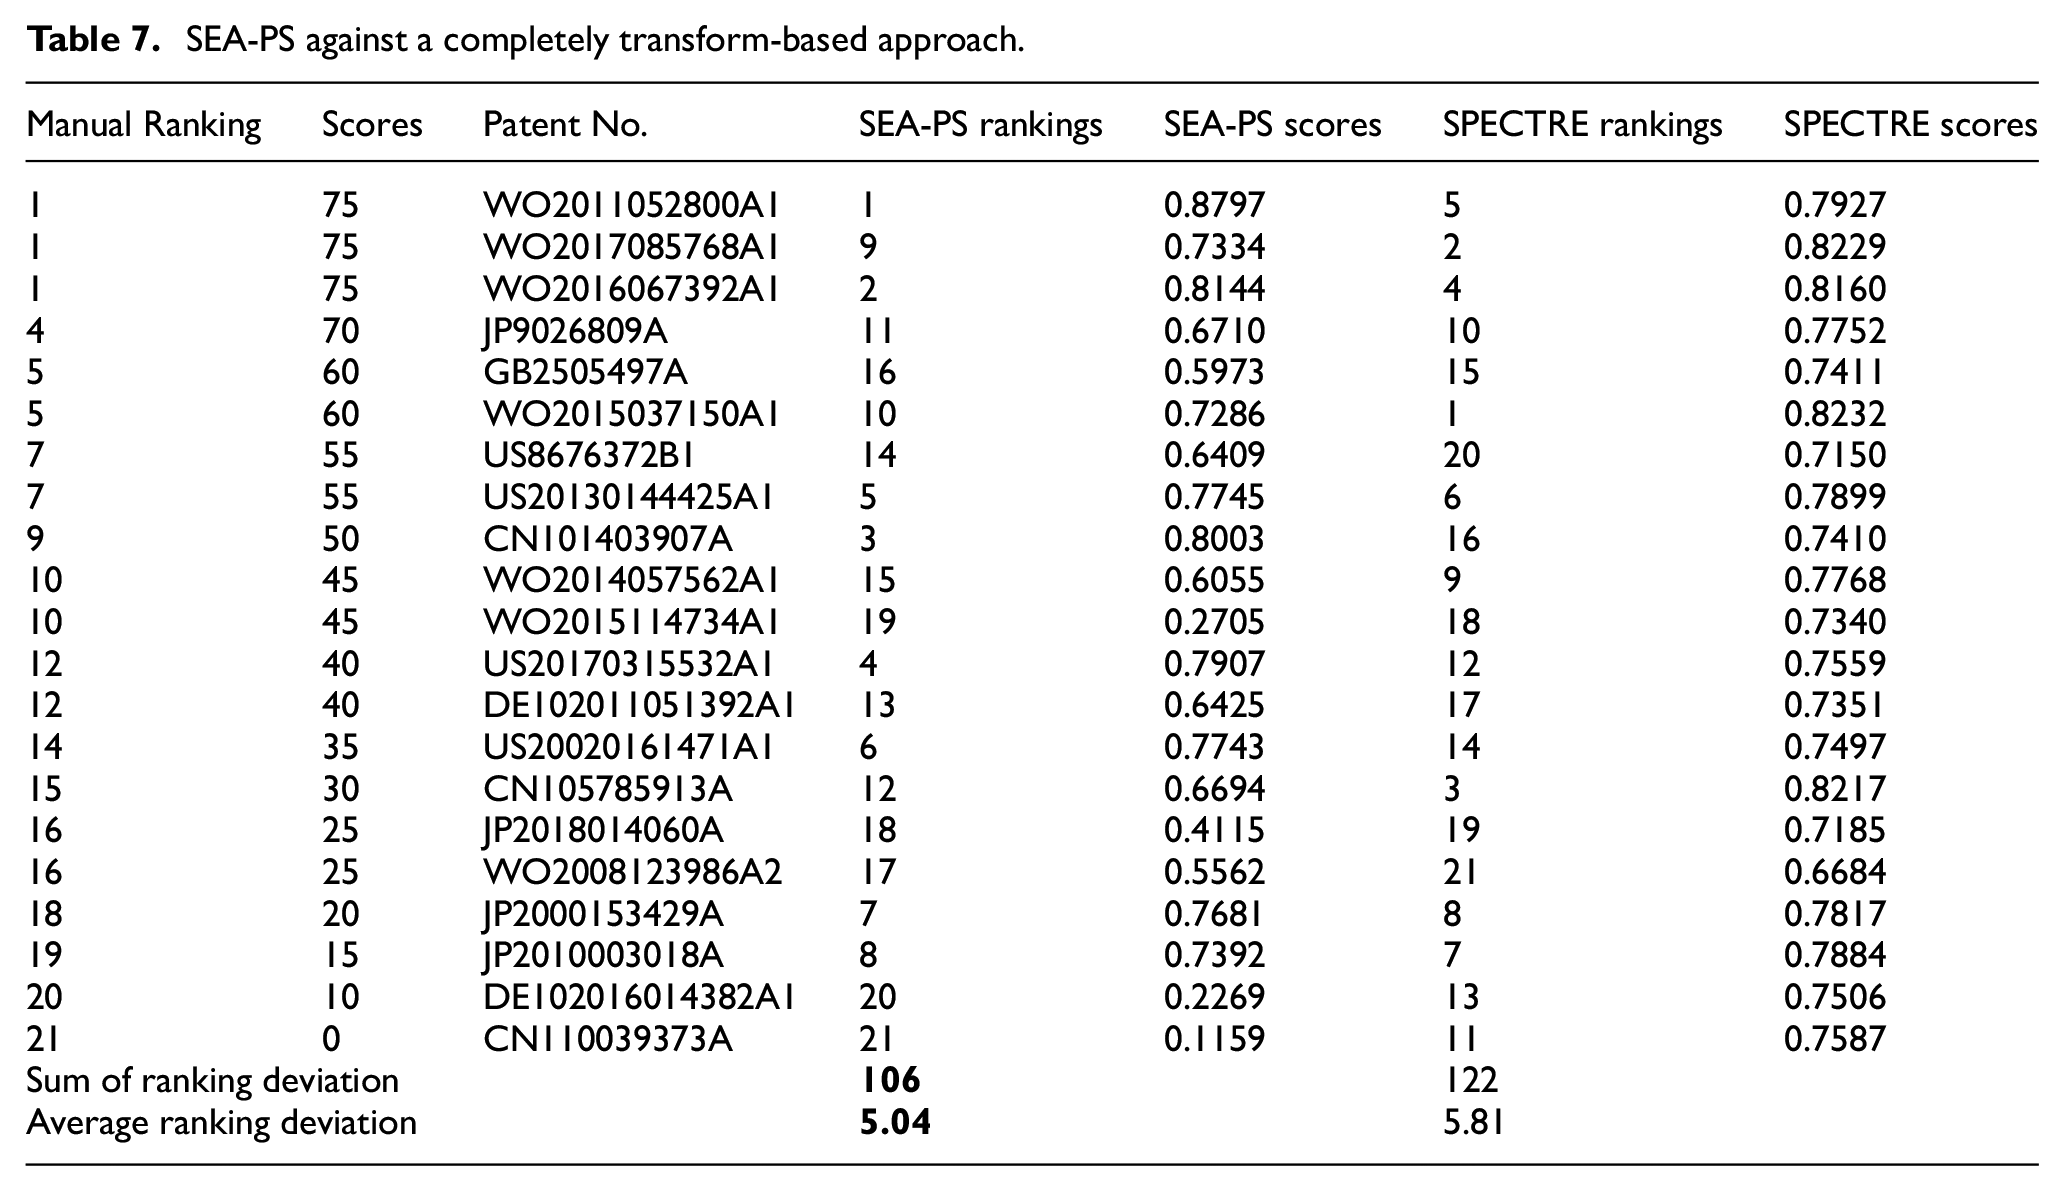
To further evaluate SEA-PS against a completely transform-based approach, we compare the similarity scores and rankings against SPECTER. 2 We use to SPECTER pretrained model to generate patent vector with titles and abstracts. As shown in Table 7, similarity scores from SPECTER is very high, ranging from 0.66 to 0.82. This is probably because the model is trained with corpus in all industries, while samples in our dataset are closely related. SEA-PS is trained with samples from one industry. Therefore, the closely related technical terms are further differentiated, and lead to a larger similarity interval. In similarity rankings, SEA-PS still outperforms SPECTER.
SEA-PS against a completely transform-based approach.
6. Theoretical and practical implications
This study makes three main contributions to the literature. First, we propose a semantic embedding with attention for patent similarity (SEA-PS) model, which fills in the gap of leveraging ‘abstract’, ‘claims’ and ‘technical description’ in patent records to comprehensively derive pairwise similarity metrics. This avoids the bias caused by the controversy of selecting text fields and maximises the leveraging of technical information.
Second, we enforce additional constraints on n-gram-based statistical method by proposing an additional stop-word list for patent similarity (see Appendix 1). The additional stop-word list can also be adopted in other patent analysis and applications. By training word embeddings with the detected technical terms of n-gram-based statistical method, relatedness between technical terms can be properly relected.
Third, we propose a graph-based method to distinguish the technical focus considering the linkages between technologies. The technical focuses of similar patents differ if the linkages between technology bases are different.
SEA-PS is a fundamental tool for patent retrieval and classification [11]. In addition to contributing to the methodology in information science, various practitioners could also use our method in innovation management. With SEA-PS, inventors, attorneys, and patent examiners can scout for closely related patents to identify the technological frontiers [63] and to support assessing the novelty and creativity of a patent. If a newly submitted patent is highly similar to existing patents, it is unlikely that the patent is novel enough. Managers can conduct competition and cooperation analysis in the industry, wherein patent similarity can identify the overlapping ratio of firms’ technological footprints. Entrepreneurs and policymakers can analyse the technology diffusion [64] and technology convergence [65] to support decision making, where patent similarity denotes the degree of knowledge flow, and citations denote the directions.
7. Conclusion, limitations and future works
In this article, we leverage various text fields to measure pairwise patent similarity according to their technological bases. We illustrate how SEA-PS outperforms existing methods. The output of SEA-PS continuously ranges from −1 to 1 and barely has N/A results; thus, the output is suitable for most downstream tasks.
Our model successfully extracts the vast majority of technical terms in textual patent data, and indicates that only one-third of terms appear in titles and abstracts, while technical descriptions cover nearly all technical terms. Although we cannot conclude, the results suggest that although ‘title’ is highly descriptive, containing only a few technical terms makes it uninformative of technical content and therefore does not function significantly; ‘abstract’, ‘claims’, and ‘technical description’ make relatively more contributions.
Our research also has several limitations. First, the embedding vectors of technical terms are only trained based on 4149 patents in the machine tool field, limiting the semantic representation. The strength of the word embedding has not been completely released. Second, the disambiguation of abbreviation, synonym, and polysemy also relies on word embedding training, which is unstable. Third, syntactic structure as important text information still needs to be exploited and integrated. Fourth, we must agree that external validation via an expert panel brings subjective judgement, yet there is no gold standard as a substitute.
In the future, we intend to explore how a large-scale technical term embedding trained on the whole patent database or even including a knowledge base such as Wikipedia data would improve the accuracy. For abbreviations, synonyms, and polysemes, we would like to study whether novel techniques in the knowledge graph for named entity disambiguation could solve the problem. Finally, the syntactic information may be integrated through the tree kernel, while traditional bibliographic information such as citation and classification could serve as side information to further enhance accuracy.
Footnotes
Appendix 1
An additional stop-word list for measuring patent similarity.
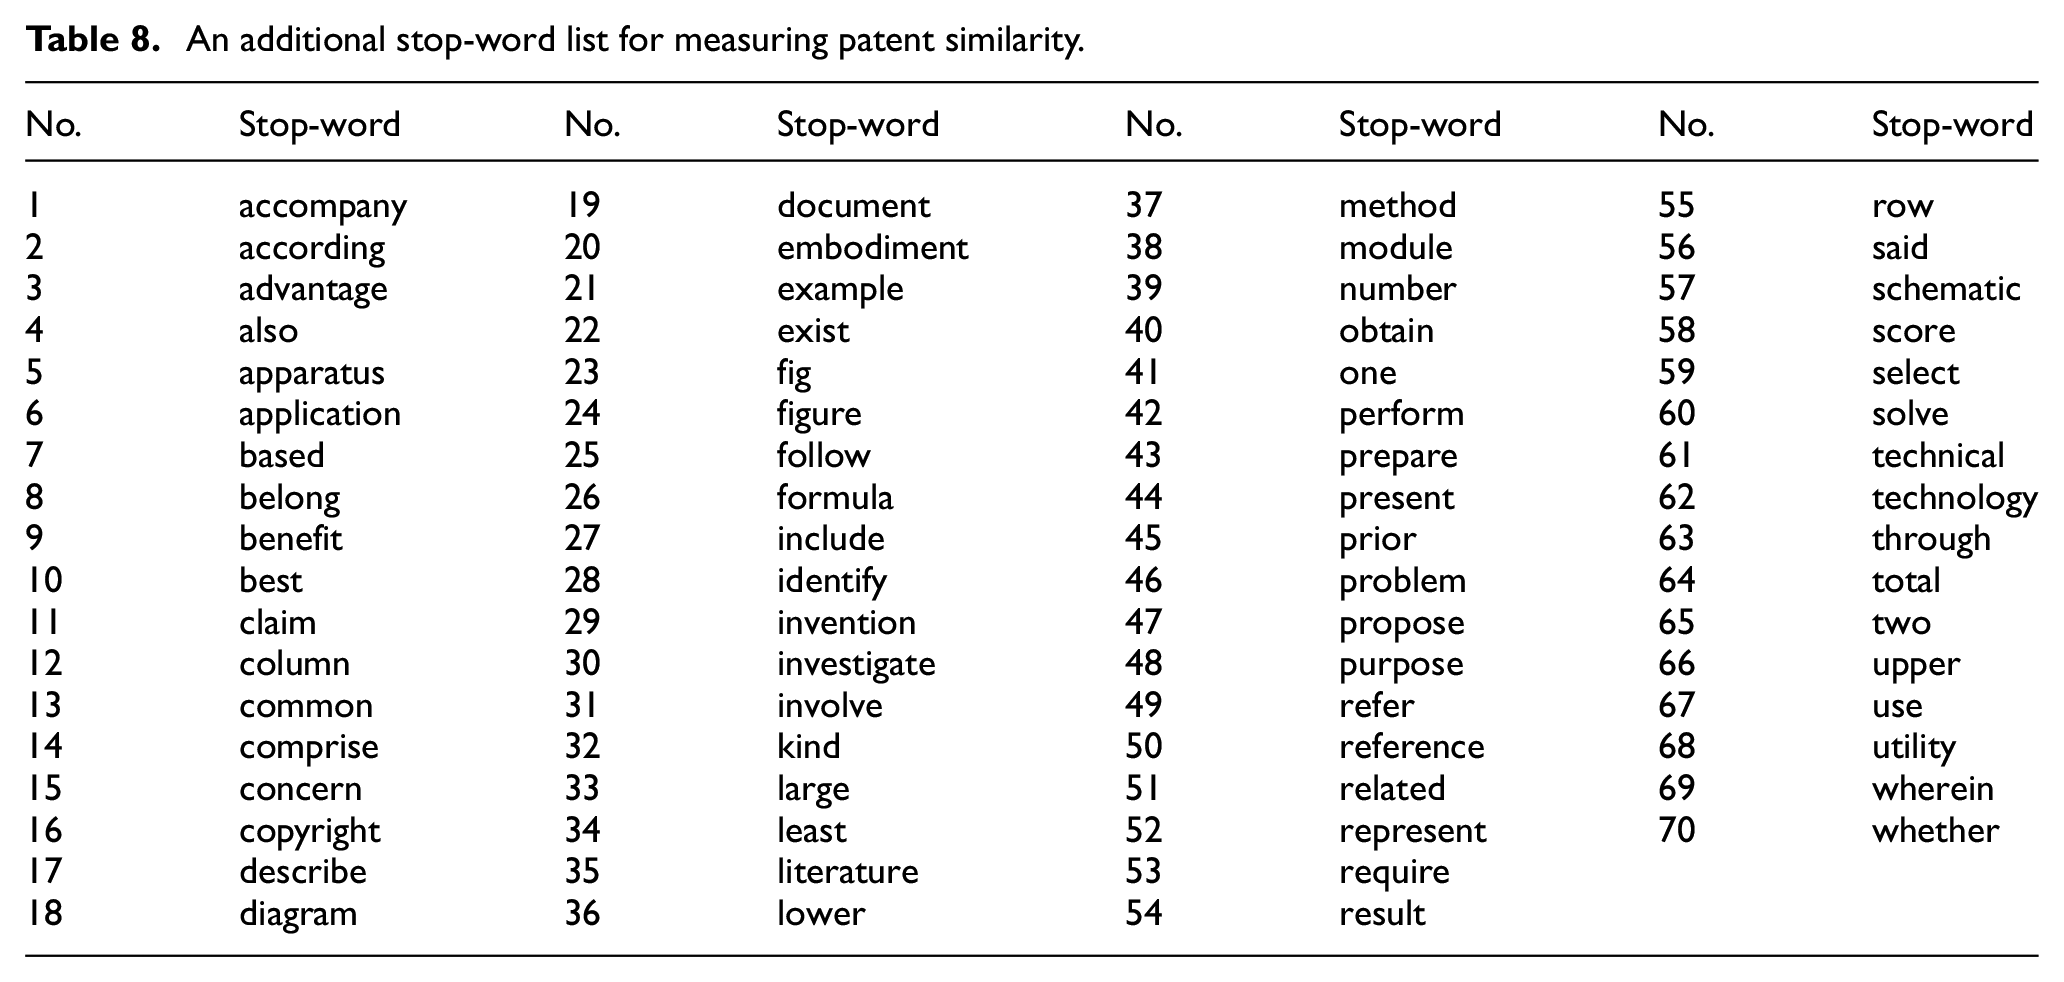
| No. | Stop-word | No. | Stop-word | No. | Stop-word | No. | Stop-word |
|---|---|---|---|---|---|---|---|
| 1 | accompany | 19 | document | 37 | method | 55 | row |
| 2 | according | 20 | embodiment | 38 | module | 56 | said |
| 3 | advantage | 21 | example | 39 | number | 57 | schematic |
| 4 | also | 22 | exist | 40 | obtain | 58 | score |
| 5 | apparatus | 23 | fig | 41 | one | 59 | select |
| 6 | application | 24 | figure | 42 | perform | 60 | solve |
| 7 | based | 25 | follow | 43 | prepare | 61 | technical |
| 8 | belong | 26 | formula | 44 | present | 62 | technology |
| 9 | benefit | 27 | include | 45 | prior | 63 | through |
| 10 | best | 28 | identify | 46 | problem | 64 | total |
| 11 | claim | 29 | invention | 47 | propose | 65 | two |
| 12 | column | 30 | investigate | 48 | purpose | 66 | upper |
| 13 | common | 31 | involve | 49 | refer | 67 | use |
| 14 | comprise | 32 | kind | 50 | reference | 68 | utility |
| 15 | concern | 33 | large | 51 | related | 69 | wherein |
| 16 | copyright | 34 | least | 52 | represent | 70 | whether |
| 17 | describe | 35 | literature | 53 | require | ||
| 18 | diagram | 36 | lower | 54 | result |
Author contributions
Declaration of conflicting interests
The author(s) declared no potential conflicts of interest with respect to the research, authorship and/or publication of this article.
Funding
The author(s) disclosed receipt of the following financial support for the research, authorship and/or publication of this article: This research was supported by the National Natural Science Foundation of China (72104224, 71991473), Huazhong University of Science and Technology Double First-Class Funds for Humanities and Social Sciences, and the Chinese Academy of Engineering's China Knowledge Centre for Engineering Sciences, a Technology Project (CKCEST-2022-1-30).