
Abstract
Fast Fourier transform (FFT) analysis of speech is a useful tool for measuring the social organization of micro interactions. Past research suggests that “adaptation” in the lower nonverbal vocal frequencies may be associated with bystander perceptions of dominance and prestige, but these factors have not been compared in a single study. Furthermore, it is unclear whether nonverbal vocal adaptation has an independent effect on bystander perceptions of dominance or prestige in naturalistic settings. To explore these questions, we aired manipulated versions of interviews from Piers Morgan Live to panels of undergraduates who then rated the dominance and prestige of the host and his guest. We find that nonverbal vocal adaptation is uniquely associated with dominance perceptions. We also find that nonverbal vocal adaptation does not have an effect on dominance perceptions that is independent of other cues. A step-by-step guide to help others use FFT voice analysis is provided.
The expressive power of language provides a window into interpersonal relationships (Giles and Coupland 1991). Among the phenomena it helps us understand, language contains cues of varying subtlety that reflect the negotiation of rank and influence in groups (Giles etal. 1987). In sociology, a program of research focusing on voice frequency levels began with Gregory’s (1983) discovery that the spectral “thumbprints” of people’s voices become more similar during conversation. Specifically, Gregory used fast Fourier transform (FFT) analysis of interactants’ voices and showed that the amplitudes of the frequencies in recorded speech signals were more alike for actual conversation partners than they were for randomly paired speech recordings from two individuals who were not actually conversing. He argued that “vocal adaptation” is an elemental demonstration of the more general tendency for interactional synchrony (see Collins 2004). The FFT measure of vocal adaptation is useful insofar as it is relatively easily obtained, objectively measured, reliable, and taps into a quantitative property of conversational speech that seems to occur outside people’s conscious control.
Subsequent research by Gregory (1990) determined that vocal adaptation is mainly present in the lower, nonverbal range of conversation partners’ frequency spectra (i.e., below .5 kHz). This frequency band is referred to as “nonverbal” because it is perceived as a “mumbling sound such as one might hear in a conversation that is being ‘filtered’ through a wall” (Gallagher et al. 2005:192). In other words, when the lower vocal frequencies are isolated and presented without the higher frequencies, it is not easy to determine what a person is saying, but the emotional tone of the message (i.e., how it is being said) is distinct. Indeed, it has long been claimed that the functional importance of the lower speech frequencies lies in the transmission of nonverbal, emotional content as opposed to verbal content (Gregory et al. 2009).
Additional research by Gregory and colleagues revealed that conversation partners do not always contribute equally to nonverbal vocal adaptation. In many cases, the amplitudes of the lower frequencies in one person’s voice exhibit greater variability and adapt to another person’s lower vocal frequencies during interaction. Interestingly, the conversation partner who “does the work” in this way tends to be viewed as less prestigious (Gregory and Webster 1996). Additionally, nonverbal vocal adaptation is associated with a less dominant presence (Kalkhoff and Gregory 2008).
In an especially fascinating application of these insights to televised presidential debates, Gregory and Gallagher (2002) discovered that candidates who show greater amplitude variability in the lower speech frequency range (i.e., greater nonverbal vocal adaptation to the debate partner) end up being election losers (see also Kalkhoff and Gregory 2008). They concluded that patterns of nonverbal vocal adaption among interactants “may create a singularly influential bias that overrules the effects of more conventional conscious and rational influences” (Gregory and Gallagher 2002:305). Based on past related research, they emphasized that the unconsciously decoded “content” of nonverbal vocalic signals could influence the emergence of social meaning in interactions more so than overt reasoning (i.e., more than conscious evaluation of verbal arguments). The bold suggestion here is that regardless of whatever else is happening during an interaction, the person who shows greater nonverbal vocal adaptation during a conversation may be perceived by observers as being less prestigious and/or less dominant.
This provocative conjecture begs scientific attention, especially since it has been linked to nontrivial behaviors (e.g., voting in national elections). It raises questions that are explored in the research reported below. First, among those who observe a real interaction (e.g., one occurring on TV), is nonverbal vocal adaptation associated with bystander perceptions of dominance, prestige, both, or neither? Second, if nonverbal vocal adaptation is related to bystander perceptions of dominance and/or prestige, is its impact as powerful as Gregory and Gallagher (2002) suggest it could be? Do perceptions change if the lower, nonverbal frequencies of interactants’ voices are “removed” (i.e., filtered out)? And if they do change, how pronounced is the effect? Does it occur even when bystanders have access to hallmark nonverbal cues such as body posture and eye gaze? By shedding light on these questions, our research will advance the understanding of nonverbal vocal adaptation. Plainly speaking, it would be extraordinary to find that people “sitting around” watching a TV program of two people interacting formed perceptions of dominance and/or prestige in line with patterns of nonverbal vocal adaptation regardless of other available cues.
Methods
Small panels of undergraduate students recruited from sociology classes at a large, southeastern university were exposed to one of several versions (see below) of three short interviews from the former nighttime talk show, Piers Morgan Live. Each interview dealt with issues of gun rights and gun control. The first interview took place on January 7, 2014, and featured Alex Jones, a conservative radio show host, filmmaker, and author. The second interview took place on January 8, 2014, and featured Joshua Boston, a former corporal in the U.S. Marines whose strongly worded response to Senator Dianne Feinstein’s proposal to ban assault weapons had become widely publicized. The last interview took place on January 9, 2014, and featured Larry Pratt, the executive director of “Gun Owners of America,” which is a pro-gun lobbying organization in the United States.
As detailed below, each panel of participants was randomly assigned to one of four different versions of each of the three interviews, resulting in 12 distinct experimental conditions. Three separate panels were exposed to each of the conditions, so a total of 36 panels took part in the study (N = 289). Overall, our study averaged 24 participants per condition, which is typical for studies of social hierarchies (see Berger, Wagner, and Webster 2014). Individual panels ranged in size from 4 to 12 members with a mean size of 8. Panelists volunteered approximately 30 minutes of their time to watch an interview and fill out a questionnaire (described below).
Videos
We chose to focus on the specific set of Piers Morgan Live interviews for two reasons. First, gun control is one of the most popular issues in the United States (Wilson 2001), and so the interviews are topically significant and likely to capture the attention of participants (i.e., they are likely to have high experimental realism). Second, the interviews are real and thus are like what participants might find themselves watching at home or on a mobile device (i.e., they create high mundane realism). While the aim of experimentation is usually to achieve high experimental realism/impact regardless of mundane realism (Mook 1983), the attempt to balance experimental realism and mundane realism in the current study is purposeful. It allows us to address the claim that people “sitting around” watching a TV program of two people interacting may form perceptions of dominance and/or prestige in line with patterns of nonverbal vocal adaptation regardless of other available cues.
Procedures
Study sessions were conducted in a small classroom with an integrated audio-visual system. Prior to each session, we used a decibel meter to set the audio level to ensure that all sessions aired at the same overall loudness. Before each study session began, all panelists were asked to read an Institutional Review Board–approved consent document and sign a copy if they wished to continue. No one declined. Panelists then watched (or listened to) the specific stimulus to which they had been assigned. Afterward, they filled out a questionnaire including the Cheng, Tracy, and Henrich (2010) dominance and prestige scales (see below). Participants rated both Morgan and his guest using these scales.
Design
The study involved a 3 × 2 × 2 factorial design, with guest (Jones, Boston, or Pratt), filtering (full spectrum vs. high-pass filtering), and medium (audio/video vs. audio only) as manipulated factors. Each panel of subjects was randomly assigned to one of the 12 conditions.
For the guest manipulation, panelists watched Morgan interview one of the three guests. In what follows, we will begin by exploring whether patterns of nonverbal vocal adaptation have an impact on bystander/panelist perceptions of dominance and/or prestige across the set of three interviews/guests.
For the filtering manipulation, panelists were exposed to either an unaltered, full-spectrum version of the audio track for the interview or a high pass–filtered version where all the theoretically relevant frequencies below .5 kHz had been removed using SpectraPLUS (see below for details). The filtering manipulation allows us to explore whether patterns of nonverbal vocal adaptation have an independent effect on perceptions of dominance and/or prestige above and beyond other co-occurring cues, as the presence or absence of the lower vocal frequencies is the only difference between unfiltered and filtered stimuli.
Finally, for the medium manipulation, panelists were exposed to either an unaltered version of the televised interview (i.e., a version including both the audio and video channels) or an audio-only version where the video channel was replaced with static headshots of Piers Morgan and the guest. In those conditions, the names of the host (Piers Morgan) and the guest appeared beneath their pictures. If there is an independent effect of nonverbal vocal adaptation on panelist perceptions in our chosen setting (as determined by the filtering manipulation), the effect may be strong (i.e., it may occur regardless of medium), or it may be weak (i.e., it may appear only in the audio-only conditions where hallmark nonverbal cues such as body posture and eye gaze are eliminated by suppression of the video channel).
Independent Variable
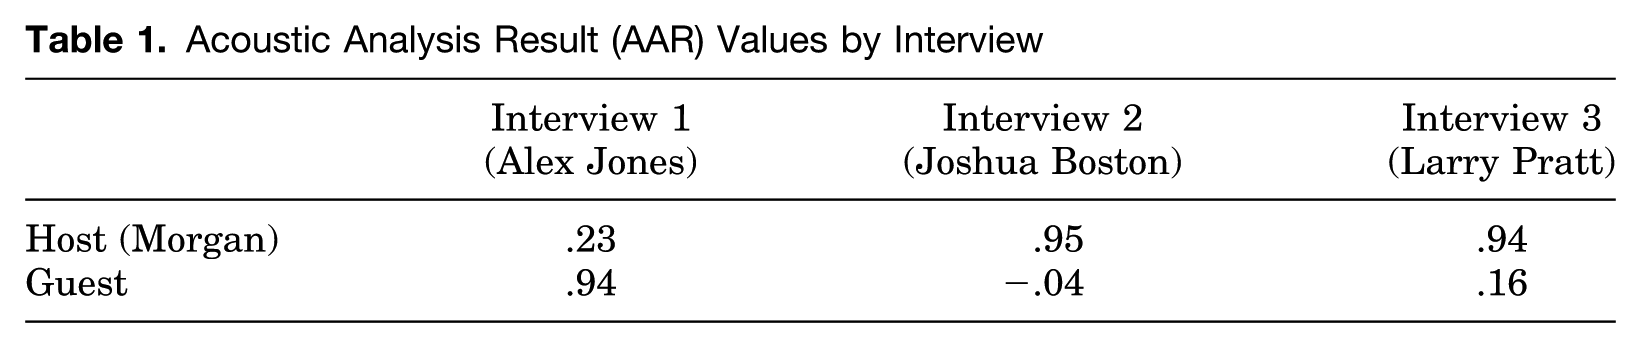
We conducted an acoustic analysis of the audio track from each of the three interviews using SpectraPLUS and SPSS. 1 The procedure yields what is called an “acoustic analysis result” (AAR) for each interactant. Lower values are associated with greater variability and thus more adaptation in the amplitudes of the lower vocal frequencies. The AAR values for Piers Morgan and his three interview guests are shown in Table 1. The values suggest that Morgan had the upper hand in his interviews with both Joshua Boston and Larry Pratt but that the opposite was the case in his interview with Alex Jones. The AAR value for host and guest will be used as a repeated covariate in the statistical analyses reported below. In terms of our research questions, at issue is whether the AAR is related to panelist perceptions of dominance and/or prestige. Also at issue is whether nonverbal vocal adaptation has an independent effect on either or both outcomes in our chosen setting. If it does, the effect may be strong (i.e., it may occur even when the video channel is available), or it may be weak (i.e., it may occur only when the video channel is suppressed, as ifone were listening to the radio or a podcast).
Acoustic Analysis Result (AAR) Values by Interview
Dependent Variables
Our dependent variables are panelists’ perceptions about the dominance and prestige of Piers Morgan and his guests. In this study, we measured dominance and prestige from panelists’ responses to questionnaire items from the Cheng etal. (2010) dominance and prestige scales. These scales display good psychometric properties and are widely cited and used (Cheng, Weidman, and Tracy 2014). They include eight items for measuring dominance and nine items for measuring prestige. For each of the items, panelists in our study were asked to indicate the extent to which a given statement accurately describes the target (either Piers Morgan or the guest) using a scale ranging from 1 = not at all to 7 = very much, with 4 anchored as somewhat. The dominance scale consisted of the following items: “He tries to control others rather than permit them to control him”; “Others know it is better to let him have his way”; “Some people are afraid of him”; “He is willing to use aggressive tactics to get his way”; “He does not enjoy having authority over other people” (reverse coded); “He often tries to get his own way regardless of what others may want”; “He does not have a forceful or dominant personality” (reverse coded); and “He enjoys having control over others.” The prestige scale consisted of these items: “Others always expect him to be successful”; “Others do not enjoy hanging out with him” (reverse coded); “People do not want to be like him” (reverse coded); “His unique talents and abilities are recognized by others”; “He is held in high esteem by others”; “Others seek his advice on a variety of matters”; “He is considered an expert on some matters by others”; “People respect and admire him”; and “Others do not value his opinion” (reverse coded). 2
The dominance and prestige ratings were counterbalanced such that half the panelists in each study session rated Piers Morgan first, and the other half rated the interview guest first. To further minimize response bias, the items were presented in a different random order for each target (host or guest), and a small color picture of the target in question appeared at the top of the page to help ensure that panelists had the correct target in mind while providing ratings. Prior to conducting the statistical analyses reported below, several items comprising each scale were reverse-coded (see above) so that higher scale values indicate greater dominance and prestige. The items corresponding to each target/construct were then averaged to create separate summary measures of panelist perceptions of target dominance and prestige. For the dominance items, Cronbach’s alpha is .883 for the host ratings and .881 for the guest ratings. For the prestige items, Cronbach’s alpha is .857 for the host ratings and .876 for the guest ratings. Thus, both scales show very good internal consistency across targets (host and guests). 3
Control Variables
In the analyses of the effects of the acoustic analysis result (AAR) values (Table 1) reported below, we control for the effects of total speaking time and vocal pitch. Both factors may contribute to explaining variance in dominance and prestige ratings (Krauss and Chiu 1997). Past research has shown that speaking time and vocal pitch are positively related to dominance perceptions (Palmer 1989; Scherer 1979). When it comes to prestige perceptions, the picture is less clear. Some studies find that those with higher vocal pitch tend to be perceived as more prestigious (Scherer, London, and Wolf 1973), but other studies suggest that the opposite may be true (Apple, Streeter, and Krauss 1979). The effects of speaking time on prestige perceptions are not clear either. Some have found that speaking time is positively associated with prestige perceptions (Cheng et al. 2013), while others have argued that refraining from speaking is sometimes the path to being regarded as prestigious (Blau 1964).
For each target in each of the interviews we analyzed, we obtained a measure of total speaking time (in seconds) from the segments that were created for the fast Fourier transform (FFT) analysis. Additionally, we used SpectraPLUS to obtain an estimate of the “peak frequency” (in Hertz) across a given target’s speech segments for a given interview. Peak frequency is the strongest spectral component in the span of segments and serves as the measure of overall vocal pitch in the analyses reported below. Finally, given the topic of the interviews, we also control for the effects of panelist gun attitudes and gun behaviors in the analyses of the effects of the AAR values. 4
Results
Question 1: Is Nonverbal Vocal Adaptation Related to Panelist Perceptions of Dominance and/or Prestige?
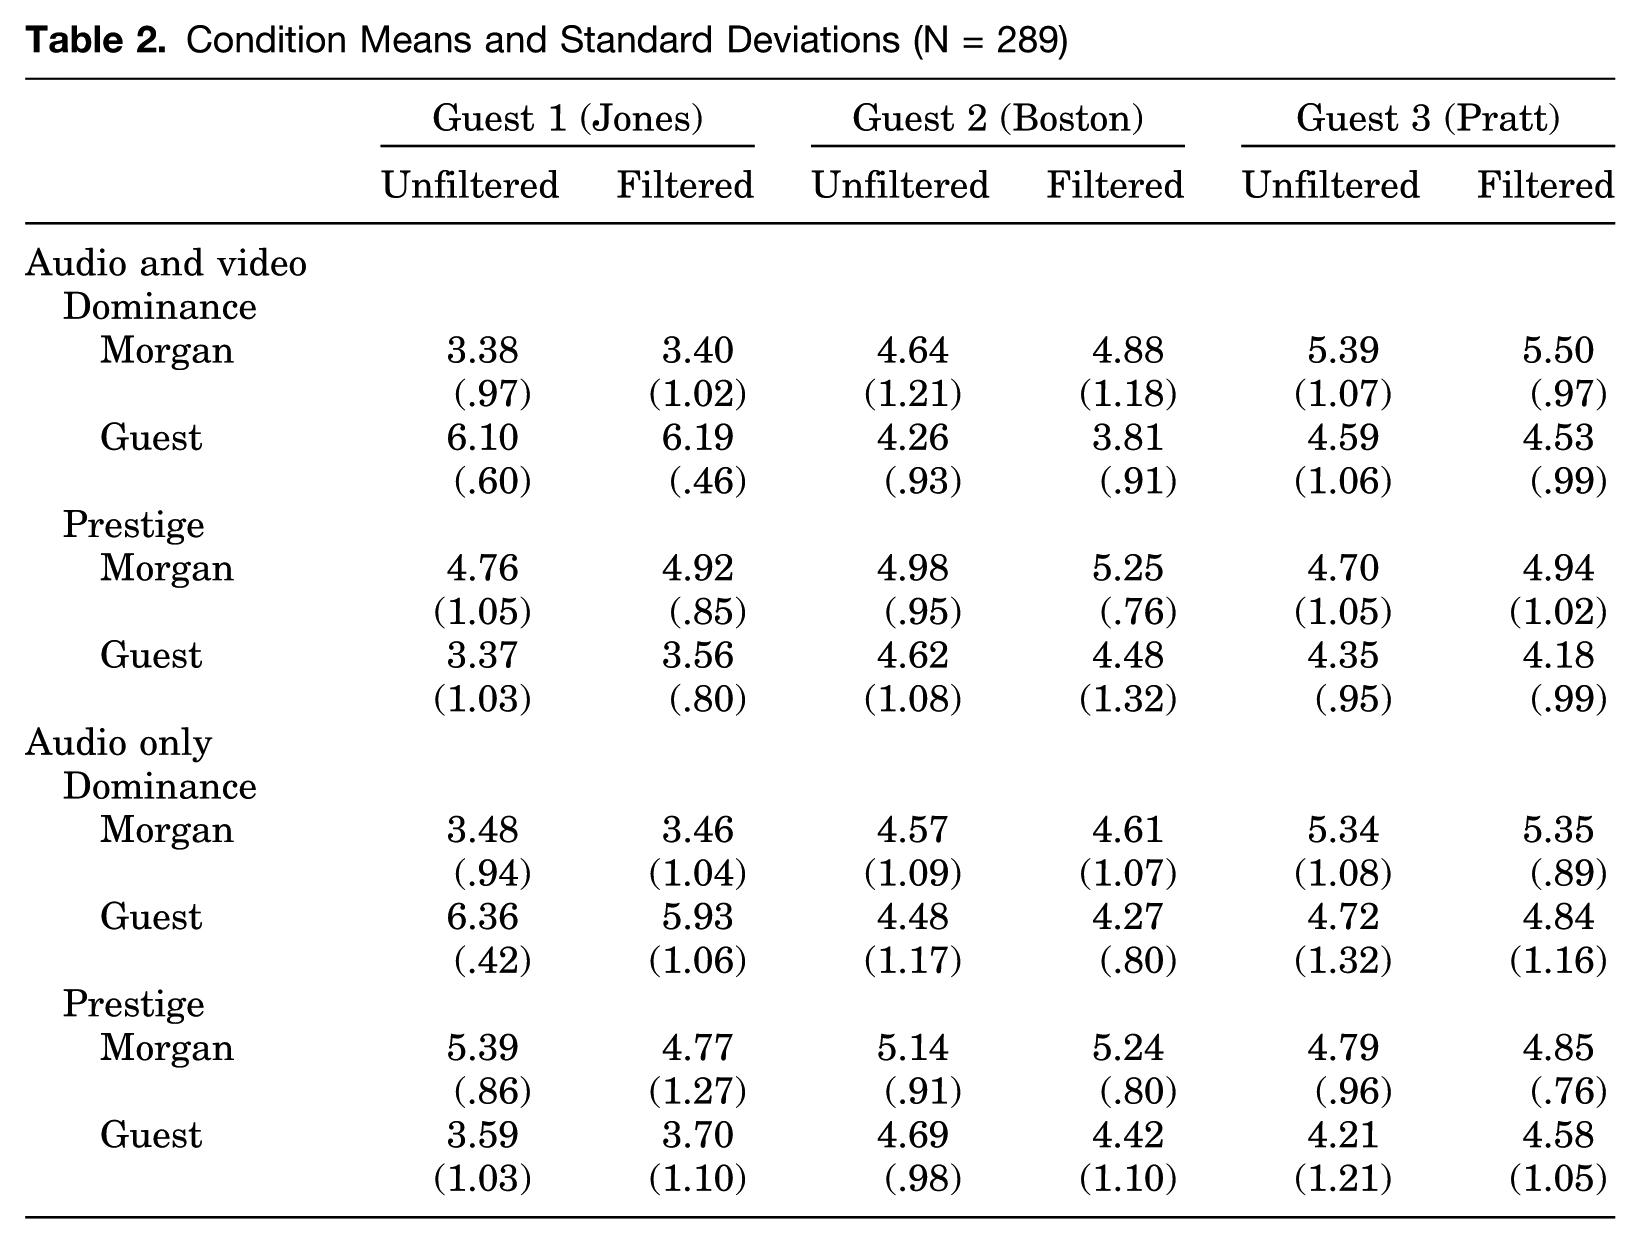
The means and standard deviations for all the conditions are shown in Table 2. The correlations among all the variables are shown in Table 3. The first question we address is whether nonverbal vocal adaptation (as measured by the AAR) is associated with bystander perceptions of dominance, prestige, both, or neither. To explore this question, we estimated a set of linear mixed models separately predicting panelists’ dominance and prestige ratings from the AAR values (as a repeated covariate), controlling for each target’s total speaking time and overall vocal pitch (as additional repeated covariates) as well as panelists’ gun attitudes and gun usage. 5 To model nonindependence of observations (i.e., participants provided responses in groups/panels), we also included a random intercept for panel. Results from the linear mixed models (LMMs) are summarized in Table 4. 6
Condition Means and Standard Deviations (N = 289)
Correlation Matrix (N = 575)
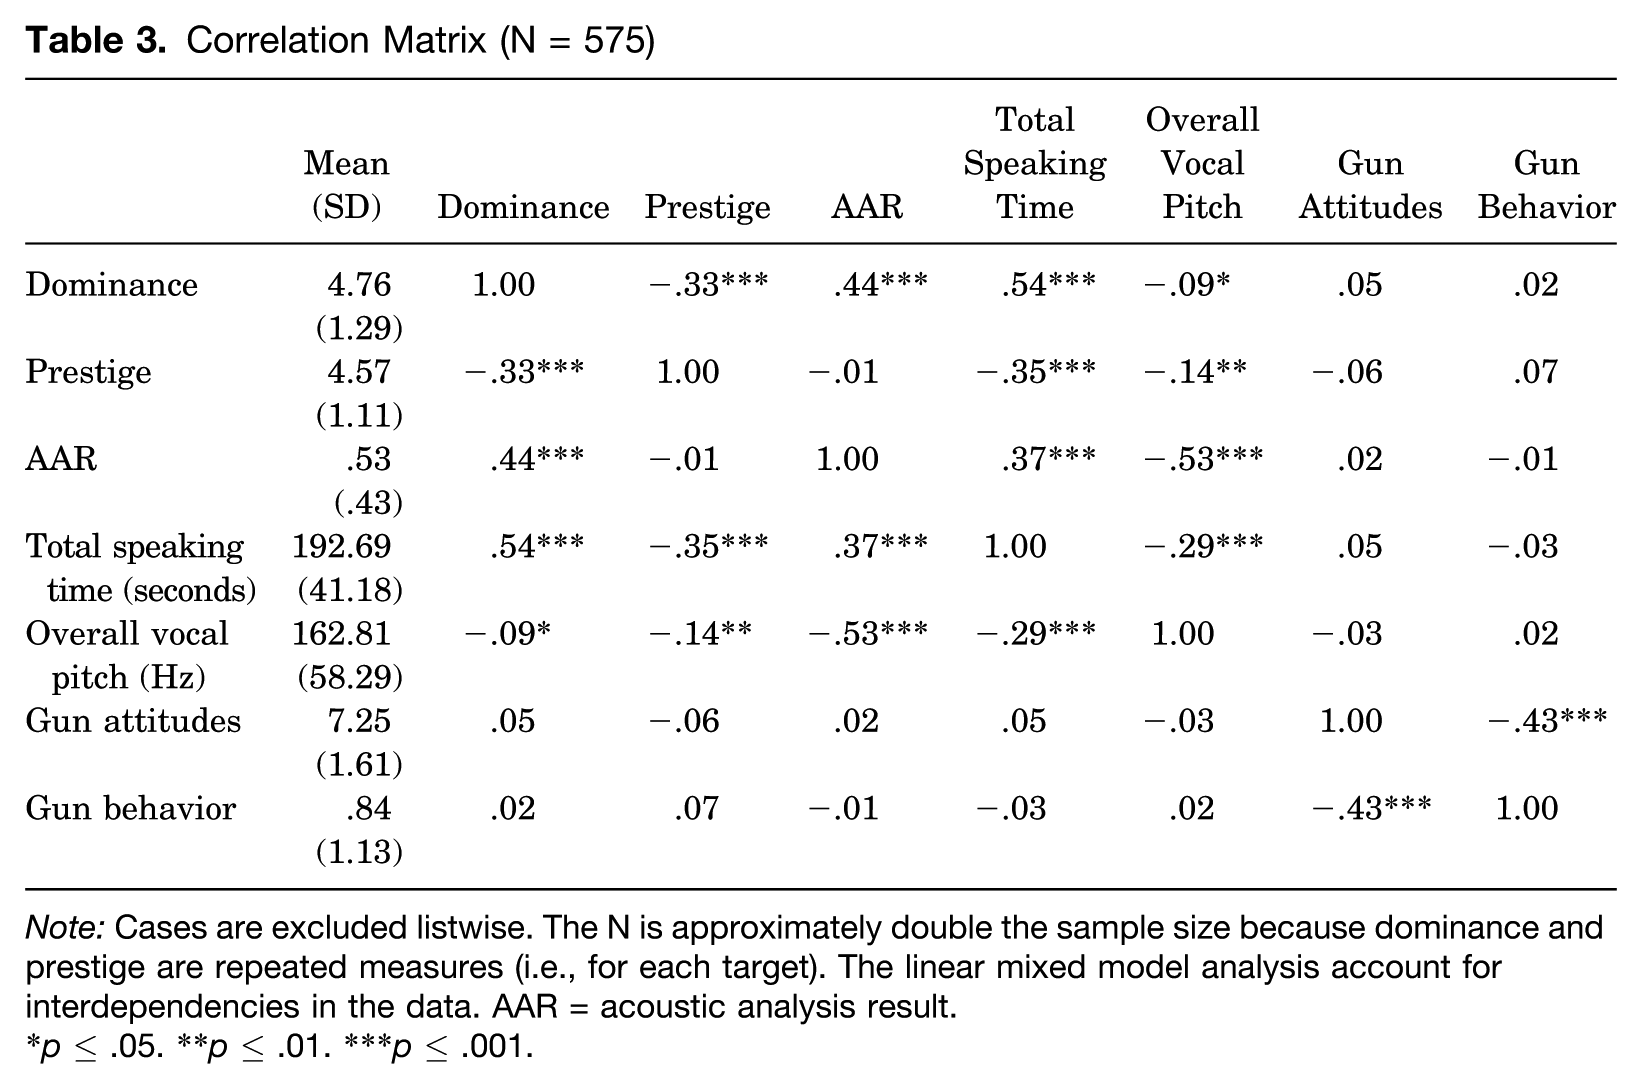
Note: Cases are excluded listwise. The N is approximately double the sample size because dominance and prestige are repeated measures (i.e., for each target). The linear mixed model analysis account for interdependencies in the data. AAR = acoustic analysis result.
p ≤ .05. **p ≤ .01. ***p ≤ .001.
Fixed Effects of Speech Characteristics in Linear Mixed Models Predicting Dominance and Prestige (N = 288)
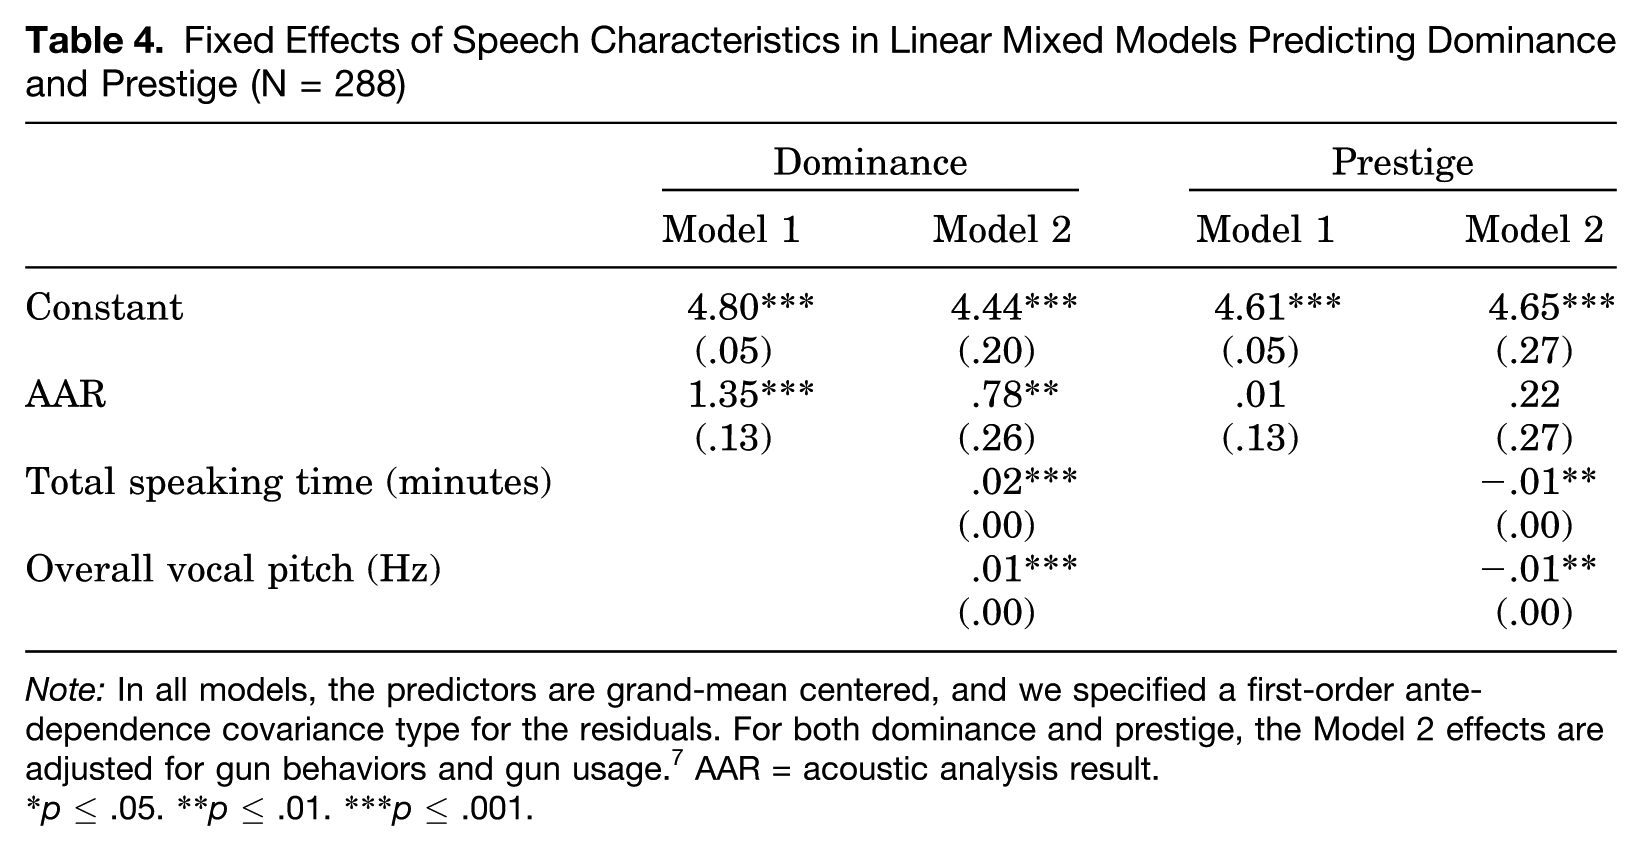
Note: In all models, the predictors are grand-mean centered, and we specified a first-order ante-dependence covariance type for the residuals. For both dominance and prestige, the Model 2 effects are adjusted for gun behaviors and gun usage. 7 AAR = acoustic analysis result.
p ≤ .05. **p ≤ .01. ***p ≤ .001.
Dominance
For the dominance ratings, the effect of acoustic analysis result (AAR) is highly significant and positive in the baseline model (Model 1). Recall, a higher AAR value indicates less amplitude variability in the lower vocal frequencies (i.e., a more stable or constant voice in the lower, nonverbal range). So, the positive effect of AAR on dominance ratings means that as amplitude stability in the lower vocal frequencies increases, panelist perceptions of dominance increase. That is, being more dominant is associated with less nonverbal vocal adaptation. Model 2 predicts the dominance ratings controlling for the effects of additional speech characteristics (as well as gun attitudes and gun usage—not shown). In line with past research (reviewed previously), total speaking time and overall vocal pitch both have significant and positive effects on perceptions of dominance. Importantly though, the effect of AAR on dominance perceptions remains highly significant and positive in the full model (Model 2).
Prestige
For the prestige ratings and unlike what we observed for the dominance ratings, the effect of AAR is not significant in either of the models, even when it is the only predictor (Model 1). Contrary to past research by Gregory and colleagues linking patterns of nonverbal vocal adaptation to both dominance and prestige, our data indicate that amplitude variability in the lower vocal frequencies is uniquely related to dominance perceptions.
While AAR has no effect on perceptions of prestige in our data, total speaking time and overall vocal pitch do have significant effects on this outcome (Model 2). Interestingly, the effects of total speaking time and overall vocal pitch on panelists’ prestige ratings are exactly opposite their effects on panelists’ dominance ratings—a finding that keenly supports the argument that dominance and prestige are conceptually and empirically distinct (Cheng and Tracy 2014). Intuitively, while talking more and speaking in a higher vocal pitch (indicative of stress/tension in the laryngeal region) convey dominance, talking less and speaking in a lower vocal pitch (indicative of a more relaxed state) convey prestige in our study. These findings are consistent with arguments made by Blau (1964) and Apple et al. (1979), respectively.
Question 2: Does Nonverbal Vocal Adaptation Have an Independent Effect on Perceptions of Dominance and/or Prestige?
While the results bearing on Question 1 indicate that nonverbal vocal adaptation is associated with panelist ratings of dominance in our study, it is a separate matter whether nonverbal vocal adaptation had an independent effect on those ratings above and beyond other verbal and nonverbal behaviors. If so, panelist ratings of dominance should change in conditions where the lower, nonverbal frequencies of the interactants’ voices had been digitally filtered out. To the extent that this occurs, we would also want to know whether the filtering intervention worked even when panelists had access to hallmark nonverbal cues such as body posture and eye gaze (i.e., in the conditions that include video of the interactions).
For our second set of analyses, we estimated full-factorial linear mixed models (LMMs) with filtering, medium, interview guest, and rating target as fixed factors. Even though the first analysis (previously described) indicated that nonverbal vocal adaptation is not associated with prestige in our data—and therefore cannot have an independent effect on it—we still include both dominance perceptions and prestige perceptions as (separate) outcomes in this second set of analyses. Target is specified as a repeated variable (1 = host, 2 = guest) that captures who is being rated on each of the dominance and prestige measures. And again, to model nonindependence of observations (i.e., participants provided responses in groups/panels), we included a random intercept for panel. The results of the LMMs are summarized in Table 5.
Type III Tests of Fixed Effects from Linear Mixed Models Predicting Dominance and Prestige Ratings (N = 289)
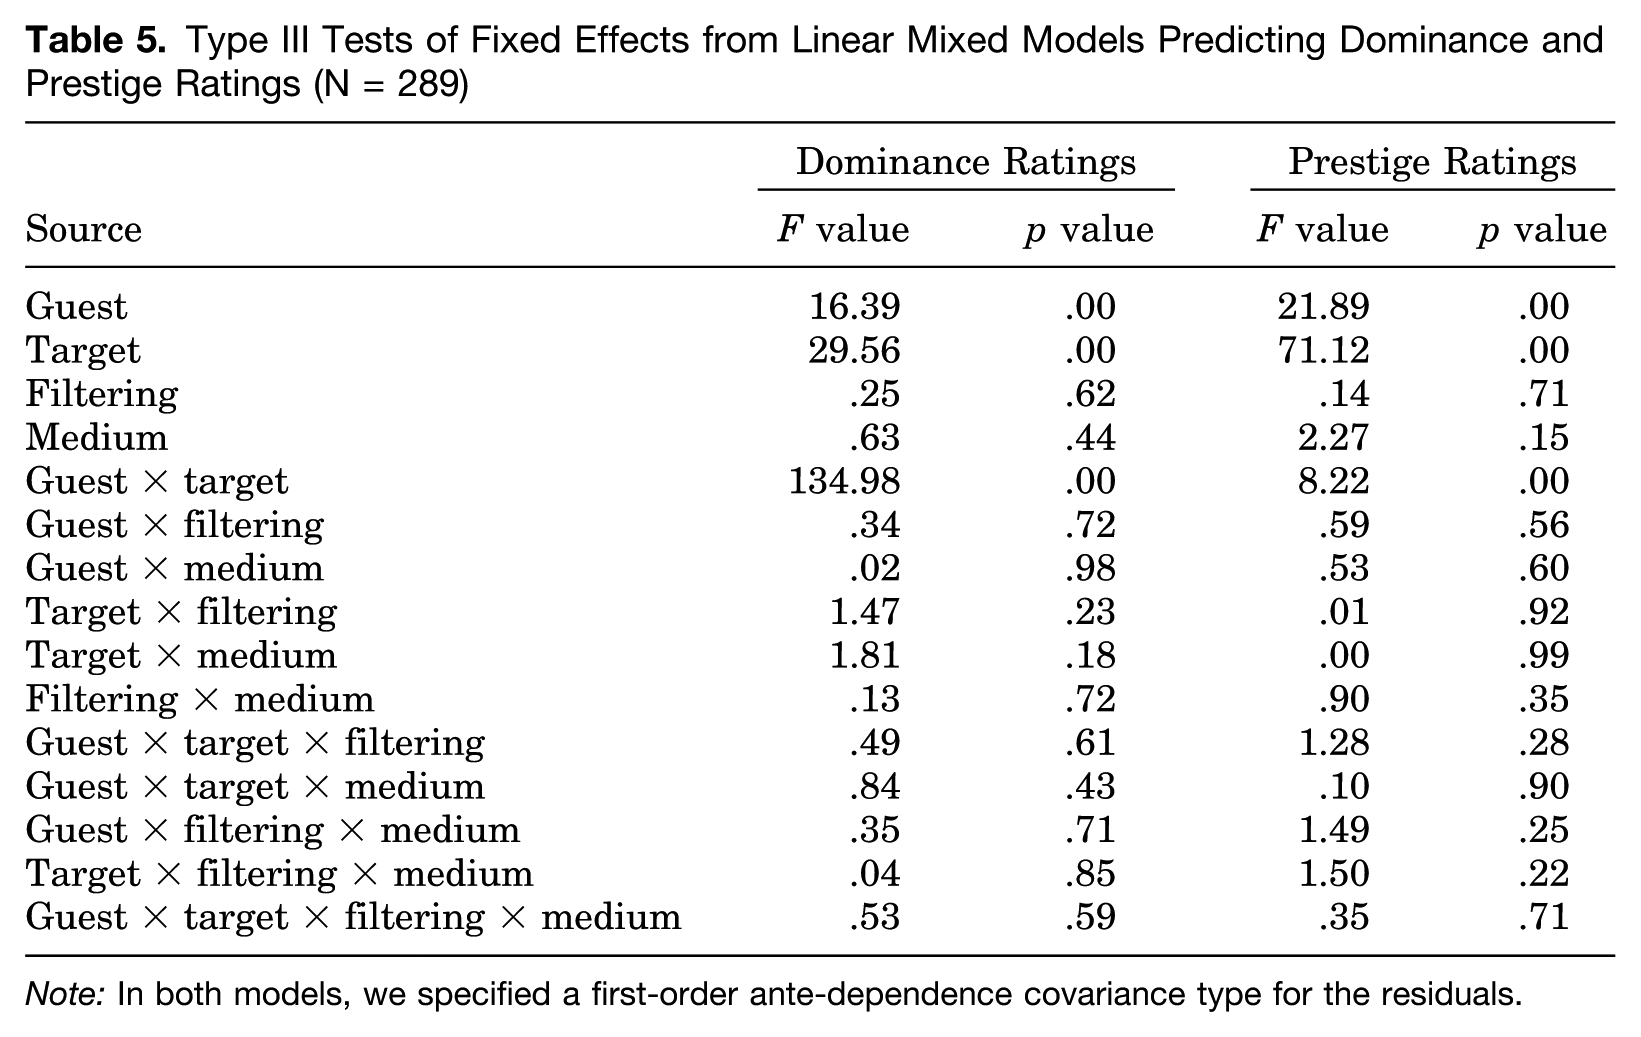
Note: In both models, we specified a first-order ante-dependence covariance type for the residuals.
For both the dominance ratings and the prestige ratings, note that the only significant effects are the main and interactive effects for guest and target. The significance of the guest × target interaction for both outcomes indicates, as we would expect, that panelist ratings differed depending on the interview and which target (host or guest) was being rated. For both the prestige ratings and the dominance ratings, however, the three-way interactions of guest × target × filtering and guest × target × medium do not approach significance, nor does the four-way interaction of guest × target × filtering × medium. This is expected for the prestige ratings (i.e., since the first analysis indicated that nonverbal vocal adaptation does not even covary with them), but it remained an open question for the dominance ratings. Importantly, this means that amplitude variability in the targets’ lower vocal frequencies does not have an independent impact on any of the measured perceptions, even when the panelists could not see the interactions (i.e., in the audio-only conditions). This challenges the long-speculated idea (e.g., Gregory and Gallagher 2002) that people might somehow pick up on variability in the lower vocal frequencies when they witness an interaction (e.g., on TV) and specifically “use” that information to form perceptions about dominance and/or prestige.
Discussion
Our goal was to begin to shed some light on a few unresolved questions from past sociological research on nonverbal vocal adaptation. There are two primary findings that warrant attention. First, nonverbal vocal adaption is only associated with panelist perceptions of dominance in our data (Question/Analysis 1). Second, nonverbal vocal adaptation did not influence dominance perceptions that was independent of other cues in the interactions that our panelists observed (Question/Analysis 2).
This does not mean, however, that using fast Fourier transform (FFT) to measure amplitude variability in interactants’ lower vocal frequencies is a futile endeavor. To the extent amplitude variability in the lower vocal frequencies is associated with panelist perceptions of dominance, the acoustic analysis result (AAR) could be used to predict such perceptions or serve as a proxy for them. If we wanted to know whether an audience of observers is likely to have perceived one speaker as more dominant than another, we could do that with relative speed and efficiency. 8 It would be of great scientific and practical value if software could be developed to do this in real time. This is not an unrealistic objective.
However, our study does have some limitations that should be noted. First, all the interviews were to some degree conflictual and in one case involved an especially heated exchange between the host and guest (Alex Jones). It is important to know whether our findings would replicate when panelists watch or listen to interactions that are more cooperative in nature. Second, in the aired interviews, we did not control verbal content and the range of speech characteristics. In other words, we did not equate what was said or how it was said. Future researchers may want to design more tightly controlled studies that eliminate the influence of such variables. To be clear though, the purpose of this research was not to determine if nonverbal vocal accommodation can ever have an independent effect on perceptions of dominance and/or prestige but whether it has an independent effect above and beyond other cues as they co-occur in natural settings such as televised debates and interviews (see Gregory and Gallagher 2002).
Conclusion
FFT analysis of speech has emerged as a useful, noninvasive tool for measuring the social organization of micro interaction as it develops and changes over time. We have contributed to the broader research enterprise for conducting such measurement using FFT. In our view, these sorts of advancements are fundamental. As Davis (1994:187) has argued, “In the real world, science frequently advances through developments in instrumentation. . . . You can get a Nobel prize in physics or chemistry for developing a better measure of something. In sociology you’d be lucky to get elected to the membership committee of a regional society.” Whether or not this is an accurate description of the state of affairs in sociology is irrelevant. The general point is that sound measurement—in this case of who is likely to be seen as dominating whom in the eyes of bystanders—contributes to broad-based theory development and more exacting empirical investigations (Thye 2000).
Footnotes
Acknowledgements
We wish to thank Jan Stets and the anonymous reviewers for helpful comments and suggestions.
Editor’s Note
Both editors serve as editor-in-chief on all manuscripts. In this article, Jan E. Stets served as the editor-in-chief because Richard T. Serpe had a conflict of interest.
Supplemental Material
Supplemental material can be found with the online version of the paper.
1
For the SpectraPLUS FFT settings as well as step-by-step procedures for conducting the acoustic analysis, see the supplemental material available with the online version of the paper.
2
The original items are available in the supplementary material accompanying Cheng, Tracy, and Henrich (2010).
3
Principal axis factoring with varimax rotation produced a three-factor solution (rather than a two-factor solution) for both the host ratings and the guest ratings. In both cases, the dominance items loaded on the first factor, and the prestige items loaded on the second factor. It was the reverse-coded items that tended to have higher loadings on the third factor, which is not unusual (Spector et al. 1997). Furthermore, the third factor explained little variance in either the host or guest ratings (around 7 percent in both cases). Along with the high alpha reliabilities for the dominance and prestige scales, the factor analyses suggest that the ![]() theoretical factor structure is adequately supported by our data.
theoretical factor structure is adequately supported by our data.
4
See the supplemental material available with the online version of the paper for a description of these measures. In principle, we also control for the ethnicity, age, and gender of the interviewer and guests (i.e., all are white, middle-aged males).
5
To properly decompose how panelists’ gun attitudes and gun usage influence their ratings of each rating target (host and guest), we also adjust for a main effect for target as well as its interaction with both gun attitudes and gun usage.
6
Data from one subject were excluded due to missing data. We grand-mean centered all the continuous-level predictors. Also, due to space limitations, we do not report and interpret the effects of gun attitudes, gun usage, target (host or guest), and the target × gun attitudes and target × gun usage interactions. However, the coefficients in ![]() are adjusted for all these effects. A complete table of results is available in the Online Supplement available with the online version of the paper.
are adjusted for all these effects. A complete table of results is available in the Online Supplement available with the online version of the paper.
7
See the supplemental material available with the online version of the paper.
8
See the supplemental material available with the online version of the paper.
Bios
References
Supplementary Material
Please find the following supplemental material available below.
For Open Access articles published under a Creative Commons License, all supplemental material carries the same license as the article it is associated with.
For non-Open Access articles published, all supplemental material carries a non-exclusive license, and permission requests for re-use of supplemental material or any part of supplemental material shall be sent directly to the copyright owner as specified in the copyright notice associated with the article.