
Abstract
Although intimate partner violence has been recognized as both a social problem and health issue, the extent to which it is a health issue for both males and females in the general population is largely unknown. This longitudinal research uses data from the National Survey of Family and Households (1987-2003). Random effects logistic regression models are used to assess physical health outcomes of exposure to intimate partner abuse for males and females. Results indicate that females are significantly more likely to report poor health if exposed to intimate partner abuse. The same is not true for males. Findings of this research indicate a need to explore further sex differences in violence outcomes. These findings are likely to be of interest to those who study families, intimate partner abuse, and health.
Introduction and Literature Review
Researchers disagree on whether perpetration and victimization of intimate partner abuse (IPA) is symmetrical or asymmetrical for males and females. Feminist scholars often reference research of shelter samples, medical treatment samples, and population-based crime surveys as evidence of primarily female victimization in IPA (Lee, Sanders Thompson, & Mechanic, 2002; Tjaden & Thoennes, 2000). This is known as sex asymmetry in IPA research. Conversely, family violence researchers typically examine population-based surveys, surveys relying on the Conflict Tactics Scale, and young adult samples. Their research indicates that females use violence at similar, equal, or greater rates compared with males (Fiebert, 1997; Prospero, 2008). This is known as sex symmetry in IPA research. In addition to sampling differences, family violence and feminist researchers use differing working definitions of “symmetry.” Family violence research generally measures symmetry as similar rates or ratios of men and women who use violence. Feminist research often includes analysis of the context of the violence (i.e., meanings, motives, or outcomes) in assessment of symmetry (Kimmel, 2002).
The distinct methodologies of family violence and feminist researchers have created a research gap wherein neither groups has adequately studied meanings, motives, and outcomes of IPA in population-based samples. This research examines outcomes of IPA as a measure of sex symmetry in a population-based sample; even if rates of violence are similar, violence is not considered “symmetrical” unless the outcomes of the violence are also similar.
Understanding how IPA affects males and females is essential for those who work with and study families because of the policy implications that accompany research findings. Understanding outcomes of IPA makes it possible to identify whether victim services, the criminal justice system, and policy makers should perceive male and female violence differently. For example, if male and female violence produce the same outcomes, then policy implications include advocacy for dual-arrest programs, along with increased access and targeting of services to men. However, if male and female IPA do not produce similar outcomes, policies should then take into account the qualitative differences in the violence, and policy implications include services targeted specifically to the unique needs of male or female victims and identification of groups at risk for negative outcomes.
Assessing outcomes of IPA exposure is especially important when it is not possible to examine motivations for violence, meanings of violence, coercive control, sexual violence, fear, structural factors, or power in the relationship (Anderson, 2005; Johnson, 2008; Kimmel, 2002; Stark, 2007). Indeed, IPA does not take place within a “social vacuum” (Yllo, 1984), and assessing IPA outcomes may provide a better picture of what violence means to the lives of individuals than would examining rates or ratios of violence. Assessing outcomes gives a deeper understanding of whether or not male and female violence has the same qualitative effects on individuals in abusive relationships.
It is important to assess outcomes in general population samples because of inherent differences in agency samples and population samples. Agency samples are more likely to capture more severe IPA than are general population samples (Johnson, 2008; Johnson & Leone, 2005). General population samples often measure less-severe forms of IPA wherein violence is often mutual (Johnson, 2008; Johnson & Leone, 2005). Moreover, similar rates of men and women report using IPA in general population samples (Dutton, 2006; Gelles, 2007). Researchers must take care to recognize that similar rates and ratios of violence exposure in population samples do not indicate that violence is “sex symmetrical.” For example, even in samples where men and women report similar rates of IPA usage, women are at greater risk of experiencing IPA-related injuries (Gelles, 2007). This is an indication that some IPA outcomes vary by sex in population-based samples and signifies a need to determine if other IPA outcomes differ for men and women.
Examining physical health outcomes to determine whether IPA health outcomes are symmetrical for males and females is important to develop a better understanding IPA. Sociologists and social epidemiologists readily acknowledge that social factors influence physical health outcomes (Cassel, Ornstein, & Swencionis, 1990; Marmot & Wilkinson, 2003). Social scientists have also determined that IPA exposure is a social factor that can lead to poor health (Black & Breiding, 2008; Coker et al., 2002; Coker, Smith, Bethea, King, & McKeown, 2000; Ellsberg, Jansen, Heise, Watts, & Garcia-Moreno, 2008). Regardless of whether or not a victim is injured, the co-occurrence of IPA with intimidation, isolation, stress, and control tactics inherent in many abusive relationships may lead to negative health outcomes (Campbell, 2002; Pico-Alfonso, Garcia-Linares, Celda-Navarro, Herbert, & Martinez, 2004). Research of health outcomes in population-based surveys will contribute substantially to existing research by determining whether IPA leads to poor health outcomes in the general population as it does in agency samples. This empirical research examines whether or not there are differences in male and female health outcomes resulting from IPA exposure and discusses the results and implications of findings.
Current research identifies IPA as associated with injury, poor physical health outcomes, poor emotional health outcomes, and reduced access to medical care for women (Black & Breiding, 2008; Coker et al., 2002; Ellsberg et al., 2008). Negative health effects include emotional distress, posttraumatic stress disorder, suicide attempts, current poor health, depressive symptoms, substance abuse, injury, developing chronic disease, and chronic mental illness (Black & Breiding, 2008; Coker et al., 2002; Ellsberg et al., 2008).
Current research examining how IPA affects health outcomes often focuses on injuries as the catalyst for poor health. Both family violence and feminist researchers acknowledge that women usually suffer greater IPA-related injuries than do men (Gelles, 2007; Johnson, 2008; Tjaden & Thoennes, 2000). Because current health-outcome research focuses on injury-related health outcomes, this research contributes to the literature by examining the health risk for victims in the general population, without a focus on injury-related outcomes. This is important because not all physical ailments resulting from IPA are a direct result of injury incurred through a violent incident. For example, research indicates that regardless of injury status, the co-occurrence of physical or emotional violence with intimidation, isolation, stress, and control tactics in abusive relationships is associated with negative health outcomes and that IPA is a strong and significant predictor of poor physical health (Black & Breiding, 2008, Campbell, 2002; Coker et al., 2000; Ellsberg et al., 2008; Johnson, 2008).
Current research lacks a longitudinal examination of health and intimate partner violence (IPV) examining both men and women in a population-based survey. Because of this, research has failed to identify whether or not health outcomes vary depending on the sex of the respondent in population-based samples. Current research often uses cross-sectional data to show correlation between poor health and abuse, but cross-sectional data are inadequate to examine a causal relationship between IPA and poor health. This research uses longitudinal data to assess whether or not there are sex differences in self-reported physical health with exposure to IPA in a population-based sample.
Research Question and Hypothesis
The research question presented in this article is the following:
Research Question 1: Are there sex differences in self-reported physical health for men and women who report experiencing IPV?
The research hypothesis is the following:
Hypothesis 1: There are sex differences in self-reported physical health for men and women who report experiencing IPA.
Data and Method
Participants
This research uses secondary analysis of the National Survey of Family and Households (NSFH), a longitudinal, population-based sample with three waves. The first wave of the NSFH was completed from 1987 to 1988 and included 13,007 individuals in 9,637 households. The response rate at Wave 1 was 74% for primary respondents. The second wave was completed from 1992 to 1994 and included interviews with 10,007 (76.9%) of the original primary respondents. The third wave was completed from 2001 to 2003 and included interviews with 9,230 (71%) of the original primary respondents (Sweet & Bumpass, 2002).
NSHF includes data on individuals who are married, divorced, remarried, widowed, cohabiting, and never married. The NSFH asks a range of questions about violence exposure to those who are married or cohabiting, but information on violence exposure is very limited for those not currently in a relationship. Because of this, this research sample is limited to respondents who were married or cohabiting during at least two points of data collection. Additionally, the sample is restricted to individuals with responses to key variables in at least two of the three waves (to allow use of longitudinal research methods), individuals younger than 70 years at the first wave, and individuals who were not widowed. The total sample size for this research includes 2,200 males (5,308 observations over the three waves) and 2,697 females (6,524 observations over the three waves).
Measures
Sample stratified by sex
The sample is sex-stratified because research suggests that men and women report health differently (Duetz, Abel, & Niemann, 2003; Gorman & Read, 2006); stratification by sex allows an analysis of violence-exposed women to a control group of women, and allows the same for men, while holding sex as a constant in each model. This allows for a more thorough assessment of the effects of sex on outcomes in the context of a gendered social system instead of a simple count of sex frequencies (Anderson, 2005). It is important to stratify the samples by sex (as opposed to including a sex-frequency variable as an independent variable), because of the multifaceted relationship between sex and the modeled variables. When sex is represented only as an independent variable, the researcher “ignores the complex ways in which gender operates in social interactions” (Anderson, 2005, p. 856). Although methods in this study compare women to women and men to men, the analyses use the same dependent and independent variables in the models. This methodology allows assessment of variations in the effect of IPA on health for men and women.
Dependent variable: Physical health outcomes
The dependent variable for the logistic regression analyses in this study is self-reported health. Self-reported health to measure morbidity is common in epidemiological research (Barber, Muller, Whitehurst, & Hay, 2010), and agreement between self-reported and medical record health is high for many measures of morbidity (Barber et al., 2010). Previous research of IPA indicates that physical victimization is linked to increased risk of self-reported current poor health (Coker et al., 2002).
In the NSFH, sample respondents were asked to report their health compared with others of the same age. The NSFH asked,
Now I’d like to ask you some questions about your health. Compared with other people your age, how would you describe your health? Would you say it is very poor, poor, fair, good, or excellent? (Sweet & Bumpass 2002)
For use in the random effects logistic regression analysis, those with good health or better (coded “1”) are compared with those with fair health or worse (coded as “0”). The division was made between good and fair health because the majority of respondents report their health as good or better (each mean score was above 3.0, which is “fair,” indicating the majority of respondents said they had good health or better). This dichotomous division allows for examination of whether those exposed to violence experience poorer than average reported health.
Predictor variables: IPV exposure
The NSFH contains violence reports from both members of the couple, and it measures violence using a modified version of the Conflict Tactics Scale (CTS; Brush, 1990; Straus, 1979). Measures of violence are similar, or identical, to measures of violence in the CTS (Brush, 1990; Straus, 1979). For example, both assess whether the couple argued heatedly, hit or threw objects, or used physical violence. Both instruments assess violence in the year prior to the survey and do not assess sexual violence, motivations behind violent acts, or primary aggressors. Both assume that violence is in the context of an argument (Brush, 1990; Sweet & Bumpass, 2002; Straus, 1979).
The predictor variable in each model is a measure of IPA exposure. There are many ways to measure violence and abuse in relationships. Each model includes one variable measuring IPA to assess health consequences of violence exposure. Violence variables are time variant predictors; at each wave of data collection, respondents were asked about violence exposure. If either the respondent or the partner reported violence, it was coded as “1.” If neither the respondent nor the partner reported the type of violence, it was coded as “0.” If respondents responded “no” to the first question about violence (and were not asked the remaining questions), then missing variables were replaced by “0,” because no violence was reported.
Physical violence was measured with two variables. The first measure of violence was hitting and throwing things in an intimate relationship. Respondents and partners were asked, “How often do you end up hitting or throwing things at each other?”(Sweet & Bumpass, 2002). If the response was “never,” or if the question was not asked of the respondent, it was coded “0”; if the response was “seldom,” “sometimes,” “very often,” or “always,” it was coded as “1.” The second measure of violence is physical aggression. Respondents and partners were asked, “Sometimes arguments between partners become physical. During the last year has this happened in arguments between you and your partner?” (Sweet & Bumpass, 2002). If the response was “yes,” it was coded as “1.” If the response was “no,” or if the question was not asked of the respondent, it was coded as “0.”
The research also examines use of violence and victimization by a partner’s use of violence. For physical violence used by primary respondent, respondents and partners were asked, “During the past year, in how many of these arguments did you become physically violent with your partner?” (Sweet & Bumpass, 2002). A response of “0” (or a nonresponse) was coded as “0.” A response of one or more was coded as “1.” If there was disagreement between the partners, the highest reported violence was coded for the case. For measuring whether or not the respondent was a victim of physical violence, respondents and partners were asked, “During the past year, in how many of these arguments did your partner become physically violent with you?” (Sweet & Bumpass, 2002). A response of one or more was coded as “1,” and a response of “0” (or a nonresponse) was coded as “0.” If there was disagreement between the partners, the highest reported violence was coded for the case.
Control variables
Several demographic factors influence health outcomes and are used as control variables in the models. Previous research indicates that self-reported measures of health differ by age, race, ethnicity (Fletcher, 2009), sex, marital status, income, and education (Demakakos, Nazroo, Breeze, & Marmot, 2008; Duetz et al., 2003; Read & Gorman, 2006; Ross, 1995; Waite, 1995). This research controls for each of these demographic variables. Income was missing for about 26.5% of male responses in the study and for about 26.4% of female responses in the study. When income was missing, it was replaced with the sample mean of the given wave, and a dummy variable was included in each wave to indicate whether the response was missing and thus imputed with the sample mean. Because less than 5% of the study sample reported nonmarital cohabitation, currently married and cohabiting couples are combined. This is acceptable for analysis because research indicates that health differences between married and cohabiting couples are nonsignificant (Zheng, Penning, Pollard, & Hart, 2003). In addition to the above control variables, a linear time control is included. Period specific intercepts are included in each random effects logistic regression model to control for time at each of the three waves.
Procedures
NSFH researchers began screening households in the 48 continental states in 1987. In each household, researchers chose a primary respondent (age 19 years or older) at random and asked the respondent to complete a survey, which included both a self-administered module and an interview. Heterosexual spouses or cohabiting partners were also asked to complete a shorter self-administered survey (Sweet & Bumpass, 2002). The study excluded same-sex couples (Sweet & Bumpass, 2002). In Wave 2 data collection, original respondents and current spouses or partners were interviewed face-to-face. Additionally, spouses or partners from Wave 1 relationships that had ended were interviewed where possible. At Wave 2, 23,075 interviews were conducted. Wave 3 included 10,069 phone interviews with primary respondents and other household members. Please refer to the NSFH field report for full information and details (http://www.ssc.wisc.edu/nsfh/design.htm; Sweet & Bumpass, 2002).
Random effects logistic regression models with panel data
This research uses random effects logistic regression models (xtlogit command in Stata 9 software) to examine whether or not violence exposure has an effect on self-reported physical health when controlling for age, race, education, earnings, and time. There are several reasons random effects models are preferred for this analysis. Random effects panel models allow for longitudinal, between-case comparisons of cases using all three waves of the data. This is important to compare differences in outcomes of those who experienced violence in the study period with those who did not experience violence in the study period. Because respondents who report violence exposure in the study period may have also experienced IPA prior to the study, any negative consequences of IPA exposure may already be taking place for violence-exposed respondents. Using random effects regression provides a clearer picture of the ways violence affects health over time than would alternative statistical methods.
Moreover, random effects models are preferred because they allow for analysis of differences between groups who do and who do not experience violence, as well as the differences between individuals who experienced a change in violence status (experienced violence at one time point, but did not experience violence at another time point). By using random effects models, the research includes both respondents who did, and those who did not, experience a change in violence among waves. Furthermore, random effects models allow for analysis of time invariant control variables (i.e., sex, race, highest completed education) in the models.
Before running regression analysis, a correlation matrix indicated that there were no problems with autocorrelation among independent variables used in the models. Additionally, examination of individual variables for distribution normality indicated that age and income are skewed in the data. Comparison of the included models to models with age and income logged indicated that results were substantively the same as models with age and income unlogged. Because of this, the unlogged variables are reported for ease of interpreting the results of the random effects logistic regression models. Other variables either are dummy variables or normally distributed.
Each random effects logistic regression model was tested to determine if the saturated (full) model is good fit for the data. Tests of model fit included an overall likelihood ratio test, a test of the likelihood ratio of RHO, and a Wald test. The overall likelihood ratio test is a chi-squared test in which at least one of the coefficients of the regressors is not equal to zero, or that it is significant in predicting the independent variable (Garson, 2010). Significant findings for this test (prob. χ2 < .05) indicate a good fit for the model. RHO is a measure of the panel-level variance. If RHO is zero, then the panel-level variance component is unimportant, and cross-sectional analysis would be adequate. A significant result (prob. chi bar < .5) indicates that longitudinal panel data model is better able to predict the dependent variable than the cross-sectional models (Gayle, 2003). The Wald test examines significance of the regressors in predicting the dependent variable. The null hypothesis of the Wald test is that the coefficient of all regressors is zero. A significant result indicates that at least one of the regressors is significant in predicting the dependent variable. A significant result (prob. χ2 < .05) indicates a good fit for the model (Garson, 2010).
Model testing indicated that the data are a good fit for the models. Overall likelihood ratio tests of each model indicate that at least one of the regression coefficients in the model is not equal to zero (prob. χ2 < .0001). In addition to overall likelihood ratio tests, a likelihood ratio test of RHO indicates that the panel-level variance component is significant in predicting outcomes of dependent variables in each model (p < .001). A Wald test of each model indicates that each model predicts dependent variable outcomes better than chance (p < .001). Each of these findings is indicative of adequate models.
Results
Descriptive Results
Table 1 includes demographic information on the sample. Descriptive statistics are reported based on findings in Wave 1. Assessment of Wave 1 provides a clear picture of what the sample looked when the study began and provides a baseline for identifying violence changes through time in longitudinal analyses. The sample was about 45% male and about 55% female. The mean age was 40 years for males and 37.5 years for females. More than 82% of males and females were White. Both men and women in the sample averaged about 13 years of education. Male’s average annual earnings were more than double that of females ($24,998 for males; $10,086 for females). About 95% of men and 94% of women had a partner at Wave 1. Although men and women had similar mean physical health scores (83.6% of men and 82.7% of women reported good health or better at Wave 1), all regression analyses are stratified by sex because of unobservable factors that could influence health outcomes differently for males and females.
Descriptive Statistics of Sample at Wave 1 as Reported by Primary Respondent

Frequencies of violence reporting at Wave 1 (Table 2) include both self-reported violence and relationship-reported violence. Self-reported violence scores are only reported by the primary respondent for each household. Relationship-reported scores are those that include reports of violence by the primary partner and any reports of violence given by a cohabiting or marital partner. Between 3.7% and 7.7% of couples reported physical violence by at least one member of the couple. Between 4.1% and 7.7% of males were reported as victims of physical violence by a female partner, whereas between 3.7% and 6.0% of females were reported as victims of male partner violence.
Report of Violence at Wave 1
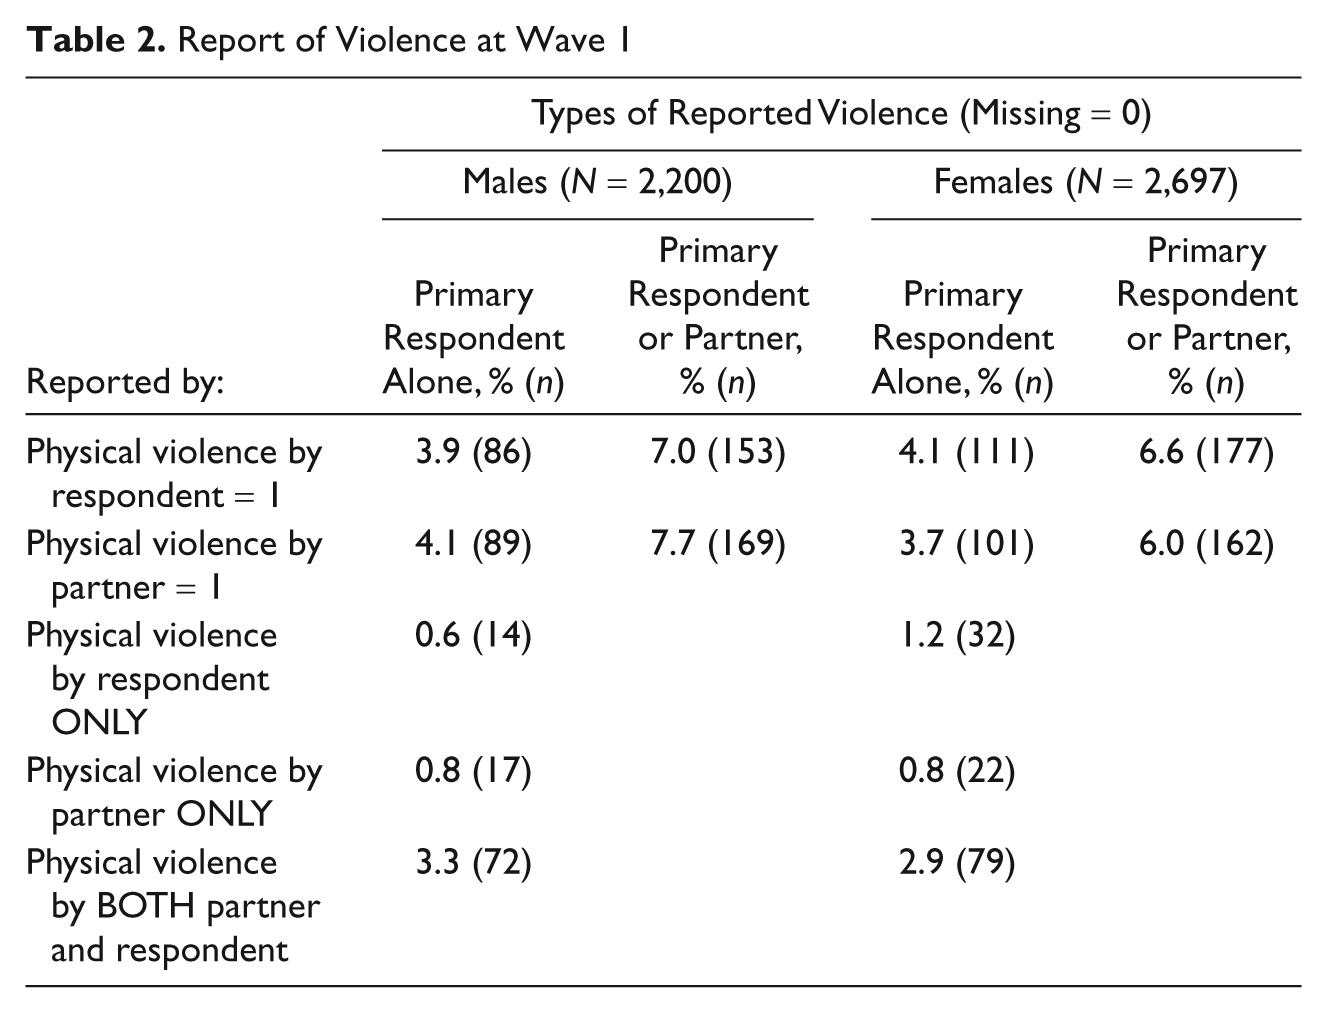
Table 2 also reports percentage of violent relationship with reported mutual violence and unilateral violence. Both males and females report more relationships in which both members of the couple use violence (3.3% and 2.9%, respectively) than cases in which only the male or only the female used violence. Reports of violence indicate that from 0.6% to 1.2% of cases only had one member of the couple use violence. This indicates that the majority of couples, who experienced violence, experienced mutual violence rather than unilateral violence.
Table 3 reports Pearson correlation coefficients between individual measures of physical violence (which are later used in separate regression models) and physical health outcomes using Wave 1 data. Results indicate a significant, negative relationship between physical health and hitting or throwing, physical violence, and use of physical violence by primary respondent. There was no significant relationship between a partner’s use of violence and physical health in this cross-sectional model.
Pearson Correlation Coefficients for Wave 1: Correlations Between Physical Health Outcomes and Violence
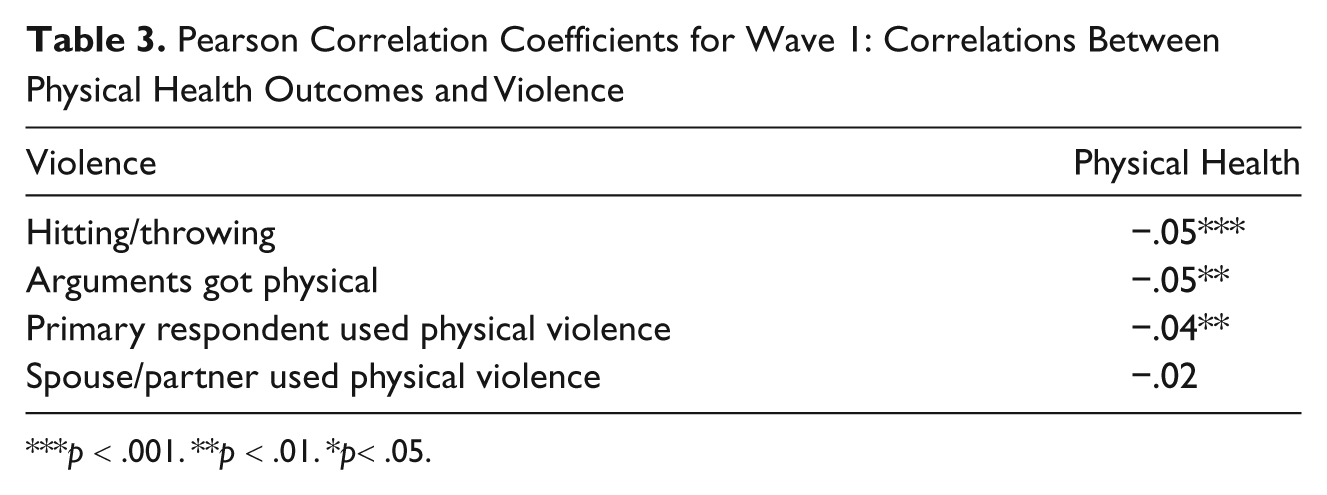
p < .001. **p < .01. *p< .05.
Inferential Results: Random Effects Logistic Regression Analysis
Table 4 reports results of random effects logistic regression models assessing the longitudinal effects of IPA on self-reported physical health outcomes using all three waves of the data. There are no significant relationships between any violence variable (hitting or throwing object, arguments got physical, respondent use of violence, or respondent victimization) and physical health for men. Results for females indicate that women have 40% lower odds of good health if there is hitting or throwing objects in the relationship (p < .01), 32% lower odds of good health when arguments got physical (p < .05), and 37% lower odds of good health if they were victims of male physical violence (p < .05). The only category in which there was no significant relationship between health outcomes and violence exposure for women was female use of violence in the relationship.
Longitudinal Analysis. Good Health or Better Modeled. Random Effects Logistic Regression Models

p < .001. **p < .01. *p < .05. ^p< .1.
Discussion
Assessment of the research question (Are there sex differences in self-reported physical health for men and women who report experiencing IPV?) indicated support for the research hypothesis: there are sex differences in self-reported physical health for men and women who report experiencing IPA. Although rates and ratios of male and female violence were similar in the study sample (refer to Table 2), the results of regression analyses (Table 4) indicate that females, but not males, suffer poorer physical health outcomes because of IPA exposure. The longitudinal nature of this research study makes it possible to imply that poor health outcomes are not only correlated with exposure to IPA (as seen in Table 3) but that IPA actually causes poor health outcomes for women.
This finding conflicts with previous literature suggesting that IPA poses health risks for both males and females (Campbell, 2002; Centers for Disease Control, 2008; Coker et al., 2002; Cronholm, 2006).The conflict could be because most previous research examines women alone, men alone, or uses cross-sectional data. This research suggests that women exposed to hitting or throwing objects, physical violence, and women who report being victims of a partner’s violence all suffer worse self-reported physical health outcomes than women who are not exposed to IPA. The same is not true for men. There were no measures of physical violence that indicated worse physical health for men who experienced IPA. This supports use of feminist measures of symmetry, which include measures of violence outcomes (Kimmel, 2002). Furthermore, it suggests that similar rates or ratios of male to female violence do not necessarily indicate that the violence has the same effects on victims.
These results signify that sex shapes violence by men and women differently; there is something about being male or female that makes the experience of IPA lead to different outcomes. One may hypothesize about why violence exposure may have differential effects on health for males and females. It is possible that men are stronger, or are more accustomed to violence exposure because of higher rates of male violence outside of intimate relationships, and so IPA does not affect their health as severely. This could be due, in part, to gendered sexual pairings of smaller females with larger males (Anderson, 2005) that put women at a size and strength disadvantage. Another explanation is that women (but not men) often experience increased isolation, decreased access to resources, and lower social support in abusive relationships (Johnson, 2008; Menjivar & Salcido, 2002; Stark, 2007); this could amplify the effects of the violence for women, but not produce the same effects for men.
It is plausible that because the research does not distinguish between aggressive or self-defense motives, expected negative health outcomes of males who are victims of primarily aggressive females could be masked by including men who are primarily perpetratorial in the same group of “violence-exposed” individuals. In other words, combining all violence exposure, without differentiating between self-defense motives, could mask negative effects for male victims.
The findings of this research indicate that even when there are similarities in rates and ratios of reported violence for males and females, IPA outcomes are not necessarily symmetrical. The sex differences shown through this research are evidence of the importance of recognizing that while rates and ratios of violence may be quantitatively similar (Table 2), they may be qualitatively different in that they produce different effects (Table 4). These differences may lead to sex-specific classifications of violence as a public health risk among heterosexual couples.
When identifying public health risks, oftentimes certain groups are deemed “risk groups” if they experience a greater risk of negative effects by exposure. Risk groups are targeted for prevention and early intervention. For example, although men and women can both develop breast cancer, women are at a greater risk, and as such, women are targeted for interventions to prevent or reduce harm from the disease (Weiss, 2003). This does not mean that a male with breast cancer would not receive treatment. In the same way, the results of this study indicate that females are the primary risk group for negative health effects from IPA. This does not mean that male victims of IPA should not receive services. Nor does it mean that female violence cannot do harm; such harm is evidenced by research of IPA in lesbian relationships (Ristock, 2005). It does indicate that targeting resources and early intervention toward females could possibly reduce the risk of poor health outcomes. Future research should examine the extent to which targeting women as a risk group for IPA-related health problems can reduce the negative physical health effects for violence-exposed females.
Study Limitations and Strengths
Data limitations create barriers to a full assessment of IPA and health outcomes in this research. The analysis was a secondary analysis of data not designed with the research question in mind. The data are limited in assessing a wide variety of types of violence, aggression, and abuse. For example, the NSFH does not measure sexual violence, homicide, suicide, coercive control, or power in relationships. Furthermore, a full range of questions about violence was only asked of respondents in a heterosexual cohabiting or married relationship at the time of the survey. This made it impossible to assess adequately IPA for previous partners, noncohabiting dating partners, or homosexual partners.
In an ideal world, surveys would provide information on gender as well as on sex ratios. Because sex and gender are not necessarily interchangeable, this research focuses on sex differences. Future research should try to assess gender in a similar analysis.
It was not possible to know meanings behind violent acts or motivations for violence; there was no differentiation between self-defense and aggressive motives. Although men and women may be simultaneously victims and perpetrators of IPA, it is not possible to parse out the effects of perpetration from the effects of victimization. This research does examine whether the respondents were reported by either themselves or their partner to use abuse, and it is possible that some reports are inaccurate due to self-reporting of violence. Because it is not socially acceptable to report IPA, researchers can assume that there were individuals who did experience violence but did not report it in the data. Additionally, the nature of surveys often excludes those who are victims of severe violence (Salari & Baldwin, 2002). A victim with a controlling partner may reject the opportunity to participate because of fear of angering the partner, and in data collection such as this where both partners are interviewed severe violence may go unreported because of fear that a partner will punish the victim for reporting the violence. There is no way to account for these individuals.
Although the data are longitudinal and follow individuals over 15 years, there is no measurement of violence before Wave 1. Furthermore, if an individual experienced violence between the waves, but not during the past year (Sweet & Bumpass, 2002), the violence was not reported in the data. This means that many individuals may have experienced IPA that was unaccounted for because the questions were not asked frequently enough and were limited to violence that occurred in the 1 year prior each wave of data collection. These limitations indicate that violence was probably undercounted in the data.
Even accounting for limitations as stated, strengths of the current study make it a substantial contribution to current IPA literature. A crucial strength of the data is the longitudinal nature of the sample. Each variable was measured for each respondent in the sample at a minimum of two of the waves. This means that rather than assessing simple correlation between variables, we can assess the relationship of variables through time, and more accurately imply causation. This is not possible with cross-sectional data. The large sample size made it possible to analyze IPA, which is not highly prevalent in the population. It also made it possible to include all necessary control variables in the models without fear of a shortage of degrees of freedom. Moreover, the inclusion of both males and females in the study made this research unique in that it assesses outcomes for both sexes. This allows for comparison of the relationship between health and IPA for both men and women.
Conclusions
In conclusion, there are sex differences in self-reported physical health outcomes for men and women experiencing IPA when using longitudinal analysis of a population-based sample. Specifically, females experience poor physical health outcomes when exposed to IPA, but the same negative effects are not found for males in the study sample. Results indicate a need to examine differences in outcomes of violence in research of IPA sex symmetry. Suggestions for future research include a wider assessment of both health and violence and an assessment of gender in lieu of sex ratios. Future research could also assess an array of health outcomes rather than focusing on only self-reported physical health outcomes. These findings are likely to be of interest to those who study families, intimate partner abuse, and health.
Footnotes
Declaration of Conflicting Interests
The author(s) declared no potential conflicts of interest with respect to the research, authorship, and/or publication of this article.
Funding
The author(s) received no financial support for the research, authorship, and/or publication of this article.