



Abstract
Background:
The literature on the effects of teacher coaching in early childhood (EC) education programs is underdeveloped but emerging. Using the theory of action in professional development as our theoretical framework, we hypothesize that active coaching improves teaching methods and creates a more effective classroom environment for enhancing children’s learning and skills.
Objectives:
This study evaluates the effects of the Mississippi Building Blocks (MBB) program, an EC intervention with a strong emphasis on supervisor and coaching training.
Research design:
We conduct a randomized controlled experiment in which data were collected at baseline, midpoint (Month 3), and postintervention (Month 6) in 24 preschool classrooms in Mississippi.
Subjects:
The experiment included 195 preschoolers, of which 95 were in classrooms led by teachers who received coaching (treatment) and 100 were in classrooms without coaching (control).
Measures:
We measured child’s emergent language and literacy, fine motor skills, gross motor skills, print language skills, problem-solving, math skills, and socioemotional development.
Results:
We find that MBB coaching led to substantial improvements in child outcomes relative to the control group, particularly in gross motor skills, print language skills, and socioemotional development. We also find some evidence that MBB coaching improved math skills, though these estimates are on the margin of statistical significance. Finally, a mediator analysis indicates that improvements in the classroom learning environment brought about by MBB coaching improved child outcomes.
Conclusions:
Our findings suggest that an intensive form of classroom coaching for teachers leads to significant gains in child outcomes.
There is substantial evidence on the positive effects of high-quality early childhood (EC) programs. In particular, various studies show how high-quality EC education programs can be the primary source of developing cognitive and socioemotional skills for at-risk children (e.g., Belfield, Nores, Barnett, & Schweinhart, 2006; B. Bowman, Donovan, & Burns, 2001; Campbell et al., 2012; Gormley, Gayer, Phillips, & Dawson, 2005; Hill, Gormley, & Adelstein, 2012; Reynolds, Temple, Ou, Arteaga, & White, 2011). Many EC educators—particularly those who work with children from disadvantaged backgrounds—lack the training required to enhance classroom practices in preschool (Ray, Bowman, & Robbins, 2006; Saluja, Early, & Clifford, 2002). Recognizing that not all teachers have sufficient training, educators and policy makers increasingly seek ways to provide teachers with professional development opportunities in order to help them more effectively create a productive learning and socializing environment (W. S. Barnett, 2003; Ladson-Billings, 1999; National Association for the Education of Young Children, 2002).
In this study, we contribute to the emerging literature on the effects of a particular type of professional development program—teacher coaching—by describing the results of a randomized controlled experiment. Specifically, we analyze the effects of a coaching program that was part of Mississippi Building Blocks (MBB) to answer the following questions: (1) What is the effect of the MBB coaching program on the classroom environment? (2) What is the effect of the MBB coaching program on children’s outcomes? and (3) Does fidelity of implementation affect children’s outcomes? In comparing outcomes of children in classrooms with teachers who received coaching to those of children whose teachers were not formally coached, we find that the coaching component of the MBB program led to substantive gains in observed child–teacher interactions and children’s performance on cognitive tests. We also examine variation in effects related to the fidelity of program implementation and find that gains were larger in settings where program fidelity was higher. Taken together, these results suggest that intensive teacher coaching programs have the potential to improve children’s outcomes in EC classrooms.
In the next sections, we describe the theoretical basis of and prior evidence on coaching and then describe the intervention and experiment. Next, we discuss the effects of MBB on child outcomes, provide an analysis of classroom environment improvement as a mechanism for program effects, and provide an analysis of program implementation. We conclude with implications for policy and future research directions.
Background on Coaching Programs
The literature shows that historically, many educators only experienced professional development in the form of mandatory meetings organized by school districts or the state during the summer. Prior research on teacher survey and interview responses suggests such teaching conferences and workshops do not improve children’s learning experiences because the content is not necessarily related to current work in the classroom and also because teachers are passive learners in this format with limited or no time for practice or follow-up (Darling-Hammond & Bransford, 2007; Sandholtz, 2002; Smylie, 1989). More recently, however, teacher professional development has evolved to include interactive components such as recurring and sustained training activities, collaboration among teachers about improving teaching, and coaching (Croft, Coggshall, Dolan, & Powers, 2010; Yoon, Duncan, Lee, Scarloss, & Shapley, 2007).
McNiff (1993) is one of the first educational researchers to suggest the value of a coaching model in teacher professional development. Most coaching programs follow a model where a novice teacher plans with a coach (typically a fellow teacher or an expert in the field), the coach observes the teacher, and the teacher and coach collaboratively reflect and set goals (Hsieh, Hemmeter, McCollum, & Ostrosky, 2009; Joyce & Showers, 1980). Expert coaching allows for a relationship in which the novice teacher can gain independence from the expert over time and can develop reflective thinking skills (B. G. Barnett, 1995).
Effectiveness of coaching programs
Evidence suggests that teachers who receive coaching have a more positive outlook on their job and position and that coaching can facilitate teachers’ cognitive network formation (e.g., Edwards & Newton, 1995; Fox, Hemmeter, Snyder, Binder, & Clarke, 2011; Hasbrouck, 1997). Numerous studies have examined teacher coaching at the elementary (e.g., Batt, 2010; Kohler, Crilley, & Shearer, 1997; Kohler, Ezell, & Paluselli, 1999), middle (e.g., Ross, 1992; Vogt & Rogalla, 2009), and high school levels (e.g., Lovett et al., 2008; Vogt & Rogalla, 2009; Zwart, Wubbels, Bergen, & Bolhuis, 2009). A number of studies found no effects of coaching (C. L. Bowman & McCormick, 2000; Murray, Ma, & Mazur, 2009; Shidler, 2009; Van Keer & Verhaeghe, 2005); however, some provide promising evidence that coaching can aid curriculum implementation, children’s engagement and academic achievement, and the perceived efficacy of teachers (Batt, 2010; Ross, 1992).
An emerging literature examines the effects of coaching on teaching in preschool. The most compelling studies come from randomized controlled trials, where the findings are mixed but mostly favorable. Some studies find that coaching interventions improved classroom environments, teacher–children interactions, and child cognitive outcomes (Landry, Anthony, Swank, & Monseque-Bailey, 2009; Pianta, Mashburn, Downer, Hamre, & Justice, 2008; Powell, Diamond, Burchinal, & Koehler, 2010), while others find no improvement on instructional quality (Justice, Mashburn, Hamre, & Pianta, 2008).
The effects of coaching appear to vary by the intensity of involvement, such as involving more than 60 hr of coaching per academic year (Biancarosa, Bryk, & Dexter, 2010; Landry et al., 2009; Sailor & Price, 2015) or involving less than 40 hr per academic year (Justice et al, 2008; Powell et al., 2010; Powell, Diamond, & Koehler, 2010). High-intensive coaching programs like the Literacy Collaborative (LC; Biancarosa et al., 2010) and the Support for the Improvements of Practices through Intensive Coaching (SIPIC; Sailors & Price, 2015) reported statistically significant large effect sizes.
Importance of fidelity
Among K–12 education studies that address fidelity of coaching programs and its relationship to outcomes, the findings clearly indicate significant concerns related to the relationship between measures of fidelity and intervention outcomes (O’Donnell, 2008). For instance, in many cases, teachers did not implement more than half of prescribed intervention activities; in other cases, teachers made notable classroom-level adaptations (Knocke, Sheridan, Edwards, & Osborn, 2010; Odom et al., 2010). Despite the challenges of implementing a teacher coaching intervention (Lu, 2010), higher fidelity scores are related to better professional development (Domitrovich, Gest, Jones, Gill, & Sanford De Rousie, 2010; Fox et al., 2011; Noell et al., 2010; Reinke, Stormont, Herman, & Newcomer, 2014).
The MBB Intervention
The MBB program launched in 2009 with sponsorship from several Mississippi foundations and leaders. MBB was created to support EC programs serving primarily children (birth to kindergarten entry) who lacked readiness for school. During the period from 2009 to 2014, MBB operated in 39 of the 82 counties in the state of Mississippi.
While the MBB program supports a number of aspects of the learning environment, our analysis focuses on the 2013–2014 year of the MBB program, which had a strong emphasis on coach training. All coaches were credentialed EC professionals (i.e., holding bachelor’s or master’s degrees in EC education). During the summer prior to the academic year, the coaches attended an intensive training. There, in addition to learning content and methods, the coaches participated in sessions where they practiced reliably implementing the program’s tools and instruments. Coaches also practiced how to present the information to classroom teachers and how to demonstrate each instructional skill. Once trained, coaches spent an average of 125 hr on intensive, classroom-based coaching with each teacher over the 9-month school year.
The MBB coaching model, depicted in Figure 1, emphasized data-informed supervision, coaching, and instruction. In Figure 1, the solid arrows represent the coaches’ direct instruction of specific information and the modeling of instructional techniques. Each of these three points incorporates fidelity tools, checklists, and progress monitoring for oversight of the coach as the coach instructs the teacher, oversight of the teacher as the teacher pursues the standards and ideals of MBB’s classroom instruction, and oversight of the teacher as the teacher instructs children. The dotted arrows represent interactions between coach and teacher and teacher and child. Interaction takes the forms of coaching (observation and performance feedback) and progress monitoring.
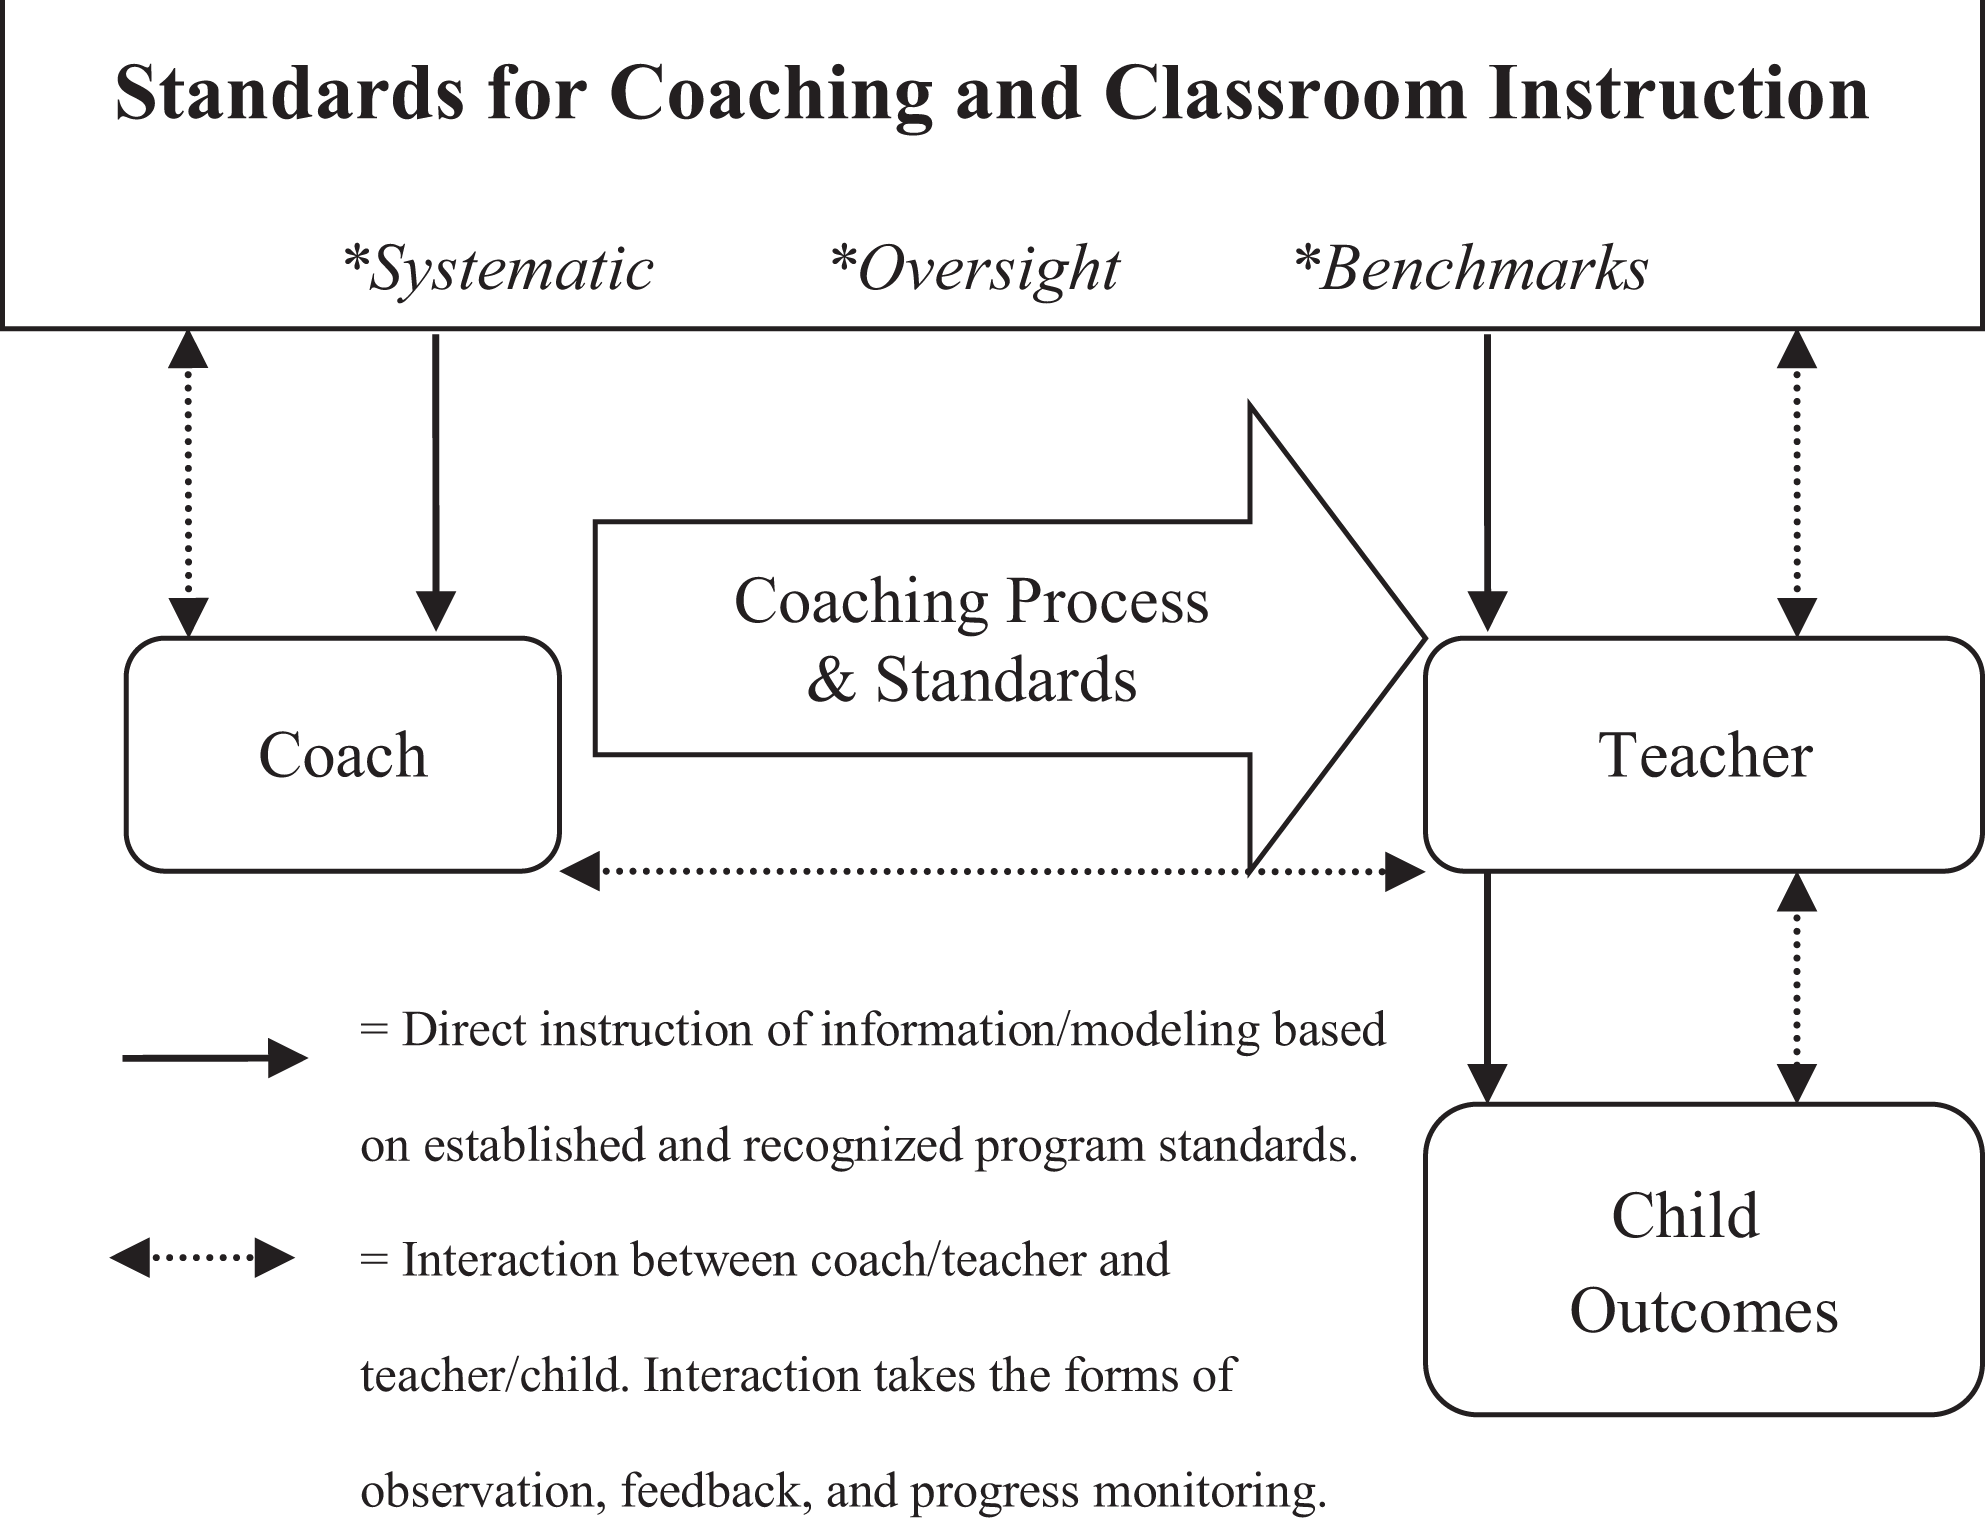
Recommended model for Mississippi Building Blocks coaching.
Coaching Curriculum
Between the Lions is a language- and literacy-focused curriculum that emphasizes using storybooks, short videos, songs, poems, and learning-center ideas to help children learn emergent language and literacy knowledge and skills (WGBH Educational Foundation and Sirius Thinking, Ltd., 2007). Coaches used Between the Lions, focusing on the following practices: First, coaches helped teachers to monitor class progress and use findings to inform lesson plans and instruction based on each child’s needs. As part of this, coaches helped teachers use anecdotal notes and small group instruction to track children’s development and progress. Second, to help improve the learning environment, coaches used guidelines from the Early Language and Literacy Classroom Observation Tool (ELLCO; Smith, Brady, & Anastasopoulos, 2008), along with the Early Learning Standards as adopted by the Mississippi Department of Education, to guide their work with the teachers. The ELLCO allowed coaches to determine whether the organization of the classroom, the classroom climate, and classroom management strategies were adequate to support children’s language and literacy development and, if not, to provide suggestions to teachers. Third, coaches helped teachers use small groups within the classroom to enhance learning experiences for children. Fourth, coaches worked with teachers to write weekly lesson plans based on Between the Lions to ensure all lessons aligned with the Mississippi Early Learning Guidelines. Finally, coaches worked with teachers to ask higher level, open-ended questions and engage in meaningful conversations with children each day.
Coaching Model
Returning to Figure 1, the MBB coaching concepts are embedded within the broad context of fidelity, a term frequently used interchangeably with terms such as treatment integrity and treatment fidelity (DiGennaro Reed & Codding, 2014). Fidelity of implementation is the organizational processes and the use of resources related to implementing the intervention—in our case, the MBB program within the classroom settings. It responds to the question of: To what degree is the implementation of the intervention occurring in a manner consistent with expectations of the MBB ideals/goals and consistent across intervention sites? We address fidelity of implementation in this study.
Supervisors and coaches assessed fidelity to the MBB program at three time points: prior to the implementation of the coaching program (October), at the midpoint (January), and at end point (April). Supervisors conducted a fidelity assessment in the classroom using an age-appropriate fidelity tool developed by MBB in partnership with the independent evaluator. Coaches used a series of age-appropriate instructional checklists to assess teachers’ implementation of the program. Specifically, coaches graded teachers on their ability to develop appropriate instructional skills using the Learning Center Instructional Checklist and Shared Storybook Instructional Checklist, used the Small Group Instructional Checklist to grade teachers’ use of small group instruction, and tracked teacher interactions with students using the Teacher Talk Instructional Checklist. In addition to the checklists, coaches used anecdotal notes to supplement the observation data.
Study Design, Measures, and Analytical Methods
Population and Study Sample
All Mississippi EC program directors interested in participating in the 2013–2014 MBB program year were invited to submit an application to the MBB office. To be considered for the program, an applicant organization had to be a licensed childcare center with no current sanctions or licensure probation, in operation for at least one calendar year, and paying all teaching staff at least minimum wage. Participating preschool children had to attend the program at least 25 hr per week, be between 2 years and 10 months old and 5 years old at the time of enrollment into the study, anticipate enrollment in the program for at least 6 months, have basic/minimal (age-appropriate) English skills, and have age-appropriate capacity to complete the assessments.
Seventy-eight EC programs met all of the eligibility requirements. At this stage, qualifying directors signed a Memorandum of Agreement, and at this point prior to randomization, teachers and families from the qualified respondent programs gave written consent for participation in the study. This study uses a randomized block design of Size 2; specifically, from the selected programs, the research team randomly selected one treatment and one control EC program in each of 12 geographic areas for the impact evaluation. Only one preschool classroom participated in each EC program. The random selection resulted in 12 treatment-group preschool classrooms with MBB coaching and 12 control-group preschool classrooms that did not receive the MBB intervention (Table 1). Each classroom had one lead teacher and one assistant teacher.
Classroom and Coach Frequencies.
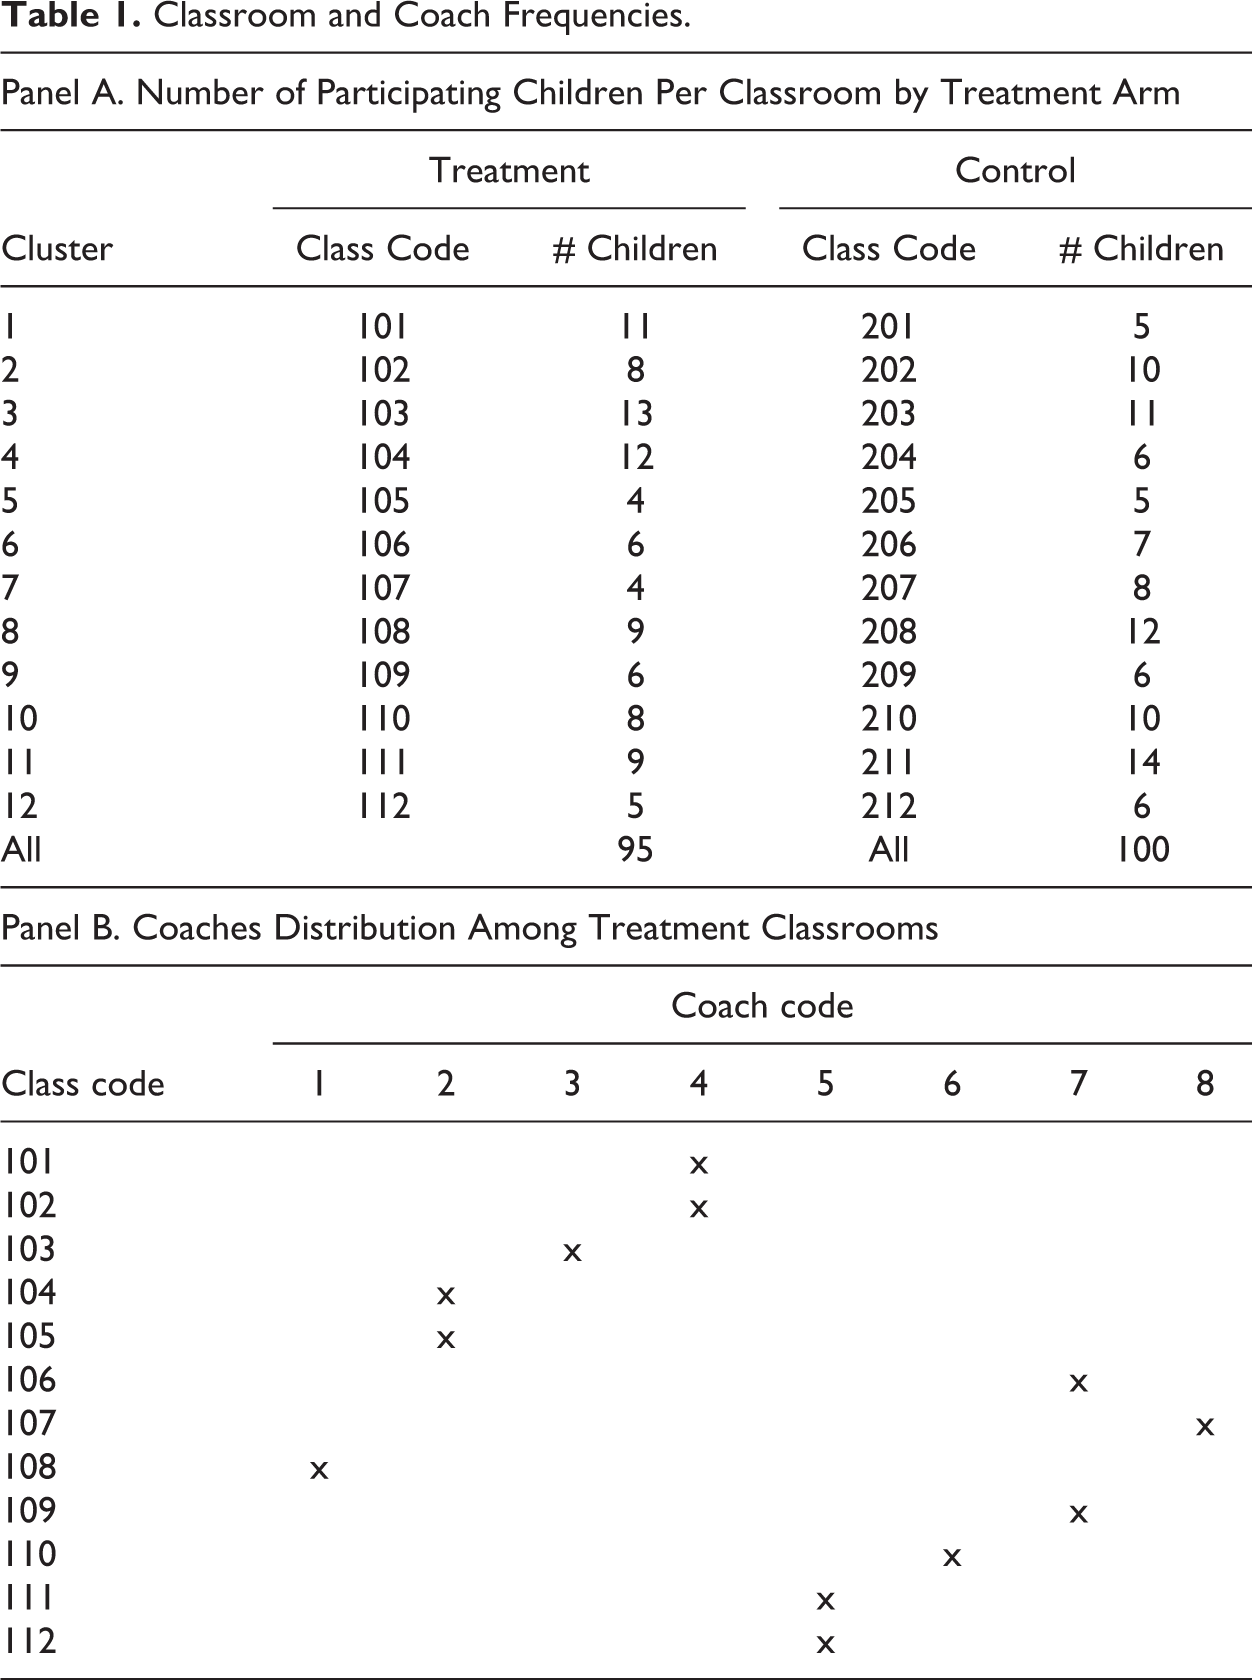
A total of 236 preschoolers were initially included in the experiment: 113 in treatment classrooms that received coaching and 123 in control classrooms that did not receive the MBB intervention. However, due to attrition, the sample used in this study consists of 195 children—95 in the treatment group and 100 in the control group—which represents 83% of the original sample. 1
Children were 3 and 4 years old with an average age of almost 4 years. Each classroom had an average of 11 students, but on average, in our study sample, only about 8 children in each classroom participated in the study (73%) due to parental consent. More than 75% of the children in our sample received free or reduced-price lunch, which reflects the low socioeconomic status of the families in our sample.
Table 2 displays summary statistics for the study sample, including average child, family, and teacher characteristics among the two groups, along with a test of equality among treatment and control groups (t test). Treatment and control groups are statistically indistinguishable at the 95% confidence level across all pretreatment child and family characteristics. In other words, at baseline, the two groups of children look similar to each other, on average.
Summary Statistics.
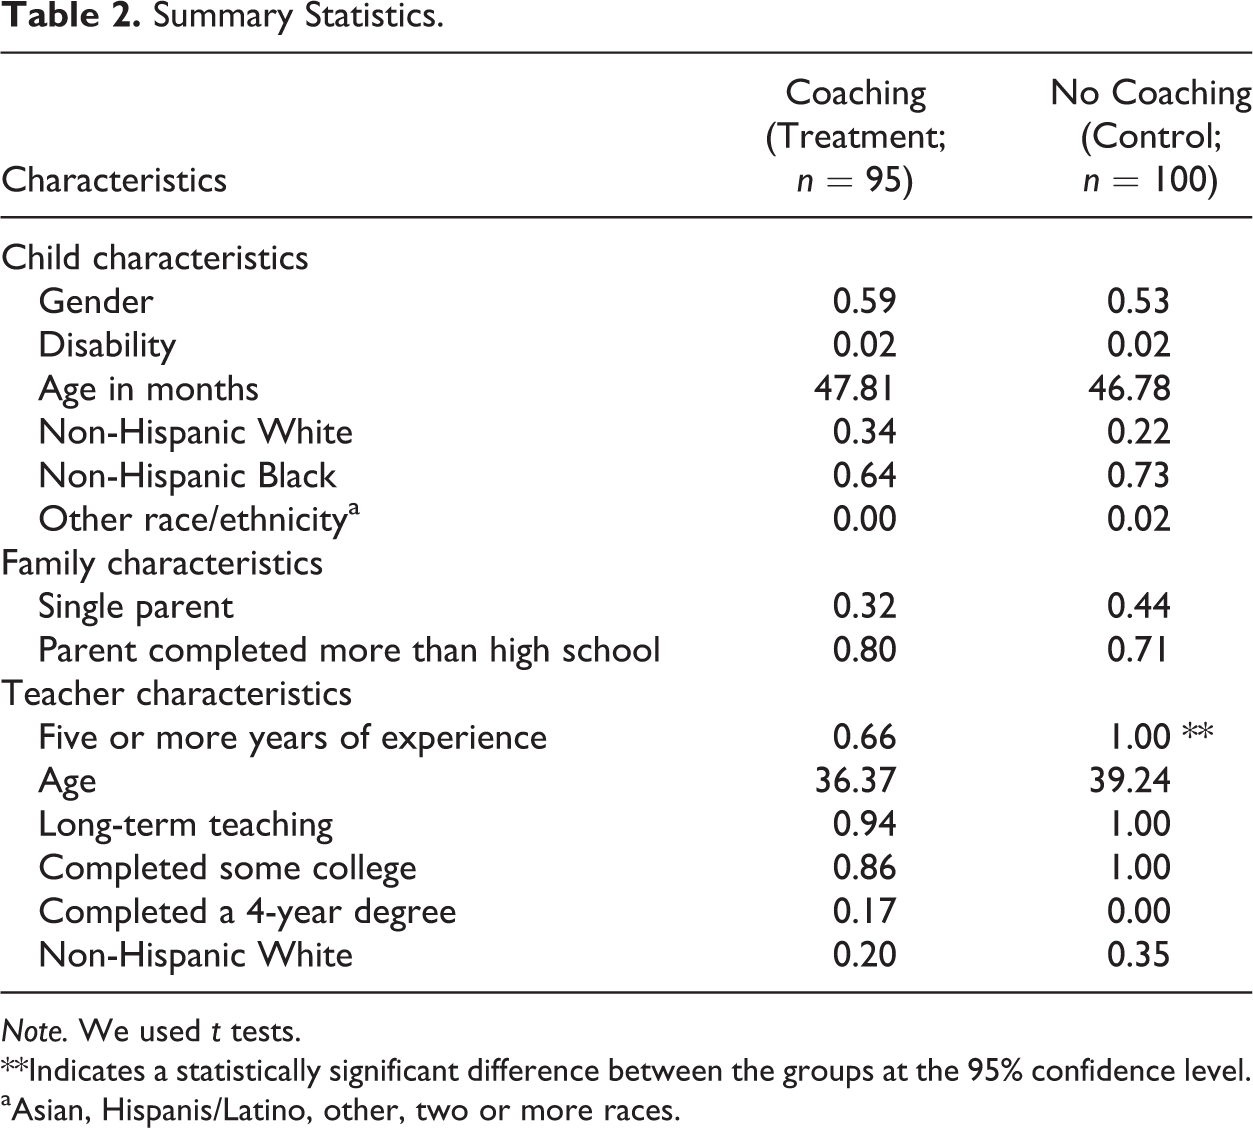
Note. We used t tests.
**Indicates a statistically significant difference between the groups at the 95% confidence level.
aAsian, Hispanis/Latino, other, two or more races.
The one statistically significant difference we find is that teachers in the control group were more likely to have at least 5 years of work experience than teachers in treatment classrooms. It is important to remember that teachers signed consent forms prior to randomization, and there is no indication that the EC centers switched teachers after randomization. This means that the discrepancy between teacher’s years of experience in the treatment and control groups is due to chance. However, because we would expect that having more experienced teachers would lead to better child outcomes, we acknowledge the potential for this difference in teacher experience to attenuate our findings.
Measures and Procedures
The study data came from parents, coaches, supervisors, and teachers. Parents gave permission for the program to provide information regarding their child’s eligibility for free or reduced-price lunch, special needs status, race/ethnicity, and family composition (e.g., one or more adults in the home). Coaches and teachers also completed a brief demographic survey regarding their work experience, education, and credentials.
As described below, we used numerous instruments and measures to examine whether the MBB program affected children’s cognitive and social outcomes through improved instructional practices and, if so, by which mechanisms; assess instructional practices through classroom observations, coach surveys, and child surveys; and determine the program’s fidelity of implementation.
Children’s outcomes
We used four instruments to assess children’s development: the Test of Preschool Early Language (TOPEL), the School Readiness Assessment (SRA), the Woodcock-Johnson III Applied Problems (W-J III), and the Devereux Early Childhood Assessment (DECA). We employed as consultants a team of child assessors, who resided in Mississippi, to administer the instruments at two time points: October 2013 for pretest and then approximately 6 months later in April 2014 for posttest.
The TOPEL is an assessment of emergent language and literacy for young children aged 3–6 years. We administered two subscales of the TOPEL Print Knowledge (36 items; measures written language conventions and alphabet knowledge) and Definitional Vocabulary (35 items; measures oral vocabulary and definitional vocabulary).
The research team developed the SRA as a multisegment assessment. 2 In this study, we use fine motor and gross motor segments. Most items are scored as either zero (the child missed the item) or one (the child successfully completed the item). W-J III Applied Problems is a 58-item subscale from the Woodcock-Johnson III Tests of Achievement. This subscale focuses on problem-solving and math skills.
To assess socioemotional development, teachers completed the DECA, which is designed for use with 3- to 5-year-old children. This 37-item instrument has three subscales—Initiative, Self-control, and Attachment—which are aggregated into the total protective factors score.
Instructional practices
We assessed classroom quality using the ELLCO Pre-K Tool (Smith & Dickinson, 2002), which we administered at the pretest and posttest time points. The ELLCO uses 19 items that are part of five sections: classroom structure (4 items), curriculum (3 items), the language environment (4 items), books and book reading (5 items), and print and early writing (3 items). Each item is scored on a 5-point scale (1 = deficient, 2 = inadequate, 3 = basic, 4 = strong, and 5 = exemplary). The ELLCO Pre-K User’s Guide reports high internal consistency with Cronbach’s αs that rank from .73 to .90 across subscales. Specifically, in our data, the Cronbach’s αs rank from .71 to .99 across subscales, which show high internal consistency. Moreover, we also ran factor analysis using the questions that describe each subscale to confirm that only one construct is measured. As the Kaiser criterion suggests, we retained those factors with an eigenvalue greater or equal to one (Costello & Osborne, 2005). The idea behind the Kaiser criterion is that a factor with an eigenvalue greater than one accounts for more variance than would a single item, which suggests that it is worth combining those items into a single factor. In sum, both analyses confirm the validity of the subscales.
Fidelity of implementation
In this study, we follow the literature by assessing fidelity of implementation using three measures: adherence, dose, and adaptation. Adherence refers to the degree to which the teacher presents the content consistent with the intent of the curricular guide. Dose refers to the amount of content delivered by the teacher. Adaptation refers to the type and extent of changes made to the intervention by the target population (Hagermoser Sanetti, & Kratochwill, 2009).
We used the MBB Preschool Fidelity Tool, a 14-item observation measure that examines four aspects of implementation in the preschool classroom: use of BTL curriculum; space, furnishings, and activities; language-reasoning; and program structure. An MBB supervisor or coach (other than the coach assigned to the observed classroom) conducted the fidelity observations at three time points: pretest (October 2013), midpoint (January 2014), and posttest (April 2014). To assess fidelity in these four areas, the observer first scored adherence, where either the specific item was observed or it was not observed (1 = not observed, 2 = observed); an example adherence item is “Teacher encourages the development of children’s vocabulary.” Second, the observer assessed dose/duration, which addressed the degree to which the teacher displayed the instructional practice(s) consistently over the course of the observation (1 = inadequate, 2 = minimal, and 3 = good). Lastly, the observer assessed quality of delivery, or the degree to which the teacher implemented specific aspects of the program in the manner intended by MBB (1 = inadequate, 3 = minimal, 5 = good, and 7 = excellent). Measure of the last two types of fidelity (dose/duration and quality of delivery) was based on the professional judgment of the observer. The internal consistency of the items for each dimension was high, with Cronbach’s α of .84, .89, and .89 for adherence, quality of delivery, and dose, respectively. With two observers at each time point, the interrater reliability coefficient was .85.
The traditional approach for evaluating intervention fidelity involves aggregating fidelity ratings of items that capture the same components across measurement instruments (Durlak & Dupre, 2008). We use this approach, specifically following Abry, Hulleman, and Rimm-Kaufman (2015), wherein we average all items that capture dosage to create a dosage fidelity index, average all items that capture quality of delivery to create a quality of delivery fidelity index, and average all items that capture adherence to create an adherence fidelity index.
Empirical Analysis
To answer our first research question, “What is the effect of the MBB coaching program on the classroom environment?,” we observe classroom environment outcomes at two time points: pretreatment in October 2013 (period t − 1) and posttreatment in April 2014 (period t). We use a linear regression model to estimate the posttreatment outcome of each classroom j in geographical location c as:

In this model, we estimate classroom environment as a function of MBB, which is an indicator equal to one if the classroom is an MBB (treatment) classroom and zero if the classroom is a non-MBB (control) classroom. Because of random assignment of treatment and control classrooms, the coefficient on this indicator, θ, serves as an estimate of the causal effect of MBB coaching on the change in average classroom environment outcomes relative to the baseline period.
Our preferred model controls for baseline classroom environment from the pretreatment period, Ej,c,t−1, and a vector of geographical location dummies in Dc. Because of the randomized blocks design of this study, control variables are not necessary to obtain an unbiased causal estimate of the treatment but aid in precision. Here,
We use hierarchical linear modeling (HLM; Raudenbush, Bryk, & Congdon, 2002) to answer our second research question “What is the effect of the MBB coaching program on children’s outcomes?” Students were nested in classrooms in the design of this study. HLM allows multiple regression that coordinates analysis at both the child and classroom levels. At the first level (child), we use HLM to predict child posttest score from their pretest score and a set of control variables. At the second level (classroom), we use HLM to predict whether child’s posttreatment outcome score varied by classroom conditions. The two-level model is specified as:


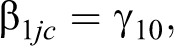
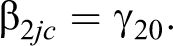
In this model, in Level 1, we again estimate outcomes as a function of lagged outcomes and a vector of child and family characteristics, X. We specifically control for child’s gender, race/ethnicity, age in months at pretest, family poverty status, single parent status, and parent’s education. In Level 2, each classroom’s intercept, β0jc, is a function of a grand mean γ00. It is also a function of MBB participation, which takes a value of one if a child attended an MBB (treatment) classroom and zero if a child was in a non-MBB (control) classroom. Because of random assignment of treatment and control classrooms, the coefficient on this indicator, θ, serves as an estimate of the causal effect of the MBB coaching on child outcomes. Additionally, we include a T-vector of teaching characteristics. We specifically control for teacher’s age at pretest, experience, education, and race/ethnicity. We also include a geographical vector as in Equation 1 and a random error µoc.
We next seek to understand how MBB coaching affects child outcomes by examining whether observed variation in the classroom environment, which will be a measure of effectiveness of MBB implementation, is a mechanism through which child outcomes improved. Specifically, we examine whether variation in the classroom environment, as measured by ELLCO scores, correlate to child outcomes, and if the effects of MBB coaching decrease with the inclusion of ELLCO scores. Thus, we add classroom-level ELLCO score to Equation 2:


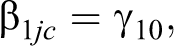
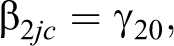
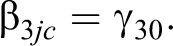
Here, the term Eict represents the posttest ELLCO assessment score. Conceptually, if the treatment effect estimated by Equation 2 is driven by improvement in the classroom environment as measured by the pre- to posttreatment change in ELLCO scores, we should observe a weakened relationship between MBB coaching and outcomes, as estimated by θ.
We estimate the average causal mediational effect (ACME) by taking the product of the coefficient on the treatment variable in Equation 2 and the coefficient on the mediator in Equation 3, θ × γ. Specifically, we use an algorithm (Hicks & Tingley, 2011; Imai, Keele, Tingley, & Yamamoto, 2010; Pearl, 2001) that simulates the predicted values of our variables of interest and then calculates ACME, direct effects, and total effects to address criticisms that the mediator is not randomly assigned, as it is the treatment with experimental data (Bullock, Green, & Ha, 2010). This is important to address because mediational analysis, as proposed by Baron and Kenny (1986) and Kenny, Kashy, and Bolger (1998), relies on four main assumptions: (1) no unmeasured confounding of the relationship between the control variables (X) and the outcome variable Y, (2) no unmeasured confounding of the relationship between the mediational variable (M) and outcome variable Y, (3) no unmeasured confounding of the X–M relationship, and (4) any variable on vector X must not cause any confounder of the relationship between M and Y. We test these assumptions in the following way. The first assumption is tested by regressing the dependent variable onto the independent variable (MBB) to demonstrate that there is an effect to be mediated. The second assumption is tested by regressing MBB into the mediator measure (ELLCO) to observe whether these two variables are in fact related. The third assumption is tested by regression the dependent variables onto the mediator (ELLCO) while controlling for observed characteristics that might affect both the dependent variable and MBB participation. Finally, we regressed the dependent variable onto MBB while controlling for the effect of ELLCO and children characteristics, teacher characteristics, and geographical location using Equation 3. For full mediation, we expected the coefficient of MBB to be statistically nonsignificant. For partial mediation, we expected a reduction of the effect of MBB on the dependent variable while still be statistically significant.
To answer our last research question, “Does fidelity of implementation affect children’s outcomes?,” we first present descriptive statistics of the adherence, duration, and quality fidelity measures by time point to examine whether fidelity of implementation improves over time. The underlying assumption is that professional development will be more effective over time if teachers consistently apply in the classroom what they learned from their interactions with the coaches. In other words, adherence, duration, and quality are expected to increase over time.
Finally, we analyze whether variation in the measures of fidelity (adherence, dose/duration, and quality of delivery) to the MBB coaching program differentially affects child outcomes. Because only treatment-group children were in classrooms evaluated in the MBB teacher assessment, we limit the sample to treatment-group children and estimate outcomes as a function of the changes in fidelity measure (posttreatment minus pretreatment) with the same covariates as in the prior equations:


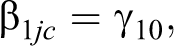
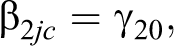
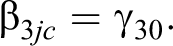
The estimated coefficient on the fidelity measure,
Findings
To distinguish the gains associated with the MBB coaching program separately from the gains children could have experienced naturally over time, we report estimates of the gains in outcomes of MBB treatment classrooms while netting out the gains experienced by children in control classrooms. We report only the coefficient on the treatment variable; full output from these regression estimates is available from the authors upon request. The reported coefficient represents the gains for the treatment group net of the gains for the control group.
ELLCO
We start by examining subscales and total scale scores for the ELLCO measure, which are the variables that measure classroom environment. Recall that each subscale and the total scale are assessed a 5-point scale (1 = deficit, 2 = inadequate, 3 = basic, 4 = strong, and 5 = exemplary). Table 3 presents pretest and posttest ELLCO statistics and treatment-control differences at pretest and posttest. We observe that at pretest, ELLCO scores indicate “inadequate” classroom quality for curriculum, language environment, books and books reading, print and early writing, and the overall scale; only classroom structure achieves a “basic” rating. We do not find any statistically significant difference at pretest in ELLCO scores between treatment and control groups.
Average ELLCO Scores by Subscale and Total Scale, Means, and t Tests.

Note. The subscale assesses on a 5-point scale (1 = deficient, 2 = inadequate, 3 = basic, 4 = strong, 5 = exemplary). ELLCO = Early Language and Literacy Classroom Observation Tool.
*p < .10. **p < .05. ***p < .01.
At posttest, we observe that, for the overall sample, the ELLCO is rated as “good” for all subscales and the total scale. For the control group, we observe that, on average, the ELLCO is rated as “inadequate” for the total scale and for all subscales except classroom structure; classroom structure is rated as “basic.” However, for the treatment group, the classroom environment shows a “strong” rating for all subscales and for the total scale. The differences for all ELLCO subscales and for the total scale between treatment and control groups are statistically significant.
We can then answer our first research question, “What is the effect of MBB coaching program on the classroom environment?” by running regression models in which the dependent variable is each ELLCO subscale and the independent variable is participating in the MBB program while controlling by preintervention ELLCO subscale and geographical location (Equation 1). Table 4 shows results including only the coefficient on our treatment variable (θ from Equation 1); full output is available from the authors upon request. This regression analysis shows large statistically significant effects of MBB coaching participation on ELLCO Classroom Structure, Curriculum, and Printing and Early Writing subscales and the overall scale. These results also show that the second assumption of mediational analysis is satisfied; we observed that MBB and ELLCO are in fact related.
Estimates of the Effects of MBB on ELLCO Scores.
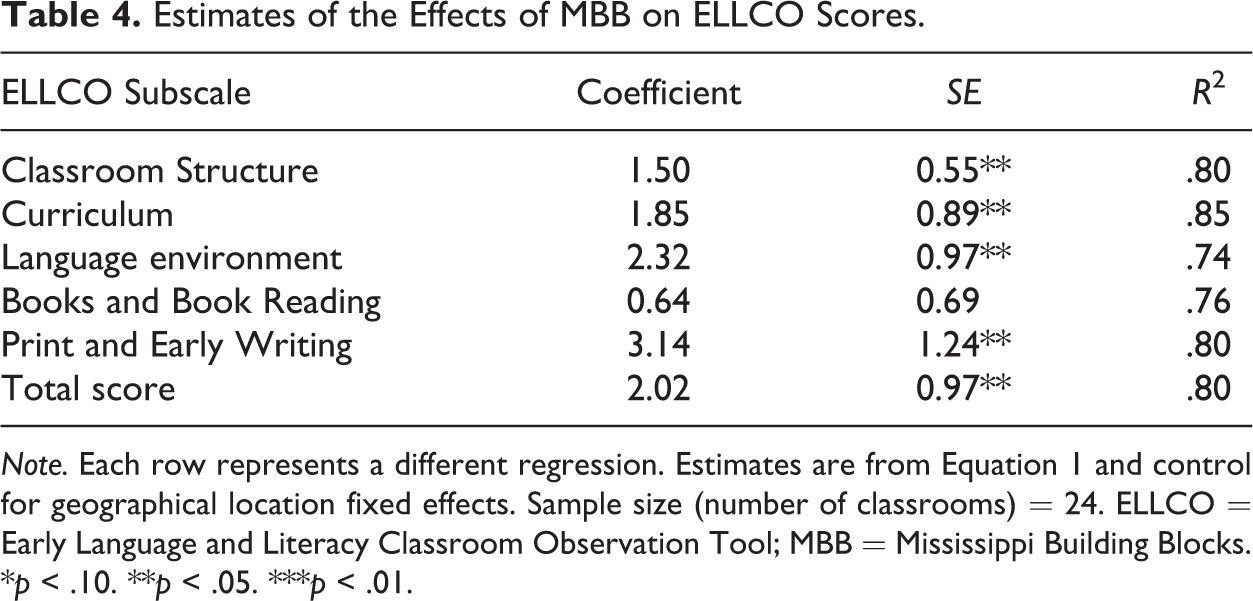
Note. Each row represents a different regression. Estimates are from Equation 1 and control for geographical location fixed effects. Sample size (number of classrooms) = 24. ELLCO = Early Language and Literacy Classroom Observation Tool; MBB = Mississippi Building Blocks.
*p < .10. **p < .05. ***p < .01.
Child Outcomes
Because we use standardized scores, we can interpret results as effect sizes in terms of standard deviations (Table 5). Since classrooms were randomly assigned to receive the MBB treatment, this represents the causal effect of MBB coaching on child outcomes. Table 6 presents estimates of the effects of MBB on standardized outcomes. TOPEL Print Knowledge increased by 0.48 standard deviations; this result is statistically significant with at least 95% confidence. This effect size suggests a moderate practical significance (Cohen, 1977). Estimates for school readiness in gross motor assessment are positive, are statistically significant at 95% confidence, and have moderate effect sizes of 0.70. Estimated effect sizes of MBB participation for W-J III Applied Problems Standard Score showed gains of 0.23, at 90% confidence, representing a moderate practical significance. Finally, DECA assessments also indicated positive associations with MBB participation, with effect sizes of 1.05 and 0.70 of a standard deviation for the total protective factors score and the total attachment score, respectively. Both effect sizes suggest a large practical significance. These results also show that the first assumption of mediational analysis is satisfied for print knowledge, gross motor, applied problems, total protective factors, and total attachment; we observed that MBB positively affects the listed outcome variables.
Means for Standardized Child Outcome Variables (MBB Classrooms).

Note. Each cell represents a different t test. We used standardized scores for each child outcome variable. This conversion places everything on a z-score metric based on pretest scores. TOPEL = Test of Preschool Early Language; DECA = Devereux Early Childhood Assessment; MBB = Mississippi Building Blocks.
*p < .10. **p < .005. ***p < .010.
Estimates of the Effects of MBB on Standardized Outcomes.
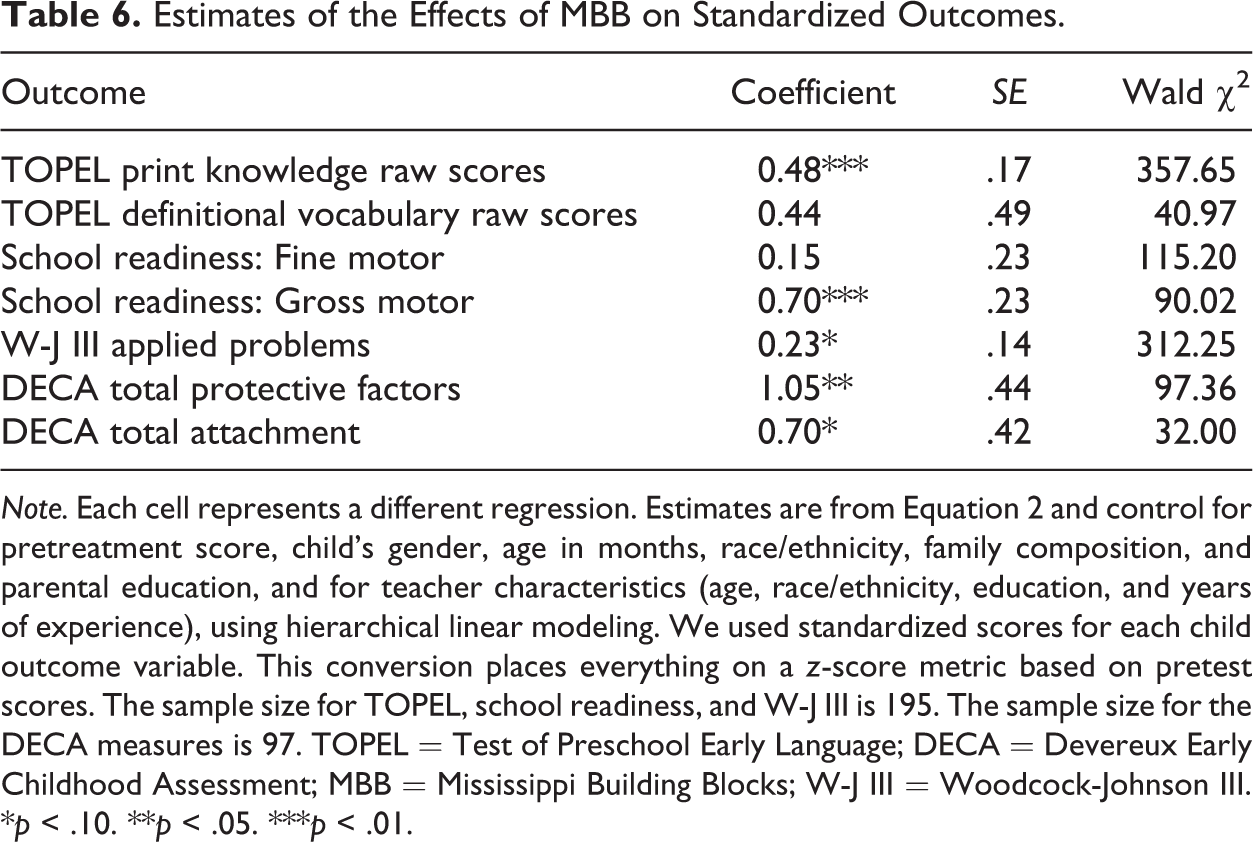
Note. Each cell represents a different regression. Estimates are from Equation 2 and control for pretreatment score, child’s gender, age in months, race/ethnicity, family composition, and parental education, and for teacher characteristics (age, race/ethnicity, education, and years of experience), using hierarchical linear modeling. We used standardized scores for each child outcome variable. This conversion places everything on a z-score metric based on pretest scores. The sample size for TOPEL, school readiness, and W-J III is 195. The sample size for the DECA measures is 97. TOPEL = Test of Preschool Early Language; DECA = Devereux Early Childhood Assessment; MBB = Mississippi Building Blocks; W-J III = Woodcock-Johnson III.
*p < .10. **p < .05. ***p < .01.
Similar results are found for the third assumption of mediational analysis, where the relationship between change in ELLCO and outcomes is tested. Appendix Table A2 shows estimates of the effects of change in ELLCO on outcomes. Associations are found for print knowledge, gross motor, applied problems, protective factors, and attachment.
As a robustness check, instead of using hierarchical linear model as reported in Table 6, we used averages for each classroom and ran the models at the classroom level (see Appendix Table A4). The results are similar to those found in Table 6.
Classroom Environment as a Mechanism
We next turn our attention to whether we can identify the mechanisms that yield positive associations with MBB coaching participation. We test whether positive observations of early language and literacy in the classroom, ELLCO, are mediating mechanism for treatment effects. As suggested by Baron and Kenny (1986), we first determine whether the treatment variable (MBB coaching), the mechanism variable (ELLCO), and the child outcome variable are correlated. Figure 2 shows the case for the TOPEL subset of print knowledge. In this case, improvement in observed ELLCO total score is correlated with an improvement in observed TOPEL print knowledge (ρ = .30, p value < .01); MBB coaching participation is correlated with a change in ELLCO total score (ρ = .69, p value < .01) and a change in TOPEL print knowledge (ρ = .36, p value < .01).
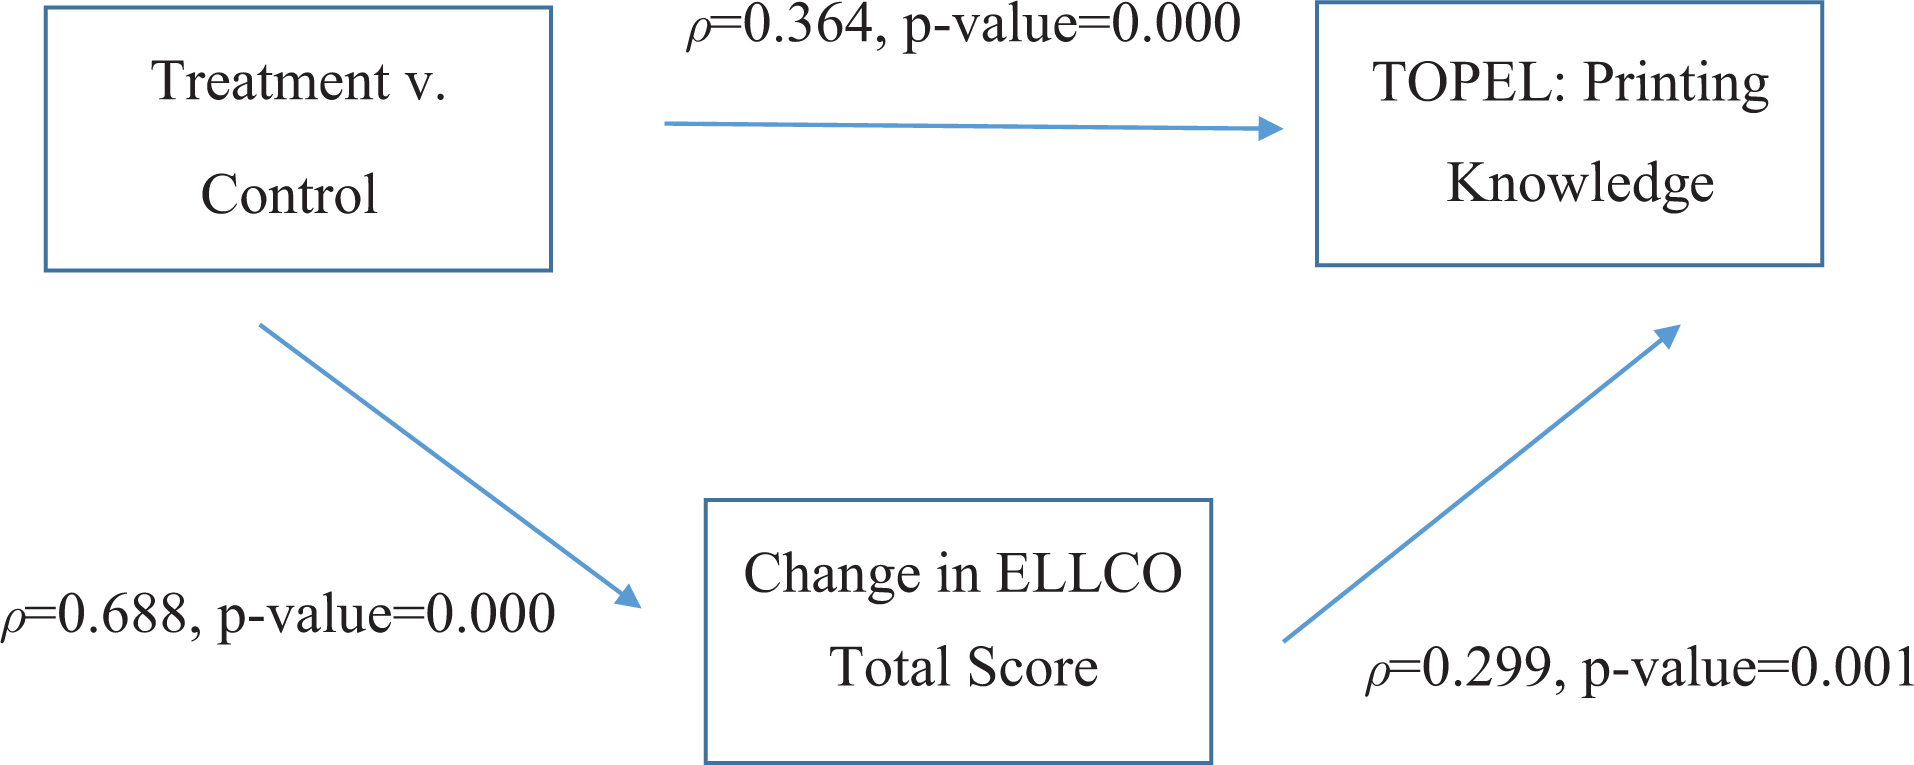
Mediation model.
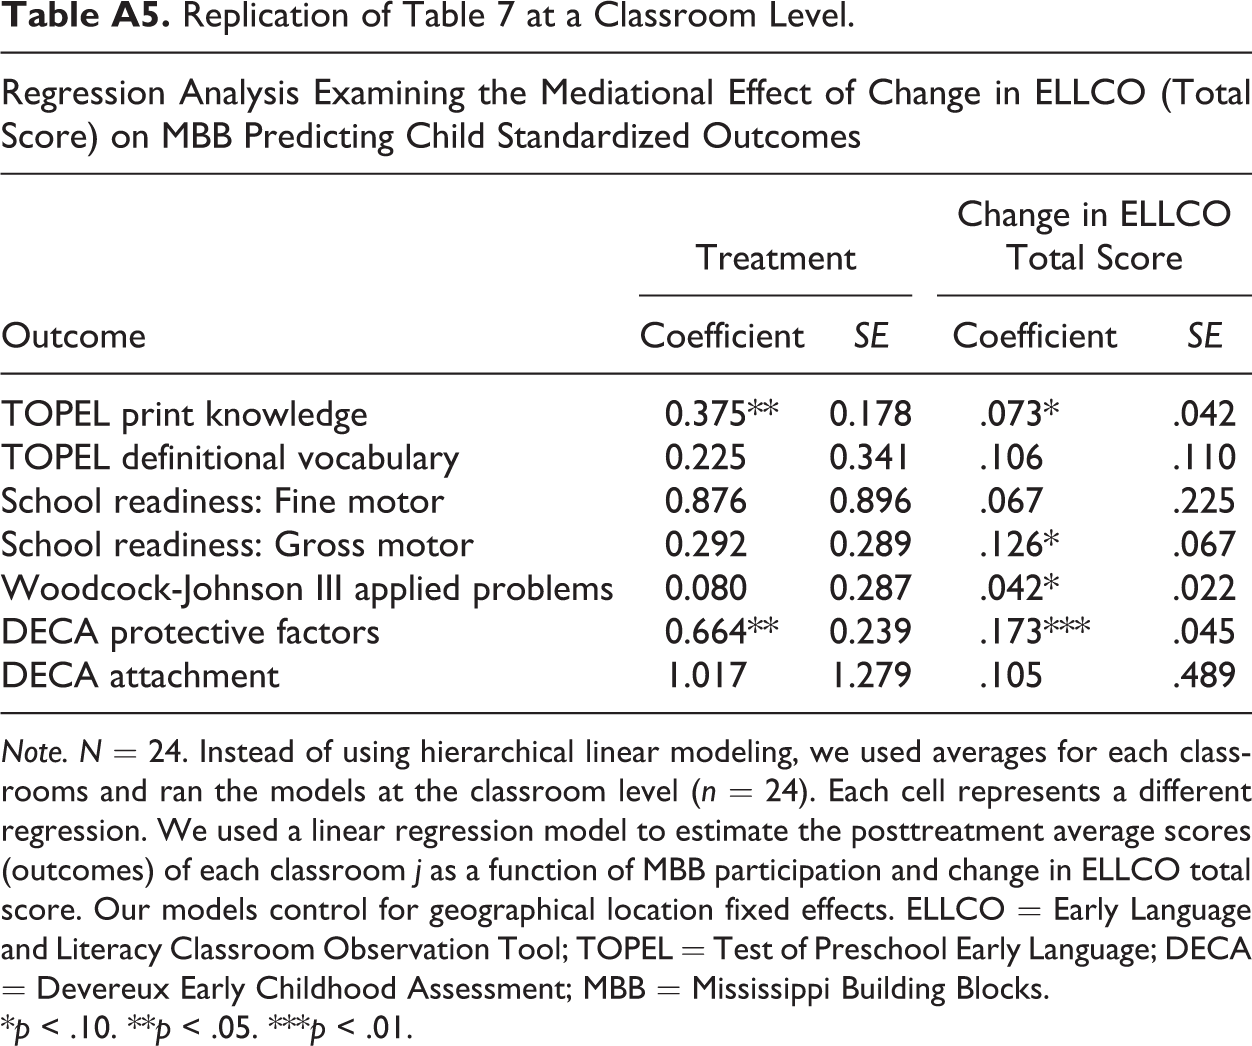
Following Kraemer, Wilson, Fairburn, and Agras (2002), positive changes in ELLCO conform to the current definition of a mediator with randomized trials. Therefore, we find evidence that improvements in classroom environment, as measured by ELLCO assessments, were a likely mechanism through which children’s outcomes improved. To understand this relationship further, we include the change in the ELLCO score in our regression of child outcomes (Equation 3), which tests the fourth assumption of mediational analysis. Conceptually, when a mediator or mechanism is introduced in the regression (in our case, the improvement in ELLCO score), the observed relationship between the treatment (MBB coaching) and child outcomes should be attenuated, or reduced to zero, if the mediator is the sole channel through which the treatment affects outcomes. We reestimate the same regression models shown in Table 6 with the mediator, ELLCO gains, and present results in Table 7 for the overall ELLCO score. In Table 7, the “Treatment” columns report the coefficient from the indicator for MBB coaching participation, and the “Change in ELLCO” columns report the coefficient on ELLCO total score change from pre- to postassessment. Remember that Table 6 shows that MBB has effects on print knowledge, gross motor, applied problems, protective factors, and attachment. As Table 7 indicates, the estimated MBB coaching treatment effect on child outcomes becomes nonsignificant for gross motor and applied problems and marginally significant for print knowledge when change in ELLCO total score is added to the model. In this case, the inclusion of change in ELLCO total score decreases the strength of the observed relationship between MBB coaching and the outcome. We interpret these results as suggestive that the MBB coaching intervention contributes to child’s print knowledge, gross motor, and applied problems by improving the quality of the classroom and by creating an inviting environment for learning. Appendix Table A3 presents more details about the ACME and the percentage of the total effect that was mediated. Appendix Table A5 replicates Table 7 using an alternative methodology, as a robustness check.
Regression Analysis Examining the Mediational Effect of Change in ELLCO (Overall Score) on MBB Predicting Child Standardized Outcomes.
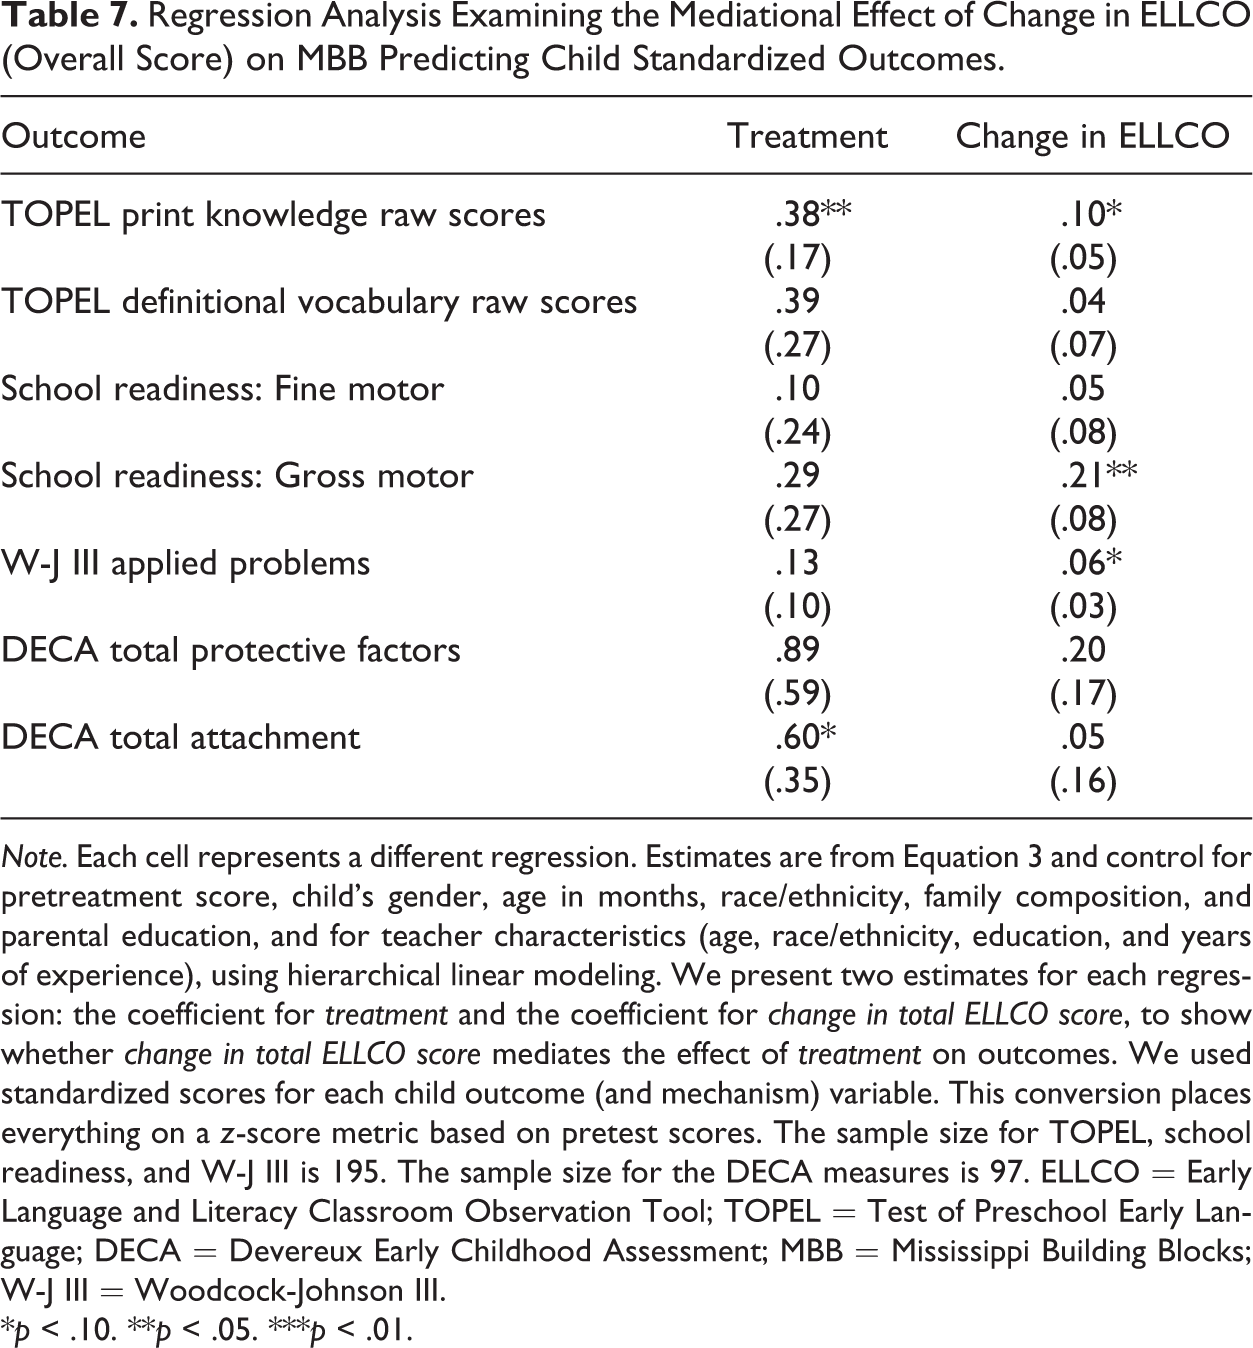
Note. Each cell represents a different regression. Estimates are from Equation 3 and control for pretreatment score, child’s gender, age in months, race/ethnicity, family composition, and parental education, and for teacher characteristics (age, race/ethnicity, education, and years of experience), using hierarchical linear modeling. We present two estimates for each regression: the coefficient for treatment and the coefficient for change in total ELLCO score, to show whether change in total ELLCO score mediates the effect of treatment on outcomes. We used standardized scores for each child outcome (and mechanism) variable. This conversion places everything on a z-score metric based on pretest scores. The sample size for TOPEL, school readiness, and W-J III is 195. The sample size for the DECA measures is 97. ELLCO = Early Language and Literacy Classroom Observation Tool; TOPEL = Test of Preschool Early Language; DECA = Devereux Early Childhood Assessment; MBB = Mississippi Building Blocks; W-J III = Woodcock-Johnson III.
*p < .10. **p < .05. ***p < .01.
Fidelity of Implementation
We first analyze whether MBB classrooms changed their practices associated with coaching over time (Figure 3) to help establish whether treatment-group teachers implemented the intervention as intended. In the case of adherence, supervisors observed whether teachers presented the content consistent with the intent of the curriculum guide. While the average score at pretest was 0.6, indicating that about 60% of the material was presented correctly, the average score at posttest increased to 1, indicating full adherence among treatment-group teachers by the end of the program. Teachers increased the frequency of desired MBB practices, as measured by dose/duration, from 1.0 at pretest (considered “inadequate”) to 2.9 at posttest (considered “good”). Similarly, we observe that the quality of delivery for teachers who received MBB coaching increased from 1.7 (between “inadequate” and “minimal”) to 5.9 (between “good” and “excellent”). These metrics provide evidence that MBB coaching led to more effective practices by teachers.
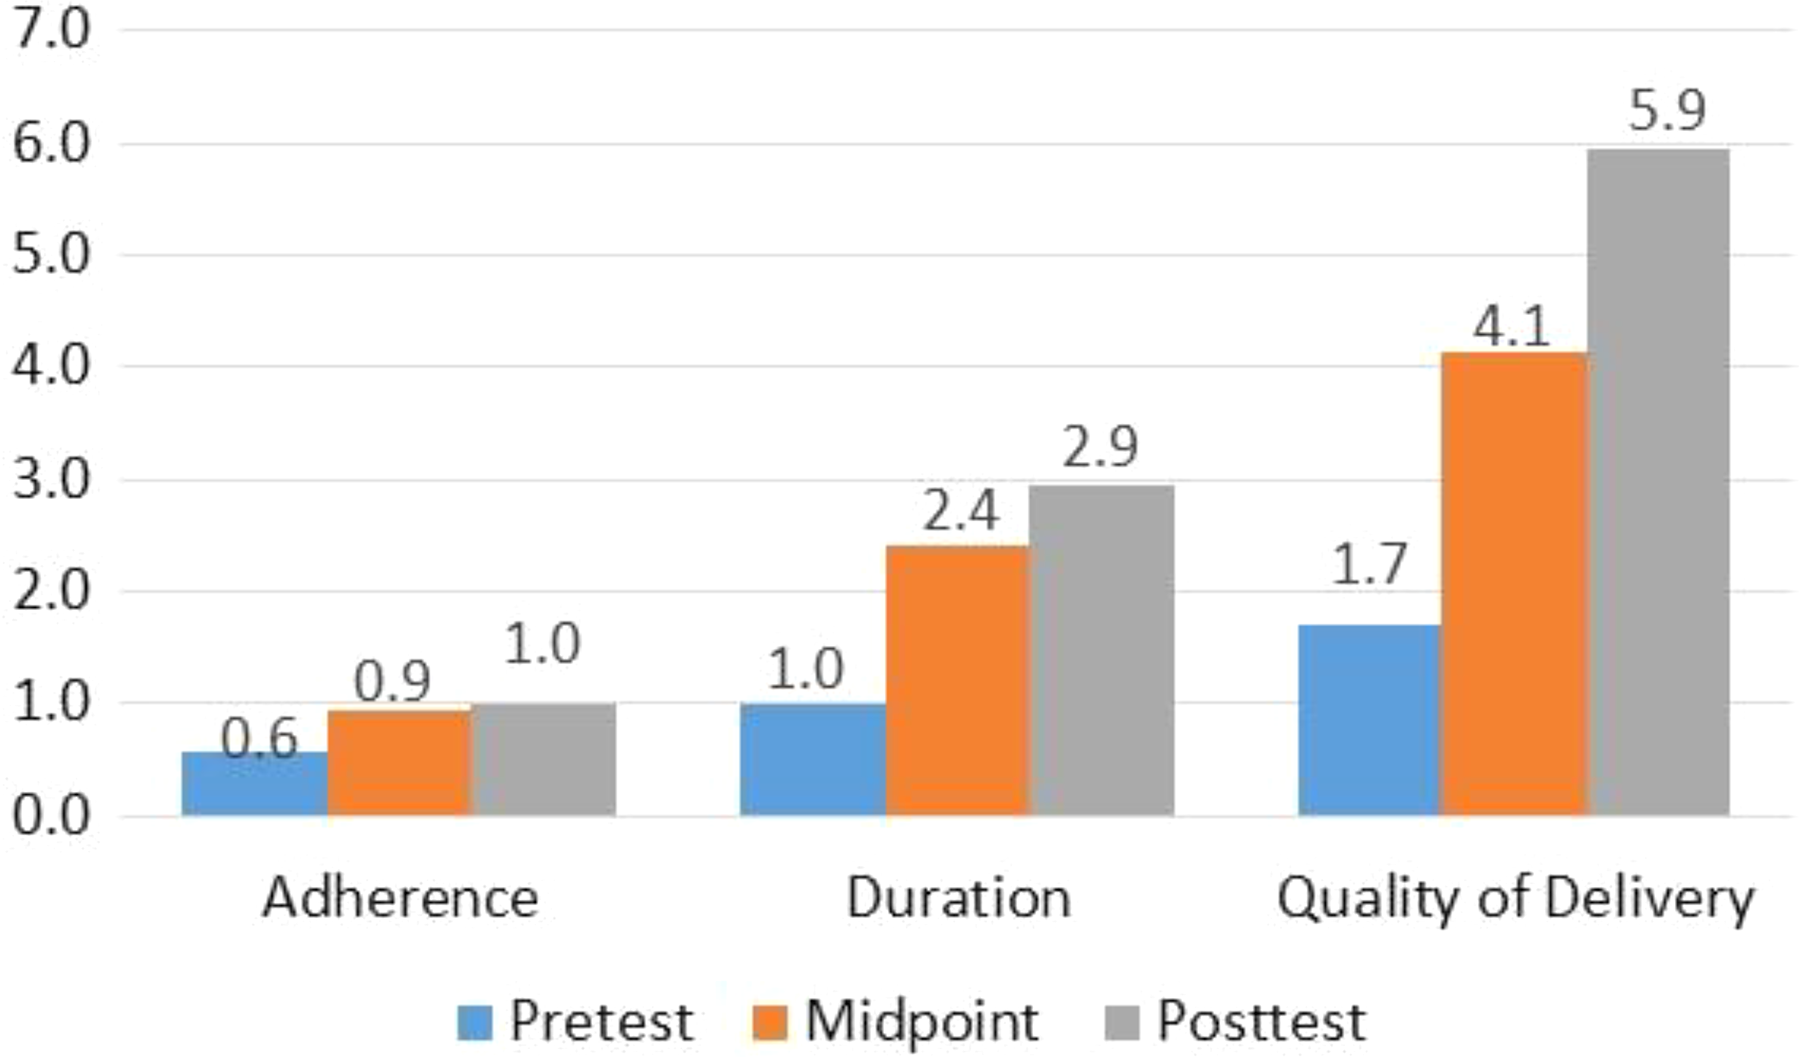
Fidelity mean scores over time among preschool classrooms. Fidelity is scored as follows: adherence (0 = not observed, 1 = observed), duration (1 = inadequate, 2 = minimal, 3 = good), quality of delivery (1 = inadequate, 3 = minimal, 5 = good, 7 = excellent).
Finally, consider Table 8, which presents results from estimates of child outcomes as a function of fidelity of implementation. We ran separate regressions for each fidelity measure (adherence, dose/duration, and quality of delivery), and each cell of the table represents a different regression. We observe that fidelity to the intervention as measured by quality of delivery and dose/duration is related to increases in TOPEL definitional vocabulary, SRA gross motor, W-J III applied problems, and DECA total attachment scores. (SRA gross motor, W-J III age equivalent, and W-J III age equivalent assessments are statistically significant at the 95% confidence level.) Additionally, quality of delivery is related to increases in DECA attachment. Taken together, these results suggest that higher fidelity to the MBB coaching intervention leads to better child outcomes.
Estimates of the Effect of Three Fidelity Measures of MBB Implementation on Child Standardized Outcomes.
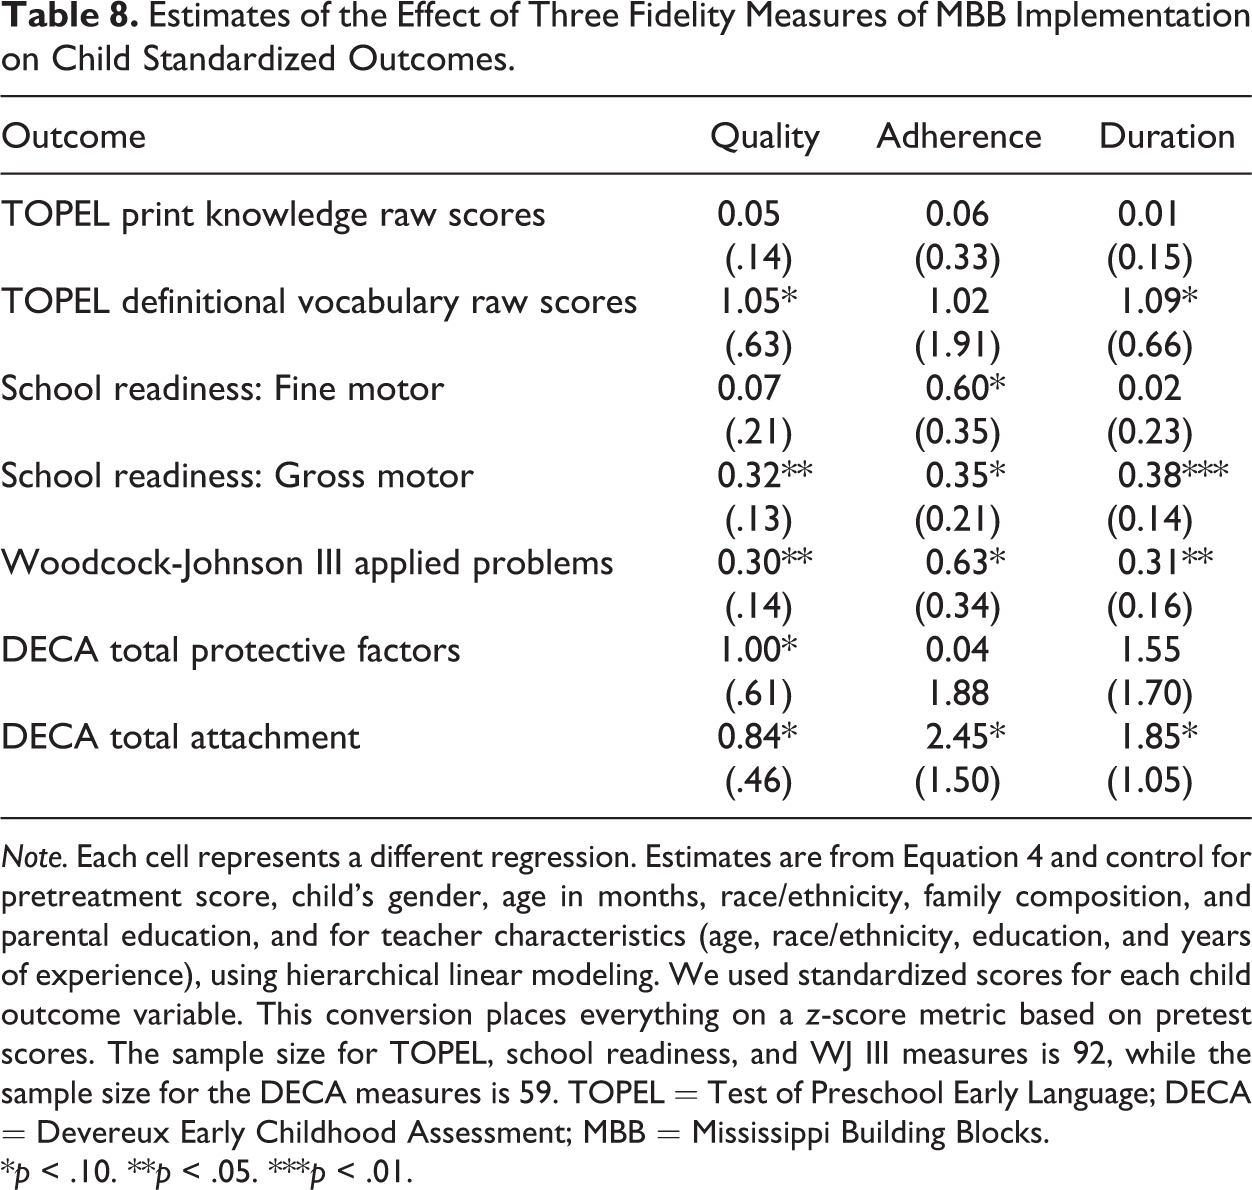
Note. Each cell represents a different regression. Estimates are from Equation 4 and control for pretreatment score, child’s gender, age in months, race/ethnicity, family composition, and parental education, and for teacher characteristics (age, race/ethnicity, education, and years of experience), using hierarchical linear modeling. We used standardized scores for each child outcome variable. This conversion places everything on a z-score metric based on pretest scores. The sample size for TOPEL, school readiness, and WJ III measures is 92, while the sample size for the DECA measures is 59. TOPEL = Test of Preschool Early Language; DECA = Devereux Early Childhood Assessment; MBB = Mississippi Building Blocks.
*p < .10. **p < .05. ***p < .01.
Discussion
EC education plays a critical role in children’s cognitive development and has the potential to address academic achievement gaps among children from disparate socioeconomic backgrounds. In this study, we examine the effect of an intervention focused on coaching teachers and the related cognitive and behavioral outcomes among preschool children. To analyze the effect of the program, we conducted a field experiment across 12 regions in the state of Mississippi. We randomly assigned 12 preschool classrooms to participate in the MBB program and compared outcomes from children in these classrooms to a control group of 12 classrooms.
This randomized controlled trial supports the effectiveness of MBB intensive coaching support for classroom teachers at a high level of fidelity of implementation. We find that the MBB coaching program led to substantial improvements in child outcomes relative to the control group, particularly in language and literacy skills and socioemotional development. We also find some evidence that MBB coaching improved gross motor and math skills, thought these estimates are on the margin of statistical significance. Finally, a mediator analysis suggests that improvements in the classroom learning environment brought about by the MBB coaching program were a channel through which the program affected print knowledge, gross motor, and applied problems.
Our findings are consistent with other recent high-intensive coaching interventions like the LC program and SIPIC. For example, Biancarosa, Bryk, and Dexter (2010) studied the effects of the LC program and found improvement in child literacy learning with effect sizes of 0.22, 0.37, and 0.43 for Years 1, 2, and 3, respectively (all measured in standard deviation increases on assessments). Similarly, results from SIPIC (Sailors & Price, 2015) show that the full-intervention group exhibited a large practical growth effect (0.45 standard deviations), while the control group presented a small growth effect (0.27 standard deviations). Moreover, the below-grade-level children in the treatment group presented the largest effect size (0.73 standard deviations). Thus, the literature suggests that in-person coaching, in which coaches train teachers with an intensive dose (more than 60 hr per academic year) based on the main curriculum teachers use for class, leads to sizable effects on children’s learning.
We also studied the fidelity of MBB coaching program implementation as a way to examine the degree to which thorough execution of the MBB coaching program contributed to positive outcomes. MBB supervisors used coach-observation forms to ensure coaches and teachers consistently implemented the key points of the MBB approach and curriculum. In addition, coaches used the instructional checklists and data from a fidelity tool to inform and guide their coaching in relation to specific instructional skills and strategies. Our results suggest that higher fidelity to the MBB coaching program leads to better child outcomes.
Several strengths of the study merit mentioning. First, this study used multiple informants. Data were collected from directors, teachers, coaches, parents, and children. This allowed us to understand the effects of MBB participation while controlling for child, family, and teacher characteristics. At the same time, it allowed us to understand the teacher–coach relationship by getting information from each stakeholder. Second, this study relied on a randomized controlled trial to draw inferences about the effects of MBB’s coaching program on children’s outcomes. The advantage of an experimental design is that it is internally valid, which means that the association found between MBB participation and children’s outcomes reflects a causal relationship.
There are also numerous limitations to the study. A primary consideration when drawing conclusions from our study is that the sample size totaled approximately 200 children (approximately evenly distributed between treatment and control groups). This relatively small sample size was driven in large part by the monetary costs of conducting a thorough and comprehensive experiment with observations and assessments at many levels (i.e., directors, teachers, coaches, parents, and children). Additionally, the context of the study was the state of Mississippi. While we stratified the experiment to span 12 geographic areas within the state, Mississippi has a number of unique characteristics. First, the percentage of children attending preschool is below the national average. For example, while 28% of 4-year-olds nationwide attend a state-funded program, only 6% attend a state-funded program in Mississippi. Second, while the Mississippi State Department of Education is making efforts to provide quality EC education, Mississippi does not have a long tradition of delivering preschool education at the state level. Mississippi funds a state preschool program, but only as of 2014 and at a limited level (US$3 million in 2015). Third, Mississippi is a southern state and, as such, has unique regional characteristics and challenges that differentiate it from states located in other parts of the United States. Finally, while our intervention was randomly assigned to classrooms, the mediator, classroom environment, was not and, as such, it is more difficult to satisfy some assumptions of the mediational analysis than others (see Empirical Analysis section). While we control for all available observed factors in our data, it is possible that unobserved relevant factors that affect the M–Y relationship (Assumption 2) and X–M relationship (Assumption 3) are not controlled for. Thus, cautious should be warranted when interpreting these results.
With those caveats in mind, we interpret our overall findings to indicate significant gains with regard to classroom quality, including improved teacher–child interactions and enhanced child cognitive, motor, and social skills. Teacher–child interactions are important components for desired outcomes in EC education interventions (see Figure 1). However, a coach serves as an additional resource for enhanced teaching and learning. MBB’s coaching model provides a consistent system of intentional instruction via data-informed coaching and progress monitoring. This intentionality drives progress toward high-quality classroom environments and positive child outcomes. From this perspective, intensive teacher professional development with a strong emphasis on a systematic coaching model, intentional teacher–child interaction/instruction (e.g., progress monitoring), and clearly defined intentional instructional strategies can enhance the quality of the classroom environment and potentially lead to significant positive child outcomes.
Footnotes
Appendix
Replication of Table 7 at a Classroom Level.
| Regression Analysis Examining the Mediational Effect of Change in ELLCO (Total Score) on MBB Predicting Child Standardized Outcomes | ||||
|---|---|---|---|---|
| Outcome | Treatment | Change in ELLCO Total Score | ||
| Coefficient | SE | Coefficient | SE | |
| TOPEL print knowledge | 0.375** | 0.178 | .073* | .042 |
| TOPEL definitional vocabulary | 0.225 | 0.341 | .106 | .110 |
| School readiness: Fine motor | 0.876 | 0.896 | .067 | .225 |
| School readiness: Gross motor | 0.292 | 0.289 | .126* | .067 |
| Woodcock-Johnson III applied problems | 0.080 | 0.287 | .042* | .022 |
| DECA protective factors | 0.664** | 0.239 | .173*** | .045 |
| DECA attachment | 1.017 | 1.279 | .105 | .489 |
Note. N = 24. Instead of using hierarchical linear modeling, we used averages for each classrooms and ran the models at the classroom level (n = 24). Each cell represents a different regression. We used a linear regression model to estimate the posttreatment average scores (outcomes) of each classroom j as a function of MBB participation and change in ELLCO total score. Our models control for geographical location fixed effects. ELLCO = Early Language and Literacy Classroom Observation Tool; TOPEL = Test of Preschool Early Language; DECA = Devereux Early Childhood Assessment; MBB = Mississippi Building Blocks.
*p < .10. **p < .05. ***p < .01.
Authors’ Note
Rajeev Darolia is now affiliated with Martin School of Public Policy and Administration, University of Kentucky, Lexington, KY, USA.
Declaration of Conflicting Interests
The author(s) declared no potential conflicts of interest with respect to the research, authorship, and/or publication of this article.
Funding
The author(s) disclosed receipt of the following financial support for the research, authorship, and/or publication of this article: This work was supported by University of Mississippi (14-2201-3054-001).