
Abstract
The fractal characteristics of the security market were considered in portfolio strategy optimization. First, the detrended cross-correlation analysis was adopted to measure the fractal correlation of different securities. Second, the fractal correlation was embedded into the mean-variance criterion of the modern portfolio theory. Third, the mean-detrended cross-correlation analysis portfolio strategy of multiple risk assets was constructed, and the analytic solution of the strategy was given. Finally, the evaluation results revealed that the constructed the mean-detrended cross-correlation analysis portfolio strategy clearly improved investment performance, thus achieving the goal of optimizing the multiple risk asset portfolio strategy.
Keywords
JEL Classification:G11, G19, C53
Introduction
Money never sleeps, and ever since the advent of securities investment, people have desired to realize asset appreciation through securities investment. As a key guarantee for obtaining investment income, a securities investment strategy is of vital importance in both practical and theoretical circles. Investigating the optimization of securities investment strategies will not only provide investors with the corresponding reference for decision-making and help investors improve their investment performance, but will also facilitate the involvement of investors in the security market, ensuring that the security market performs its functions, and promotes the prosperity and development of the economy and society (Liang et al., 2020a, Zhang et al., 2019). It is also conducive to improving the theory of financial decision-making and promoting the deepening of relevant financial theoretical research. Therefore, whether from a practical perspective or a theoretical perspective, it is critical to conduct optimization research on securities investment strategies.
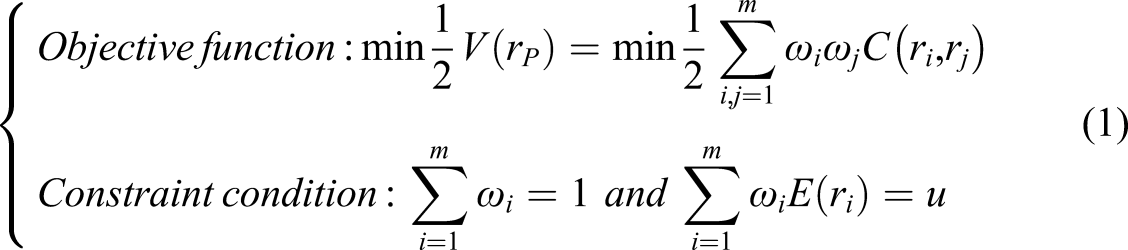
Furthermore, when studying the optimization problem of securities investment strategy, we must focus on the optimization problem of securities investment portfolio strategy. To be more specific, in terms of reality, because risks and returns always go hand in hand in the practical operation of securities investment, the core goal of the securities investment portfolio strategy is to maximize returns and minimize risks (Liang et al., 2020b), which caters specifically to the real needs of investors for obtaining returns while controlling risks, and it is the most widely used securities investment strategy for investors (Markowitz, 1952; Sotiropoulos & Rutterford, 2019). Therefore, optimization of the securities investment portfolio strategy is particularly promising. Theoretically, the portfolio problem marks the beginning of modern finance and is the most widely studied problem in financial literature (Van et al., 2017). Studying the optimization of securities investment portfolio strategy is not only beneficial to the improvement of the modern portfolio theory (MPT) initiated by Markowitz, which is to realize asset appreciation and control risks by considering the intrinsic correlation between securities and using diversified investment, but is also conducive to the advancement and development of related financial theory research. Therefore, the study of investment portfolio strategy optimization is of a particular theoretical value (Fabozzi et al., 2002; Puerto et al., 2020). In the theoretical research and practical operation of optimizing securities investment strategies, it is especially important to study the optimization issue of securities investment portfolio strategies.
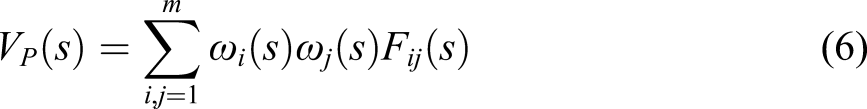
Given the significance of researching the optimization of securities investment portfolio strategy, many scholars optimized it different perspectives and some literature review papers written by scholars can be considered specifically (Huang, 2017; Kalayci et al., 2019). In general, the relevant achievements are primarily focused on the following aspects: first, the securities investment portfolio strategy is optimized from the perspective of improving the return or risk measurement (Guo et al., 2019; Nesaz et al., 2019); second, optimize the securities investment portfolio strategy from the perspective of multi-period dynamic investment (Kamali et al.,2019; Zhang et al., 2012); third, the securities investment portfolio strategy is optimized from the perspective of considering transaction costs and weight constraints (Quek & Atkinson, 2017; Xu et al., 2016); fourth, optimize the securities investment portfolio strategy from the perspective of considering investor behavior deviations (Omid et al., 2019; Pfiffelmann et al., 2016); fifth, MPT has been applied in other fields such as horticultural systems and crop insurance (Paut et al., 2019; Walters & Preston, 2018); sixth, the investment portfolio strategy is optimized under background risks, such as income fluctuation and health (Baptista, 2012; Xu et al., 2015). Undoubtedly, these studies have improved MPT and deepened the study of financial theoretical research, and it has also reflected the necessity of optimizing securities investment portfolio strategies at the same time.
Although there have been many achievements in studying the optimization of securities investment portfolio strategy, there are some defects that cannot be overlooked among the existing achievements, and the most important is that the actual fractal characteristics of the security market have not been considered (Quang, 2014). To be specific, first, the correlation among the assets in the securities investment portfolio determines the risk of the securities investment portfolio strategy. The correlation between assets must be accurately surveyed to ensure that the securities portfolio strategy constructed can achieve risk diversification (Clements et al., 2019; Medo et al., 2009). Second, the real characteristics of financial markets must be factored into financial analysis. To accurately survey the correlation between assets and ensure the effectiveness of the constructed securities portfolio strategy, the actual characteristics of the securities market must be considered (Cont, 2001; Wu et al., 2018). Finally, a large body of empirical evidence indicates that real security markets follow the fractal distribution under the fractal market hypothesis rather than the normal distribution under the efficient market hypothesis (Goddard and Onali, 2009; Ikeda, 2017). Currently, there is neither a simple deterministic correlation relationship nor a simple stochastic correlation relationship among assets, albeit a complex hybrid correlation relationship that contains randomness in certainty and certainty in randomness. The correlation between time series has statistical self-similarity under different observation intervals, showing a power-law relationship and long memory in time. However, when developing securities investment portfolio strategies, the existing relevant results are based on either a simple deterministic correlation relationship or a simple stochastic correlation relationship, which are far from the actual situation, making it difficult to obtain accurate results and ultimately affecting the effectiveness of the securities portfolio strategy (Liem et al., 2016). Consequently, the existing related results have significant defects because they do not consider the fractal correlation among assets (Karp & Van, 2019; Lin et al., 2011).
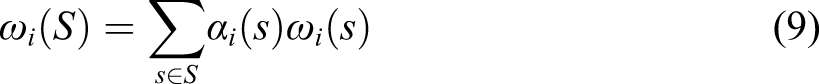
Furthermore, by introducing the portfolio strategy of detrended cross-correlation analysis (DCCA, noting that it is not DCC which is the abbreviation of Dynamic Conditional Correlation), some scholars have empirically tested the fractal characteristics of the securities market and built a portfolio model based on it, which has also empirically verified its effectiveness (Tang & Zhu, 2018; Zhou, 2008). Undoubtedly, this initiative has a pioneering and guiding effect to a certain extent, providing a new perspective for both practitioners and researchers; however, there are still some limitations. First, in building the portfolio model, the weight allocation of different assets was restricted, namely, short-selling was restricted. Thus, the rationality of the asset allocation ratio cannot be guaranteed, and the results obtained are not universal; second, only a single time scale was considered, and the investors’ preferences for different time scales were not taken into account, which not only cannot guarantee the accurate measurement of fractal correlation but also cannot meet the realistic demands of investors’ diversity in the fractal market; third, only two types of assets were considered as samples of risk assets, which cannot meet the actual needs of investors to conduct investment activities with multiple assets. To compensate for the weaknesses of existing studies and promote the validity of securities portfolio strategies (Huy et al., 2016), it is not only important to bring the fractal correlation characteristics of securities into the research framework of portfolio investment strategy optimization, but also to combine the actual preferences of investors and consider multiple risk assets to meet the realistic needs of investor diversity in the fractal market. This is the difference between this study and the relevant literature on theoretical model building, model solving, empirical analysis, and application value, which adds further depth to it and supplements it (Chun et al., 2020; Tang & Zhu, 2018; Zhou, 2008).
To incorporate the fractal correlation between securities to optimize the securities investment portfolio strategy, the natural solution is to construct an index that can survey the fractal correlation and embed them into the mean-variance criterion of MPT to build the securities investment portfolio strategy instead of the survey that cannot review the fractal correlation. In the selection of methods, combined with the above mentioned (Chun et al., 2020; Zhou, 2008), DCCA can characterize the correlation among time series at multiple time scales, which is a useful tool for describing fractal correlation and has been widely used in many fields (Iqbal et al., 2020; Podobnik & Stanley, 2008). Compared with the VaR, CVaR, and risk surveys built on this basis, DCCA can better deal with the nonlinear problem of security price when the real security market is a fractal market, and the risk measurement index constructed according to it can better adapt to the nonlinear and non-normal complex financial environment, and the result will be more convincing and universal. Therefore, in a real situation where fractal correlation characteristics exist among securities, the fractal correlation index can be constructed to survey the price fluctuations among securities according to DCCA, combine the degree of investor preference for different time scales, and optimize the securities investment portfolio strategy on this basis to cover the shortage of existing research (Supanantaroek et al., 2017).
To sum up, under the constraint that the real securities market is a fractal market, this article will construct the index to survey the fractal correlation between securities prices according to DCCA, and embed the constructed index into the reward-risk criteria of MPT to construct a Mean-DCCA securities investment portfolio strategy (hereinafter referred to as the M-D portfolio). The motivation of this paper is to further improve the effectiveness of portfolio strategy and provide decision-making references for portfolio investors to better control risks and obtain returns. The contribution of this study lies in incorporating the fractal correlation characteristics that actually exist between securities into the research framework of portfolio strategy optimization and comprehensively considering multiple time scales and investors’ preferences for different time scales, which not only compensates for the weaknesses of the existing study and promotes the validity of the securities investment portfolio strategy, but also improves the cross-integration of MPT and fractal statistical analysis and is conducive to promoting the development of econophysics. The structure of the article is as follows: Introduction is the introduction, Mean-DCCA portfolio Model Construction describes the Mean-DCCA securities investment portfolio strategy construction of multiple risk assets, The Evaluation of Mean-DCCA portfolio Strategy presents the evaluation and validity analysis of the Mean-DCCA securities investment portfolio strategy of multiple risk assets, and Conclusion and Outlook presents the conclusion and outlook.
Mean-DCCA portfolio Model Construction
The role of correlation on the portfolio
The goal of constructing the securities investment portfolio strategy is to realize the maximization of return and minimization of risk, which is equivalent to achieving the minimum risk while the return is established or the maximum return while the risk is established, referred to as realizing the mean-variance criterion (RRC) (Giorgi et al., 2011; Markowitz, 1952). According to the specific return measurement and risk measurement used, RRC can also be given some specific names, such as the mean-variance criterion, mean-VaR criterion, mean-CVaR criterion, and so on (Guo et al., 2019; Wang et al., 2020). In fact, no matter what measurements of return and risk are used, the correlation among assets in a securities investment portfolio has an important impact on the realization of RRC. Considering that people often use expectation and variance as the return measurement and risk measurement of securities (Kalayci et al., 2019; Merton, 1972), the mean-variance securities investment portfolio is taken as an example to illustrate the important role of correlation in realizing RRC.
According to MPT, when constructing the mean-variance securities investment portfolio strategy, it can be assumed that the securities investment portfolio
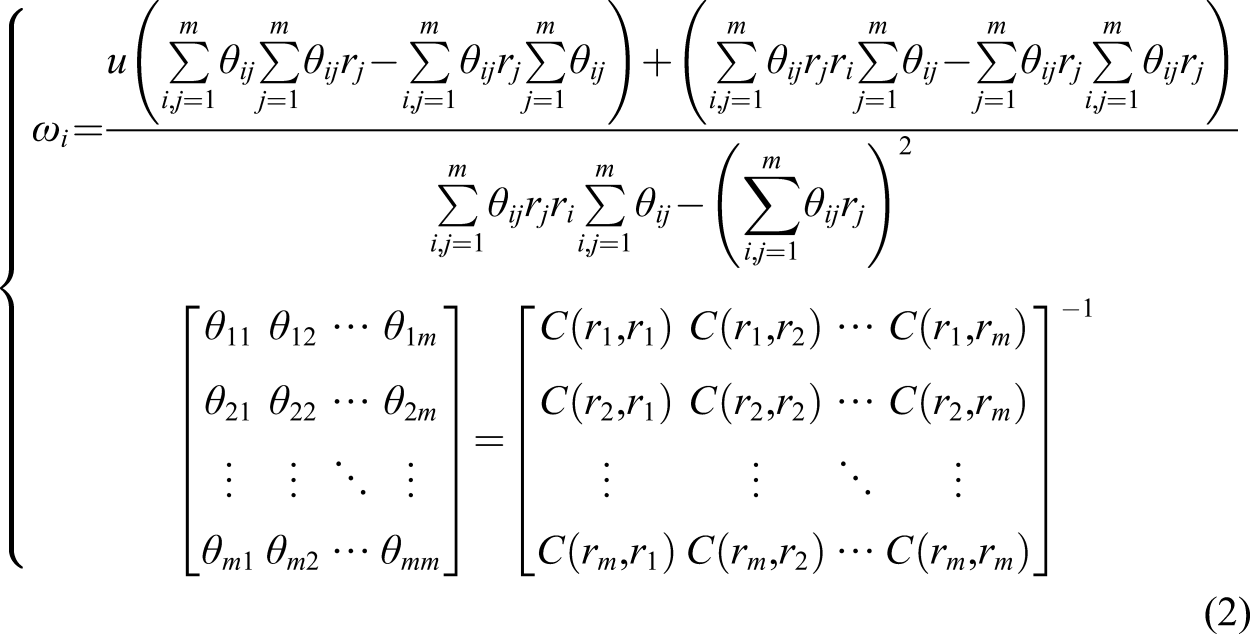
From the foregoing, the real securities market is indeed a fractal market, and fractal correlation characteristics indeed exist among securities price fluctuations resulting in a complex hybrid correlation relationship that contains randomness in certainty and certainty in randomness. At this time, if the time scale changes, the correlation among assets will also change, and the traditional covariance as the correlation measurement among assets cannot guarantee the accuracy of the results obtained. Simultaneously, because the risk of security prices is a special case of the fractal correlation among security prices, and variance is another sense of covariance, namely, the correlation of the fluctuation of security price itself, hence, the traditional variance as the risk measurement of security price also cannot obtain exact results. Thus, as a result of the fractal correlation characteristic among security prices, the mean-variance securities portfolio (hereinafter referred to as the M-V portfolio) has certain defects due to the inability of covariance to precisely survey the fractal correlation among assets and the inability of variance to precisely survey the asset risk, which in turn influences the accuracy of the allocation of optimal weights of assets in the portfolio, and render the constructed portfolio strategy invalid.
DCCA correlation indicators construction
Given that the DCCA can accurately describe the correlation between security prices under multiple time scales, it is a powerful tool for depicting fractal correlation (Ferreira et al., 2019; Iqbal et al., 2020). Therefore, to precisely survey the fractal correlation characteristics among assets in the securities investment portfolio under the fractal market and construct an effective securities investment portfolio strategy to overcome the inability of traditional correlation surveys in the M-V portfolio strategy to accurately depict the disadvantages of the fractal correlation among assets, DCCA was considered in the research on the mean-variance securities investment portfolio strategy as follows. According to DCCA, the index of fractal correlation of price fluctuations between securities was constructed to substitute the traditional covariance or traditional variance. Subsequently, the securities investment portfolio was optimized on this basis to compensate for the weaknesses of the existing research. Specifically, for the return sequences
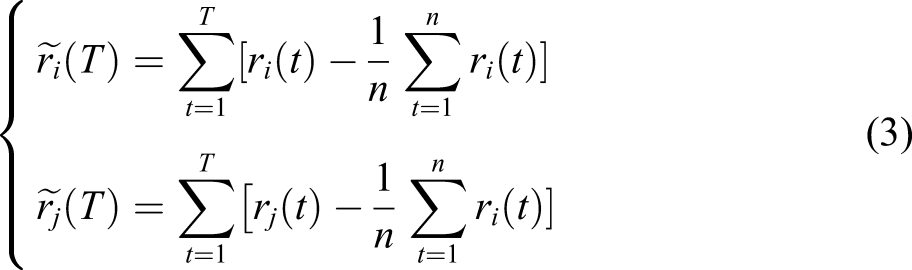
First, we calculate the cumulative deviation sequences
Finally, calculating the covariance
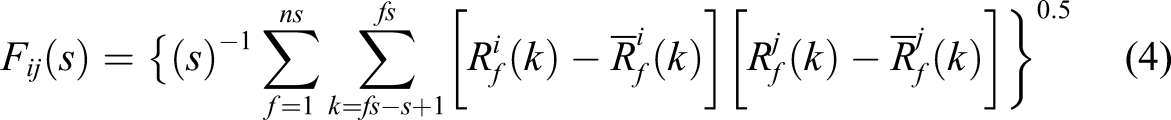
Thus, using DCCA to survey the correlation among assets can be achieved by adjusting the time scale
The above analysis indicates that using
Building the Mean-DCCA portfolio of multi-risk assets
Subsequently,
To correspond to the mean-variance securities portfolio strategy of multi-risk assets constructed by equation (1), it is still assumed that portfolio

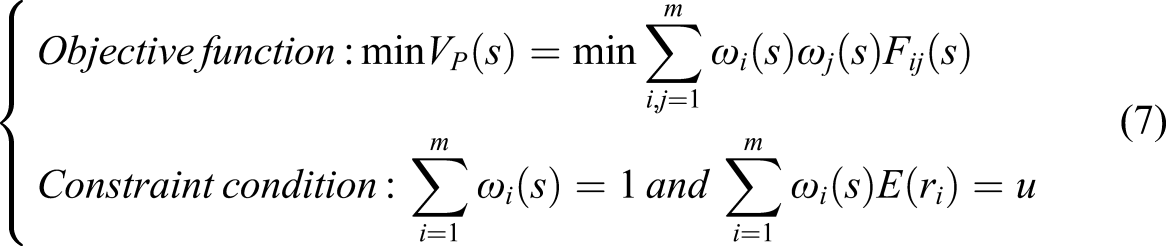
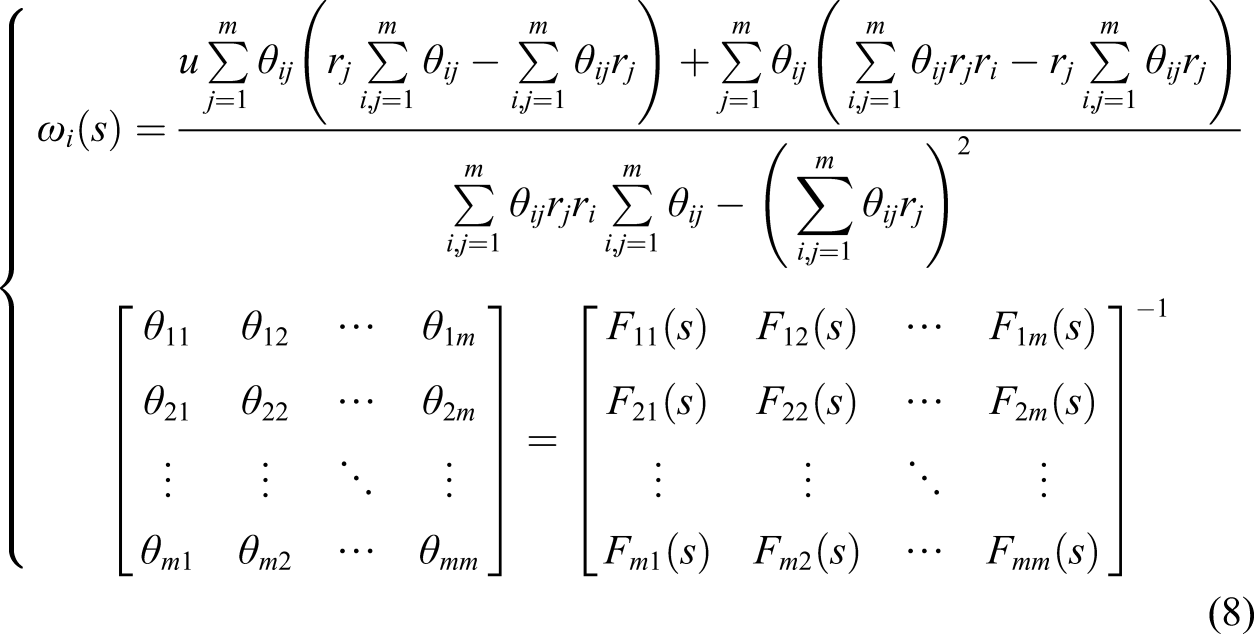
The above analysis indicates that the constructed M-D portfolio strategy of multi-risk assets uses the
The Evaluation of Mean-DCCA Portfolio Strategy
Fractal feature analysis of the sample
From the above theoretical analysis, it can be observed that in the case of the reality that the security market is a fractal market, the M-D portfolio strategy of multi-risk assets constructed based on DCCA can compensate for the weaknesses of the M-V portfolio strategy, which is beneficial for promoting the validity and investment performance of the portfolio. To avoid the theory being divorced from reality, the following analysis takes the M-V portfolio strategy as the benchmark portfolio strategy and compares and analyzes the performance of the two portfolio strategies to further test the validity of the M-D portfolio strategy of multi-risk assets. In the empirical analysis, this study takes the daily closing prices of all six industry indexes of the Shanghai Stock Exchange as a sample of risky assets, which include the industrial index (Ind.), business index (Bus.), real estate index (Rea.), utility index (Uti.), composite index (Com.), and the financial index (Fin.) The sample interval is from January 1, 2004, to January 1, 2020. As there are still non-systemic risks in the industry indexes, which can reflect the diversification of the investment portfolio strategy, it is reasonable to consider the daily closing price of the industry index as a sample. In the following text, for convenience, we might as well directly treat the six industry indexes as an asset. At the same time, the sample interval contains complete market conditions (bull market, bear market, and shock market), which can fully reflect the validity of the portfolio strategy under different market conditions, hence, the selection of the sample interval is representative.
To verify that the security market is not subject to a normal distribution under the efficient market hypothesis, albeit, it may have fractal characteristics; Figure 1 below indicates the daily rate series of the six industry indexes in the sample interval. Graphically, the return rate series has the phenomenon of fluctuation agglomeration, suggesting a fractal fluctuation characteristic and the return series may not obey the normal distribution. The fluctuation of the daily rate series.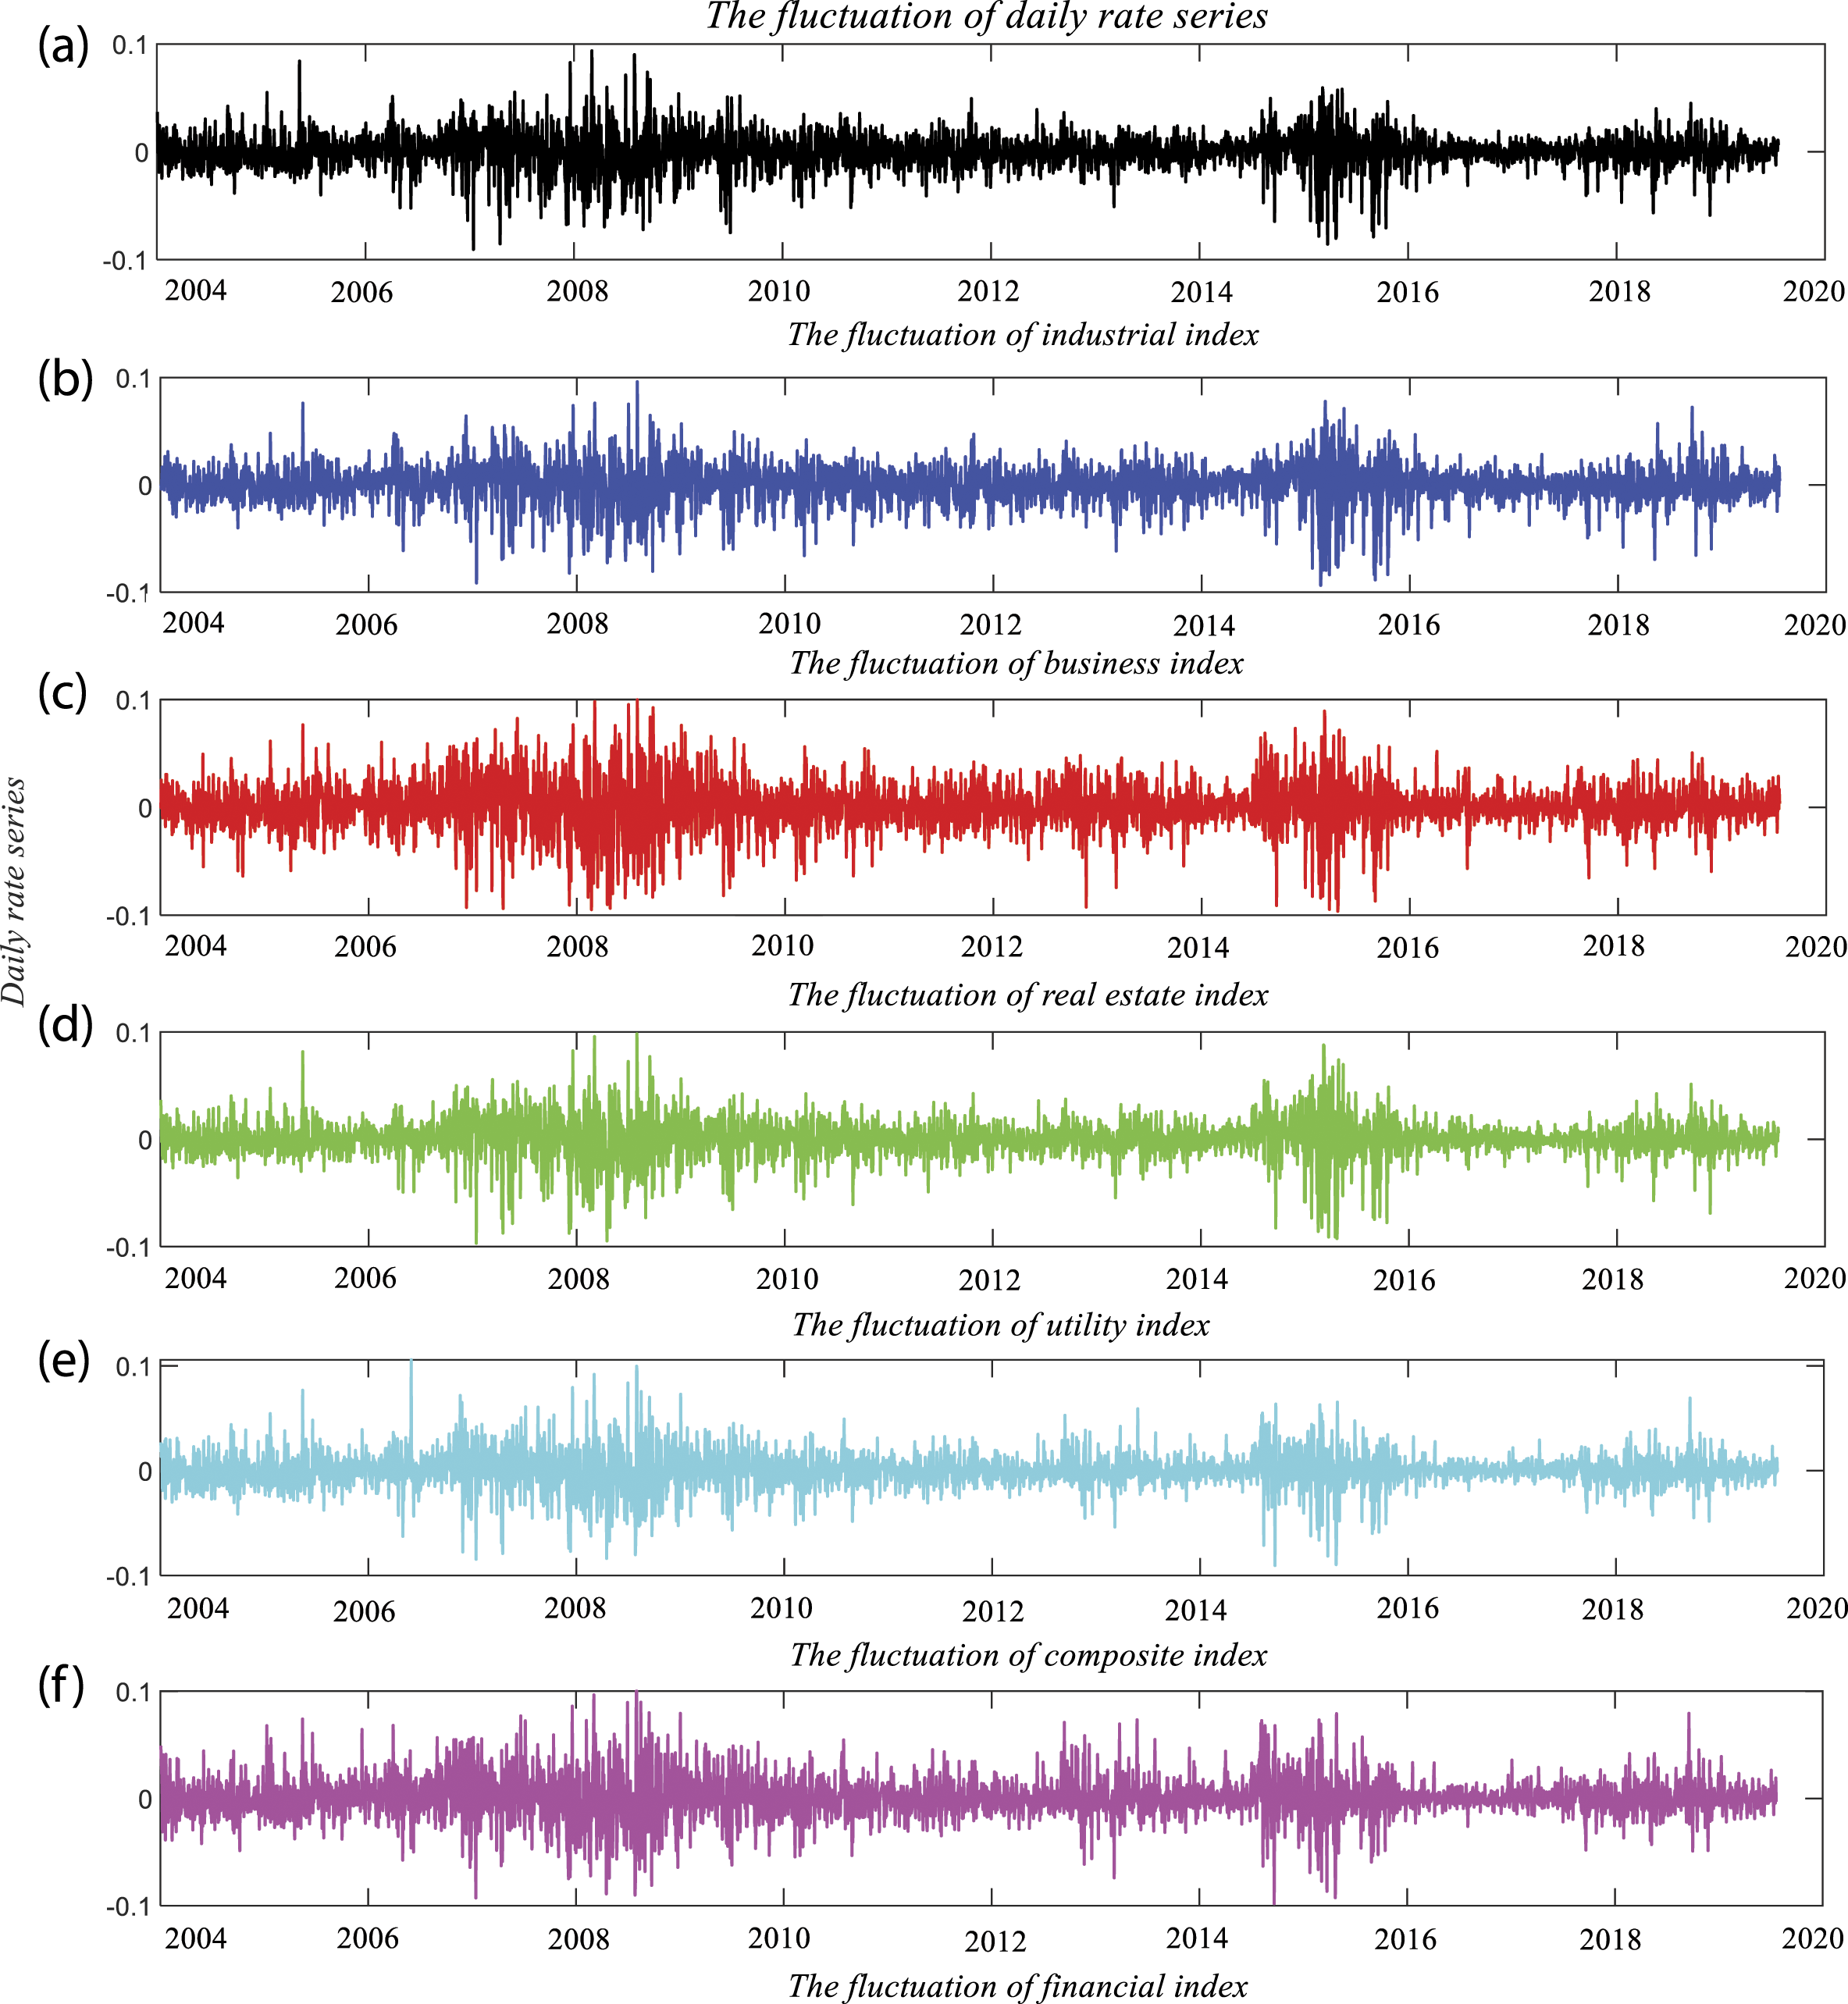
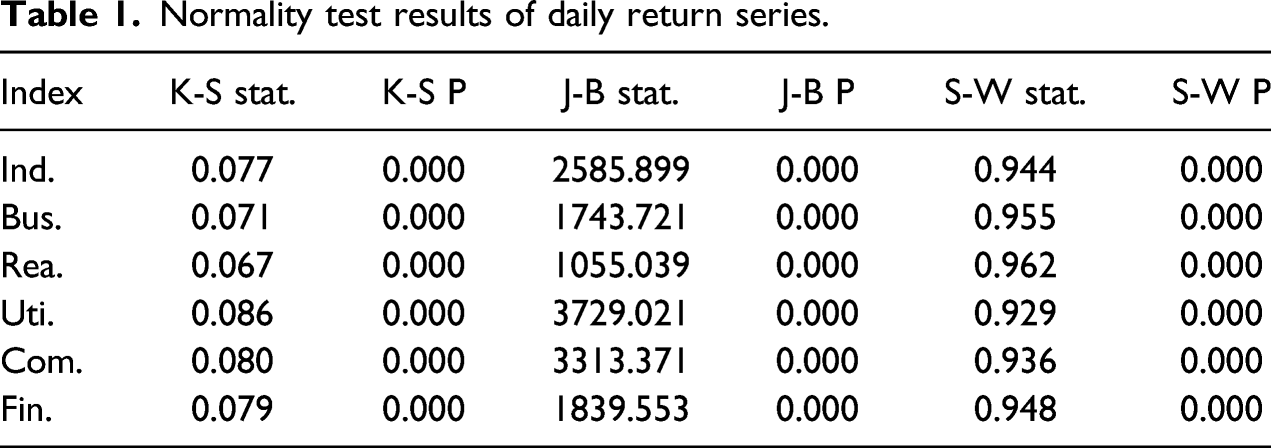
Normality test results of daily return series.
DCCA test results of daily return series.
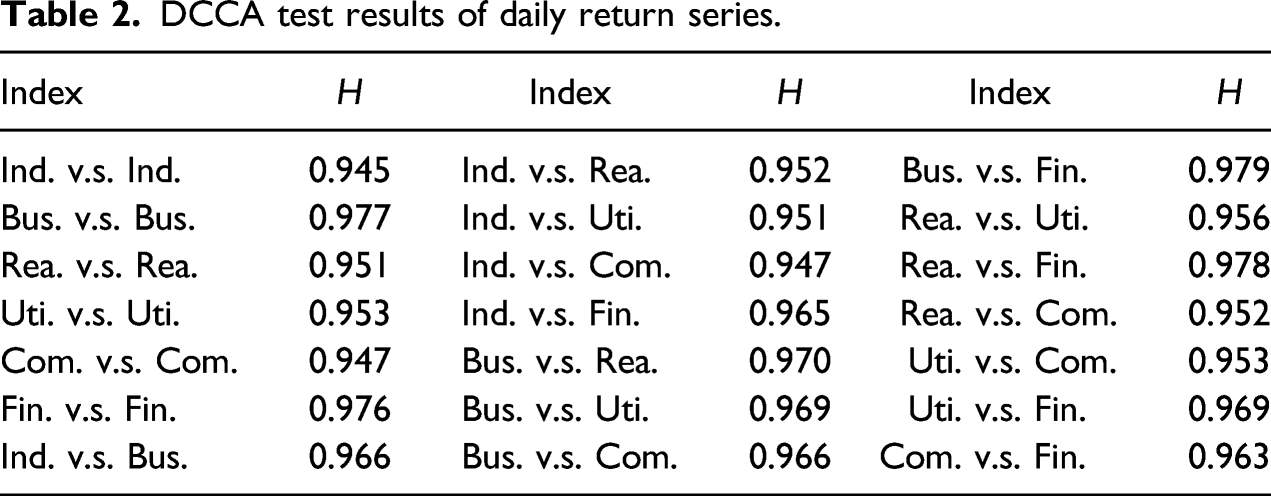
As showed in Table 1, the adjoint probability of all industry index return series in K-S test, J-B test and S-W test is 0.000, less than 0.01 and 0.05, that means no evidence to support the sample sequence obeys the normal distribution at the significance level of 1% and 5%. The non-normality of the return series of six industry indexes is verified. All scaling indices
Effectiveness analysis of Mean-DCCA portfolio
Meanwhile, considering that the pros and cons of the portfolio strategy are chiefly determined by the testing effect of strategies out of a sample. And to reflect the effect of strategy optimization, the performance of the optimized strategy needs to be better than that of the pre optimized strategy in most cases to overcome the survival bias (Li et al., 2020; Wu et al., 2021). Hence according to natural years, this study divides the entire sample interval into 16 subintervals and uses the data of each year in the sample range as the “estimated sample interval” to build M-D and M-V portfolios, then it uses the data of the “estimated sample interval” for the following year as the “predicted sample interval” to look into the performance of the two portfolios constructed, namely, there are 15 estimated sample intervals and 15 predicted sample intervals. Furthermore, the M-D and M-V portfolio strategies of the six industry indexes can be constructed according to equations (2) and (8), respectively. This study combines the given returns
From the previous analysis, it can be observed that when constructing the M-D portfolio strategy according to equation (8), it is necessary to set the investor preference degree
Thus, under the M-D and M-V portfolio strategies, for each given return and estimated sample interval, the optimal investment weights of six industry indexes under the M-V and M-D portfolio strategies can be calculated according to equations (2) and (8), the M-V and M-D portfolio models can be built, and the performance differences of the two portfolio strategies constructed in the sample prediction interval can be calculated. Because there are eight different values for the given return
The excess return rate of the M-D portfolio under Type 1 relative to the M-V portfolio.

The excess return rate of the M-D portfolio under Type 2 relative to the M-V portfolio.
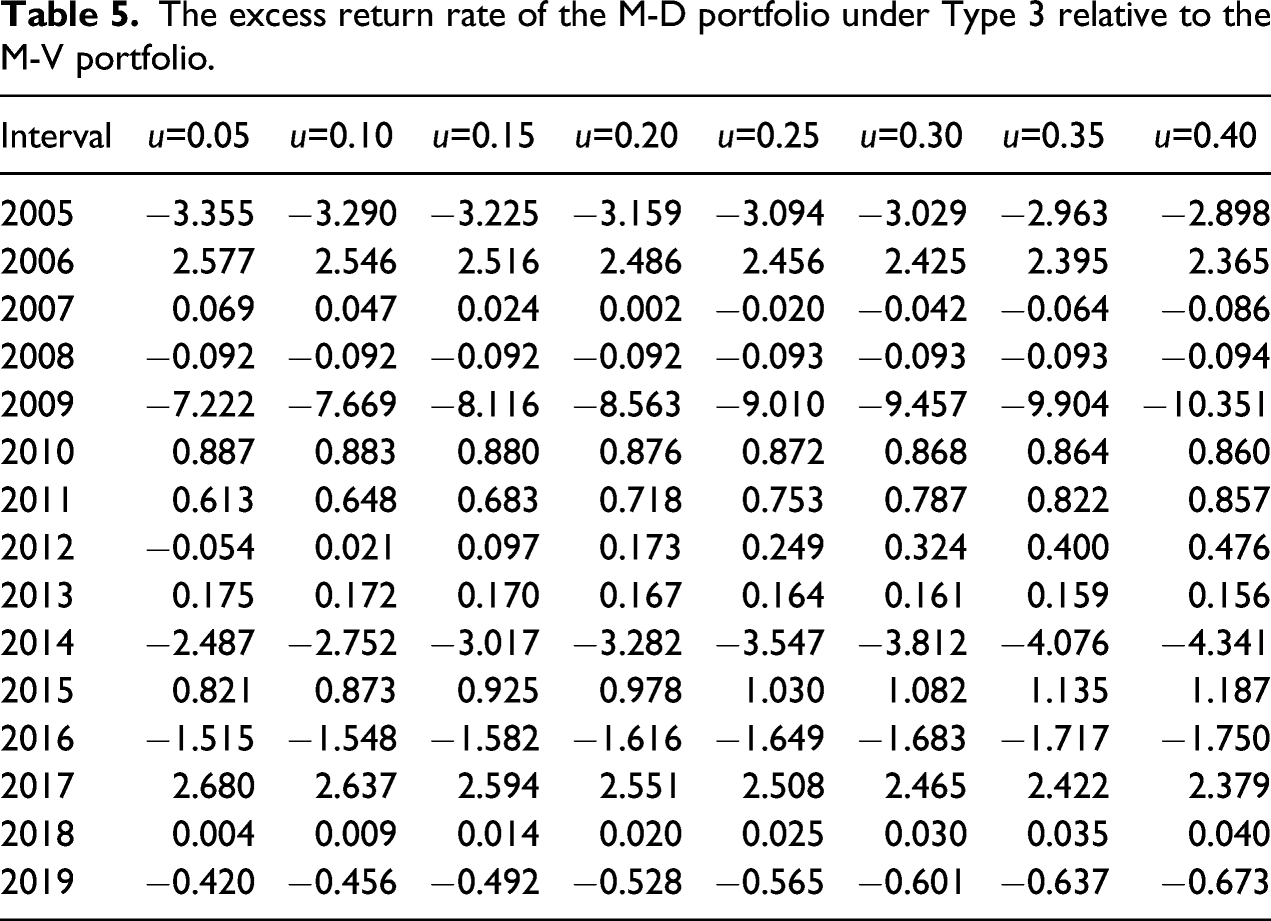
The excess return rate of the M-D portfolio under Type 3 relative to the M-V portfolio.
Mean-DCCA portfolio evaluation based on reward-risk ratio
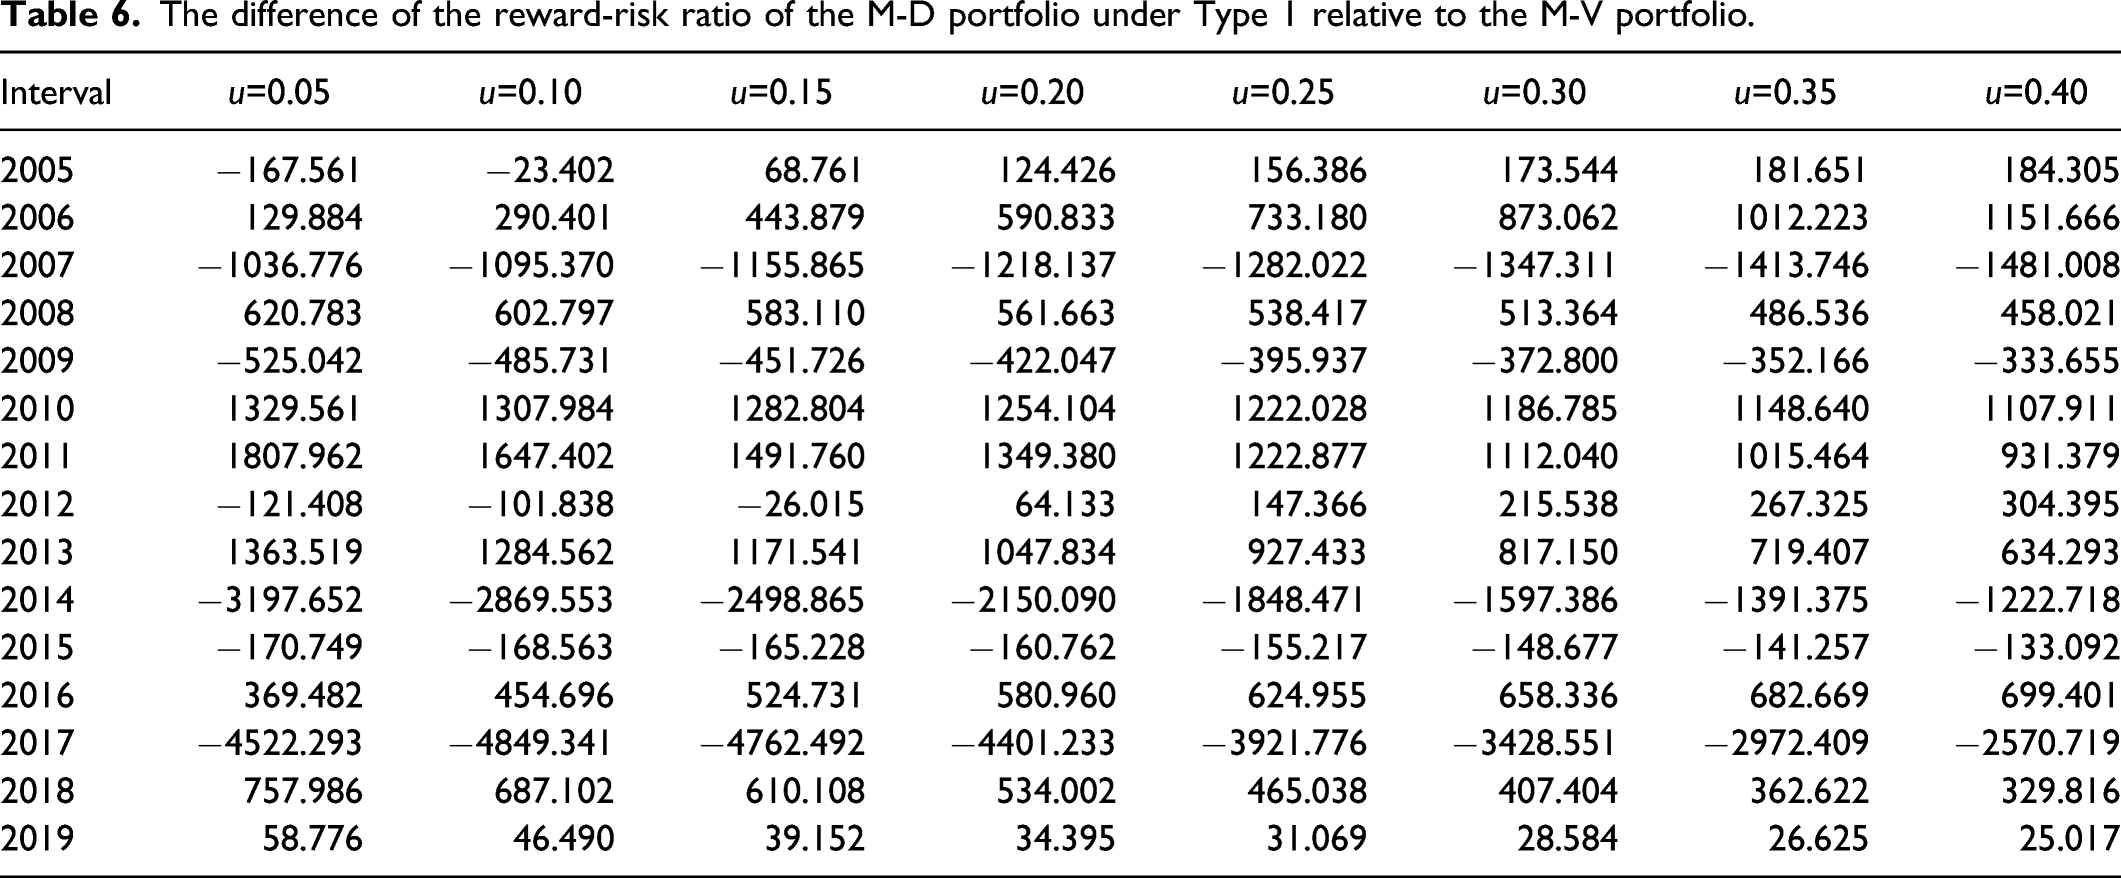
The difference of the reward-risk ratio of the M-D portfolio under Type 1 relative to the M-V portfolio.
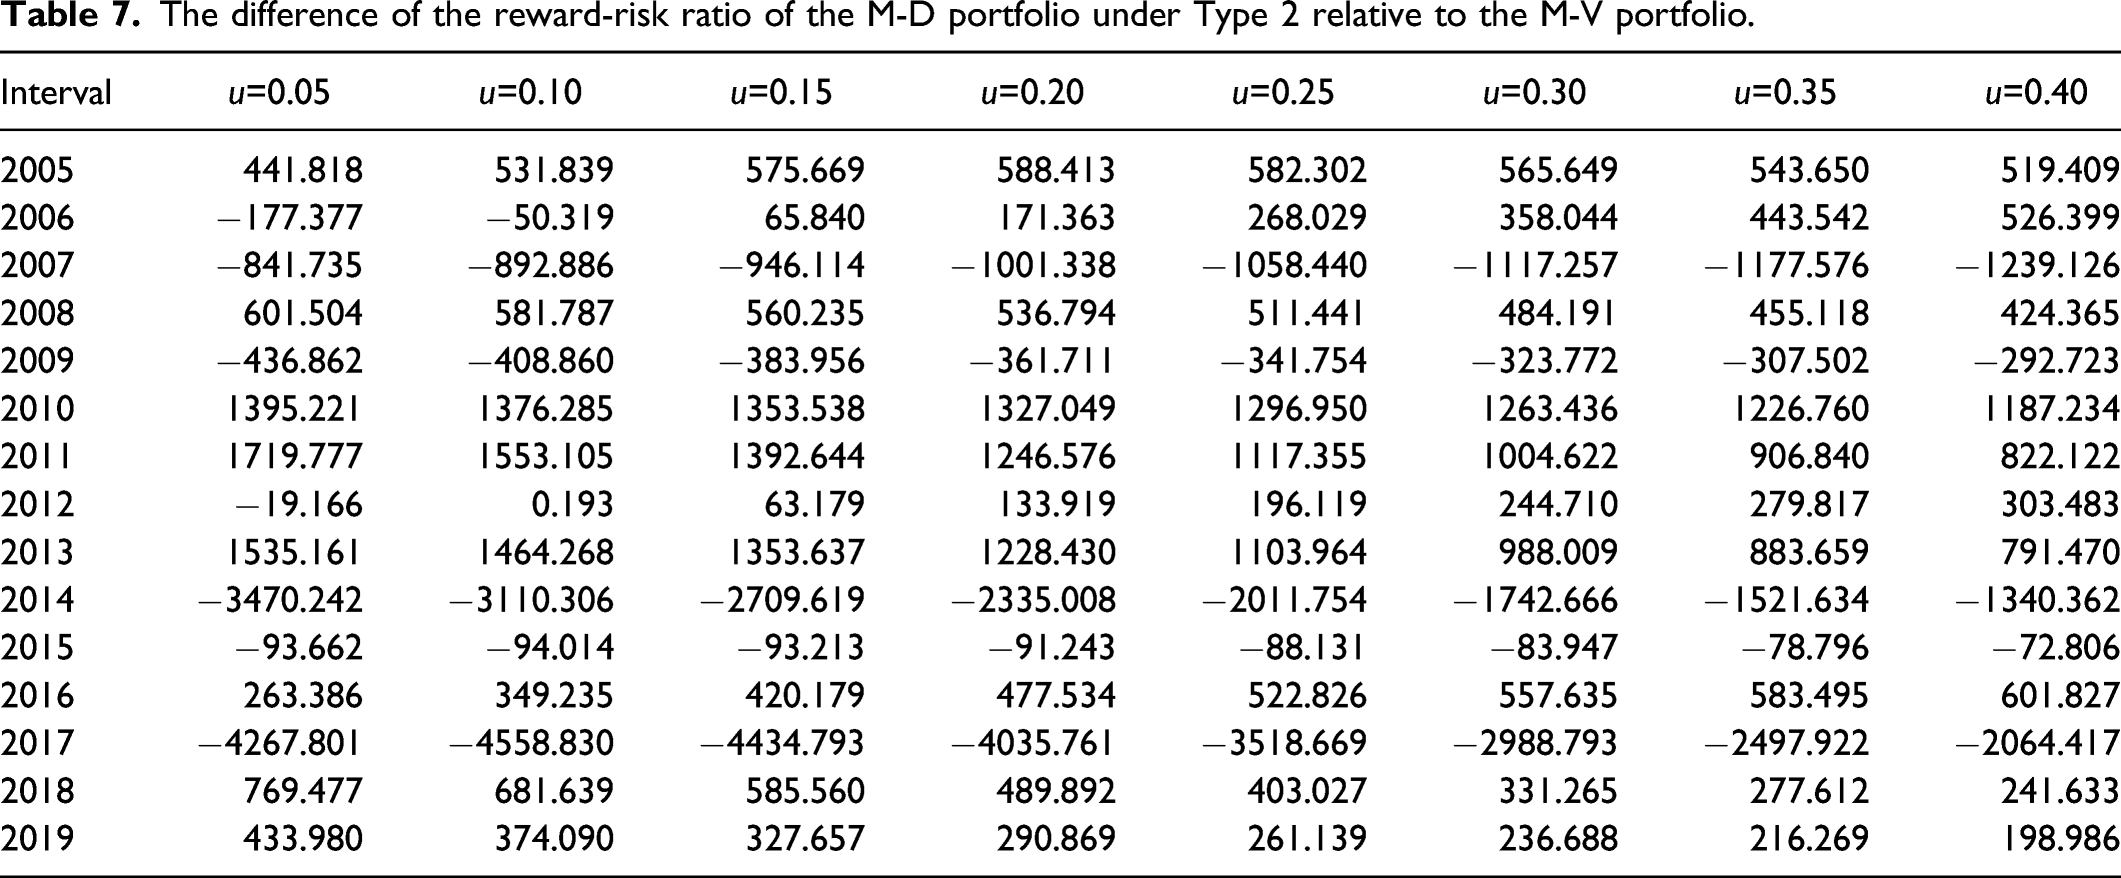
The difference of the reward-risk ratio of the M-D portfolio under Type 2 relative to the M-V portfolio.
The difference of the reward-risk ratio of the M-D portfolio under Type 3 relative to the M-V portfolio.
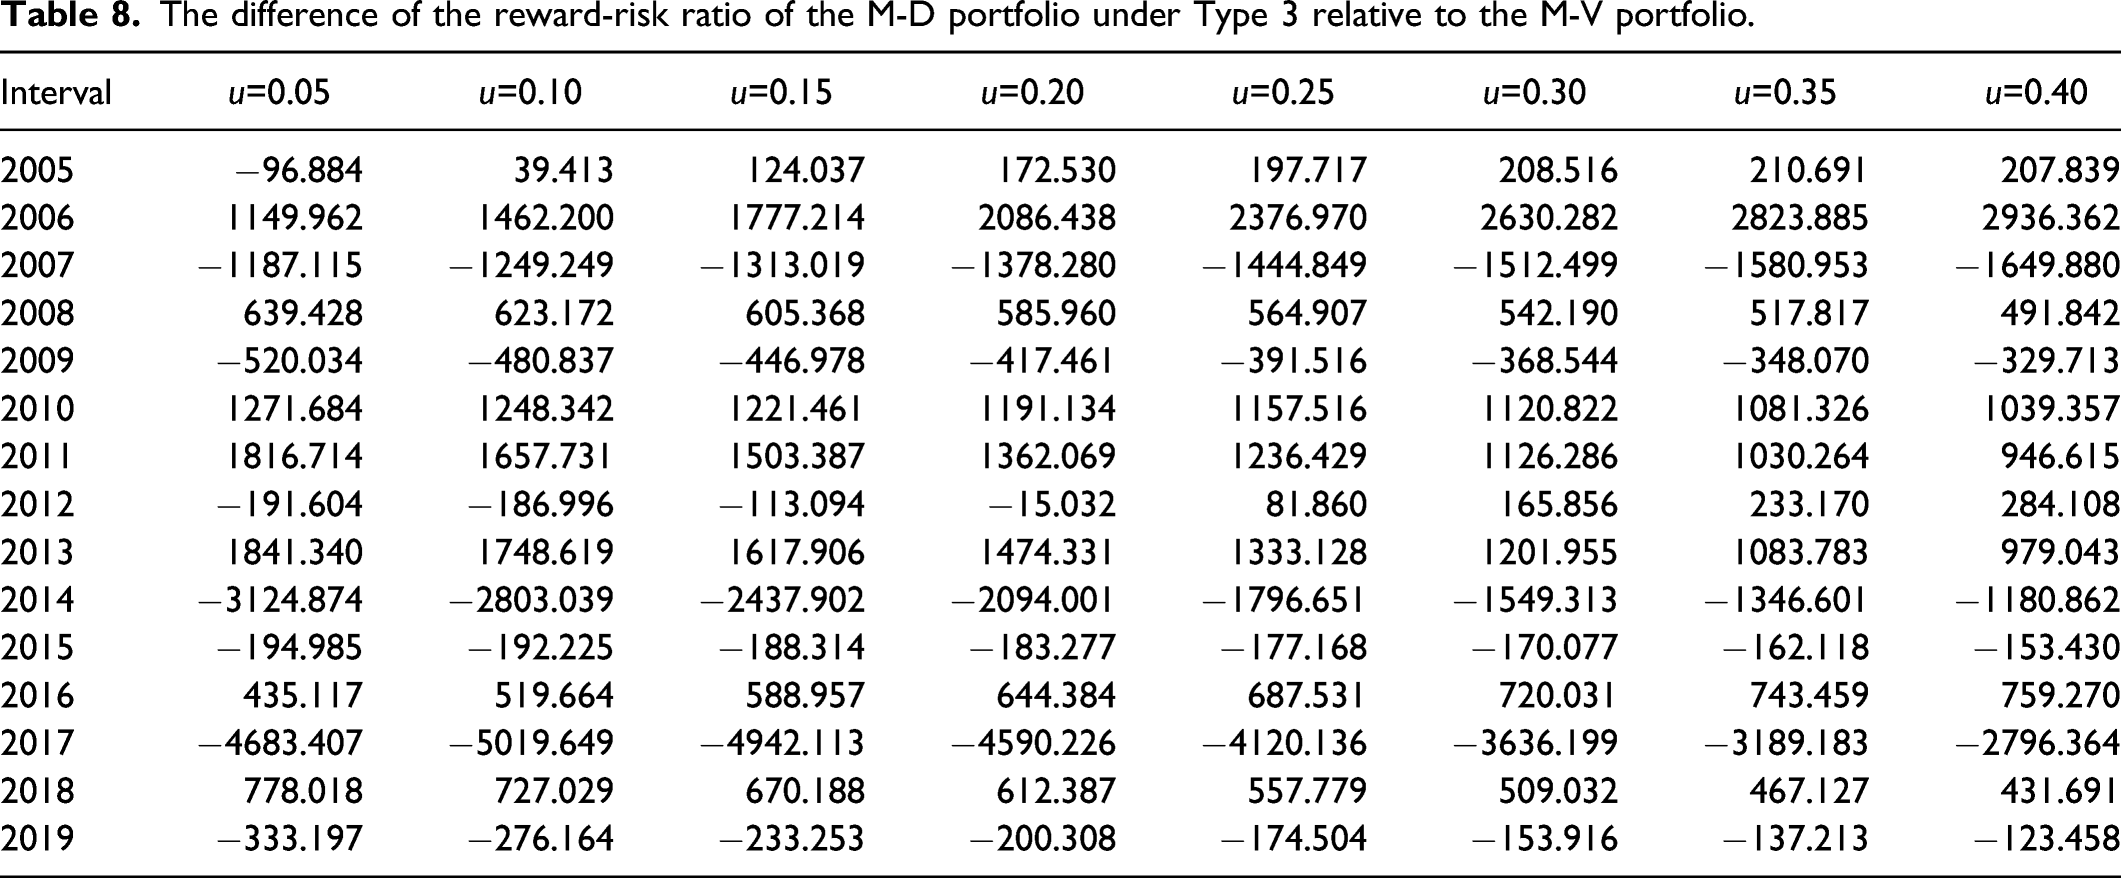
From Tables 6 to 8, there are 75, 77, and 67 cases where the difference of the reward–risk ratio of the M-D portfolio and the M-V portfolio under the three given preference types is greater than zero, accounting for 62.50%, 64.16%, and 55.83%, respectively. As the reward–risk ratio surveys the cumulative rate of return obtained from taking a unit of risk, the larger the reward–risk ratio is, the more effective the portfolio is in maximizing returns, minimizing risks, and more in line it will be with the mean-variance criterion. Thus, Tables 6 to 8 indicate that the M-D portfolio strategy meets the mean-variance criterion more than the M-V portfolio strategy, and the M-D portfolio strategy continues to be superior to the benchmark portfolio strategy under the risk-adjusted performance measurement index, thus the M-D portfolio strategy is valid.
Robustness evaluation of Mean-DCCA
Although Tables 3 to 8 set the investor preference degree The cumulative return series of the M-D portfolio under eight kinds of given returns and the cumulative return series of the benchmark portfolio.
Figure 2 clearly indicates that there are 112 cases in which the cumulative return rate of the M-D portfolio is greater than that of the benchmark portfolio under eight kinds of given returns
To summarize, if there are fractal characteristics of the securities market, whether it is based on the return rate as the performance measurement or the reward–risk ratio as the performance measurement, the M-D portfolio strategy is generally better than that of the M-V portfolio strategy and will be more stable and more in line with the mean-variance criterion. Thus, the empirical results are consistent with the theoretical analysis. The empirical analysis further indicates that the M-D securities portfolio strategy that considers the fractal characteristics of the securities market is effective and can overcome the weaknesses of the mean-variance securities portfolio strategy.
Conclusion and Outlook
To accurately survey the correlation among assets, this study incorporates the fractal correlation characteristics of assets into the research framework of the portfolio strategy when the security market is a fractal market. Based on the use of DCCA to obtain indexes for measuring the fractal correlation between securities, the obtained fractal correlation measurement indexes are embedded in the reward-risk criteria of the MPT, the Mean-DCCA portfolio strategy for multiple risk assets is built, and the analytical solution of the portfolio strategy is given. Theoretical analysis indicates that the Mean-DCCA portfolio strategy synthetically considers multiple time scales, which are more refined than the M-V portfolio strategy of multiple risk assets and surmounts the drawbacks of the M-V portfolio strategy. Meanwhile, the fractal correlation index is more suitable to capture the correlation between assets than the traditional covariance, and it has more stable extrapolation robustness. Therefore, the mean-DCCA portfolio combination constructed by using fractal correlation index helps to make up for the stability of covariance matrix and its inverse matrix when calculate the weight. The empirical analysis also found that, compared to the M-V portfolio strategy, the Mean-DCCA portfolio strategy can improve investment performance and meet the RRC better, thus achieving the goal of optimizing the portfolio strategy of multiple risk assets.
In the case that the security market is a fractal market, this study positions DCCA into the research framework of the portfolio optimization model, and constructs the Mean-DCCA portfolio model of multiple risk assets under different time scales. Compared with previous studies, this model was no longer limited to two kinds of assets, albeit through the allocation of investment weight to a variety of assets it produces the diversification effect of investment, so as to fully reflect the diversification of investment and realize asset appreciation. In addition, this study further introduces investors’ preferences for different time scales, which can fully reflect investors’ preferences for different time scales and meet the objective needs of investors’ diversity. The related research results were not only beneficial for providing a new research perspective for scientific research workers but were also helpful in providing a reference for practice workers to make decisions. In the future, we can refer to the ideas of this paper and combine it with the multi-fractal detrended cross-correlation analysis (MF-DCCA) to make a more detailed description of the fractal volatility among security prices, that is, incorporate different volatility ranges into the framework of subsequent studies; using MF-DCCA correlation coefficient to substitute for DCCA correlation coefficient or traditional covariance, the Mean-MF-DCCA portfolio model of various risk assets can be further constructed and the multi-validity of the model was tested. At the same time, the Mean-DCCA portfolio model can also be brought into feedback trading strategies to further explore relevant applications of the Mean-DCCA portfolio model and expand the research in this paper. Furthermore, although the samples obtained in this paper have been able to evaluate the effectiveness of the Mean-DCCA portfolio model, we can further take the multinational stock market as samples for evaluation, to better provide decision-making reference for multinational investors.
Footnotes
Declaration of conflicting interests
The author(s) declared no potential conflicts of interest with respect to the research, authorship, and/or publication of this article.
Funding
The author(s) disclosed receipt of the following financial support for the research, authorship, and/or publication of this article: This work was supported by the National Natural Science Foundation of China (71903017), Ministry of Education in China Project of Humanities and Social Sciences (17YJC790168), and the National Social Science Foundation of China (17BJY188).