



Abstract
This paper describes how a multi-armed randomized experiment was used to test multiple variants of a behaviorally informed marketing strategy. In particular, we tested whether specific behavioral messages could be used to increase demand for a safety consultation service offered by the U.S. Occupational Safety and Health Administration. Our experiment used a partial factorial design with 19 study arms and a very large research sample—97,182 establishments—to test the impact of various message, formats, and delivery modes compared with an existing (not behaviorally informed) informational brochure and a no-marketing counterfactual. A secondary research goal was to predict the impact of the most successful marketing strategy (i.e., combination of message, format, and mode) so that OSHA would know what to anticipate if that strategy were implemented at scale. We used two related (but distinct) methods to address these two goals. Both begin with a common mixed (i.e., fixed and random effects) ANOVA model. We addressed the first research goal primarily from the fixed effects; we addressed the second research goal by calculating best linear unbiased predictions (BLUPs) from the full mixed model, where the BLUP involves “shrinkage” as in empirical Bayes (EB) approaches. Marketing via brochures was effective overall, nearly doubling the rate of requests for services. However, the behaviorally informed materials performed no better than OSHA’s existing informational brochure. This study also highlights the conditions under which a factorial design can be used to efficiently address questions about which of several program variants are most effective.
Keywords
Introduction
In an effort to help business establishments comply with safety and health regulations, the Occupational Safety and Health Administration (OSHA) within the U.S. Department of Labor (DOL) offers a free and voluntary consultation service to small establishments in high-hazard industries. Establishments may request this service—known as the On-site Consultation Program (OSC)—by calling or emailing their state’s consultation office to schedule a visit. Even in industries with high rates of worker injuries and illnesses, only a small fraction of eligible establishments ever request a consultation.
This study explored the effectiveness of marketing OSC to businesses using a brochure-based approach incorporating behaviorally informed messages and other insights (e.g., personalization, reducing hassle factors). It sought to determine whether specific marketing components were particularly effective. These components were the following: (1) the content of the marketing, in particular new messages designed to appeal to various motivating factors and based on psychosocial theories of behavior change (Applied Research and Consulting, 2013); (2) the visual presentation of that content using various formats or “exemplars” (Alvaro et al., 2006; Siegel & Burgoon, 2002; Siegel et al., 2008); and (3) an accompanying email designed to reduce hassle factors by providing OSC contact information and a link to the appropriate state-specific OSC website (Leventhal et al., 1965). Marketing materials were also personalized (i.e., addressed to a specific person at each worksite), but this was common to all brochures and was not tested as a separate behavioral component.
The study used a multi-armed experiment with a research sample of 97,182 establishments to test the effectiveness of the marketing effort and each of its components. Of these, 30,852 establishments were assigned to receive marketing materials and the remainder were assigned to a no-marketing control group. Despite the large size of the research sample, it was imperative to efficiently utilize the research sample (i.e., minimize the combined size of the treatment arms) because of the per-participant cost of the intervention and the need to preserve “untouched” sample for a future research project. Simultaneously testing the impact of these various components, or factors, was efficiently accomplished by the use of a partial factorial study design in which participants were randomly assigned to different combination of the factors (messages, formats, and delivery mode). Predicting the likely impact of each combination of factors was accomplished using an empirical Bayes (EB) methodology to calculate Best Linear Unbiased Predictions (BLUPs). This strategy partially mitigates the multiple comparisons problem inherent in multi-armed trials by removing sampling error from the impact estimates using the EB estimate of that sampling error. This yields a more plausible estimate of what the likely impact of marketing using each combination of factors would be if later implemented at a large scale. However, because the study uses a classical fixed-effects framework for hypothesis testing, this EB methodology did not alter the study’s statistical conclusions.
The results were simple and striking. First, the marketing strategies tested were effective. Mailing brochures nearly doubled the rate of requests, from 1.1% for establishments in the control group to 2.0% for establishments that were targeted with marketing materials. Second, among the brochures tested, the content of these marketing messages did not matter. In particular, there was no detectable difference in impacts between the new behaviorally informed messages and OSHA’s existing informational brochure, no detectable variation in impacts among the various new behaviorally informed messages, and no detectable variation in impacts among the formats used to convey those messages. Third, sending emails did not improve the effectiveness of the marketing. In addition to the corresponding mailings, some randomly selected establishments were sent emails while others were not; there was no detectable difference in impact between the two groups.
The balance of this paper is organized as follows. The Context section provides background on the OSC program and places the study in context. The Study design section presents the study’s design, including sample selection and distribution of marketing materials. The Data and descriptive statistics section describes the data used for analysis and presents descriptive statistics of the sample. The Empirical analysis section describes the empirical model used for analysis. The Results section presents results, both overall and for key subgroups. The Discussion section briefly discusses the policy implications of these results and describes features of the methodological approach that could be applied to other multi-armed studies.
Context
Overview of the On-Site Consultation Program
Understanding the study’s marketing approach requires familiarity with the On-site Consultation Program’s structure, benefits, and costs. OSC provides free, confidential, and voluntary consultations to small and medium-sized businesses throughout the United States. The program’s goal is to help businesses identify and correct workplace hazards and improve their safety and health management systems. As a voluntary program, requests for a consultation visit are always initiated by the business. Although most requests are made via phone or fax, some state consultation programs also accept requests via email or using an electronic request form on the state’s OSC website.
The most obvious potential benefit to employers of program participation is improved workplace safety, which could in turn result in lower insurance premiums. Whether OSC improves workplace safety is unclear. Mendeloff and Gray’s (2002) non-experimental analysis appears to be the only study of OSC’s effectiveness. They estimate that a consultation causes injury rates to decline by a small amount (about 5%) and violations to decline by a larger amount (about 34%). Another potentially important benefit of OSC is that participating establishments have the right to defer certain OSHA enforcement activities while the OSC visit is ongoing. In particular, establishments may defer programmed inspections, which are essentially inspections that arise as a result of establishments’ high previous injury/illness rates or other OSHA enforcement priorities.
Participation in OSC is nominally free, and no fines or penalties are assessed as a result of violations identified during the visit. However, receiving a consultation has some indirect costs, which OSHA asked us to acknowledge in our marketing materials. Most prominently, all serious hazards that are identified during a visit must be corrected at the business’s expense within a specific time period agreed upon by the consultant and the business. Moreover, consultants are required to report dangers or hazards to OSHA enforcement if they are not corrected in a timely manner. Although such reporting is rare, discussions with establishments suggest that this could discourage some from seeking a consultation visit.
Development of Behaviorally Informed Marketing Materials
Marketing approaches were developed in collaboration with researchers at Applied Research and Consulting, LLC (ARC), which was contracted by DOL’s Chief Evaluation Office to serve as third-party social and behavioral marketing specialist for this study. (ARC had no role in the evaluation).
Drawing on psychosocial theories of behavior change, ARC developed four different marketing messages grounded in behavioral theory, which were incorporated into printed brochures and emails. Each message was designed to appeal to a different motivating factor: • self-determination (Ryan & Deci, 2000), • fear (based on the Extended Parallel Processing Model, or EPPM; Witte & Allen, 2000), • the hope of achieving a desired outcome (based on expectancy theory, also called Safety Pays; Vroom, 1964), or • risk avoidance (based on the Risk Communication Framework; Slovic et al., 1981).
Based on extensive stakeholder feedback and more-limited focus group testing, three of these approaches were selected for testing. ARC described these three approaches as follows: 1. Self-Determination Theory (SDT). This framework was created with the goal of explaining when and why people will be motivated to engage in a specific behavior. SDT proposes that increasing a person’s feelings of autonomy, competence, and relatedness maximizes internal motivation, which is the best basis for lasting behavioral change. Messages based on an SDT approach would be written so that feelings of autonomy, competence, and relatedness are maximized on the part of the employer. If a message successfully increases an employer’s feelings in these regards, intrinsic motivation to use the OSC program will increase and an increase in the likelihood of the behavior, in this case contacting the OSC program, will follow. 2. Extended Parallel Processing Model (EPPM or Fear). While SDT focuses on increasing internal motivation, the EPPM turns attention on external motivators—in particular, fear. Fear appeals can successfully increase a targeted behavior; however, they can also backfire. The EPPM offers insight into when fear appeals will lead a person to engage in the behavior advocated in the message (e.g., calling the OSC program) and when fear appeals will have the opposite effect. In many contexts, such as this one, the key ingredient is likely to be whether the employer feels capable of avoiding the harms threatened in the message. If the employer believes their workplace can be shut down as a result of violations, and they fear this will happen, a message that makes it clear that this negative outcome can be avoided by requesting an on-site consultation, while also providing useful information on how to do so, should be highly effective. 3. Expectancy Theory (Safety Pays). An expectancy approach proposes that individuals are more likely to engage in behaviors that are seen as leading to desirable outcomes rather than ones that will not. The key is to link a behavior to a desired outcome, in the case of the OSC program, it was decided to expand and enhance one theme already present in some OSC literature—Safety Pays. As such, theory-based messages focus on creating the expectancy that if establishments contact the OSC program, they will see real financial benefits. A good expectancy-based Safety Pays message will activate specific needs among establishments (e.g., financial gain, avoidance of costs) and then convince them that contacting the OSC program will satiate those needs.
In addition, ARC designed multiple formats (also called exemplars) as a way to visually present the messages. Three of these formats were tested in the experiment: • a dialogue format in which two business managers discuss participating in OSC, • a myth/fact format addressing myths about OSC, and • a future orientation format that invites the reader to visualize the process of requesting and proceeding through the OSC program.
Each format was flexible enough to convey any of the theory-based messages, yielding a total of nine possible message*format combinations. The draft brochure featuring one of these combinations (fear*dialogue) received uniformly negative feedback from stakeholders and was dropped from consideration.
OSHA’s existing OSC informational brochure was not designed to include motivational appeals. In order to test whether the motivational appeals were more effective than the standard messaging, the informational brochure was modified to add state-specific contact information so that it could be tested alongside the new brochures. Similar to what was included in the eight new behaviorally informed brochures, this contact information was designed to reduce hassle factors associated with requesting an OSC visit.
The study team also developed a companion email message for each brochure (including the informational brochure), translating the brochure’s messaging and images into an HTML format. The email was primarily intended to make it easier for establishments to request a consultation (i.e., further reduce hassle factors) by including links to state-specific OSC websites.
Study Design
Sample Selection and Random Assignment
The study’s analytic sample consists of 97,182 establishments drawn from the Dun and Bradstreet Hoovers system. Establishments in broadly defined groups of high-hazard industries were selected using North American Industry Classification System (NAICS) codes. These industries were chosen in consultation with DOL’s Chief Evaluation Office (CEO) and OSHA and were intended to represent the kinds of industries and establishments that would most benefit from OSC services. A complete list of included industries by NAICS code is provided in Juras et al. (2016). The sample is nationwide in scope with the exception of Washington and Kentucky, which were excluded from the evaluation because of the unique mechanism used to fund OSC services in those states.
The sample includes only establishments categorized as high priority for receiving OSC services. Such establishments employ fewer than 250 employees at the worksite and fewer than 500 employees companywide. In addition, for reasons related to data availability, worksites that had fewer than 10 employees were excluded from the sample. Finally, a small number of establishments were excluded (again, prior to randomization) for other reasons, such as participation in an ongoing DOL study of the Site-Specific Targeting program (Peto et al., 2016).
Each of these 97,182 establishments was randomized to one of 19 distinct study arms: a total of 30,852 establishments were randomized to the 18 treatment arms and the remaining 66,330 establishments were assigned to a single no-marketing control arm. Each of the 18 treatment arms is a combination of the three factors: type of messaging (4 levels, including 3 behavioral messages + OSHA’s regular message), format (3 levels), and modality (2 levels; by mail only or by mail + email). 1
In a full factorial design, these combinations would yield 24 possible experimental conditions. However, one combination of format and modality (fear*dialogue) was not tested because of negative feedback, and the regular OSHA message had only a single existing format. The resulting 18 treatment arms and single control arm are described in Figure 1. Description of the Study’s 19 arms.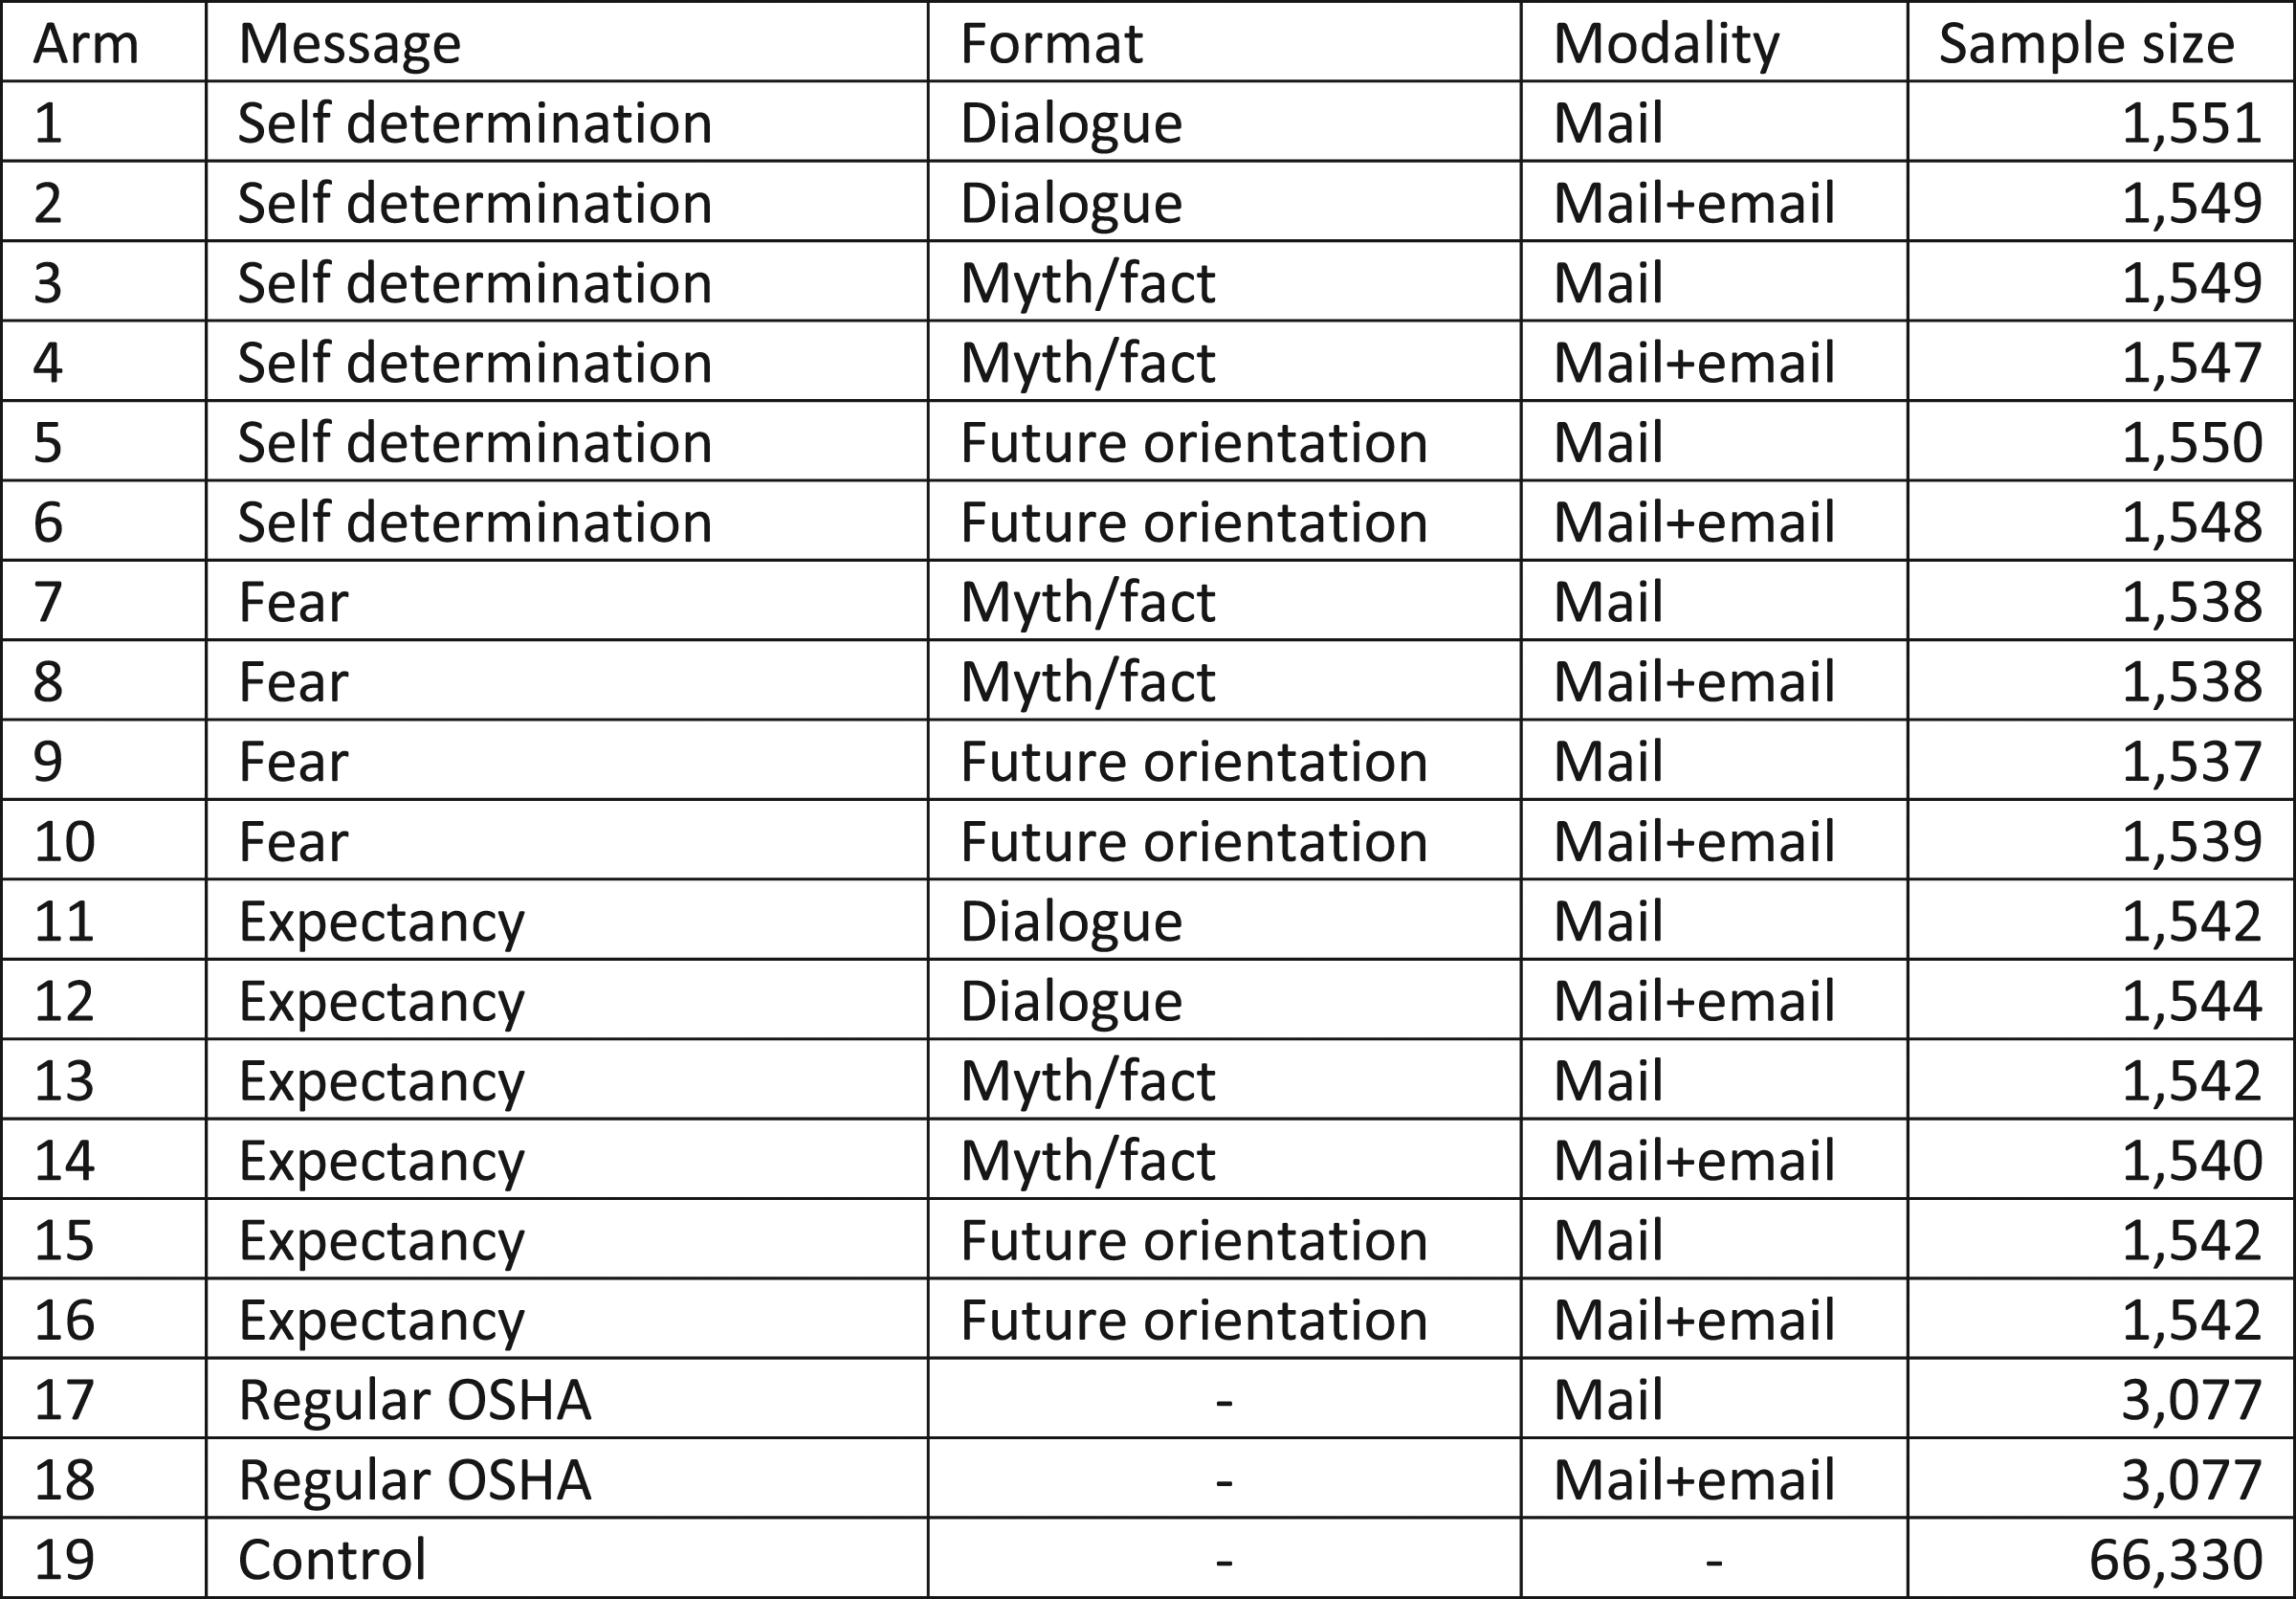
The partial factorial design allowed us to examine every feasible combination of message, format, and mode while maintaining statistical power to estimate the average impact of each message compared with no marketing. For example, to test the overall impact of the self-determination message compared with no marketing, we would compare the average request rate in arms 1–6 with the request rate in arm 19. To test the relative impact of the myth/fact format versus the future orientation format, we would compare the average request rate in arms 3, 4, 7, 8, 13, and 14 with the average request rate in arms 5, 6, 9, 10, 15, and 16. Note that both of these comparisons use information from arms 3–6. Because it “re-uses” data from each study arm to answer multiple research questions, the design is more sample-efficient than a typical multi-armed trial.
Consultations occur at the establishment level rather than the firm level. Because establishments within a firm might not behave independently, random assignment was implemented at the level of the firm (or corporate parent) such that two establishments with the same corporate parent would be assigned to the same study arm. Assignment was stratified by industry group (e.g., manufacturing, nursing homes), with the random assignment ratio in each group adjusted to reflect practical considerations. 2 The random assignment process was also stratified by the number of employees in the parent company of each firm to minimize the possibility of imbalance on this key characteristic. 3
The 66,330 establishments assigned to the control arm continued to operate under “business as usual” conditions, receiving no marketing from the study team. Because state OSC programs engage in periodic efforts of their own to promote their services, the control group may have been exposed to some marketing during the study period. 4 Thus, this study represents a test of whether certain kinds of marketing—implemented in addition to whatever marketing is already under way—increase the consultation request rate.
Targeting, Personalization, and Distribution of Marketing Materials
Each establishment assigned to one of the 18 treatment arms received three identical hard-copy mailings of its designated brochure—sent in April, May, and June 2014. Each mailing consisted of an OSHA envelope containing two items—the designated marketing brochure and a cover letter from OSHA Assistant Secretary David Michaels. The body of the cover letter contained text drafted by ARC describing basic facts about OSC.
Whenever possible, the envelopes were sent to a named individual. A two-stage process was used to identify the most relevant contact person at each establishment, and the envelope and letter were addressed to that person. The first step in the identification process was to use a database of contacts for OSHA’s Safety and Health Achievement Recognition Program (SHARP) to generate an ordered list of “relevant” job titles based on their prevalence, with job titles that appeared most frequently in the database at the top of the order. The second step was to compare the (standardized) job titles of establishment-level staff in the Hoovers database with our ordered list, selecting the staff person with the title that appeared highest on the ordered list as the most relevant contact person. The envelope was mailed, and the letter addressed, to that person.
For each establishment in the mail-plus-email treatment groups, personalized emails were concurrently sent to up to three named individuals for whom an email address was provided in Hoovers and who were identified as the three most relevant contacts using the process described above. Emails were sent approximately 2 weeks after each hard-copy mailing, for a total of three emails per recipient. Each round of emails was sent over a 3-day period to reduce the possibility that messages would be classified by the receiving servers as spam. Across all industry/establishment groups, at least one email was successfully sent to 8,688 (or 56%) of the 15,427 establishments that had been randomly assigned to receive a companion email. 5 Thus, the impact of email should be viewed as an intent-to-treat impact (i.e., the impact of the option of sending an email when available, not the impact of actually sending an email). An instrumental variables estimate of the marginal impact of actually sending an email was also calculated to aid with interpretation.
Data and Descriptive Statistics
Data Sources
An analysis file with one record for each of the 97,182 establishments that comprise the treatment and control groups was created by linking records across three data sources, which are described below. Outcome data and some background information (consultation request history) were obtained from the OSHA Information System (OIS) consultation database. 6 Inspection histories were obtained from the OIS enforcement database. All other information (demographics, industry and corporate parent, and randomization status) was obtained from the sample file, which was created using Dun and Bradstreet’s Hoovers database as described earlier.
The OIS consultation database contains rich information on each request for a consultation visit made during the study period. Each record includes the request date, establishment-identifying information, primary and secondary NAICS codes, the number of employees, hazard classification, services requested, and the source of the request. 7 OSHA provided complete data from OIS consultation-related records spanning the duration of the 6-month follow-up period: April 18, 2014, to October 18, 2014. OSHA also provided data on consultation requests for the eight full years before the beginning of the study—April 18, 2006, through April 17, 2014—which were used to create a baseline covariate indicating whether each establishment in the sample had made a previous consultation request.
The OIS inspection database contains detailed information on each inspection conducted by OSHA enforcement during the study period. OIS inspection records contain information similar to that included on OIS consultation records, including establishment-identifying information (e.g., name, address, and industry) that was used to link the two datasets. OSHA provided complete data on inspections for 1 year prior to the study (April 18, 2013, through April 17, 2014).
Because the sample, consultation request, and inspection datasets do not share a common establishment-level identifier, a probabilistic matching procedure was used to link records in the sample file with the two sets of OIS records. The matching algorithm is described in Supplementary Appendix B.
Sample Descriptive Statistics
Baseline Descriptive Characteristics of Establishments.

Notes: This table reports sample means or sample proportions for establishments that made requests during the previous 5 years. Analysis of the data indicates that approximately 7% of these requests were withdrawn prior to an OSC visit occurring. Total rather than net requests are reported because this covariate is used as a proxy for whether the establishment was already aware of the OSC program. The number of OSC requests per establishment is calculated as the total number of OSC requests made by establishments in the sample during the past 5 years, divided by the number of establishments in the sample.
Baseline balance tests across the treatment group (pooled across messages) and control group show no evidence of systematic imbalance. 8 Nonetheless, the regression analysis controls for all characteristics shown in Table 1.
Empirical Analysis
Empirical Model
The main goal of this study was to determine whether behaviorally informed marketing was effective at increasing requests for OSC services. For that purpose, the impact of each message, format, and delivery mode were estimated in comparison with informational marketing and the status quo of “business as usual.” A second research goal was to predict the impact of the most successful marketing strategy (i.e., the combination of message, format, and mode that yielded the highest point estimate of impact) so that OSHA would know what to anticipate if that strategy were implemented at scale.
Two related (but distinct) methods were used to address these two goals. Both begin with a common mixed effects (i.e., fixed and random effects) regression model (McLean et al., 1991) that reflects the hierarchical structure of the data, with establishments nested within corporate parents, which are nested within experimental conditions. The first research goal (i.e., the impact of each message, format, and delivery mode in comparison with informational marketing and the status quo of “business as usual”) was addressed primarily using the fixed effects; the second research goal (the impact of the most successful marketing strategy) was addressed by calculating BLUPs from the full mixed model, where the BLUP involves “shrinkage” as in EB approaches (see below). Although the mixed model was necessary only for calculating BLUPs, an identical model was used across all analyses in order to generate consistent estimates across research questions. All statistical procedures were pre-specified prior to data analysis, and Stata code was pre-tested using simulated data.
The impact of each message, format, and mode was estimated using a hierarchical linear probability model of the following general form
The data include multiple establishments for a single firm. Independence of residuals for establishments within firms seems unlikely. Therefore, the model allows for clustering (random intercepts) at the level of random assignment (i.e., corporate parent, not establishment), indexed by 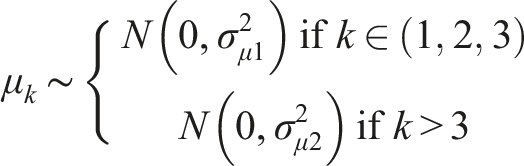
Finally, to test whether the impact of marketing is larger for certain subgroups, defined using baseline characteristics (e.g., number of employees), a dummy variable indicating subgroup membership was interacted with each of the terms in equation (1) and significance of the interaction term on the variable of interest was tested (or joint significance, for tests of differences across several variables).
When reporting marginal effects, the linear regression specification for the binary outcome (request for consultation) implicitly adopts the standard linear assumption that the impact of a factor is constant in percentage points across the other factors (e.g., the effect of adding email is a constant percentage point impact across all three messages).
Finally, the basic estimates give the effect of being assigned to the email treatment condition; that is, an ITT/intention-to-treat analysis. However, email addresses were available for only about half of the establishments. Therefore, we applied a “no-show” adjustment using the methodology described in Bloom (1984) to estimate the impact of actually receiving an email.
Empirical Bayes Predictions
At the time this study was conducted, OSHA envisioned selecting the complete marketing strategy (i.e., combination of factors) that had the largest point estimate and implementing it more broadly. They wanted to know how many requests this was likely to generate. Predicting the request rate for such a strategy is subtle. All estimates have sampling variability, and in the context of this evaluation strategies that appear to have high request rates are likely to have high request rates in part because of this sampling variability. In contrast, the model-based prediction from equation (1) may be too low, because the model does not account for potentially beneficial interactions among messages, formats, and modes. To address these dual concerns, BLUPs of the request rates were predicted using EB estimates of both the observed mean for a marketing strategy and the fitted model in equation (1) 12 .
Heuristically, BLUPs are predicted impacts that lie somewhere between (i.e., are weighted averages of) the observed mean request rate for a marketing strategy (the “cell mean”) and the model-based fixed-effects estimate for the marketing strategy that would be obtained from equation (1). How far between the two (i.e., what the weights should be) depends on the precision of the estimate of the simple cell mean and the fit of the model in equation (1). More observations lead to a more precisely estimated simple cell mean. A better-fitting model would imply that the best prediction would be closer to the model-based estimate, because that model-based estimate does a good job of explaining the variation across marketing strategies.
EB theory describes how to calculate the weights. (See Supplementary Appendix C for a formal derivation.) In particular, if the variance of 


Results
This section reports the results of the analysis. Section 6.1 presents the overall impact results. Section 6.2 considers how impacts vary over time. Section 6.3 discusses subgroup results.
Impact Overall and by Message, Format, and Mode
Impact of Marketing on Six-Month Consultation Request Rate, by Type of Marketing.

Notes: Two-sided test: *p<.1; **p<.05; ***p<.01. Results in this figure are based on a multi-level regression as described in Equation 1 with 97,182 observations. As a result of rounding, reported impacts (treatment-control differences) may differ from differences between reported regression-adjusted means for the treatment and control groups.
Informational versus Behaviorally Informed
The second set of results in Table 2 (rows two and three) shows the impact separately for two types of messaging: the existing OSHA informational brochure compared with the average across behaviorally informed messages. The difference between the two types of messages was not statistically significant (p = .650); that is, the behaviorally informed messages did not significantly outperform the existing OSHA informational brochure.
By Message
Further differentiating between the three behaviorally informed messages (the third set of results in Table 2), there is no evidence to suggest that the type of message affects the impact of marketing (p=.654). 14
By Format
The fourth set of results in Table 2 presents the average impact of the behaviorally informed messages, when implemented using each of the three formats: dialogue, myth/fact, and future orientation. (The existing OSHA brochure does not use formats, which were developed for the behaviorally informed messages.) The results show that marketing is equally effective regardless of which format is used: the impact is statistically indistinguishable across formats (p=.954).
By Mode
The fifth and final set of results in Table 2 shows the estimated impact by mode of distribution. There is no evidence that sending a follow-up email has any effect on the impact of marketing (p=.982). Using the Bloom correction, the impact of actually sending an email was estimated to be approximately .01% points, which—although nearly twice as large as the ITT estimate of essentially zero—remains substantively small. This rescaling does not affect the statistical significance of the estimate.
Predicted Impact
The message*format*mode combination that has the largest point estimate—although it is not statistically or meaningfully more effective than any other combination—incorporates the expectancy (Safety Pays) message with the dialogue format and no follow-up email. If OSHA were to implement this marketing strategy, the EB methodology described above suggests that the 6-month request rate for establishments receiving this marketing strategy would be 2.23 requests per 100 establishments, which is more than double the request rate of 1.05 requests per 100 establishments observed in the control group. The EB estimate is much closer to the model-based (fixed effects) estimate of 2.18 requests per 100 establishments than to the unadjusted (naïve) estimate of 2.79 requests per 100 establishments. In this sense, the model-based estimates are precise. If the estimates were less precise, the EB estimate would be closer to the unadjusted estimate.
Impact Over Time
A potential concern about these findings is the possibility that instead of generating new requests, the study’s marketing effort may have shifted the timing of some already-planned requests from “later” (i.e., after the 6-month follow-up window) to “earlier” (i.e., within the 6-month window). Using this study’s methodology, such a shift in timing would appear to be increased demand.
To explore this possibility, Figure 2 plots the cumulative number of requests in the treatment group compared with the control group for each week after the first mailing was sent to establishments in the treatment group (week 0). As noted earlier, second and third copies of the same brochure were mailed to each establishment in weeks 4 and 9. For establishments assigned to the email treatment arm, follow-up emails were sent in weeks 2, 6, and 10. As Figure 2 shows, the control-group cumulative request rate appeared to follow a roughly linear trend (i.e., approximately the same number of requests were made each week during the follow-up period, totaling a cumulative 1.05% of establishments after 6 months). This is what would be expected in the absence of new marketing. Cumulative consultation request rate by week, marketing versus no marketing. Note: Vertical lines at 4.5 and 9.5 weeks indicate timing of second and third mailings.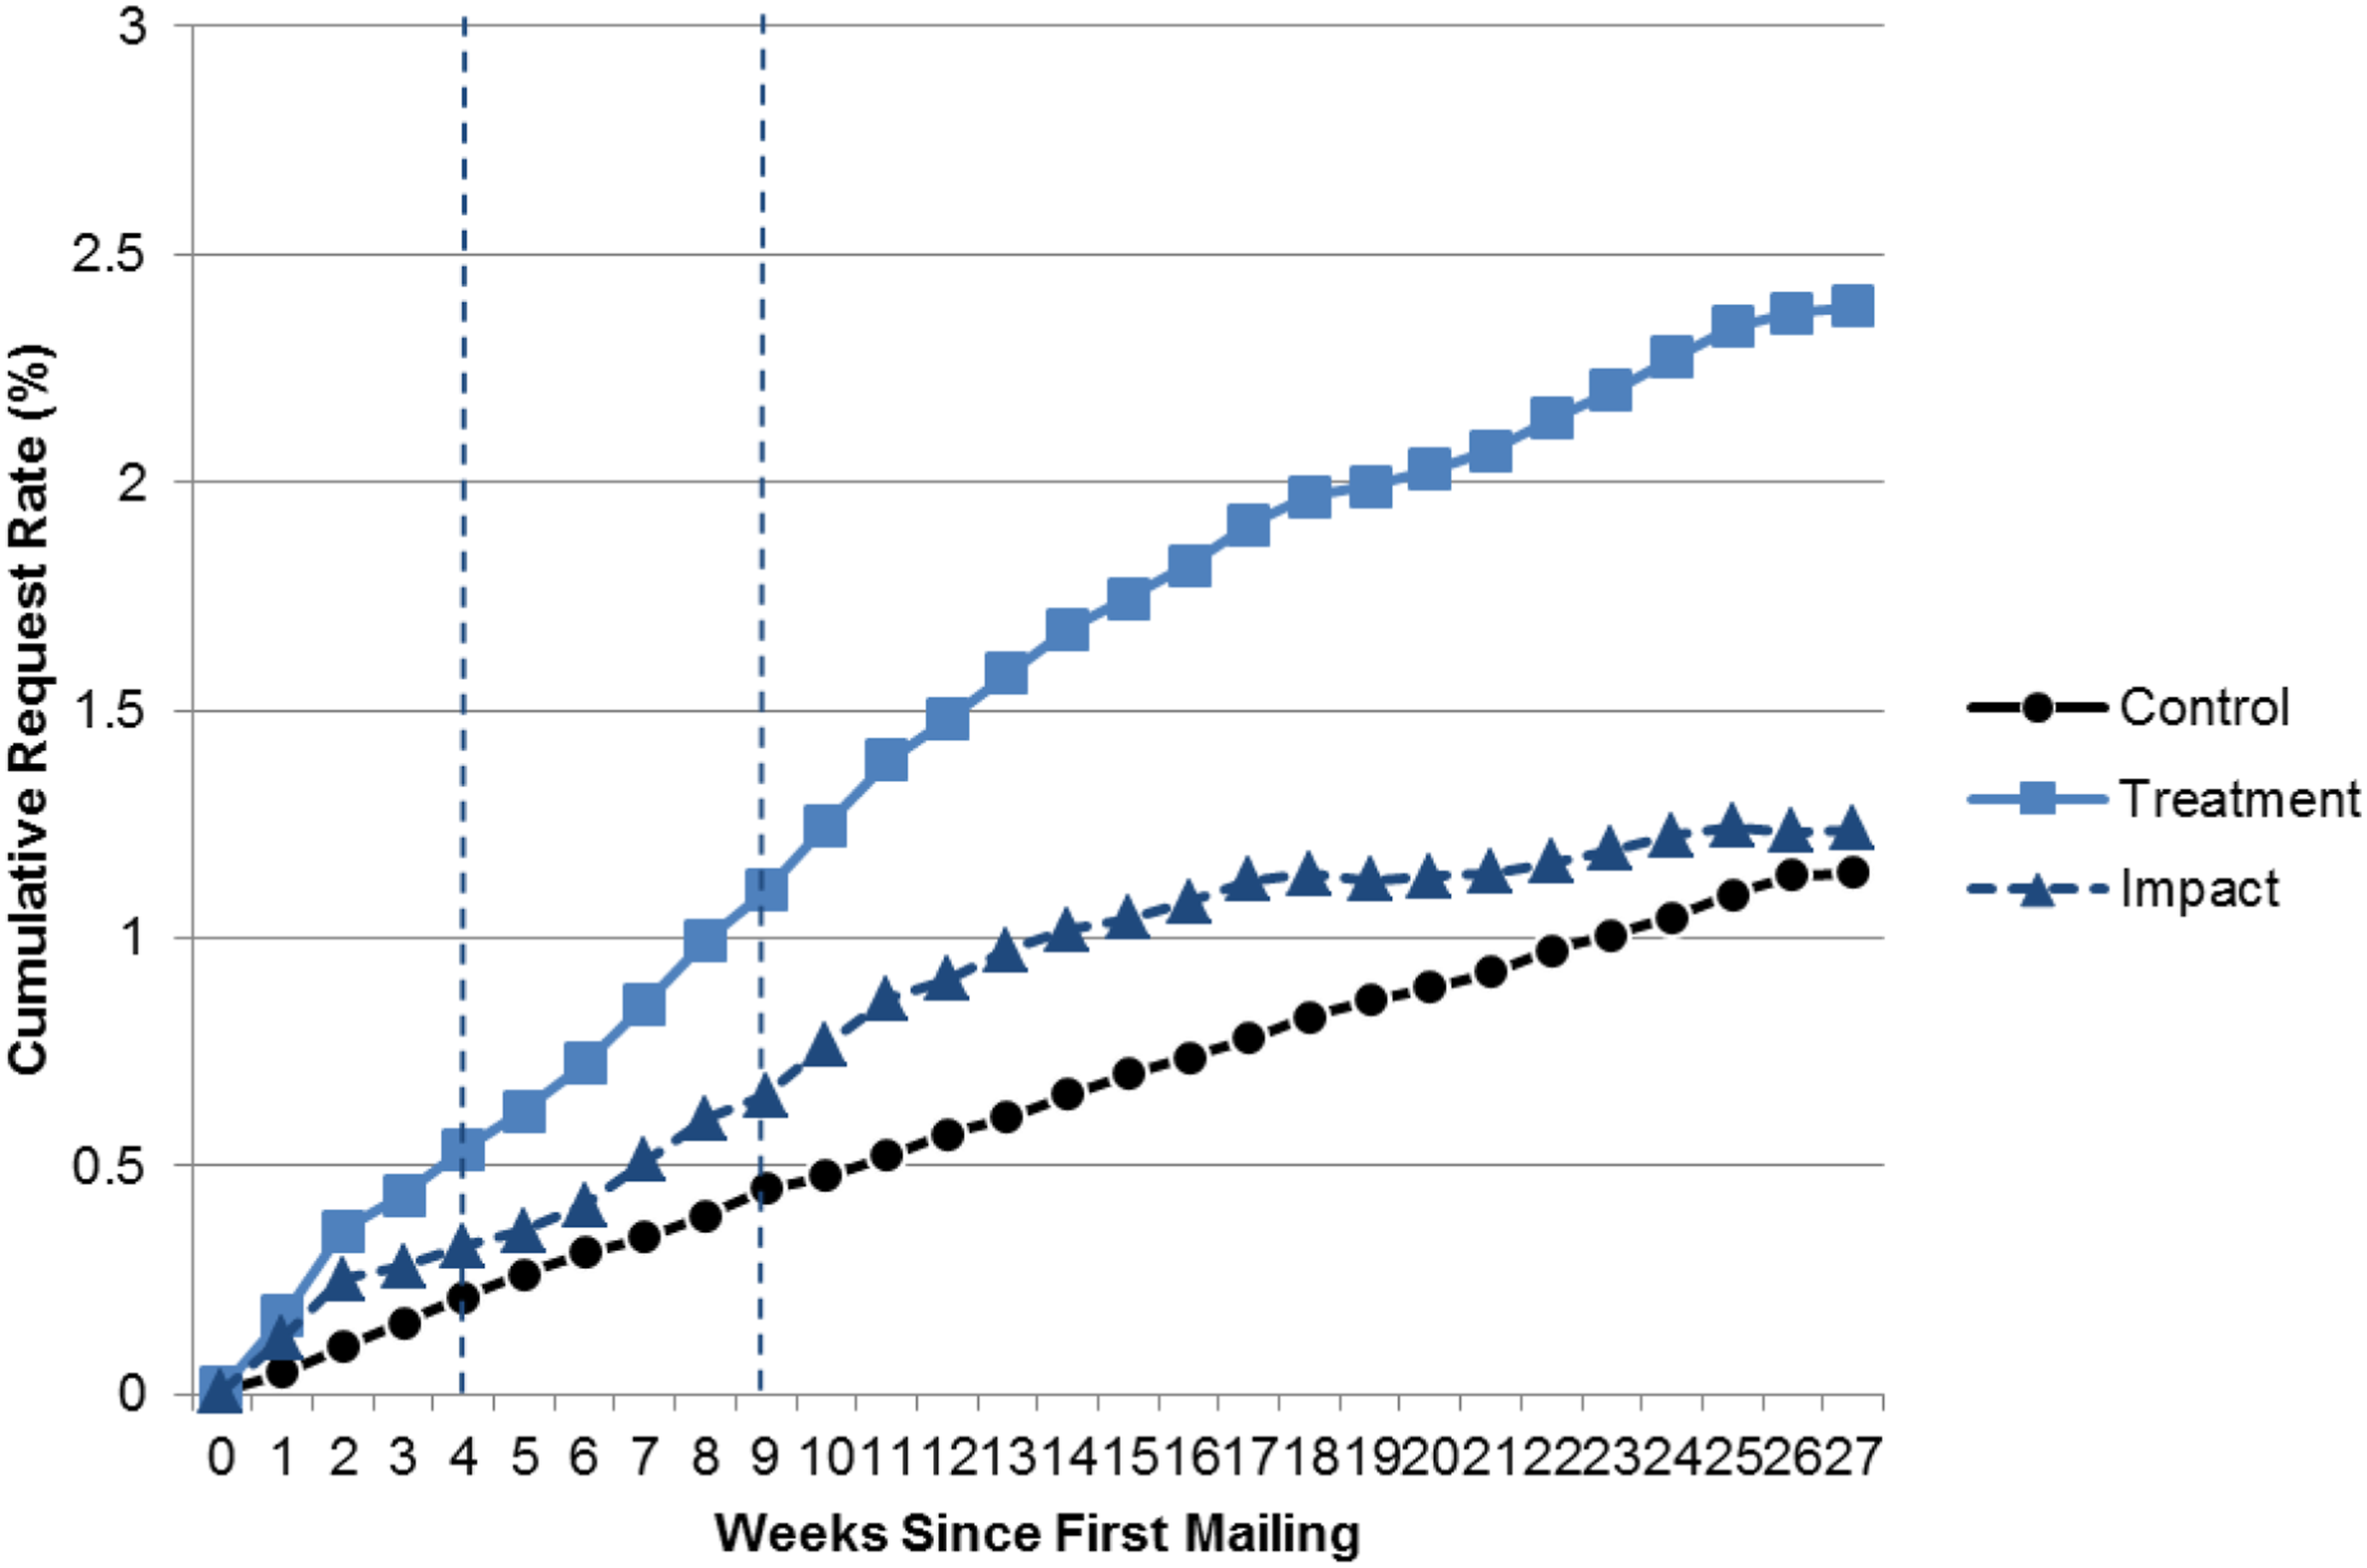
In contrast, it appears that the number of requests in the treatment group increased much more rapidly than in the control group for roughly the first 3 months of the follow-up period, during which a brochure was mailed each month. Over the subsequent 3 months, the request rate appeared similar to the control-group request rate (i.e., the lines are parallel). There is no evidence that the cumulative request rates tended to converge toward the end of the follow-up period, which suggests that marketing was generating new requests rather than shifting the timing of existing requests.
Impact of Marketing on Consultation Request Rate, by Month.
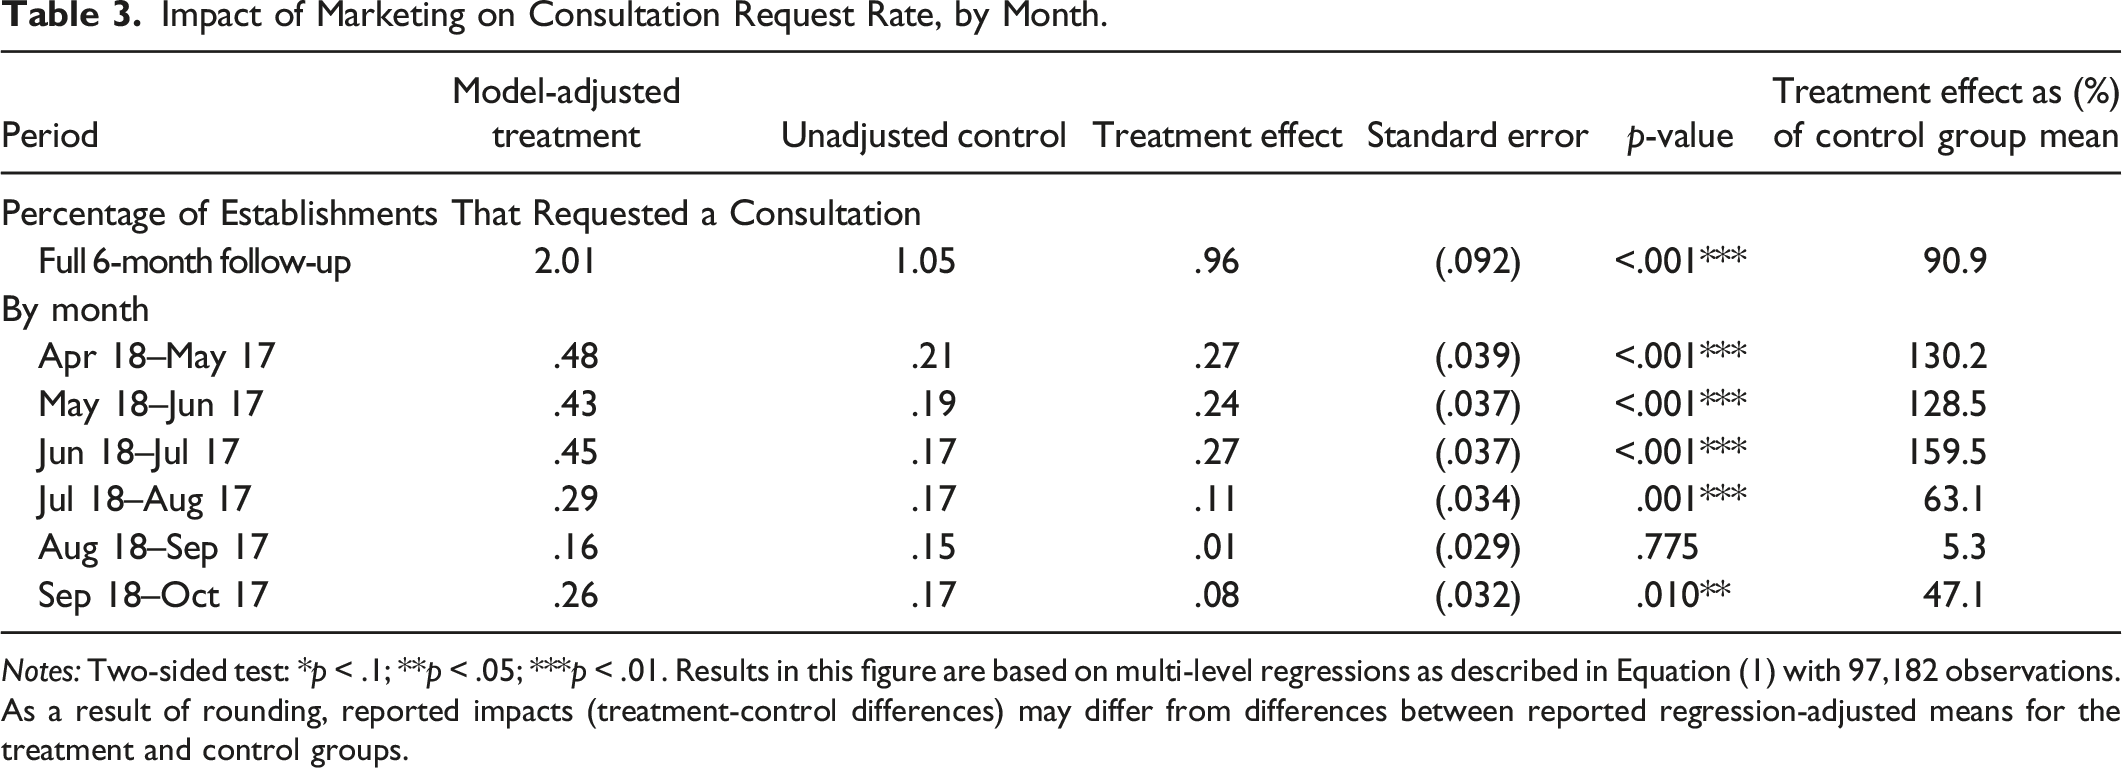
Notes: Two-sided test: *p < .1; **p < .05; ***p < .01. Results in this figure are based on multi-level regressions as described in Equation (1) with 97,182 observations. As a result of rounding, reported impacts (treatment-control differences) may differ from differences between reported regression-adjusted means for the treatment and control groups.
Subgroup Findings
Impact of Marketing on Six-Month Consultation Request Rate, by Subgroup.
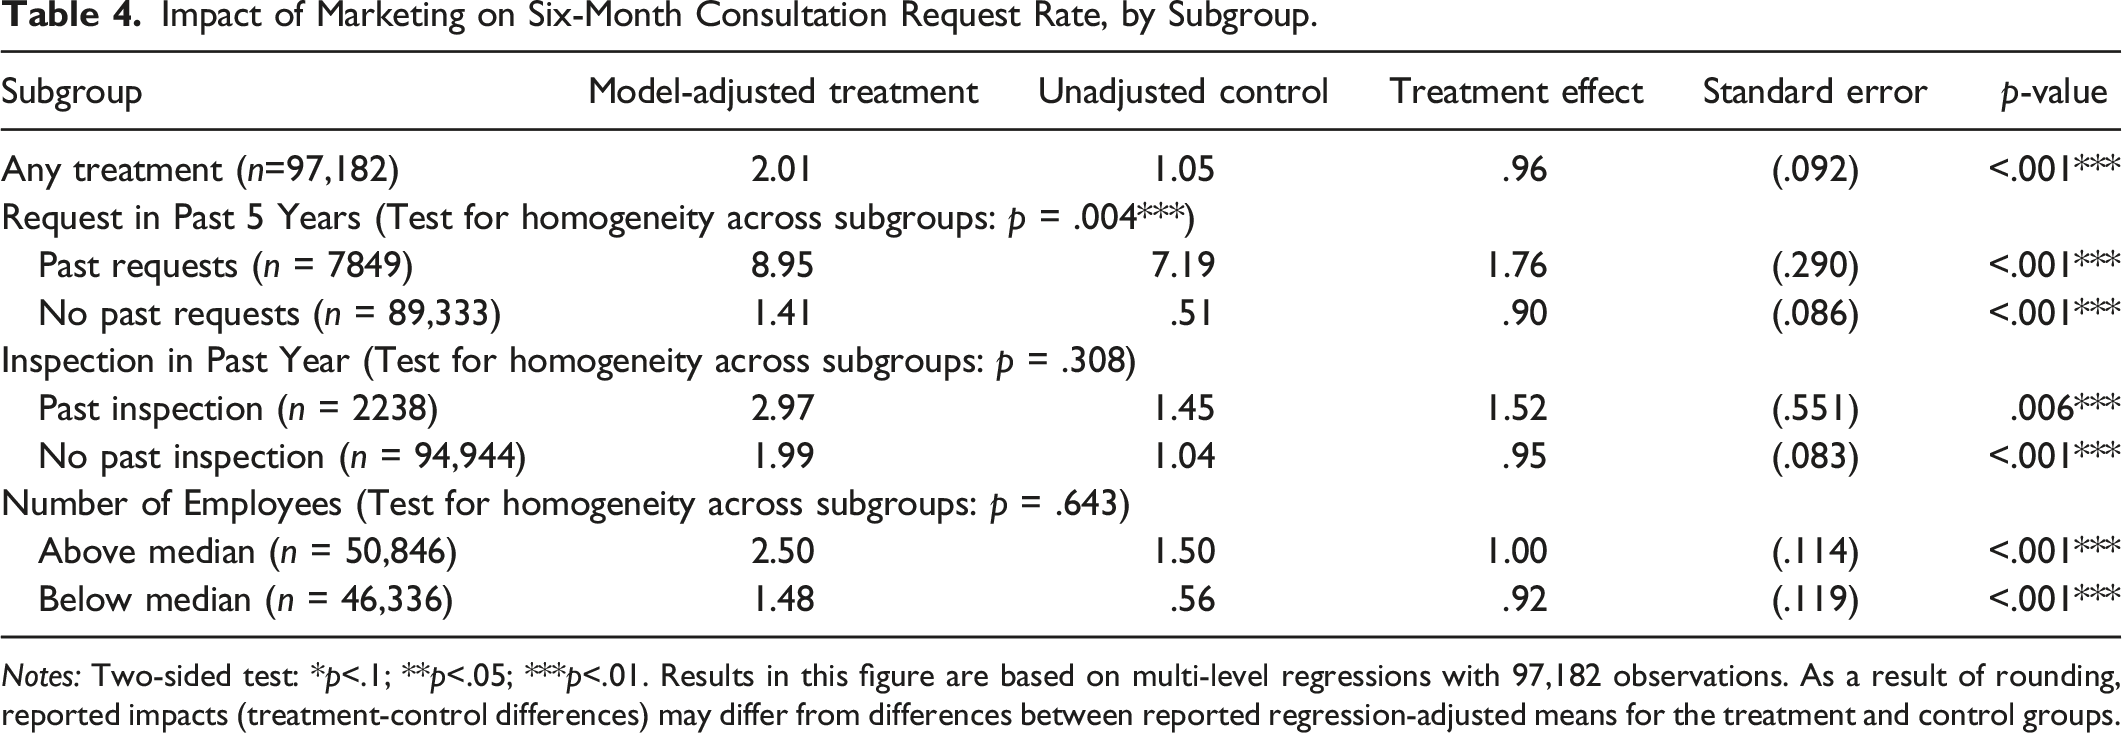
Notes: Two-sided test: *p<.1; **p<.05; ***p<.01. Results in this figure are based on multi-level regressions with 97,182 observations. As a result of rounding, reported impacts (treatment-control differences) may differ from differences between reported regression-adjusted means for the treatment and control groups.
In the absence of new marketing (i.e., in the control group), the request rate for experienced establishments (those that had requested a consultation in the 5 years before the study) was much higher, at 7.2%, than the request rate for inexperienced establishments (i.e., those that had never requested a consultation), at .5%. The impact of marketing was also larger for experienced establishments, as measured by the number of new requests per brochure mailed. For experienced establishments, marketing increased the request rate by 1.8% points, from 7.2% of establishments in the control group to 8.9% of establishments in the treatment group. In contrast, marketing increased the request rate by a smaller .9% points for inexperienced establishments, from .5% in the control group to 1.4% in the treatment group. The difference in these impacts was .9% points and statistically significant (p<.001); that is, marketing was approximately twice as effective for experienced establishments.
Nevertheless, these results demonstrate that marketing substantially expanded the pool of OSC customers. Although marketing was more successful at generating new consultation requests among experienced establishments per brochure mailed, the proportional impact was much larger among inexperienced establishments (a 176% increase) than among experienced establishments (a 24% increase).
Because the overwhelming share (92%) of the sample comprises inexperienced establishments, the bulk of requests for consultation induced by the mailing came from new customers. In total, 85% of marketing-driven requests were made by establishments that had not requested a consultation in the past 5 years. 15 A broadly targeted marketing effort therefore appears capable of substantially expanding the pool of OSC customers.
There were no statistically significant differences in impact across subgroups defined by inspection history or number of employees.
Discussion
The findings from this analysis are simple and striking: • • •
There are several possible interpretations of the finding that motivational appeals did not improve the response rate relative to an informational appeal. One possible explanation is that the motivational appeals were poorly crafted and therefore unappealing. However, the materials were designed by experts in behavioral marketing and eight different appeals were tested. Such an approach—marketing using behaviorally informed messages—has been found to be effective in other contexts. In many of these cases, it is difficult to draw conclusions about the effectiveness of the behavioral messages themselves (separate from the act of sending a standard message), because the trials did not distinguish between the behavioral and non-behavioral components of the intervention. Examples include Chojnacki et al. (2017), which sent reminder messages to employers encouraging them to respond to OSHA citations; Darling et al. (2017), which successfully used emails to encourage unemployment insurance claimants to schedule and attend reemployment and eligibility assessment sessions; and Amin et al. (2017), which successfully used emailed messages to encourage federal employees to contribute more of their earnings to a savings plan. However, Dechausay et al. (2015) tested whether behaviorally informed postcards and text messages could increase participation in an informational meeting about a program called the Paycheck Plus Demonstration, compared with a standard message. Their study, which used a factorial design, found a significant impact of the behavioral messages compared with standard messaging. This explanation therefore seems unlikely.
A second explanation is that letters and emails were insufficiently compelling for delivering those messages. Emotional appeals made through another, more compelling medium—such as in-person, radio, or television—could be more effective than information alone. However, mail and email have been standard media for behavioral marketing, so a finding of no incremental effect is not unimportant.
A third possible explanation is that business owners and managers may not be as susceptible to emotional responses as other individuals. Businesses—even small-to medium-sized ones—may have processes in place that (perhaps purposefully) limit the effect of emotions on decision-making in favor of rational cost–benefit analysis, such as requiring approval from a manager. That said, the view that businesses engage in more rational decision-making seems to be contradicted by the finding that marketing was more effective for establishments that had previously requested a consultation. Such establishments presumably already know the costs and benefits of the OSC program, so if they were purely rational then marketing should have no effect (much less a larger effect).
A fourth possible explanation is that the accompanying cover letter, which did not vary across treatment arms, mitigated the emotional/motivational impact of the new brochures. The cover letter’s text was brief and carefully designed to be purely informational. Nonetheless, the implicit message conveyed by the official-looking letter may have had a strong impact, either positive or negative, on business recipients’ attitudes about OSC that overwhelmed the brochures’ motivational content. Future studies should seek to avoid such commonalities across study arms.
It is more difficult to explain why the emails designed to remove hassle factors were ineffective. One potential reason is that many states’ websites are not yet equipped to accept online requests. As a result, making it easier for employers to get to the website may not meaningfully reduce the inconvenience of actually requesting a visit. The study team also heard anecdotes that some employers are hesitant to visit OSHA’s website for fear of being tracked—although it seems less plausible that this concern would be salient for employers trying to schedule a consultation. Finally, the substance of the emails was sent in an image format, which is blocked by some email applications unless the user chooses to manually download the images. This may have limited the effectiveness of the emails.
From a methodological perspective, this study incorporated at least two techniques that could be applied more broadly to multi-armed trials: the factorial design and the EB estimation strategy. Both methods have strengths and limitations.
Factorial Design
Because administrative data on the outcome were available for nearly all establishments in the United States, this study had very low data collection costs. However, there was a non-trivial per-participant cost of implementing the intervention; that is, printing and mailing brochures and sending emails. Combined with our desire to preserve a large sample of “untouched” establishments for a potential future study, this implied that the study should allocate as many establishments to the control group as possible. With a large number of research questions, efficient use of the treatment group was critical.
To simultaneously test hypotheses about several factors (messages, formats, and delivery modes), we utilized a (partial) factorial design in which each study participant was randomly assigned to each factor independent of every other factor. 16 Implementing this design was very complex, largely because it required printing and sending the correct brochure version and the correct email to each establishment, and then linking outcomes back to the correct study arm. It would have been much more difficult if these activities had not been done in-house by our research team. We can imagine many contexts in which such a design may not be possible. For example, in situations where participant recruitment and random assignment are implemented by on-site staff, it may not be feasible to train those staff to manage such a complex random assignment process, much less for the research team to monitor whether assignment has been done correctly. In environments such as schools where administrators value uniformity of program implementation, it may not be easy to convince program staff to keep track of so many treatment arms. Even if they were willing to try, the prevalence of crossovers (i.e., a unit receiving a treatment other than the one to which it was randomly assigned) may be unacceptably high. We therefore caution that implementing a factorial design may only be feasible in contexts where the research team has substantial control over both random assignment and program implementation.
The payoff is that when a factorial design is feasible to implement, it has large efficiency gains compared with other potential strategies. For example, the statistical power to test the impact of each of the three messages in this study, while simultaneously testing the impact of each format and the accompanying email, is the same as the statistical power of a multi-armed study with the same sample size that only tested the impact of messages and no other factors.
EB Estimation
In this study, we estimated impacts separately for each message, format and mode rather than for the “complete” marketing strategies defined by (message*format*mode). However, our client was interested in knowing the most likely effect of the “winning” marketing strategy if implemented nationwide. For that reason, we calculated BLUPs, which scale the impact using both the observed mean for a complete marketing strategy and the fitted model. The BLUP will typically be smaller (i.e., closer to the grand mean) than the model-based estimate.
We note that this situation is analogous to the problem of multiple comparisons that vexes any study testing a large number of hypotheses—a problem that we believe is under-appreciated by researchers conducting multi-armed trials. Multi-armed trials necessarily involve testing more than one hypothesis, even when there is only one outcome of interest. For example, a typical three-armed trial with two treatment groups (T1 and T2) and a control group (C) would usually test three hypotheses about program impact (T1 vs. C, T2 vs. C, and T1 vs. T2), even when researchers designate a single outcome of interest. Without statistical adjustments, the probability of an overall Type I error is therefore substantially inflated due to the possibility that sampling error has improved the measured outcome in the “winning” treatment arm. This problem would be especially acute in a study with many study arms—this study had 19 such study arms. The common solution of designating a single “confirmatory” hypothesis test is not possible in this situation unless the research team is willing to elevate the importance of one of the contrasts (e.g., T1 vs. C) over the others.
Our approach solved this problem by implicitly designating the “winning” treatment combination as confirmatory and then, in essence, removing sampling error from that estimate using the EB estimate of the sampling error. This strategy does not alter the study’s statistical conclusions, but it does provide a more reasonable estimate of the likely impact. However, this elegant solution is only possible in situations where there are many treatments, making it possible to estimate sampling error. We encourage researchers to explore other possibilities for mitigating the multiple comparisons problem in multi-armed trials with fewer treatment arms.
Supplemental Material
Supplemental Material - Using Behavioral Insights to Market a Workplace Safety Program: Evidence From a Multi-Armed Experiment
Supplemental Material for Using Behavioral Insights to Market a Workplace Safety Program: Evidence From a Multi-Armed Experiment by Randall Juras, Amy Gorman and Jacob Alex Klerman in Evaluation Review
Footnotes
Declaration of Conflicting Interests
The author(s) declared no potential conflicts of interest with respect to the research, authorship, and/or publication of this article.
Funding
The author(s) disclosed receipt of the following financial support for the research, authorship, and/or publication of this article: This work was supported by the U.S. Department of Labor (GS10F0086K).

Supplemental Material
Supplement material for this article is available online.
Notes
References
Supplementary Material
Please find the following supplemental material available below.
For Open Access articles published under a Creative Commons License, all supplemental material carries the same license as the article it is associated with.
For non-Open Access articles published, all supplemental material carries a non-exclusive license, and permission requests for re-use of supplemental material or any part of supplemental material shall be sent directly to the copyright owner as specified in the copyright notice associated with the article.
