
Abstract
Archaeologists working in the Eastern United States routinely employ shovel testing as a method for site discovery and delineation in areas of dense ground cover, and as a means of collecting information on the kinds and numbers of artifacts and features present at a site. This sampling strategy is employed in the context of Section 106 compliance, as well as in academic research. This paper presents findings on the relationship between shovel-testing strategies and the accuracy and usefulness of the models of archaeological occupations that result from the information collected during shovel testing. These results demonstrate that some common approaches to shovel testing lead to faulty models that fail to accurately represent important occupational variables, thus compromising our ability to make valid significance determinations.
Introduction
As part of the Section 106 compliance process, Phase I cultural resource surveys and Phase II testing employ various kinds of sampling strategies to identify and investigate cultural resources within an area of potential effect. The Secretary of the Interior’s Standards and Guidelines for Archeology and Historic Preservation identify an important goal of intensive survey as the documentation of “information on the appearance, significance, integrity and boundaries of each property sufficiently to permit an evaluation of its significance” (National Park Service, 1983). These efforts are undertaken for the ultimate purpose of assessing the significance of those resources in light of the National Register of Historic Places (NRHP) criteria for evaluation. Although criteria A, B, C, and D may all be relevant to the evaluation of archaeological sites, it is criterion D that is most often cited when arguing for the eligibility of archaeological occupations or sites. Criterion D refers to sites “that have yielded or may be likely to yield, information important in history or prehistory.” Unlike architectural resources, for example, much of what makes an archaeological site significant is buried within the soil and effectively hidden from the researcher. Only through the use of subsurface sampling methods can archaeologists working in regions of dense vegetation recover the information needed to determine whether a site is likely to yield information important to a region’s history or prehistory.
The following research has been designed to assess whether sampling strategies that employ shovel testing, an approach routinely employed during Phase I and II investigations, lead to the production of incomplete occupational models that preclude the accurate determination of site significance in the context of assessing the eligibility of archaeological properties for the NRHP. Results from three studies demonstrate that shovel testing on either a 10-m cruciform or grid pattern results in frequent mischaracterizations of site occupations in terms of their spatial, temporal, and formal attributes. These failures inevitably contribute to the construction of occupational models that are compromised in their ability to represent the occupation(s) present at some archaeological locus and that fail to characterize even basic occupational dimensions such as duration or function.
Sampling and significance in cultural resource management
The generation of high-quality research in cultural resource management (CRM) has demonstrated itself to be an enduring problem for the field and provides a constant challenge for its practitioners (King, 2005; Peacock and Rafferty, 2007; Willems and van den Dries, 2007). The fluid environment of shifting archaeological values and the continual generation of massive and variable quantities of data contribute to the challenges faced by CRM archaeologists and have ensured that the necessity of assigning significance to cultural resources will remain one of the field’s more elusive challenges (Altschul, 2005; Butler, 1987; Dunnell, 1982; Lynott, 1980; McManamon, 1990; Morton, 2014; Raab and Klinger, 1977, 1979; Sharrock and Grayson, 1979; Tainter, 1979). Despite the challenges presented by significance determination, however, the pursuit of significance has promoted a broader appreciation for what is important in prehistory or history. As Goodyear et al. (1978: 159) effectively summarized, this pursuit has contributed much to archaeology “by stimulating archaeologists to probe the resource base in new and explicit ways for all possible dimensions of significance.”
As compliance-driven survey during the past 50 years has led to the discovery of tens of thousands of archaeological sites, followed by more intensive investigations of a subset of these sites during Phase II and III investigations, CRM research has revealed the tremendous variation in material culture present in the archaeological record, how this variation is distributed through space and time, and, though less successfully, the many “dimensions of significance” represented within this variation. The expansive prehistoric occupational variation revealed by CRM-driven investigations has found its way into regional settlement-subsistence models where it has provided important corrections to models biased by decades of investigation into large, artifact-rich sites with prominent earthworks that ultimately represent the loci of specialized activities that were part of a settlement pattern unique to a particular place and time (e.g., Bareis and Porter, 1984; Jenkins and Krause, 1986; O’Brien et al., 1982; Rafferty and Peacock, 2008; Wood et al., 1986).
Within the three phases of cultural resources investigation, Phase I is generally characterized as the phase of site identification, whereas Phase II represents efforts to determine the significance of sites whose eligibility for the NRHP could not be determined during Phase I. However, these common phase designations provide misleading characterizations of how and when the determination of site significance most often occurs. Although Phase II is treated as the phase during which significance is determined, the reality is that most significance determinations are made during Phase I, when most of the dozens or even hundreds of archaeological sites that may be identified during a particular survey are written off as insignificant and thus not eligible for the NRHP and unworthy of further study. Only a relatively small fraction of the thousands of sites identified by archaeologists working in CRM each year reach Phase II testing, as most determinations are made based on site information gleaned during Phase I. Since the fate of our nation’s cultural resources is being primarily determined by Phase I investigations, it is imperative that greater attention be paid to how we engage the archaeological record during this first phase, and whether the methods we employ at this stage enable us to successfully identify the dimensions of site significance that purportedly are used to advance sites into the subsequent phases of more intensive investigation.
Archaeological survey in the Eastern woodlands
The following study provides an assessment of methods commonly employed during Phase I by investigators working in the Eastern Woodlands. As a region predominately characterized by forest or pasture environments where ground surface visibility is low, it presents a particular challenge for archaeologists attempting to identify the presence of cultural resources. Much of the early literature on archaeological survey emphasized the role of “fieldwalking” (Banning, 2002) because of its focus on regions characterized by high ground visibility such as the Middle East (Adams, 1965; Adams and Nissen, 1972), the American Southwest (Gumerman and Euler, 1976; Plog et al., 1978), or within alluvial regions such as the Mississippi River Valley (Phillips et al., 1951; Phillips, 1970), where annual agricultural plowing continually provided for exposed ground surfaces.
Confronted with the task of identifying previously unrecorded archaeological sites within heavily vegetated regions, archaeologists in eastern North America have adapted sampling strategies devised for regions of high ground visibility to accommodate surveying in forest and pasture environments. Although methods such as fieldwalking, in addition to archival research, remote sensing, and predictive modeling, can be employed in the identification of archaeological site locations, shovel testing continues to serve as the principal method of site identification and investigation in Phase I cultural resources survey. Although the “site” concept is problematic (Dunnell, 1971, 1992), due to its ubiquity in archaeology, and especially its role as a management unit within CRM, the concept is used here where it is meant to refer to an archaeological locus that comprises one or more archaeological occupations. A definition of “occupation” is provided below.
Archaeologists have long recognized the need for assessing the reliability of shovel testing as a method for site discovery and have examined how the variables of site size, artifact density, survey intensity, and screening versus non-screening of shovel test (ST) fill affects the success of artifact recovery and site detection (Kintigh, 1988; Krakker et al., 1983; Lightfoot, 1986; Lynch, 1980, 1981; McManamon, 1984; Nance, 1981; Nance and Ball, 1986, 1989; Peacock, 1996; Plog et al., 1978; Schiffer et al., 1978; Shott, 1985, 1987, 1989; Stone, 1981; Wobst, 1983). These kinds of studies provide important insights into the effectiveness of shovel testing, but more information is needed, as site discovery represents only one of several goals that must be accomplished to ensure a successful Phase I survey, which does not conclude once all archaeological sites within an area of potential effect have been located.
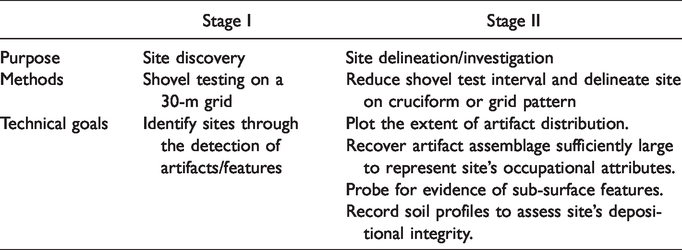
Discovering a site and determining its location are the first steps of Phase I fieldwork, but this stage is immediately followed by more intensive site investigation once sites are discovered (Table 1). This is often accomplished by increasing shovel testing intensity through the reduction of shovel-test intervals. The goals of this second stage of Phase I fieldwork are to delineate site boundaries, recover an assemblage of artifacts that is sufficiently large to represent the characteristics of a site’s occupation(s) (e.g., function, duration, intensity), probe for evidence of sub-surface features, and assess the depositional integrity of the site. Unlike sampling strategies used to discover site locations, strategies used in the investigation of sites during Phase I survey have received considerably less critical attention. This represents an important omission, as the results of Phase I site investigation determine whether a site is preserved and subjected to further study or, in some instances, whether it will be destroyed. Of equal importance is the fact that for sites that have been found not eligible for inclusion on the NRHP after Phase I investigations, the results of these investigations likely represent all we will ever know about these sites.
The purpose, methods, and technical goals for the two stages of shovel-test survey.
Sampling in phase I investigations
One of the more important goals of archaeological fieldwork is “to discover the kinds and the frequency of target populations of data that exist within a given research area” (Mueller, 1975: 34). Central to this endeavor is the technique of sampling (Binford, 1964; Plog, 1976; Redman, 1974; Vescelius, 1960), which is generally defined as “a tool to aid the archaeologist in selecting units of investigation and in generalizing to larger entities” (Mueller, 1975: ix). Whether explicitly acknowledged or not, sampling has long served as a central pillar of archaeological investigations, and the importance of developing a rigorous sampling design tailored to the needs of particular research questions is now widely recognized by archaeologists; however, assessments of how particular sampling designs may influence the patterns revealed from the sample data are lacking (but see Hole, 1980; Plog, 1976; Redman, 1974).
Schiffer et al.’s (1978: 2) definition of sampling as “the application of a set of techniques for varying the discovery probabilities of archaeological materials in order to estimate parameters of the regional archaeological record” emphasizes the central role probability theory has played in archaeological sampling. The development and assessment of sampling strategies in archaeology has relied heavily on simplistic probability models drawn from classical probability theory (e.g., Cochran, 1963), which have focused on the unbiased estimation of simple parameters such as means and variances. Such measures alone, however, are often insufficient to answer many archaeological research questions or to assess the significance of archaeological resources in light of the National Register criteria for evaluation. It has long been recognized that probabilistic sampling techniques are inadequate for accomplishing a number of important goals in archaeological investigation, such as locating rare elements of the archaeological record, or those organized in clustered distributions, or revealing continuous spatial patterns in artifact distributions (O’Neil, 1993; Redman, 1987; Schiffer et al., 1978). When considering the requirements of site investigation during Phase I or II, one could argue that the accomplishment of these three goals are as critical as any to the process of significance determination, no matter what theoretical stance may be driving any particular significance assessment.
Locating rare elements
Archaeological values are evident in the kinds of research questions we ask and the frequency with which we ask them. Those questions that deal with the origins of some novel cultural behavior or event in a particular region tend to represent some of archaeology’s most commonly asked questions. Consider the value we attribute to questions such as when ceramic technology, agriculture, or sedentariness first appeared in a region or when a region or continent was first populated. To answer such questions effectively, we must be able to identify rare elements of the archaeological record, given that the first appearance of some cultural feature is by definition a low-frequency phenomenon. Consideration of the efficacy of our sampling strategies for identifying such rare elements should thus be of primary concern.
Locating clustered distributions
Material culture in archaeological contexts is not randomly distributed but tends to cluster within areas where human behaviors were focused and sustained for extended periods. The potential of some sampling strategies to fail in locating such clusters of artifacts and features is an important problem. Considering that an important goal of Phase I survey is to identify the locations of archaeological sites and assess their internal structure (i.e., clustered distributions of artifacts and features), the importance of assessing methods used during Phase I to accomplish these tasks becomes evident.
Revealing spatial patterns
An essential component of any archaeological investigation includes characterizing the spatial distributions of cultural materials that comprise some archaeological locus. Archaeologists (Dunnell and Dancey, 1983; Foley, 1981a, 1981b; Thomas, 1975) recognize that the archaeological record is continuous across geographic space, varying only in the density of its occurrence, and it is essentially the spatial pattern of cultural materials that determines the physical dimensions of archaeological sites. Identifying the spatial pattern of cultural materials is important for a number of reasons, including the need to identify the full spatial extent of the “population of interest,” as represented by the distribution of cultural materials under investigation. Additionally, there is the practical need of accurately defining an archaeological site’s boundary so that cultural resource managers can ensure that future ground-disturbing activities avoid the location. Sampling strategies should therefore be assessed in terms of their success in revealing such patterns, or whether the act of sampling the record introduces discontinuities that misrepresent the site’s spatial dimensions.
Sample size and measures of richness
In addition to the importance attributed to identifying rare elements in the archaeological record, measures of artifact and feature richness are also of paramount importance in the context of significance determinations. Here richness is simply defined as the number of artifact or feature classes found in an assemblage. In general, one could argue that there is no measure more closely associated with the determination of site significance than the richness of artifact and feature types identified during Phase I and II investigations. Consider the archaeological phenomenon commonly referred to as a “lithic scatter,” which represents one of the most commonly disregarded elements of the archaeological record and is routinely assessed as ineligible for inclusion on the NRHP (Cain, 2012). The disregard of such resources is strongly tied to the fact that such a phenomenon represents the lowest order of richness, as the designation implies the presence of only one type of artifact, lithic debitage. Conversely, sites from which dozens of different kinds of artifacts and features are identified are almost universally agreed upon as sites of great significance, and it is not uncommon to see such sites recommended as eligible for the NRHP during Phase I. A number of problems result from the use of richness in this manner, not the least of which is the failure to appreciate that differences in site characteristics, such as artifact type richness, often derive from the different roles that certain locales played within regional settlement patterns, and that the disregard of any aspect of those patterns prevents us from accurately modeling settlement organization (Alvey, 2005; Cain, 2012; Manning and Peacock, 2008; Morton, 2014; Peacock and Manning, 2008; Peacock et al., 2008a, 2008b).
An additional problem, and one that is especially pertinent to the current study, is the degree to which artifact or feature richness varies as a function of sample size (Jones et al., 1983, Kintigh, 1984, 1989; Rhode, 1988; Shott, 1987, 2010). While much fault can be found in the ways that measures of richness are often employed in significance determinations, such measures are of great importance and utility. For these measures to be profitably used, however, we must consider whether the richness revealed within any particular assemblage reflects the reality of the occupation(s) or is simply a product of undersampling.
Assessing the construction of occupational models used in CRM
Producing answers to archaeological questions, especially those related to significance determinations, require measuring relevant variables of archaeological occupations such as their function, intensity, and duration (both relative and absolute). Following Dunnell’s (1971: 151) definition, an occupation is treated here as a “spatial cluster of discrete objects which can reasonably be assumed to be the product of a single group of people at a particular locality deposited over a period of continuous residence comparable to other such units in the same study.” An important point is that these units are based on historical connections between deposition events and not solely on spatial proximity (Dunnell, 1992). However, factors such as preservation and sampling biases, and the fact that in most studies only a small portion of a site is excavated, make it improbable that the entire “cluster of discrete objects” associated with an occupation will be recovered. Thus, only a sample of the occupation contributes to the construction of occupational models, which represent our perceptions of the archaeological occupation based on the available evidence. Despite this incompleteness, however, occupational models operate as central analytical units in archaeological studies as they serve to represent the spatial, temporal, and formal dimensions of some archaeological locus.
Shovel testing is routinely employed in areas of dense ground vegetation as a method for site discovery and delineation, and as a means of collecting information on the kinds and numbers of artifacts and features present at a site; however, the details of how shovel testing is employed for these purposes varies from state to state. For example, state guidelines vary in their requirements for spacing between STs and transects, the horizontal and vertical dimensions of STs, or how shovel testing should vary for the purposes of site discovery versus site investigation/delineation. Shovel-testing strategies as developed in state guidelines are critically important in cultural resource management as they affect not only success in the discovery of previously uninvestigated resources, but ultimately determine our perceptions of sites and their attributes, and our resulting determinations of significance. Despite this importance, little research has focused on the processes involved in constructing occupational models during Phase I investigations or assessments of whether the resulting models effectively serve the purposes for which they were constructed.
The current study provides an assessment of standard practice in Mississippi for delineating and investigating sites during Phase I survey as set forth in the Mississippi State Historic Preservation Office’s (SHPO) Guidelines for Archaeological Investigations and Reports in Mississippi (Sims, 2001). This study assesses whether methods commonly employed during Phase I investigations are inadequate in the sense that they promote undersampling –– a problem that could lead to faulty occupational models that poorly represent the occupation(s) under investigation. The Mississippi guidelines state that “When a positive shovel test is excavated, the testing interval should be reduced to 5 to 10 m with shovel testing continuing in a cruciform or grid pattern until two consecutive negative tests are encountered” (Sims, 2001: 13). Positive or negative shovel tests refer to those from which artifacts were or were not recovered, respectively.
Although this guideline allows for shovel testing on either a cruciform or grid pattern, consultants predominately adopt the cruciform pattern, as this strategy requires considerably less time than shovel testing on a grid pattern. This is an important point considering that consultants must operate within a competitive-bid environment, which rewards strategies that reduce costs and make organizations more competitive in the marketplace. Sampling strategies at the Phase I level should accurately delineate a site’s artifact distributions, assess for the presence of subsurface features, and lead to the recovery of an artifact assemblage that effectively represents the occupation(s) present at a site. Evaluating the success of various strategies for accomplishing these tasks is the ultimate goal of this paper.
Study area
All of the sites included in this investigation are located in Mississippi within the state’s central hill-belt regions (Figure 1), and all appear to represent non-mound habitation sites. The sites from Chickasaw (designated 22CSXXX), Franklin (designated 22FRXXX), Jefferson (designated 22JDXXX), and Smith counties (designated 22SMXXX) were recorded in 2018 during cultural resources survey on national forests in Mississippi conducted by researchers from the Cobb Institute of Archaeology, Mississippi State University, under contract with the U.S. Forest Service. All remaining sites were recorded during the 2014 and 2016 survey field schools sponsored by the Department of Anthropology and Middle Eastern Cultures, Mississippi State University, which were taught in the central and upper portions of the Big Black River valley.
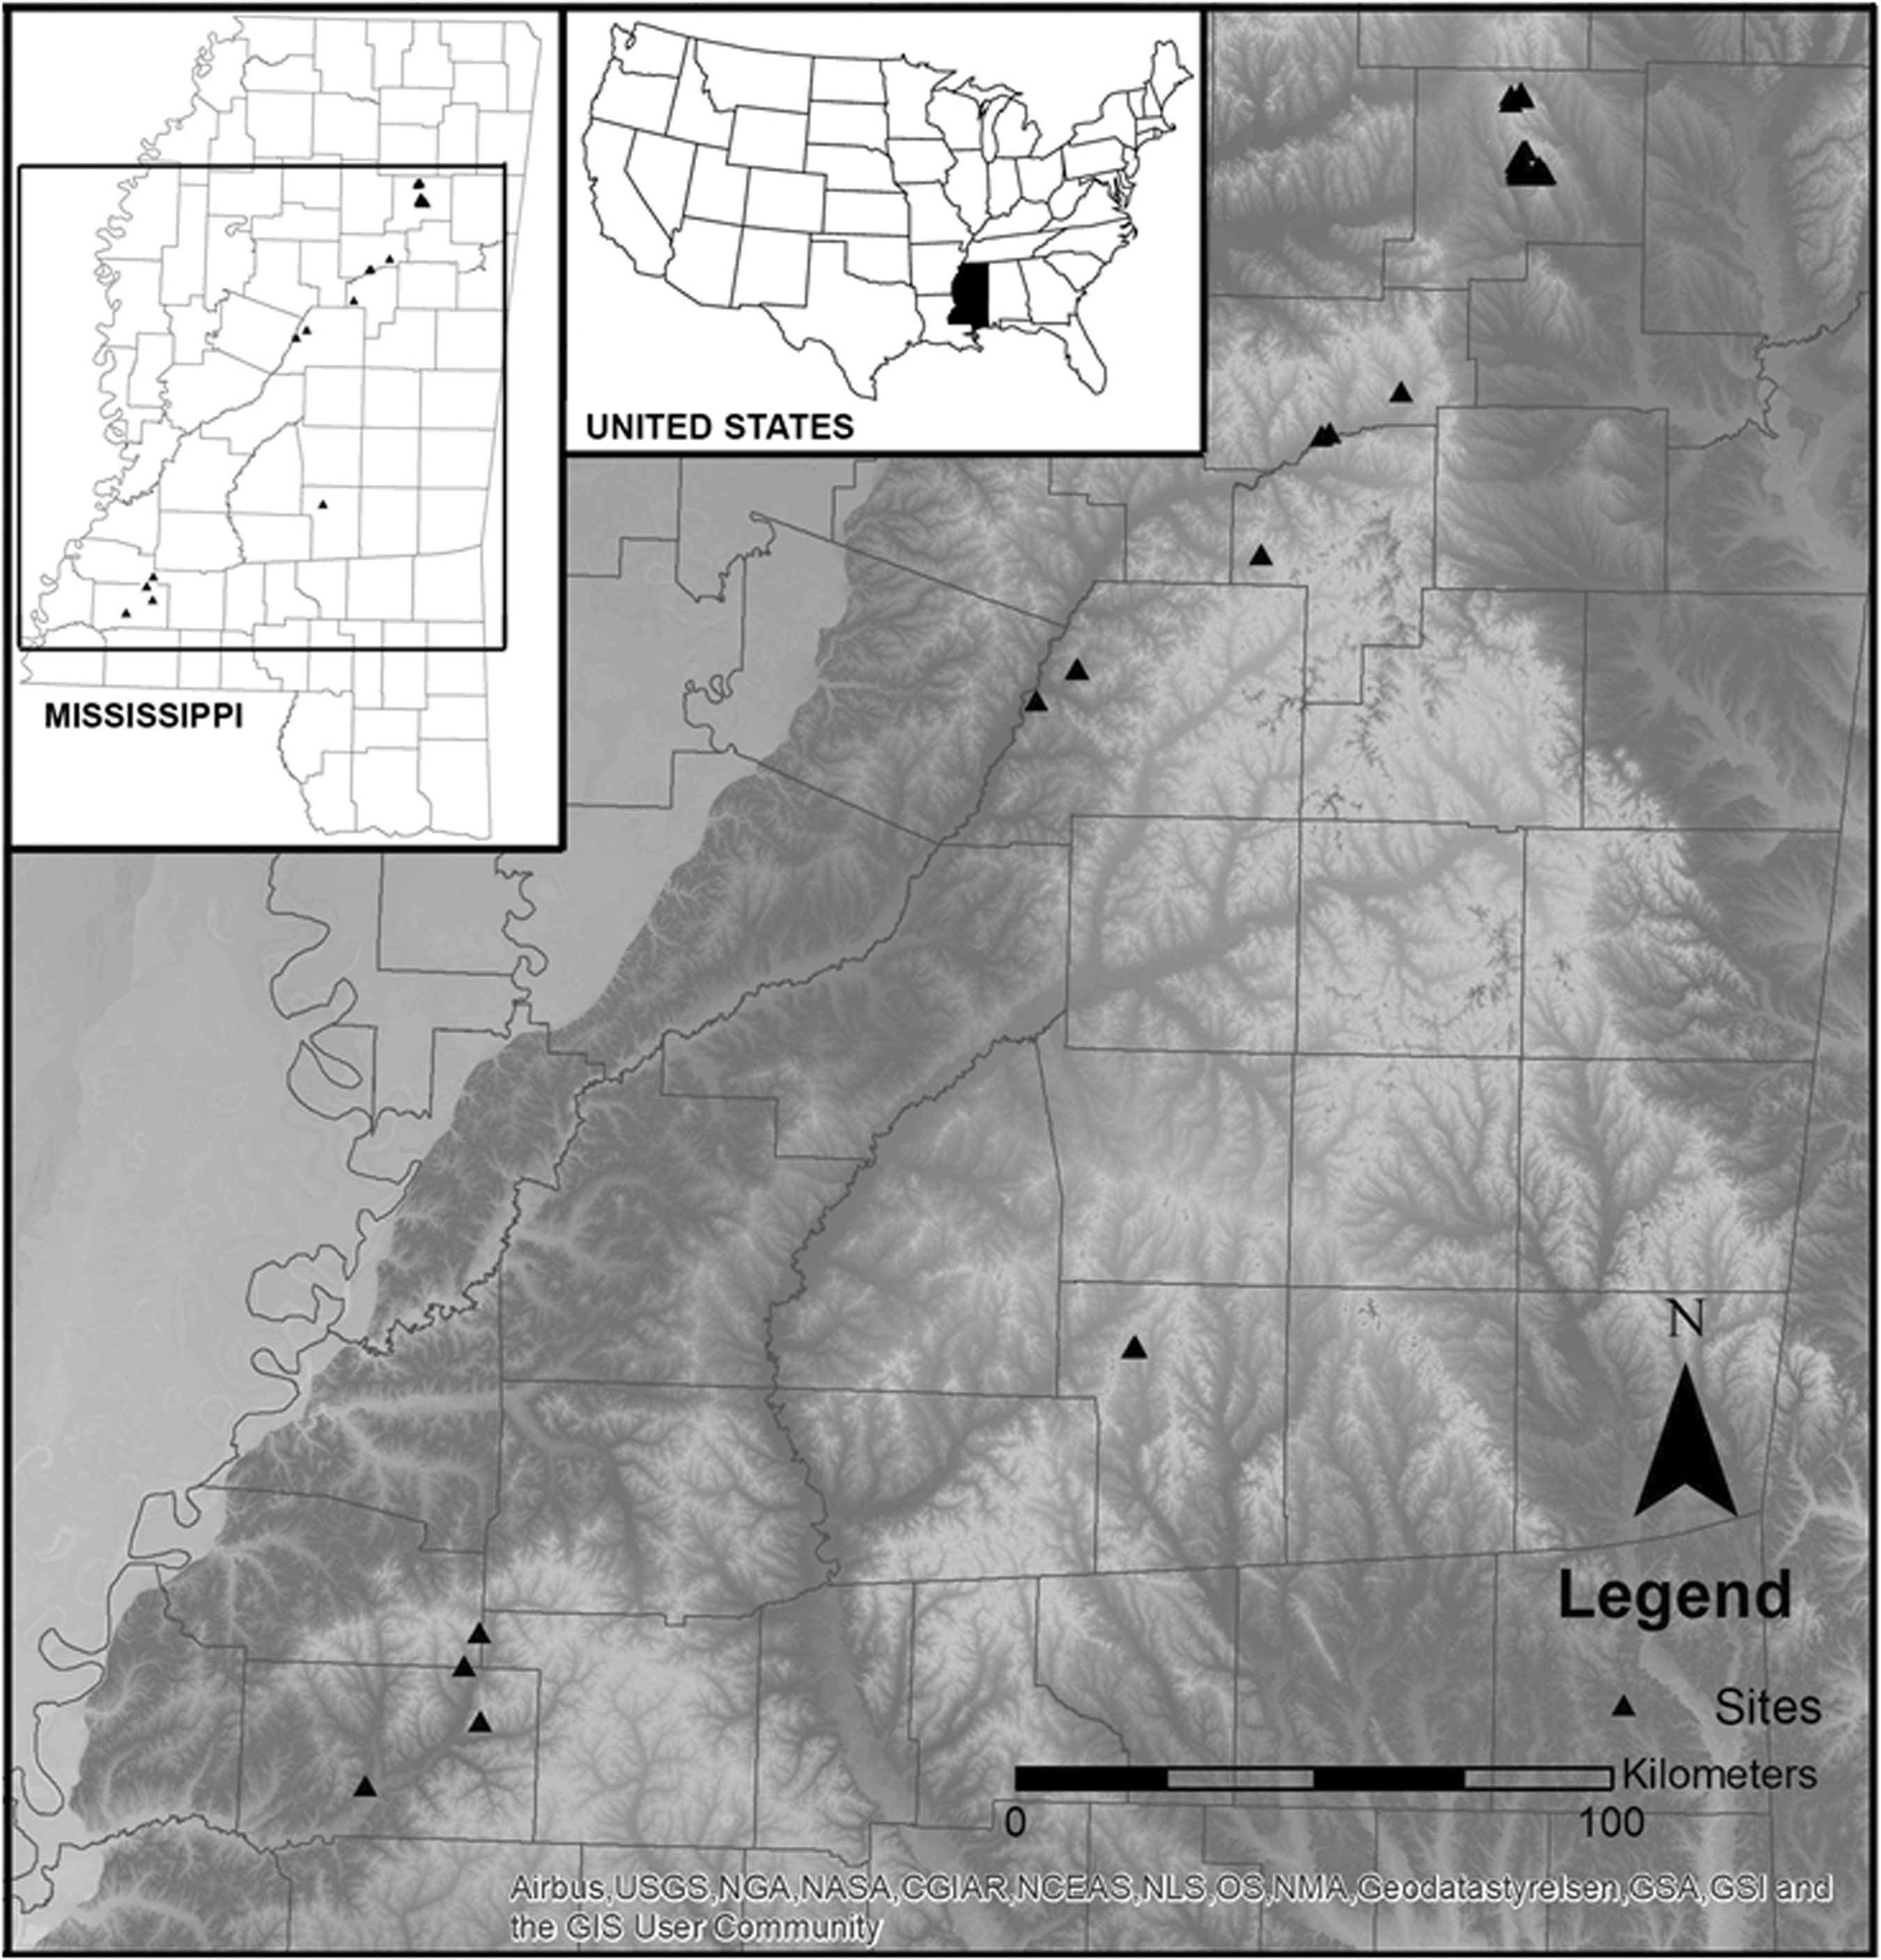
Map showing the locations of 44 study sites.
The sites located in the national forests were chosen for use in the current study because of a recent shift in required field methods, where site delineation on a cruciform pattern has been abandoned and delineation on 5-m or 10-m grid is now required. This provided the opportunity to compare the results of site delineation on a 5-m or 10-m grid with the results that would have come from the use of a cruciform pattern. The sites from the Big Black River valley were investigated for the explicit purpose of employing multiple sampling strategies to assess the differences that resulted in the effects on measures such as site size or artifact type richness and were investigated as they were encountered by the field schools.
The occupations represented among these 44 sites date predominately to the Woodland period (500 BC–AD 1000), although a few sites contain occupations from the preceding and following periods. Settlement in the region during the Woodland period is generally characterized by a dispersed settlement pattern where habitation sites occupied a variety of different elevational environments (Jackson et al., 2002; Johnson, 1988; Peacock, 1997; Rafferty, 1994, 2002; Rafferty and Starr, 1986). This is in contrast to the following Mississippian period, when settlements became more nucleated in lower elevational environments, such as first terraces along the major stream or river bottoms. Sites associated with the Woodland period often represent relatively small, short-duration occupations with relatively light artifact/feature density when compared to later Mississippian occupations. As a result of these attributes, sites such as these are at the greatest risk of being mischaracterized by undersampling and disregarded in the context of significance assessments.
Materials and methods
Because of a desire for this study to inform on how shovel-testing strategies affect site delineation and investigation during Phase I survey, consideration is given only to the results of shovel testing, with no consideration given to the presence of surface-collected artifacts. As presented below, comparative analyses were conducted to monitor the effects of changes in ST parameters in three dimensions: 1) distance between STs; 2) size of STs; and 3) placement of STs (i.e., cruciform pattern vs. grid pattern) (Figure 2). In all instances, STs were excavated to the depth that clay subsoil was encountered, and all ST fill was screened through 1/4” wire-mesh hardware cloth for the recovery of artifacts. In most instances, STs were 30 cm in diameter, although this was varied in one of the sampling stages discussed below, where 50 x 50 cm shovel test pits (STPs) were employed. Transects that were established on either cruciform or grid patterns were oriented according to the cardinal directions or according to the orientation of the landform if it was not oriented along a north-south or east-west axis. Testing on a cruciform pattern involved using the original positive ST as the point from which all subsequent tests were established, whereas testing on a grid differed in that STs were dug in the cardinal directions or landform direction from all positive STs, rather than just the original positive ST. The extent of artifact distributions (site size) for both cruciform and grid patterns was determined by excavating STs along all transects until two consecutive negative tests were excavated in each direction or until the edge of a landform was reached, which is defined as any change in the slope of the ground surface that exceeded 15%.
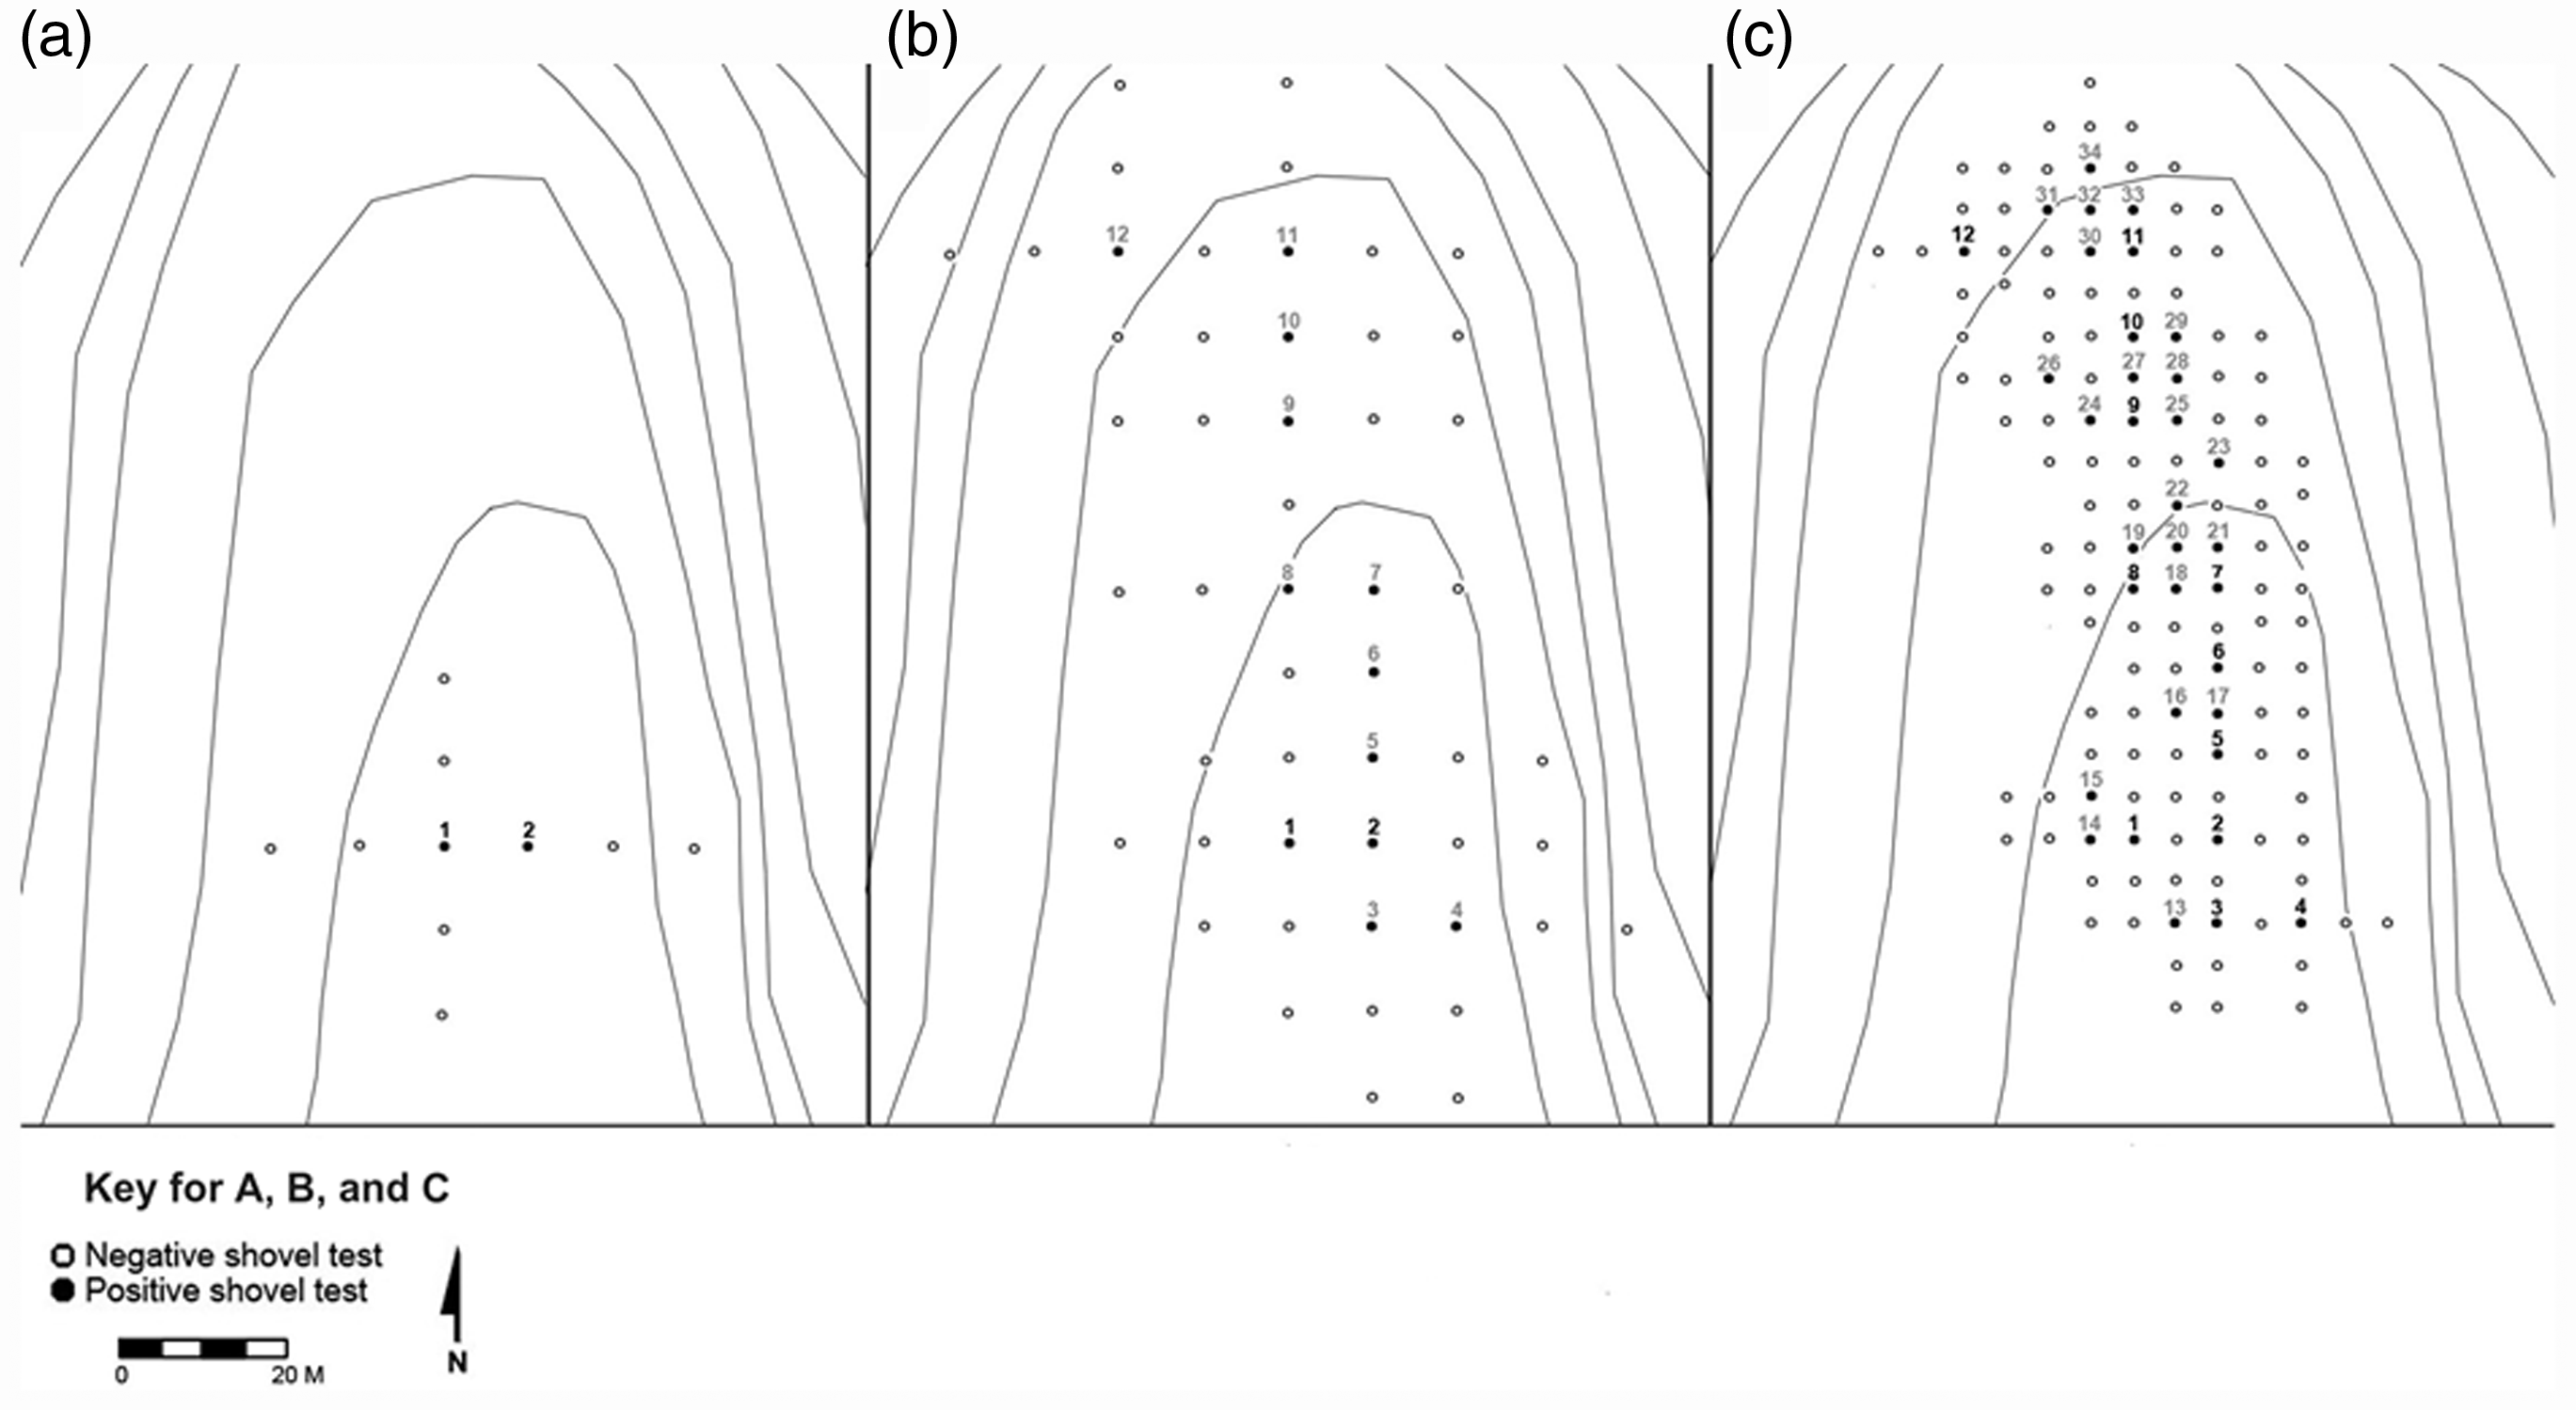
Contour maps showing the excavation of shovel tests on a 10-m cruciform (a), 10-m grid (b), and 5-m grid (c) at site 22SM1436 to illustrate how shovel test patterning differs between each strategy. Gray numbers represent positive shovel tests that resulted from a change in shovel test patterning from the previous stage.
Three studies were undertaken to assess how changes in sampling parameters affected the variables of site size, artifact count, artifact-type richness, occupational duration, and occupational function for 44 sites. The first analysis involved the study of 30 sites to assess how the delineation of sites on a cruciform (with 10-m spacing between STs) versus a 10-m grid pattern affected the site and occupational variables listed above. The second analysis involved the study of 10 sites where sampling was undertaken on cruciform, 10-m grid, and 5-m grid patterns at all 10 sites. The third and final analysis involved the investigation of four sites where not only the pattern of shovel testing, but also the size of STs, varied during the three stages of sampling: 1) Stage I strategy employed the excavation of 30-cm diameter STs on a cruciform pattern with 10-m spacing between each test; 2) Stage II strategy employed shovel testing on a grid pattern with 10-m spacing between all STs and transects (as with Stage I, all STs were 30 cm in diameter); 3) like Stage II, Stage III employed shovel testing on a 10-m grid, however, STPs 50 x 50 cm in size were excavated instead of 30-cm-diameter STs. During Stage III, STPs were placed at the locations of all positive and negative STs established during Stage I and II. Thus, the excavation of STPs involved further excavating the area surrounding the 30-cm STs until a 50 x 50 cm area had been excavated. This also means that, in order to tabulate the numbers of artifacts recovered in the STPs during Stage III, artifact numbers recovered during Stage I and II must be included in this count.
Site size
Estimates of site size were calculated by multiplying the distance between the northernmost and southernmost positive STs by the distance between the easternmost and westernmost positive STs.
Artifact count
Artifact counts represent the total sum of artifacts recovered by shovel testing for each phase of sampling. This includes all materials determined to have been manufactured or modified by humans.
Artifact type richness
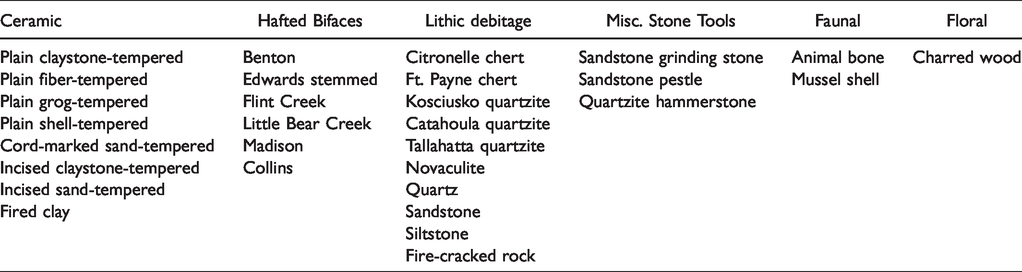
Analysis of artifact samples recovered during shovel testing was meant to identify differences in artifact-type richness, as these differences were used to determine whether the status of occupational function or duration at any given site varied along with changes in sampling parameters. Whereas archaeologists routinely employ numerous criteria for discriminating among different artifact types, the purpose of the analysis reported here was to classify artifacts in such a way that the resulting types would be useful in assessing occupational duration and function for the 44 sites investigated. Table 2 provides a list of all 30 artifact types defined for the assemblages recovered from the 44 study sites.
All artifact types defined within the assemblages recovered by shovel testing.
The assessment of duration was accomplished by sorting artifacts according to their chronological usefulness. Applying this criterion could therefore result in instances where objects traditionally considered to be the same kind of artifact (e.g., hafted bifaces) were treated as different artifact types because they were diagnostic of different time periods. For example, a hypothetical artifact assemblage recovered during the first stage of site sampling might be attributed to the Middle Woodland period based on the kinds of chronologically diagnostic artifacts that were recovered, but after additional phases of sampling, a projectile point dating to the Early Archaic period might be recovered. In this instance, occupational duration was affected by the recognition of a new occupation as the result of the recovery of a new nonsequential artifact type that was diagnostic of a different period. Duration could also be affected, however, by the recovery of new, sequent artifact types. In these instances, the new artifact type(s) would not suggest the presence of multiple occupations but would expand the temporal duration of a single occupation.
Similarly, a traditional artifact type such as a hafted biface could be separated into distinct functional types such as spear point, knife, or scraper. It is also important to note the way lithic debitage was treated by this study in terms of its ability to inform on occupational function. While consideration was not given to debitage in terms of its classification within lithic reduction stages, which could inform on differences of occupational function, differences in exotic vs. local raw material was considered when recording the different “types” of lithic debitage that were present in any given assemblage, as the presence or absence of non-local raw materials informs on how that site functioned within regional exchange networks.
Results
Study 1 (10-m cruciform vs. 10-m grid)
Results demonstrate that important changes are seen among the measures of site size, artifact count, artifact type richness, and in the effects on occupational duration and function when comparing the differences between sampling on a 10-m cruciform or 10-m grid pattern (Figure 3; Tables 3 and 4). With the shift from sampling on a cruciform to a grid, an increase in site size was seen among 24 of the 30 sites (80%), with increases ranging from 0–1200% and an average increase in size of 208% per site. An increase in artifact count was also seen among 26 of the 30 site assemblages (87%), with increases ranging from 0–500% and an average increase of 107% per assemblage. The data also demonstrate that the important measure of artifact type richness was increased in 15 of the 30 assemblages (50%), with increases ranging from 0–85% and an average increase of 29% per assemblage. Changes in the numbers of artifact types had important effects on the occupational duration and function attributed to the study sites. At least one of these variables was affected among 13 of the 30 sites (43%). This includes changes in occupational duration among six sites (20%) and changes in occupational function among 11 sites (37%).
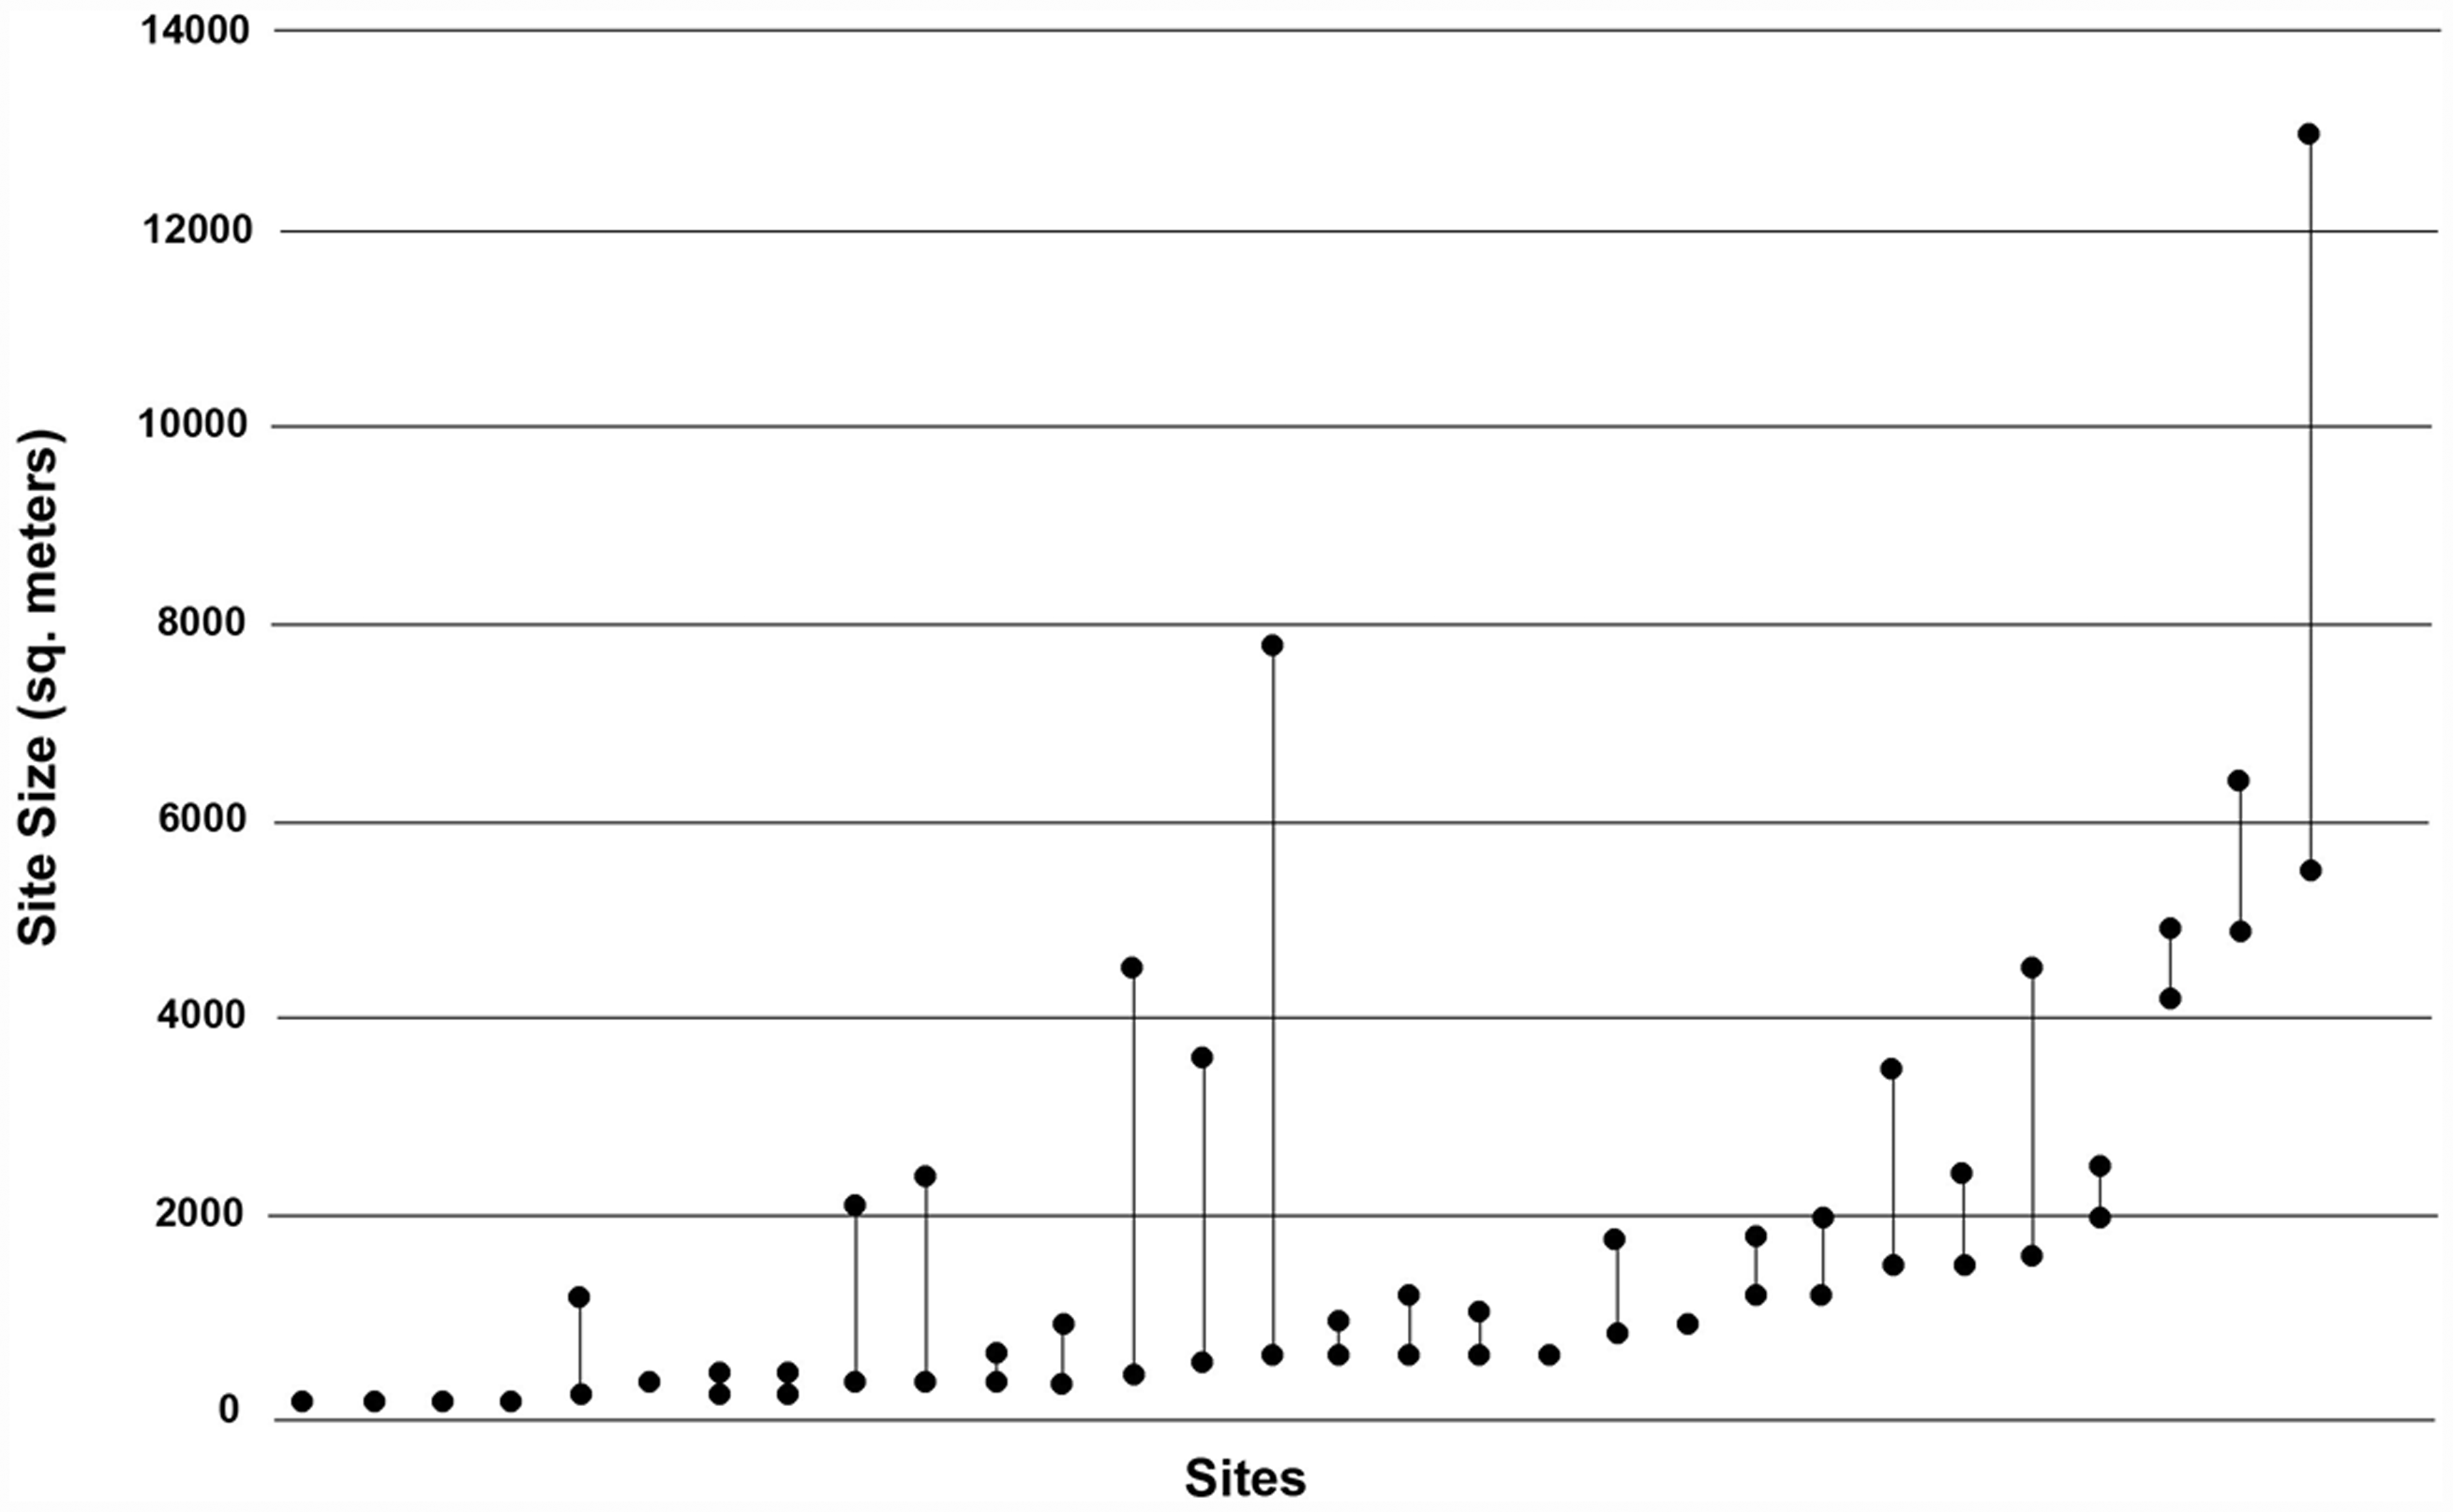
Graph showing changes in site size when comparing shovel testing on a 10-m cruciform (lower black dot) and 10-m grid (upper black dot) among 30 sites from study 1. Sites represented by single dot experienced no change.
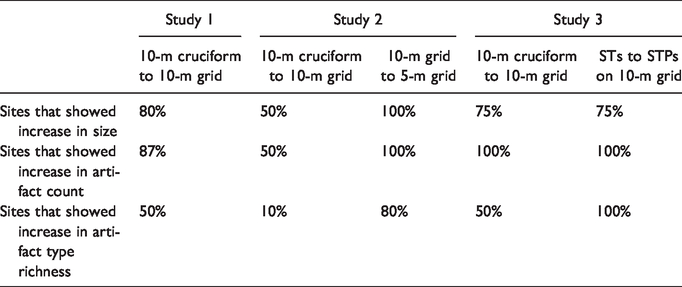
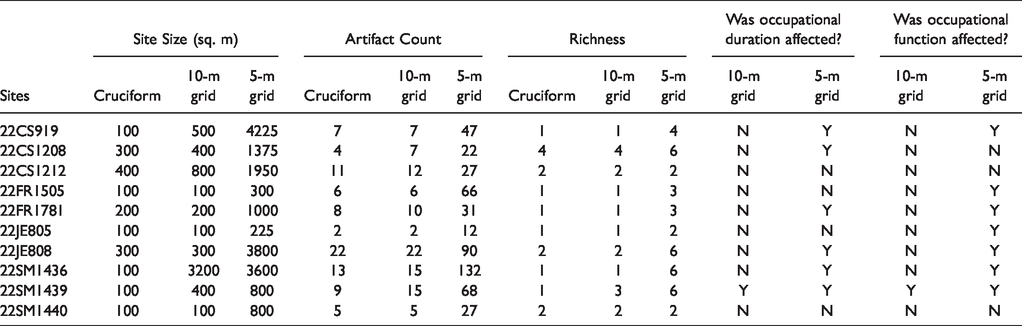
Site data showing changes in site and occupational variables for cruciform and 10-m grid sampling strategies.
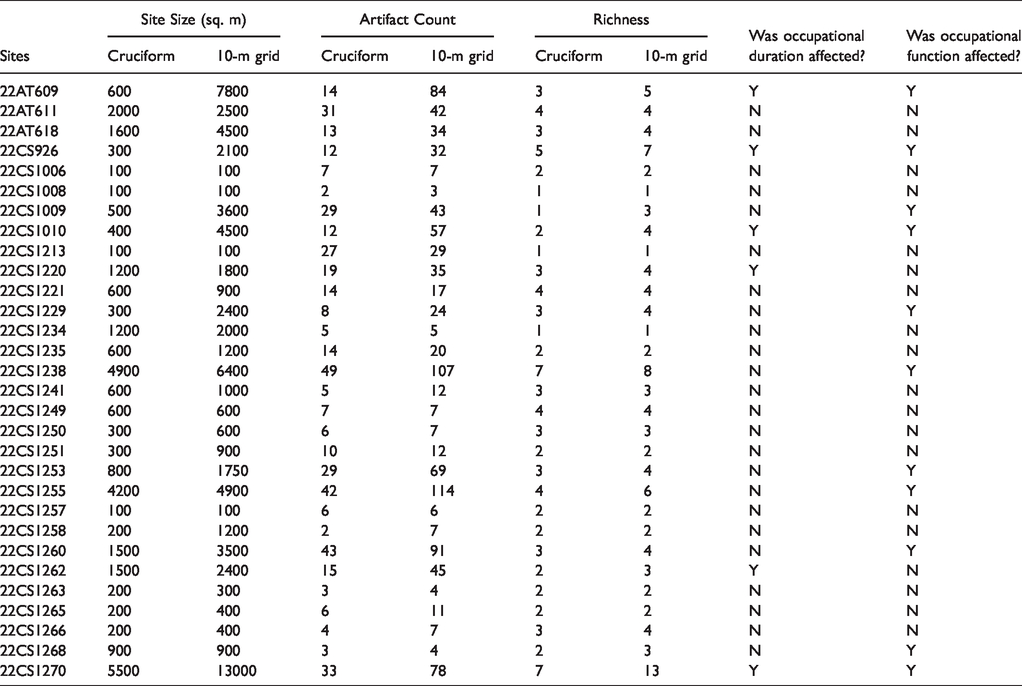
Summary table showing percent of sites that saw increases in site size, artifact count, and artifact type richness among the three studies.
Study 2 (10-m cruciform vs. 10-m grid vs. 5-m grid)
The results of Study 2 provide even more dramatic evidence for how changes in sampling parameters can affect inferences of occupational or site attributes (Figure 4, Tables 4 and 5). With the shift from sampling on a cruciform to a 10-m grid, an increase in site size was seen among five of the 10 sites (50%), with increases ranging from 0–400% and an average increase in size of 97% per site. Further increases are seen with the transition from a 10-m to a 5-m grid pattern, with increases in site size seen among 10 of the 10 sites (100%) ranging from 100–1167% and an average increase in size of 395% per site.
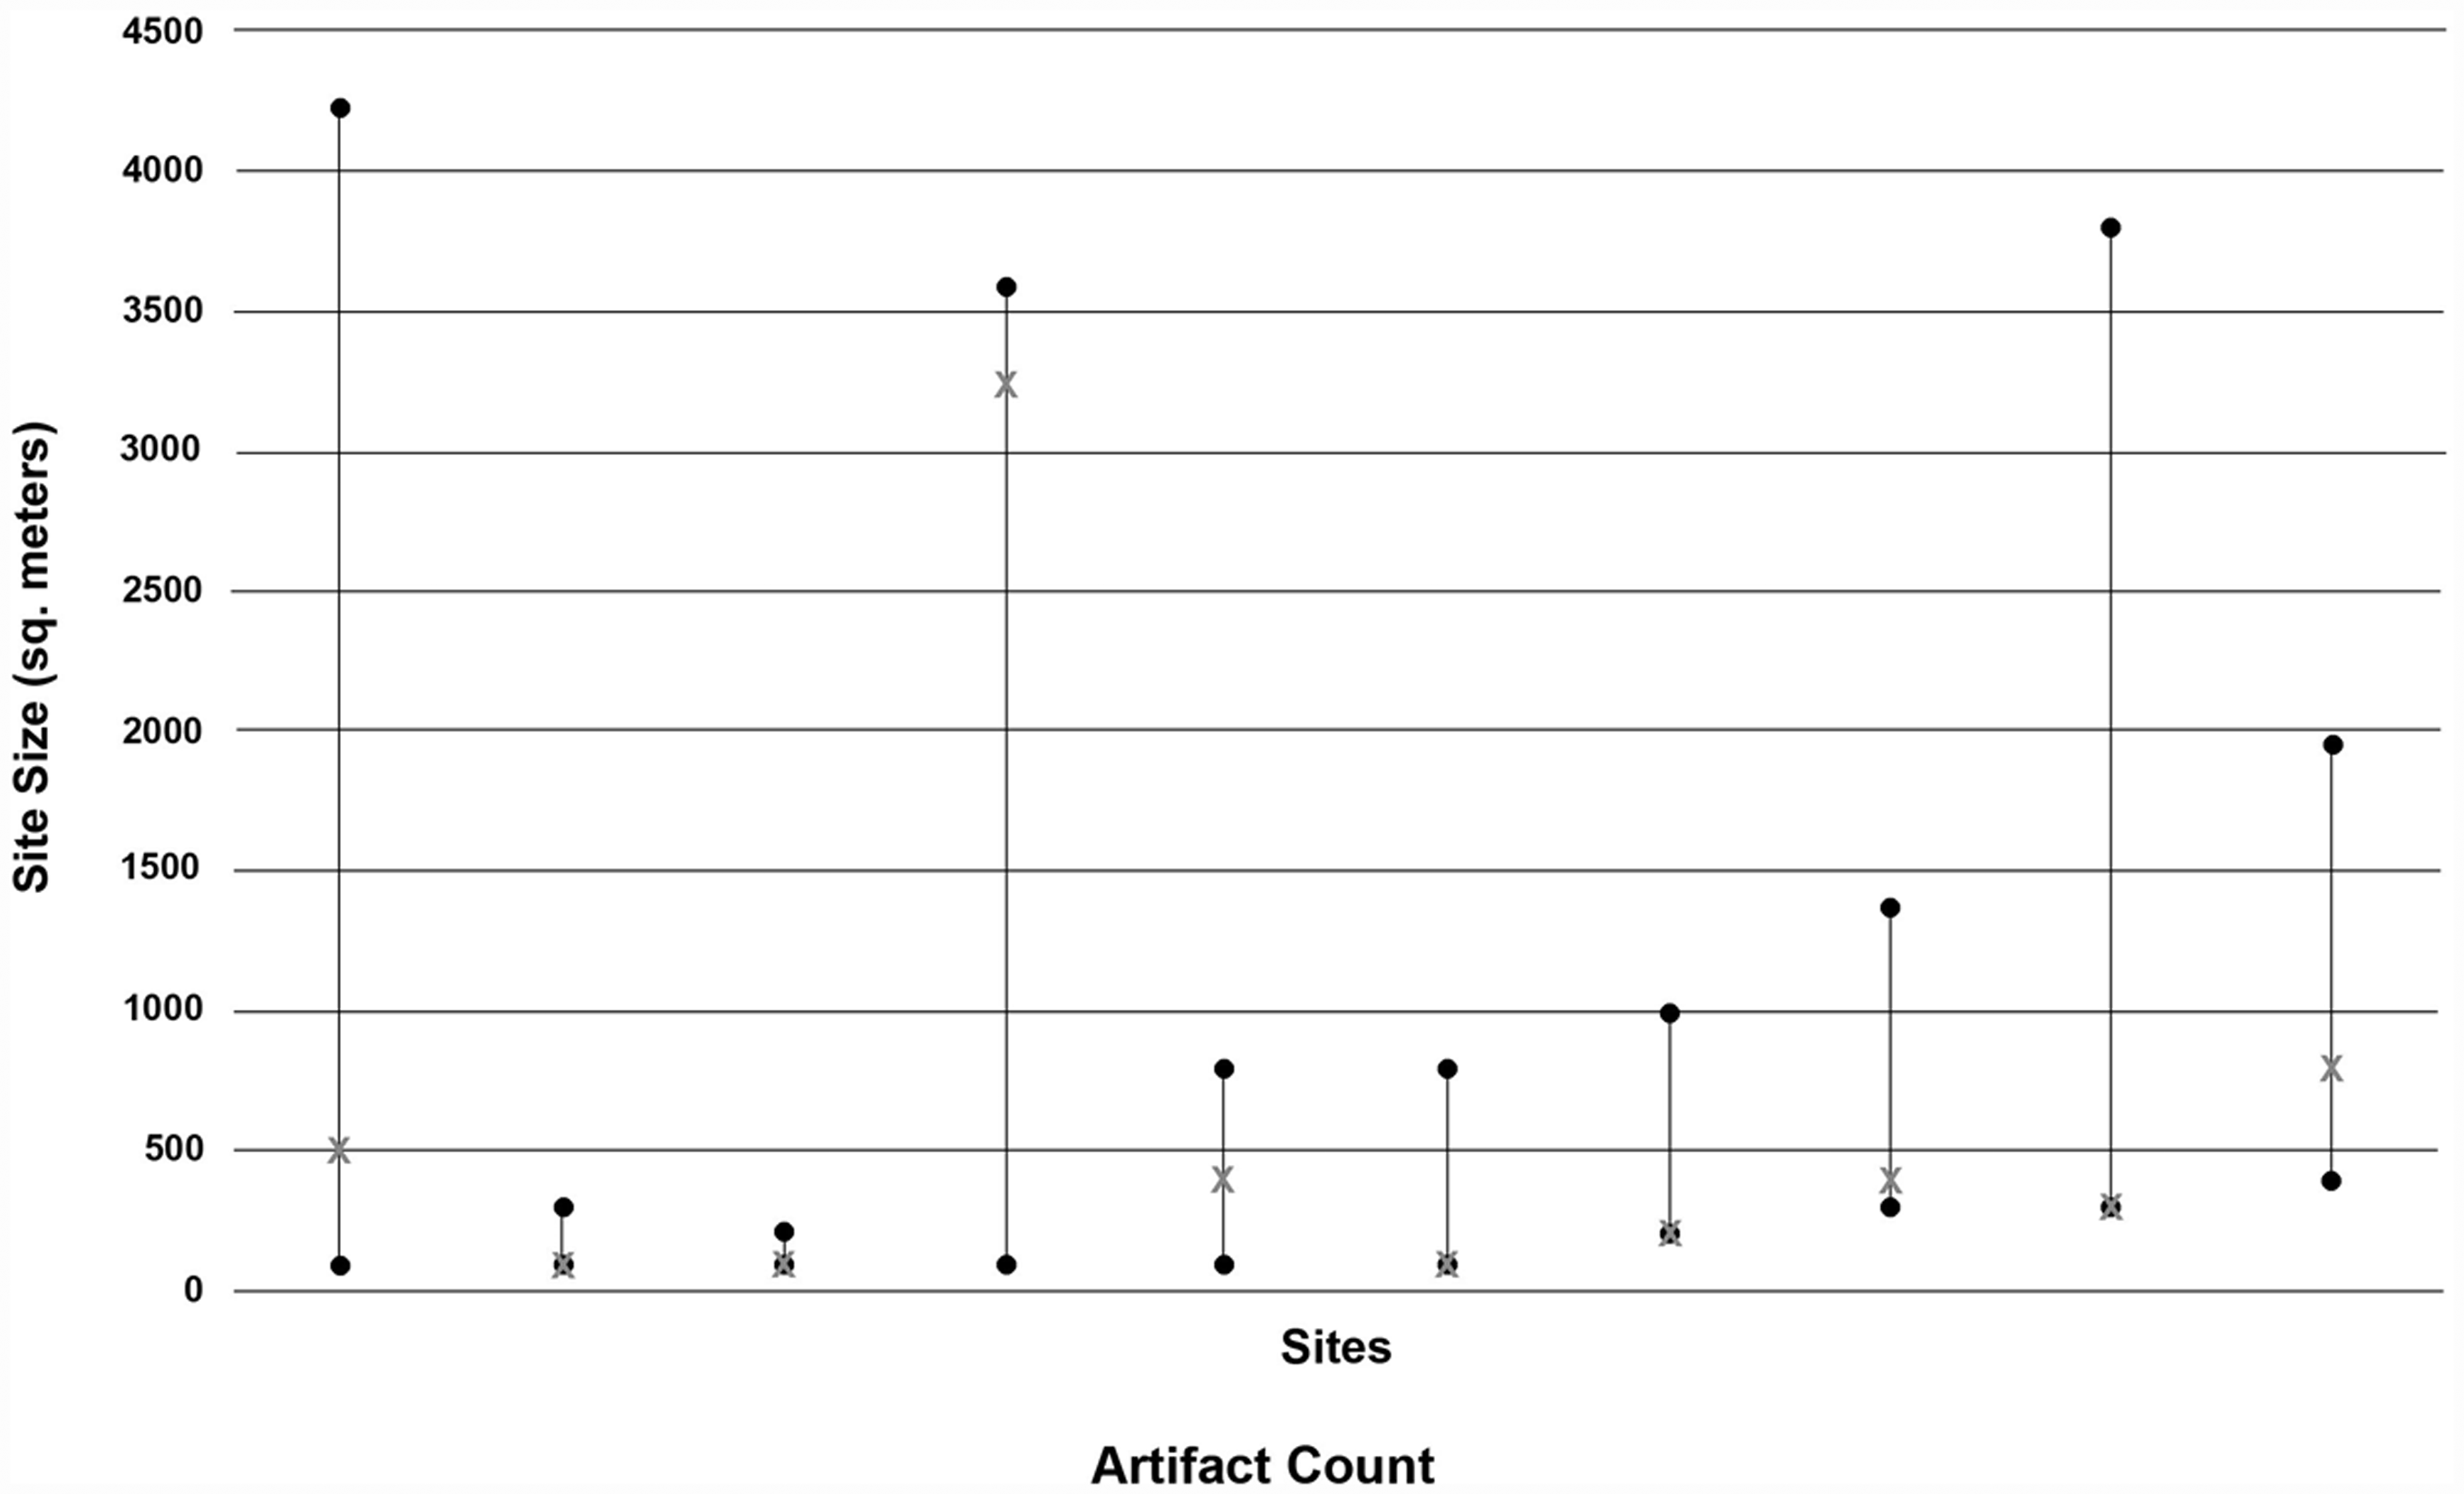
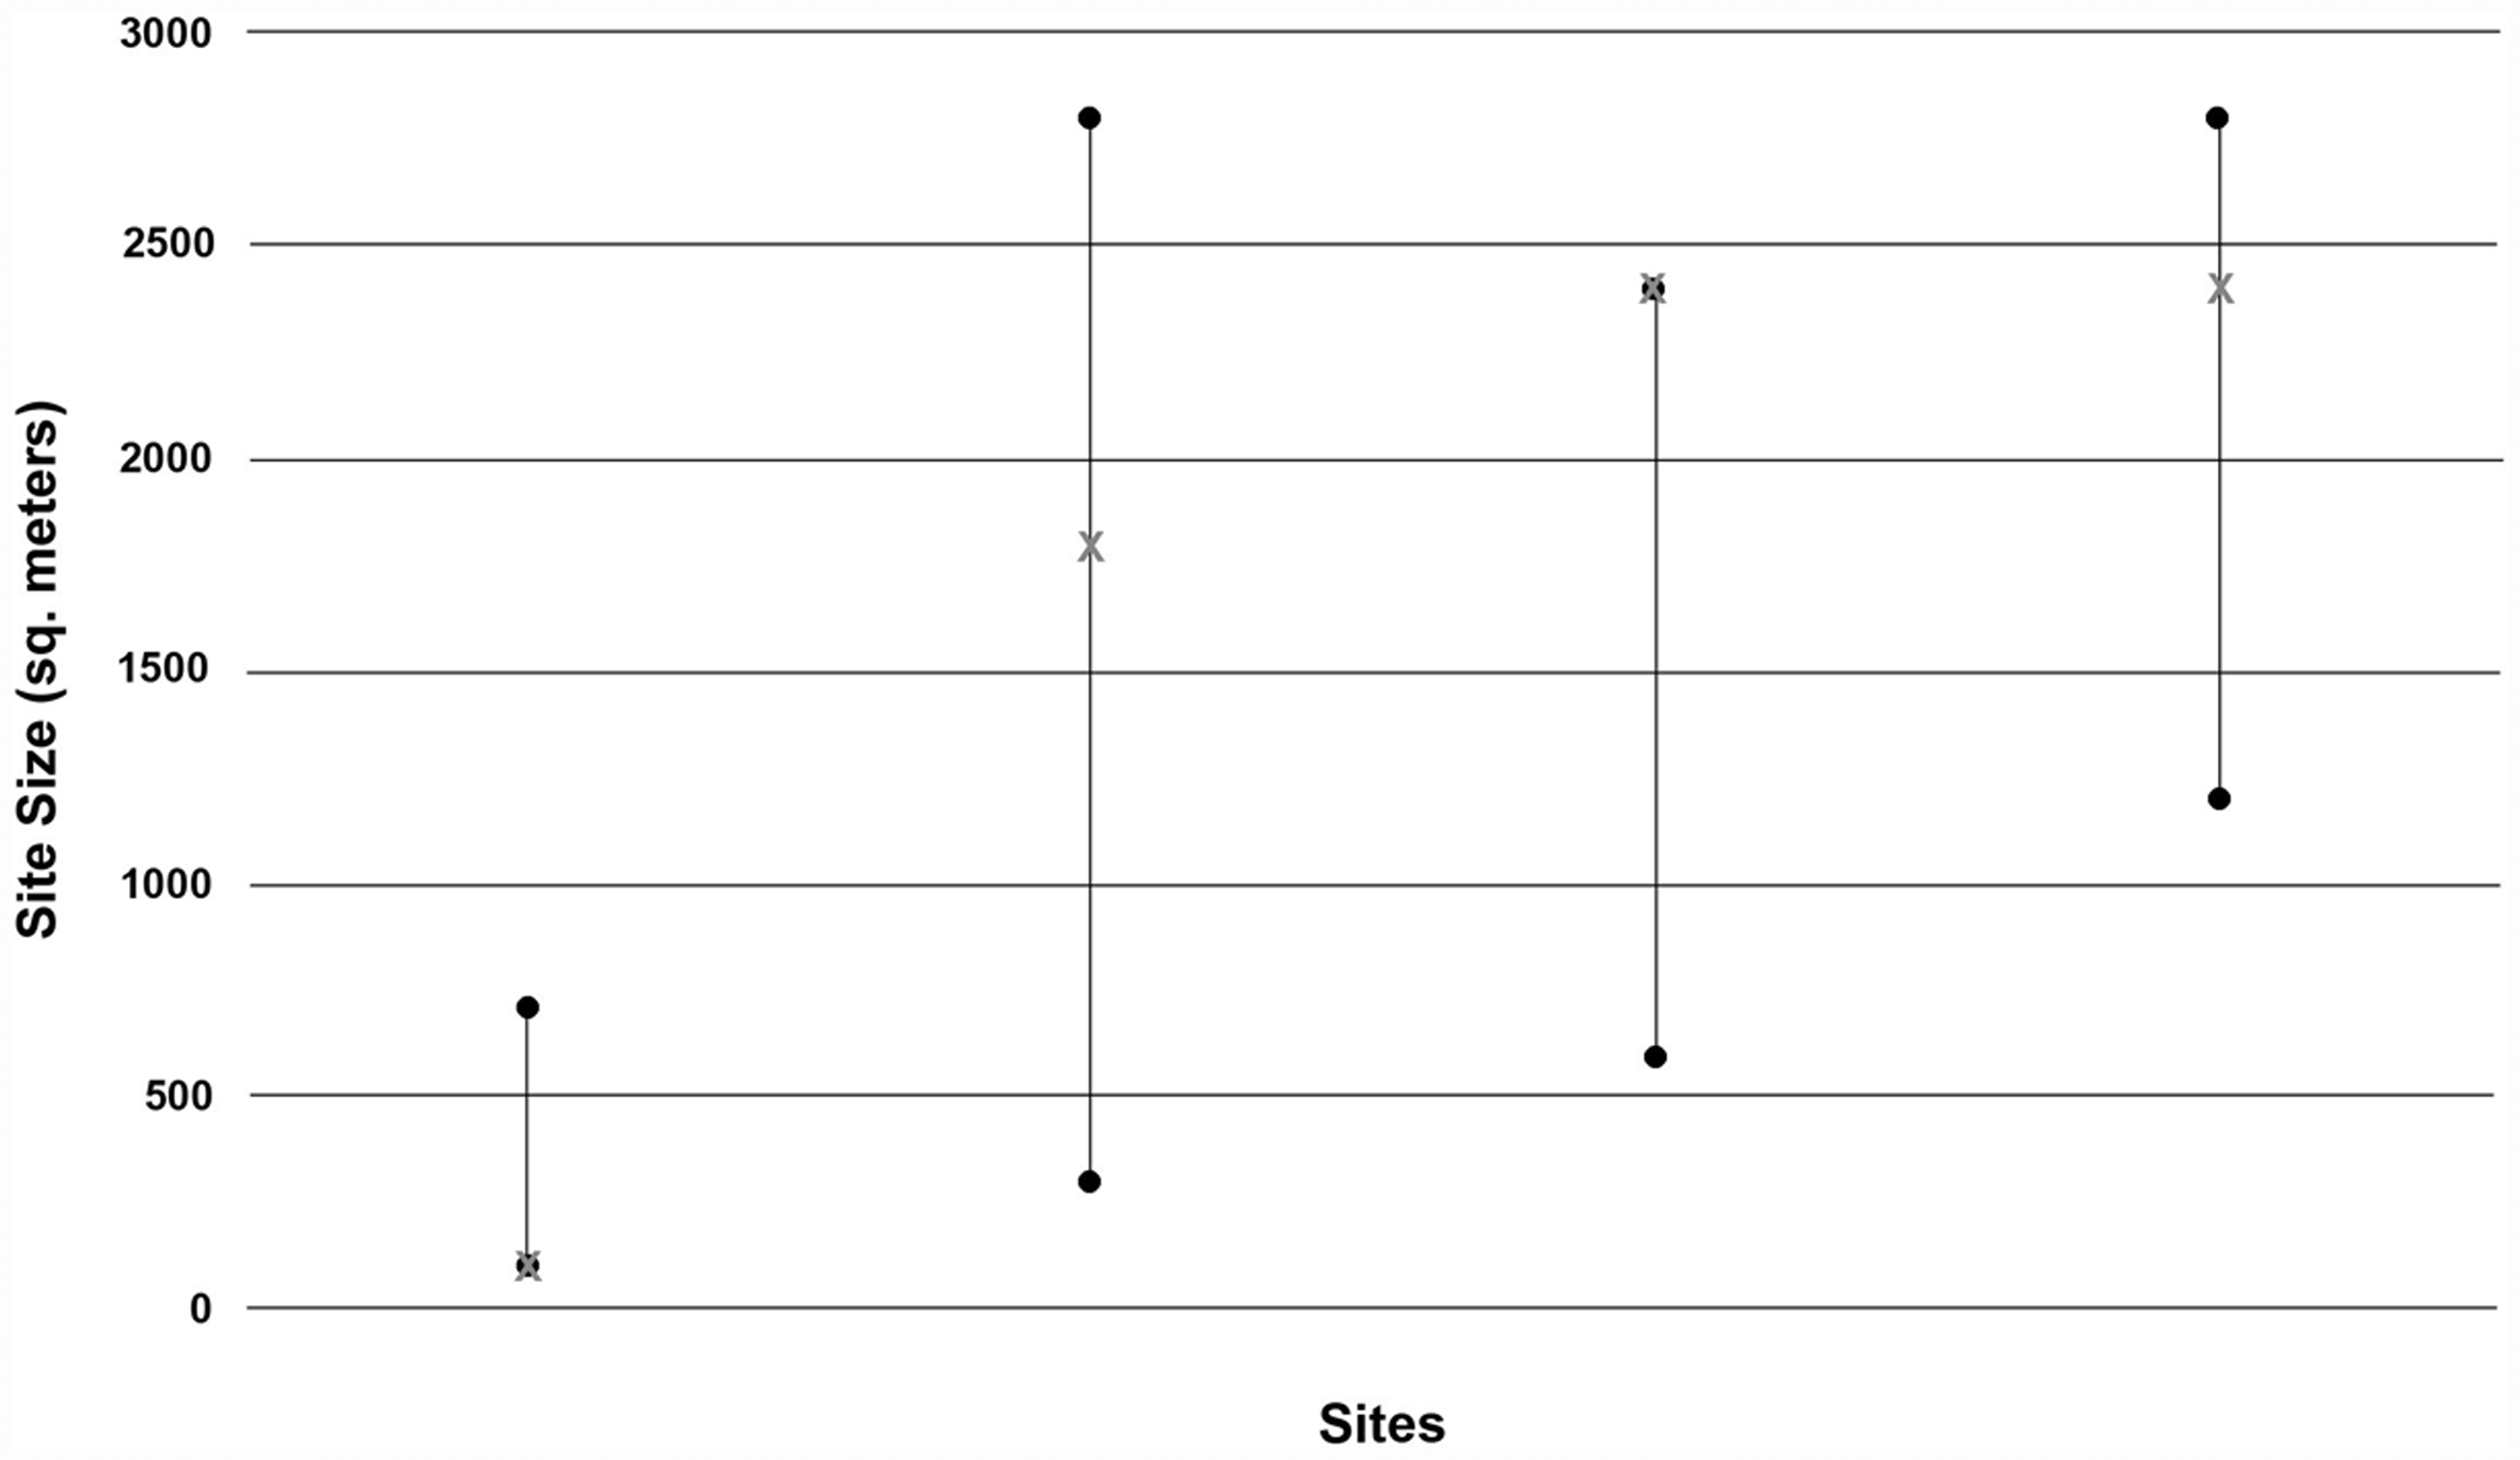
Graph showing changes in site size when comparing shovel testing on a 10-m cruciform (lower black dot), 10-m grid (gray X), and 5-m grid (upper black dot) among 10 sites from study 2.
Site data showing changes in site and occupational variables for cruciform, 10-m grid, and 5-m grid sampling strategies.
Increases in artifact count when transitioning from a cruciform to 10-m grid pattern were also seen among five of the 10 sites (50%), with increases ranging from 0–75% and an average increase of 19% per site. Far more dramatic increases are seen when transitioning from a 10-m to 5-m grid, where increases are once again seen in all 10 assemblages (100%). These increases range from 125–1000% with an average increase of 450% per site. Unlike the results from Study 1, only slight changes were seen in the measure of artifact type richness when transitioning from the cruciform to 10-m grid pattern. Only one of the 10 assemblages (10%) showed evidence of increase as the artifact richness increased from one to three. As with site size and artifact count, however, the results from testing on a 5-m grid showed more dramatic increases in artifact type richness. Richness was increased in eight of the 10 assemblages (80%), with increases ranging from 0–400% and the count per assemblage increasing by 142% on average.
Changes in the numbers of artifact types also had important effects on the occupational duration and function attributed to the Study 2 sites. Results from testing on a 10-m grid show that changes to either occupational duration or function occurred in only one of the 10 assemblages (10%) during this stage. In this instance, both duration and function were affected. In the case of testing on a 5-m grid, however, far more dramatic effects are seen, with either duration or function being affected among eight of the 10 assemblages (80%). This includes changes of occupational duration among six sites (60%) and changes of occupational function among seven sites (70%).
Study 3 (10-m cruciform STs vs. 10-m grid STs vs. 10-m grid STPs)
Study 3 was conducted similarly to the preceding two studies in that comparisons were drawn between shovel testing on a 10-m cruciform (Stage I) and a 10-m grid (Stage II) with 30-cm diameter STs being excavated during both stages. Study 3 differs, however, in that the final stage of sampling (Stage III) did not involve further modification of ST placement but instead involved the excavation of 50 x 50 cm STPs at the locations of all positive and negative tests excavated during Stage I and II.
The results of Study 3 conform to those of the previous two studies in demonstrating that dramatic increases in site size occur with increases in sampling (Figure 5; Tables 4 and 6). From Stage I to Stage II, an increase in site size was seen among three of the four sites (75%), with increases ranging from 0–500% and an average increase in size of 225% per site. Increases in site size were also seen at three of the four sites with the transition to Stage III, with increases ranging from 0–600% and an average increase in size of 168% per site. Increases in artifact count when transitioning from Stage I to II were seen among all four sites (100%), with increases ranging from 13–585% and an average increase of 235% per site. Further increases are seen with the transition to Stage III, where increases are again seen at all four sites and range from 44–269% with an average increase of 183% per site. From Stage I to II, artifact type count increases are seen in two of the four assemblages (50%), with increases ranging from 0–100% with an average increase of 50% per site. Transitioning from Stage II to III, increases in artifact type count are seen in all four assemblages (100%), with increases ranging from 50–117% and an average increase of 80% per site. The results from Study 3 demonstrate that occupational duration and function were affected throughout the three stages of sampling. The results from Stage II testing show that changes to either occupational duration or function occurred in two of the four assemblages (50%) with duration and function being affected in both cases. Stage III sampling resulted in either duration or function being affected among all four assemblages (100%). This includes changes of occupational duration among two sites (50%) and changes of occupational function among all four sites (100%).
Graph showing changes in site size when comparing shovel testing on a 10-m cruciform (lower black dot), 10-m grid (gray X), and 5-m grid (upper black dot) among four sites from study 3.
Site data showing changes in site and occupational variables for the three-stage sampling comparing 30-cm diameter shovel tests on a cruciform (Stage I) and 10-m grid (Stage II) with 50 x 50 cm shovel test pits on a 10-m grid (Stage III).

Discussion
This study has demonstrated that sampling strategies routinely employed during Phase I and II investigations often lead to the production of incomplete occupational models that preclude the accurate determination of site significance in the context of assessing NRHP eligibility. These methods fail in their ability to identify the horizontal boundaries of artifact clusters, thereby misrepresenting the spatial dimension of archaeological occupations and sites. This failure not only prevents archaeologists from identifying the spatial extent of the “population of interest” represented by the artifacts and features that comprise an archaeological site, thereby undermining their ability to devise effective sampling strategies for further site investigation, but also compromises the ability of cultural resource managers to insure the avoidance of such resources by future ground-disturbing activities.
It is clear that the principle that larger samples more accurately reflect the population of interest needs no empirical demonstration. Another truism, however, is that when sampling from a population there is a strong correlation between sample size and the resulting estimates of richness represented by the sample, a fact long recognized by archaeologists (Jones et al., 1983; Lyman and Ames, 2004). The results presented here clearly demonstrate that standard approaches to the sampling of archaeological sites during Phase I cultural resources survey suffer from the problem of undersampling, which leads to inaccuracy in the critical measures of occupational variability that are central to the evaluation of a site’s eligibility for inclusion on the National Register.
Results from the three studies demonstrate that shovel testing on either a 10-m cruciform or grid pattern results in frequent mischaracterizations of site occupations in terms of their spatial, temporal, and formal attributes. These failures inevitably contribute to the construction of occupational models that are compromised in their ability to represent the occupation(s) present at some archaeological locus and that fail to characterize even basic occupational dimensions such as duration or function.
Comparisons were made between the results of shovel testing on a 10-m cruciform and a 10-m grid at all 44 sites investigated during this study. Thirty-two of the 44 sites (73%) saw an increase in site size, with an average increase of 184% per site. Numbers of artifact types recovered during testing on a 10-m grid changed in such a way that occupational duration or function were affected at 16 of the 44 sites (36%). While such results provide a strong case for the abandonment of shovel testing on a cruciform pattern as a sampling strategy, further intensification of sampling on a 5-m grid casts doubt on the usefulness of sampling on a 10-m grid, as further increases in site size are seen at all 10 sites when sampling is expanded to a 5-m grid. Even more striking is the average increase in site size from 10-m to 5-m grid sampling, which shifts to a startling 395%. Similarly, striking changes are seen in the numbers of artifact types recovered during testing on a 5-m grid, where occupational duration or function were affected at 8 of the 10 sites (80%).
Determining the appropriate sampling strategy for any particular research program can be a daunting task for archaeologists. Inevitably, however, the question of whether we have “sampled to redundancy” (Dunnell, 1984; Leonard, 1987; Lyman and Ames, 2004, 2007) provides a valuable guiding principle for making such determinations. Cumulative frequency graphs were constructed for the 10 sites investigated in Study 2 to demonstrate the relationship between shovel-testing intensity and artifact type richness (Figure 6). The results demonstrate that only two of the 10 sites (22CS1212 and 22SM1440) have been sampled to redundancy despite having been investigated/delineated on a 5-m grid, which represents the highest level of sampling intensity represented in the current study and greatly exceeds the level of sampling intensity employed in most Phase I cultural resource surveys. These findings should provide a cautionary tale for archaeologists when considering the validity of the occupational models that result from the use of standard shovel testing strategies.
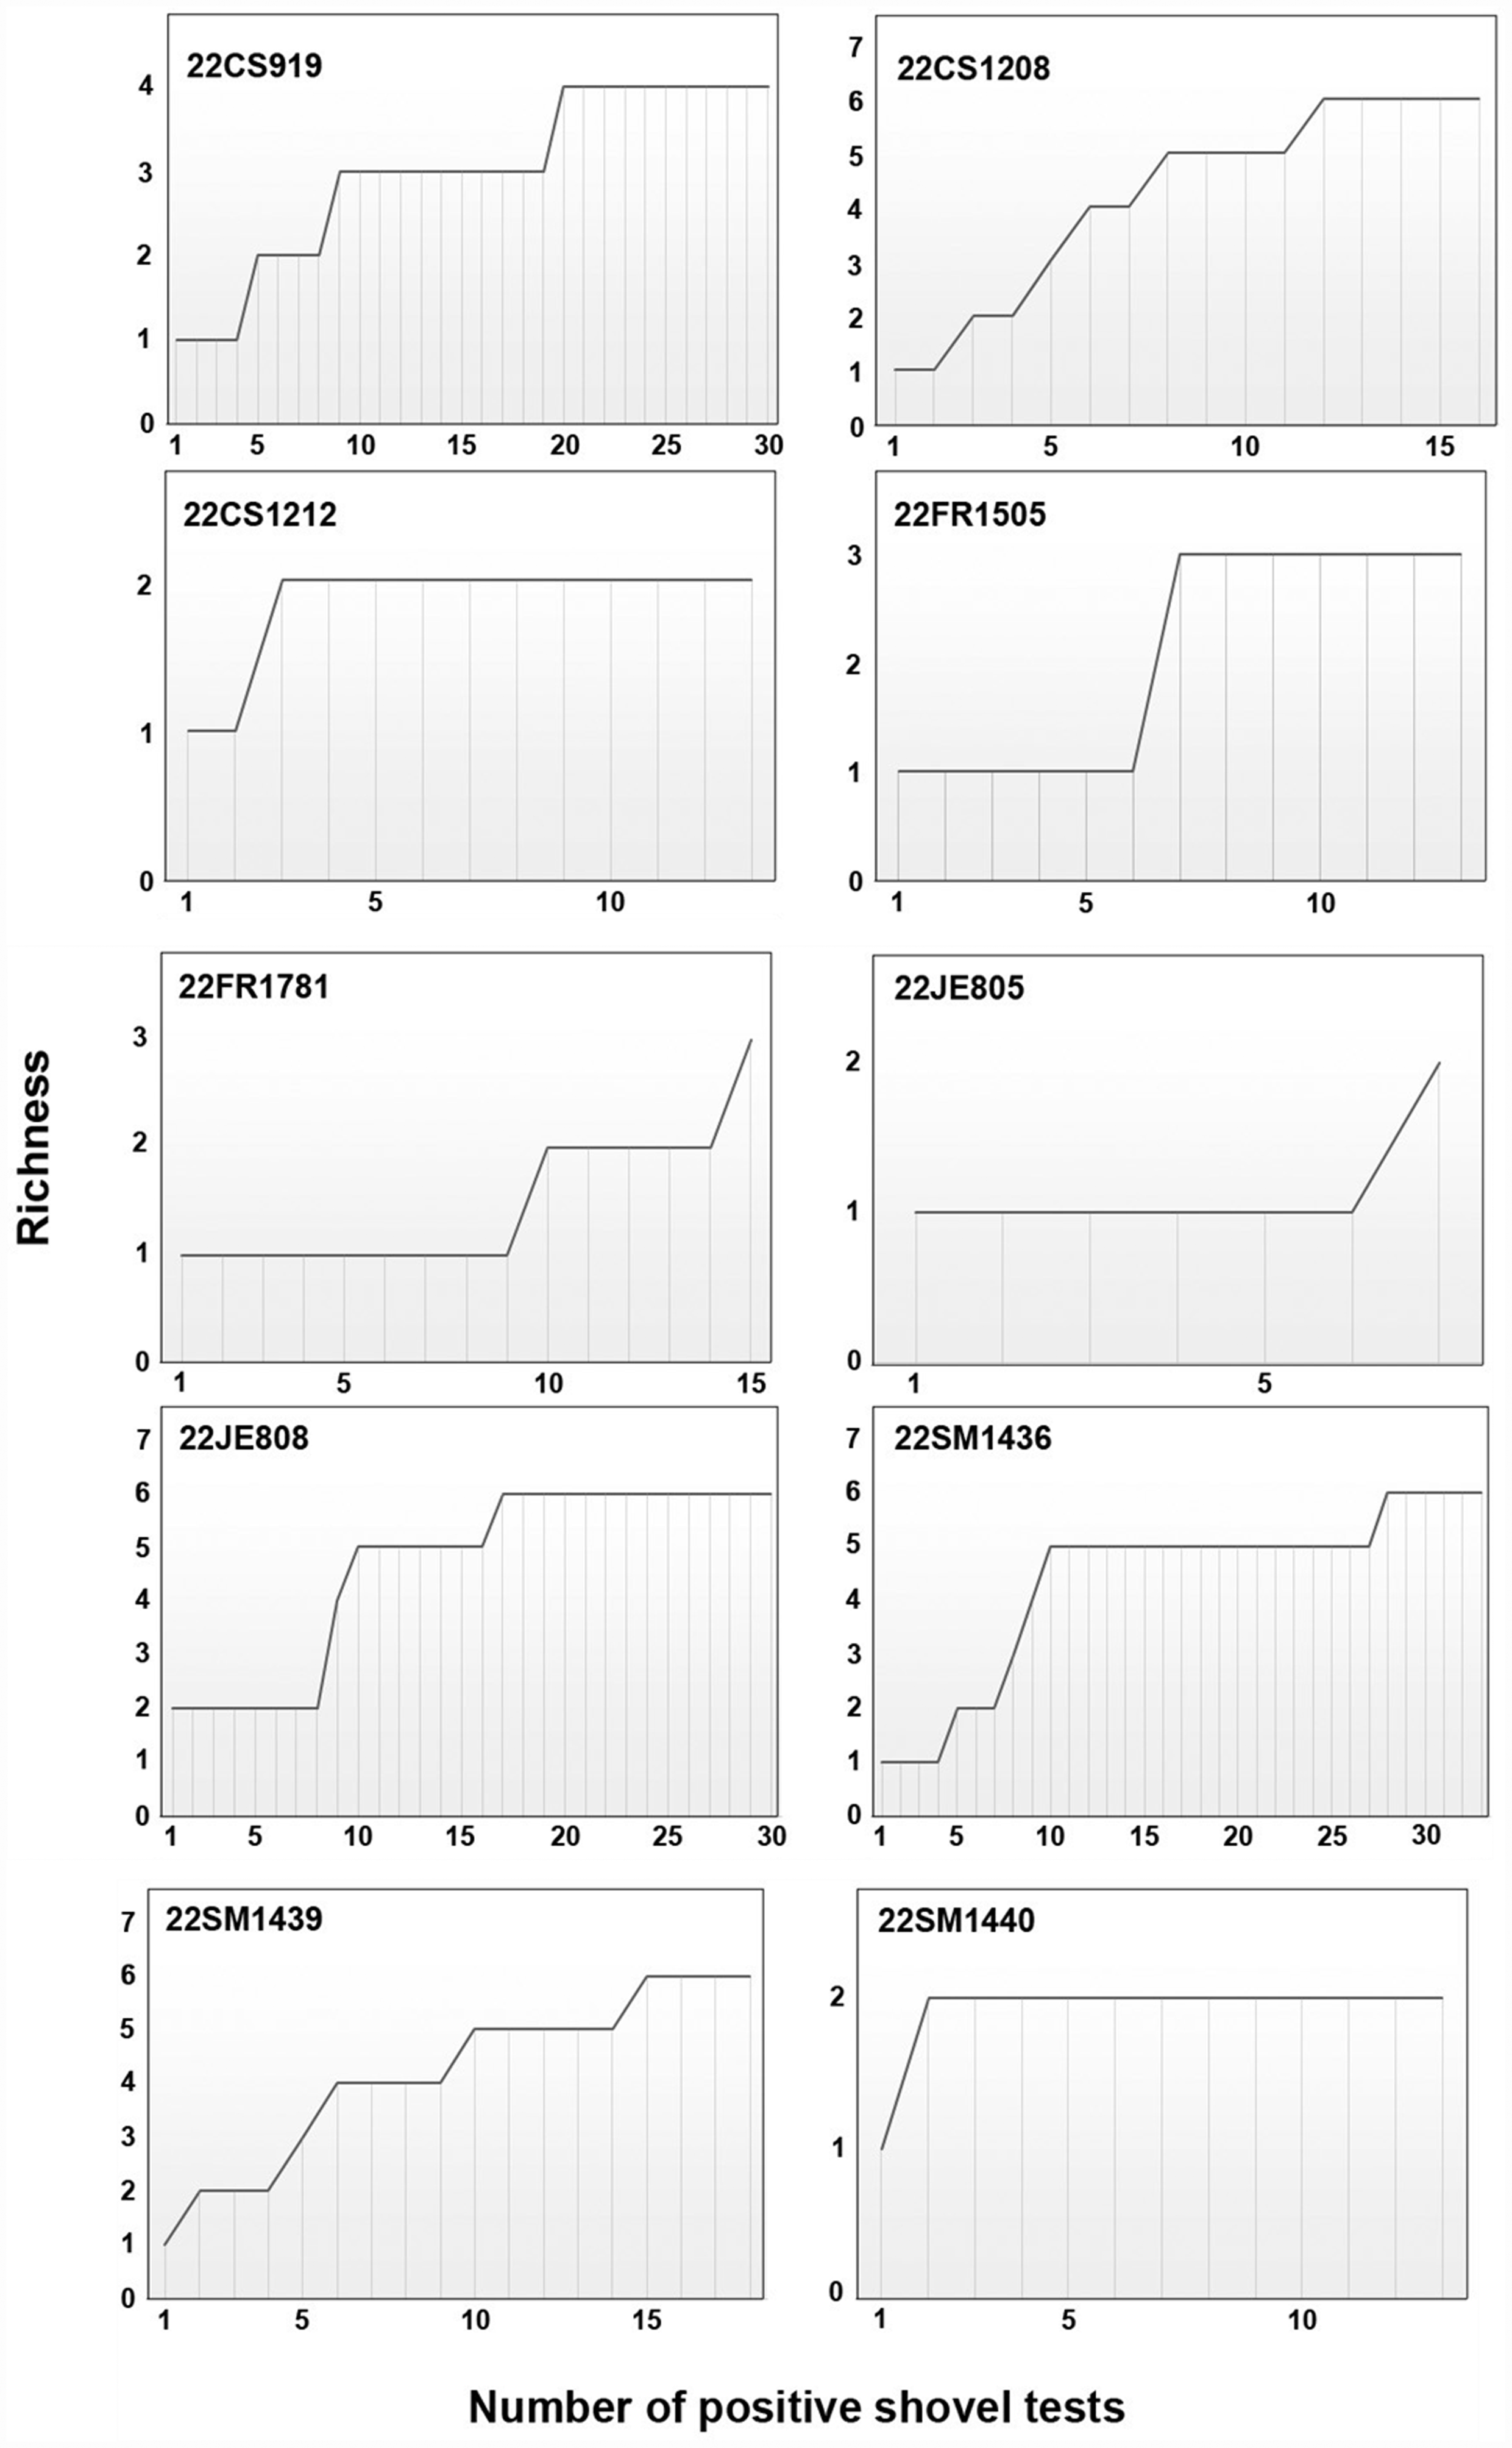
Cumulative richness of artifact types across cumulative numbers of positive shovel tests from ten sites investigated/delineated on a 5-m grid.
Some may argue that increasing the intensity of shovel testing beyond a 10-m grid represents an impractical strategy for Phase I cultural resources survey, given the time and money that are generally available to accomplish the goals of this work, and that such intensive testing is best undertaken during later phases, when excavation and mapping techniques incorporate more precise spatial control. If such a position is to be taken, however, it is critically important that archaeologists operate with considerably more caution in their Phase I determinations about which sites should receive further testing through Phase II investigations, as the results presented here clearly demonstrate that standard Phase I sampling strategies often compromise our ability to make proper significance determinations at this level of investigation. The findings certainly support the position that the use of shovel testing on a cruciform should be abandoned in favor of testing on a grid pattern of some size.
Conclusions
American archaeology would be well served if we developed a better appreciation for the fact that investigations in the context of cultural resource management constitute the primary means by which we evaluate the archaeological record. Every day, hundreds of archaeologists across the country are engaged in discovering and investigating sites, many of which will never be revisited once the investigations are complete. We have historically conceived of this undertaking as only the beginning phase within a series of investigations whose purpose is to determine the significance and NRHP eligibility of cultural resources found to be endangered by some proposed development. Efforts during Phase I are integral to this process but also represent a scale of investigative undertaking that can contribute invaluable data for addressing landscape-scale research questions that have historically existed beyond our reach due to the demands of collecting such large and diverse datasets. Improvements in our sampling strategies will not only strengthen our abilities to make valid significance determinations but will ensure that the data generated in CRM is better suited for contributing to landscape scale research questions related to issues such as settlement or subsistence organization, or inter-regional interactions.
Results presented here have exposed the potential for inadequate sampling strategies to affect our models of archaeological occupations and, therefore, the significance we assign to them. We must acknowledge that our efforts to accomplish the grander ambitions of archaeological research will be compromised so long as we fail to accurately characterize the spatial, temporal, and formal dimensions of archaeological occupations, which represent the basic building blocks of archaeological inference.
Footnotes
Acknowledgments
This paper greatly benefited from the comments of a number of people including Michael O’Brien, Lee Lyman, Karthik Panchanathan, Michael Glascock, Evan Peacock, Jacob Lulewicz, and two anonymous reviewers.
Declaration of Conflicting Interests
The author(s) declared no potential conflicts of interest with respect to the research, authorship, and/or publication of this article.
Funding
The author(s) disclosed receipt of the following financial support for the research, authorship, and/or publication of this article: This work was supported by the W. Raymond Wood Opportunities for Excellence in Archaeology fund from the Department of Anthropology, University of Missouri, Columbia.