



Abstract
Immigrant incorporation in cities is often explained using the theories of spatial and segmented assimilation, which differ, among other things, in their approach to the spatial aspects of incorporation. However, empirical evidence about immigrant spatial incorporation from both theories is ambiguous, since most case studies focus on a single location and a limited number of immigrant groups, which hampers their external validity. Nonetheless, the level of immigrant spatial incorporation depends heavily on the characteristics of immigrant groups, the destination context, and the interplay between them. Therefore, we compared the spatial incorporation of 143 immigrant groups in Sydney, 54 in Barcelona, and 95 in Prague. These three cities differ greatly in their immigration histories, since each represents a different stage of the migration cycle. By employing both traditional and advanced quantitative methods, we show that immigrant spatial incorporation patterns vary considerably across groups and destination cities, with cultural proximity and the maturity of the immigration system among the key determinants. These findings imply that geographical context has a substantial potential to affect the immigrant spatial incorporation.
Introduction
Persistent scholarly interest in immigrants’ residential behavior highlights the importance of understanding the links between immigrants’ geographical distribution and their incorporation into destination countries’ societies (e.g., Massey 1985; Brown and Chung 2008). Contemporary research on immigrant spatial distribution in destination countries is predominantly framed by the classical spatial assimilationist perspective (e.g., Johnston et al. 2017). Although this theory's explanatory power has decreased since 1965, with the global restructuring of labor, societies, and international migration (Zelinsky and Lee 1998), spatial assimilation remains the “benchmark” for assessing immigrant spatial incorporation (Macpherson and Strömgren 2013). The more recently introduced segmented assimilation perspective highlights the diversity of incorporation outcomes in different immigrant groups and acknowledges the role played by the context of reception (Portes and Zhou 1993; Zhou 1997).
Despite their widespread use (e.g., Forrest, Poulsen, and Johnston 2009; Edgar 2014), these two theories have not proven to be universally valid: spatial assimilation seems relevant in only certain spatial and temporal contexts (Alba and Nee 1997; Zelinsky and Lee 1998), while empirical tests of segmented assimilation in immigrant residential distribution have been rare. Most studies assessing segmented assimilation focus on the non-spatial aspects of immigrant incorporation, particularly immigrants’ social and economic status (e.g., Waldinger and Feliciano 2004; Goodwin-White 2009). Those few studies that have attempted to measure immigrant spatial incorporation focus on just one geographical area and/or one immigrant group (e.g., Newbold and Spindler 2001; Forrest, Poulsen, and Johnston 2009).
The limited validity of findings concerning the two aforementioned theories stems from an absence of comparative research that considers the role of different geographical contexts, particularly new immigrant destinations (Winders 2014). In this article, we argue that geographical context has great potential to influence immigrant incorporation, due to varying immigrant mixes and diverse social and physical environments across destinations (Robinson 2010). However, the value of geographical context in understanding immigrant incorporation has yet to be systematically tested. To fill this gap, this article addresses immigrant residential patterns in three cities in different regions with varying immigration experiences: Sydney, Australia; Barcelona, Spain; and Prague, Czech Republic. Comparing immigrant incorporation in these diverse settings allows us to evaluate the extent to which the aforementioned theories’ explanatory power is conditioned by geographical context, thus enabling the assessment of their external validity. Moreover, using all relevant individual origin countries as the unit of analysis also enables us to evaluate the role of group characteristics in immigrant spatial incorporation.
The scholarly literature on spatial incorporation predominantly considers incorporation 1 as a process and studies it via longitudinal analyzes or cohort comparisons (e.g., Macpherson and Strömgren 2013; Jiménez, Park, and Pedroza 2018). However, to provide a clear comparative analysis, we use an alternative (cross-sectional) approach and understand incorporation as a state (i.e., the relative level of being spatially incorporated or not) (for a similar approach to explaining segregation, see van Kempen and Özüekren 1998). Thus, instead of observing the development of a group's incorporation over time or across generations, we compare various groups’ spatial incorporation in relation to the length of their members’ stay in the destination city. 2
The comparative study presented in this article analyzes census and population register data to identify patterns of immigrant residential distributions in Sydney, Barcelona, and Prague. Its general aim is to test the external validity of spatial incorporation theories by examining the differences in incorporation levels and patterns across immigrant groups and destination cities. To tackle the complexity of patterns and the number of immigrant groups observed, we use both traditional and advanced computational methods, such as spatial autocorrelation and network visualizations of spatial segmentation. As our analysis shows, immigrant spatial incorporation patterns differ considerably across groups and destination cities, with cultural proximity and immigration system 3 maturity among the key determinants.
The following section provides a detailed discussion of the theories of spatial and segmented assimilation in relation to immigrant groups and destination cities. Our hypotheses are introduced thereafter. The third section examines the context of destination cities, while the fourth discusses the data and methods used. The results of our analyzes are presented in the fifth section and debated in greater detail in the concluding discussion.
Theoretical Background
The Geographical Aspect of Assimilation Theories
According to classical assimilation theory (e.g., Park 1928), immigrant incorporation (termed “assimilation” in the original literature) into a destination society is an inevitable result of immigrants and the majority population living together and having economic relations, as well as immigrant groups’ subsequent social and cultural adjustment to the majority population. Assimilation, from this perspective, is manifested in upward occupational mobility and the residential integration of subsequent immigrant generations (Massey 1985). The original spatial assimilationist approach viewed economic and cultural factors as decisive forces contributing to immigrants’ gradual adaptation to their destination's society (Park 1928). Later, scholars highlighted that assimilation was also affected by immigrants’ social class and skin color (Warner and Srole 1945) and that assimilation could occur in aspects of immigrant life (Gordon 1964) other than those mentioned explicitly by Park (1928) (e.g., the destination country's primary social structures, such as family and child playgroups).
Assimilation theory long provided an explanation of immigrant integration into the societies of destination countries, particularly the United States (Zelinsky and Lee 1998). However, the restructuring of the global economy and global societies in the latter part of the twentieth century, as well as immigration policy changes in 1965, led to a more diverse immigrant population in the United States, which, in turn, diminished much of the theory's explanatory power (Zelinsky and Lee 1998; Jiménez, Park, and Pedroza 2018). Contradicting spatial assimilation theory, numerous studies found that some immigrant groups’ and ethnic minorities’ positions in the destination country improved quickly after immigration, while those of other groups worsened in further generations. 4
Consequently, Portes and Zhou (1993) proposed segmented assimilation theory to explain the divergent assimilation trajectories of subsequent immigrant generations, introducing three typical scenarios of immigrant assimilation into US society. One scenario followed the classical path of acculturation and socio-economic integration into the White middle class expected by straight-line assimilation theory. Another scenario led to assimilation into the US underclass, while the third consisted of rapid economic assimilation into the new society while preserving the immigrant community's values and social networks (Portes and Zhou 1993). These assimilation pathways were theorized as stemming from an interplay between two main sets of determinants related to (1) immigrant population and (2) the destination country. The first set consists of characteristics related to individual immigrants and structural factors related to their immigrant group. The second relates to the context of reception, which highlights the features of the environment in which immigrant assimilation occurs: political relations between origin and destination countries, migration policy, the state of the economy, the level of segregation in the destination country, and pre-existing co-ethnic community (Portes and Zhou 1993; Zhou 1997). However, the context of reception has rarely entered empirical analyzes, and when included, it is often understood to be aspatial and proxied by nationality (Luthra, Soehl, and Waldinger 2017). A rare exception is Wang et al. (2018), who observed a greater influence of geographical location over group characteristics.
Unlike the segmented assimilation approach, which pays little attention to the spatial expressions of immigrant incorporation, a clear spatial aspect exists in classical assimilation theory, which holds that immigrants’ spatial position corresponds to their socio-economic status (Peach 1996). With an improvement in status, which occurs over time and typically across generations, immigrants are assumed to disperse in space. Furthermore, the socio-economic and cultural distance between groups is understood to translate to the level of spatial segregation in the assimilation model (Massey 1985).
Due to the variety of possible outcomes proposed by the segmented assimilation framework, its spatial expressions are less clear cut (Newbold and Foulkes 2004). Studies typically compare the profiles of individual immigrant group cohorts with the majority population in terms of social and economic status (e.g., Waldinger and Feliciano 2004; Goodwin-White 2009) and only rarely evaluate the spatial aspect of (dis)similarity among groups (e.g., Newbold and Spindler 2001). Another approach to the geographical aspect of segmented assimilation is the identification of immigrant concentration areas and assessment of their residents’ socio-economic profiles to establish the segment of the destination country's society into which each immigrant group assimilates: this approach was used by Forrest, Poulsen, and Johnston (2009) for Maori people in Australia's major immigrant-receiving cities. However, to our knowledge, there have been no studies of other regions that would allow comparisons between countries or multiple immigrant groups.
Since spatial and segmented assimilation theories originated in the United States during the early- and late-20th century, respectively, their application in other spatial and temporal contexts can be challenging (Wright, Ellis, and Parks 2005; Arapoglou 2006). 5 Although constrained by barriers such as dissimilar variables and data units, bringing together comparable data from different geographical areas has the potential to assess both theories’ validity across spatial contexts, especially in countries in diverse stages of their migration cycle, from emigration countries to immigration countries (Okólski 2012). During the migration cycle, countries undergo several stages characterized by increasing maturity of their immigration system (ibid.). Countries at different stages in the cycle are also likely to display different spatial distributions of immigrant populations and different policies toward them (Piekut and Valentine 2017). Thus, it may be harder for immigrants to find a place of residence in the housing market of a country which has been an immigrant destination for a shorter time and whose population, given less possible contact with immigrants, tends to be more in opposition to immigrants than the population of a country where the majority population and immigrants are already residentially mixed (Thomsen and Rafiqi 2019). Therefore, geographic context—encompassing national and local urban policies, as well as immigration history—is a crucial explanatory variable in this article.
Research Hypotheses and Expectations
Building on the two assimilationist perspectives and the concept of migration cycle, we hypothesize the following. Our first two hypotheses stem directly from spatial assimilation theory and test how much immigrant groups are concentrated in the selected cities, suggesting that the extent of immigrant spatial incorporation results from their gradual acculturation and economic assimilation into the majority population. The third hypothesis stems from segmented assimilation theory and focuses on where in the cities immigrants are concentrated.
In line with Massey (1985), our first hypothesis suggests that groups with a long immigration history and a low cultural and socio-economic distance from a destination country's majority population are more likely to be spatially incorporated. We argue that cultural and socio-economic distance and the patterns of residential segregation depend on the wider local context, which is mainly understood via cultural (notably linguistic) and economic terms (Maloutas and Fujita 2012). Therefore, within each city, a different immigrant group should be the most proximate to the majority population. Stemming from Massey (1985), we also expect that groups with a similar length of stay and cultural background will have comparable levels of spatial incorporation. Finally, the situation when different set of immigrant groups in each city achieve the highest spatial incorporation will suggest that the local context (i.e., local socio-economic level and cultural characteristics) plays a role in spatial assimilation theory.
In the second hypothesis, we relate spatial assimilation theory to the concept of the migration cycle and presume that a city's maturity as an immigrant destination plays a key role in the level of immigrant spatial incorporation. For example, the length of a country's experience with immigration impacts people's prejudice toward others (Valentine and McDonald 2004; Kukk, van Ham, and Tammaru 2019). Since we focus on key immigration cities in the given countries and since these cities’ experience with immigration is similar to that of the whole country, we may expect that the overall level of immigrant incorporation will be greater in more established immigrant destination cities than in more recent ones. Thus, results supporting this statement would suggest the relevance of the migration cycle concept for spatial assimilation theory.
Our third hypothesis brings a geographical aspect to segmented assimilation theory by predicting that different immigrant groups will be concentrated in different parts of cities. In line with this theory, we expect that each group is prone to assimilate into a specific segment of the local population located in specific areas of a city. Similarly to the procedure used by Forrest, Poulsen, and Johnston (2009), we derive this differentiation (or segmentation) of city areas from their local spatial-economic status. In line with Novotný and Hasman (2016) and Hasman and Novotný (2018), we argue that the degree of similarity in individual immigrant groups’ residential patterns relates to the social, cultural, and economic distance between these groups. Similar socio-economic and cultural profiles of immigrant groups are, thus, expected to produce similar spatial patterns. If these patterns differ between immigrant groups with comparable lengths of stay in the destination country, their segmentation stems from their socio-economic and cultural profiles, supporting segmented assimilation theory.
Destination Cities
To assess the external validity of spatial and segmented assimilation theories, it is crucial to examine different geographical contexts that condition immigrant spatial incorporation. We focus on three cities that have served as destinations for international migration—Sydney, Barcelona, and Prague—but vary in geographical context and in their stage of the migration cycle, as we show below. These divergent factors have resulted in differences in each city's immigrant population (proportion and composition), present-day ethnic diversity, and majority's approach toward the immigrant population.
First, how long a country has been an immigrant destination affects the size and structure of its immigrant population (Okólski 2012): established immigration countries like the United States, Canada, Australia, as well as those in Western Europe, tend to have the greatest proportions of international migrants in their populations, ahead of Southern European and Central and Eastern European countries (World Bank 2021). Therefore, we studied one city in an established immigration country (Sydney, Australia), one in a more recent immigration country (Barcelona, Spain), and one in an emerging immigration country (Prague, Czech Republic). These cities were selected because they are main gateways in their countries 6 and major gateways in their respective regions: Australia, Spain/Southern Europe, and the Czech Republic/Central and Eastern Europe (hereafter, CEE) (Hugo 2008; Drbohlav 2011; Martori and Apparicio 2011). Notably, each city represents only one stage in a given migration cycle, which limits the generalizability of our results. However, in the Australian case, Hasman and Novotný (2017) demonstrate that the spatial patterns of immigration to Sydney strongly resemble those of other major Australian cities (correlation of values of spatial relatedness of immigrant groups were 0.841 between Sydney and Melbourne and 0.675 between Sydney and Brisbane). The resulting pattern would, thus, be similar if we analyzed a different Australian gateway.
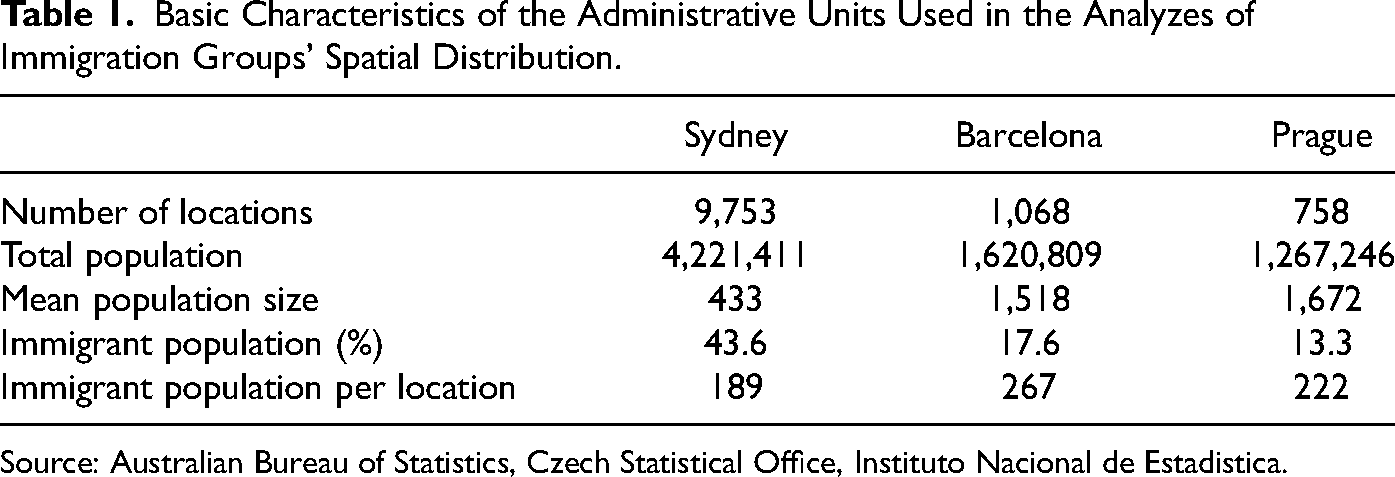
To a considerable extent, Australia was already shaped by international migration before the 1950s (Forrest, Poulsen, and Johnston 2006). Anglo-Celtic settlers in Australia were followed by other white Europeans until the 1970s and by immigrants from many other source countries since then (Hugo 2011). In Spain, immigration to Barcelona began in the 1980s (Martori and Apparicio 2011), initially from Western Europe and then from developing countries and countries in crisis, bringing a considerable Latin American and African population to the country (Martori and Apparicio 2011). However, the 2008 economic crisis led to a decrease in immigration to Spain and a worsening of immigrants’ living conditions (Galeano, Sabater, and Domingo 2015; Martori, Apparicio, and Ngui 2016). Before 1989, immigration to Prague was limited for political reasons and only took off in the 1990s, with most groups coming from other CEE and some Asian countries (Přidalová and Ouředníček 2017). Immigration to Prague grew further after the Czech Republic joined the European Union (EU) in 2004 (Přidalová and Ouředníček 2017). Consequently, the proportion of immigrants in Prague's population correlates with how long it has been an immigrant destination. According to our data (see Data and Methods), 43.6 percent of Sydney's population has an immigrant background. This proportion in Barcelona and Prague is 17.6 and 13.3 percent, respectively.
Immigration history also affects each city's present-day ethnic diversity and approach toward its immigrant populations. Sydney, for example, has a very diverse immigrant population, with a declining number of Europeans and an increasing number of Asians and other groups (Figure A1 in the Online Appendix). While both Europeans and Asians tend to immigrate to Sydney for labor and family reunion reasons, there is also a non-negligible refugee population from Indo-China, the Middle East, and South America (Edgar 2014). Immigrant populations’ long-standing presence in Sydney led to immigration being put on its common policy agenda and enabled immigrants to achieve an “important role in the economic, social, and cultural life of the city” (Hugo 2008, 95). Australia's long-term engagement in promoting equality provides more favorable conditions for immigrant integration than in most other developed countries (Huddleston et al. 2015).
Latin Americans dominated Barcelona's immigrant population until the early 2000s (Figure A2 in the Online Appendix). Although some may have been naturalized and were, thus, not included in Figure A2, there has been clear growth in immigration from other regions since then, creating a heterogeneous immigrant population (Martori and Apparicio 2011). While Latin America (notably, Bolivia, Colombia, Peru, and Ecuador) still forms the largest origin region for immigrants in Barcelona, our data suggest a substantial proportion of Asians (e.g., Chinese and Pakistani), followed by Europeans (notably, Italians, French, and Romanians) and Moroccans in the city. Despite having a shorter history of immigrant settlement than Sydney, Barcelona has been working toward equal rights for immigrants since 1997 (Gebhardt 2016). While immigrants benefit from generally favorable policies aimed at their incorporation into Spanish society, EU citizens and immigrants from countries with historical ties to Spain are in an advantageous position (Huddleston et al. 2015).
The main immigration source countries to Prague have traditionally been former Soviet and CEE countries (Přidalová and Ouředníček 2017). Within these regions, the largest national groups are Ukrainian, Russian, and Slovak citizens (Figure A3 in the Online Appendix). Technically, Slovaks are foreign citizens in the Czech Republic (Šimon, Křížková, and Klsák 2020). However, because of their long shared history, as well as their linguistic and cultural proximity, they are rarely perceived as such (Drbohlav 2003). Immigrants from the post-Soviet region have largely been attracted to the Czech Republic by economic opportunities, which are most abundant in the capital city, Prague (Přidalová and Hasman 2018). Study and, more recently, family reunion represent other reasons for immigration (Ministry of the Interior 2020). Although the number of second-generation immigrants in Prague is increasing, the relatively short history of immigration to the Czech Republic implies that the city's immigrant population still largely consists of first-generation immigrants (Bernard and Mikešová 2014) and can be one of the main reasons for Czech natives’ overall negative attitudes toward the immigrant population (Čermáková and Leontiyeva 2017) and the country's weak policies toward immigrant incorporation, compared to most developed countries (Huddleston et al. 2015). Similar to other EU countries, the Czech Republic applies stricter measures about entry and residence for non-EU citizens (Kušniráková 2014).
Furthermore, notable differences in culture, income, and spatial-economic structure exist between the three cities (Figure 1). Each represents a different cultural-linguistic context: Anglo-Saxon (Sydney), Romance (Barcelona), and Slavic (Prague). The cities also differ in income level, with Sydney being the wealthiest, followed by Barcelona and Prague (Numbeo 2021). In Sydney, the highest income level was observed in the city's eastern coastal parts, with moderate income in the suburbs and the lowest income in the central parts (Figure 1). Conversely, Prague is organized into concentric circles, with building plot prices decreasing with increasing distance from the city center (Figure 1). In Barcelona, the most expensive areas are in a belt from the coast (east) through to the city center and toward the suburban zone, while the least expensive areas are in the north (Figure 1).
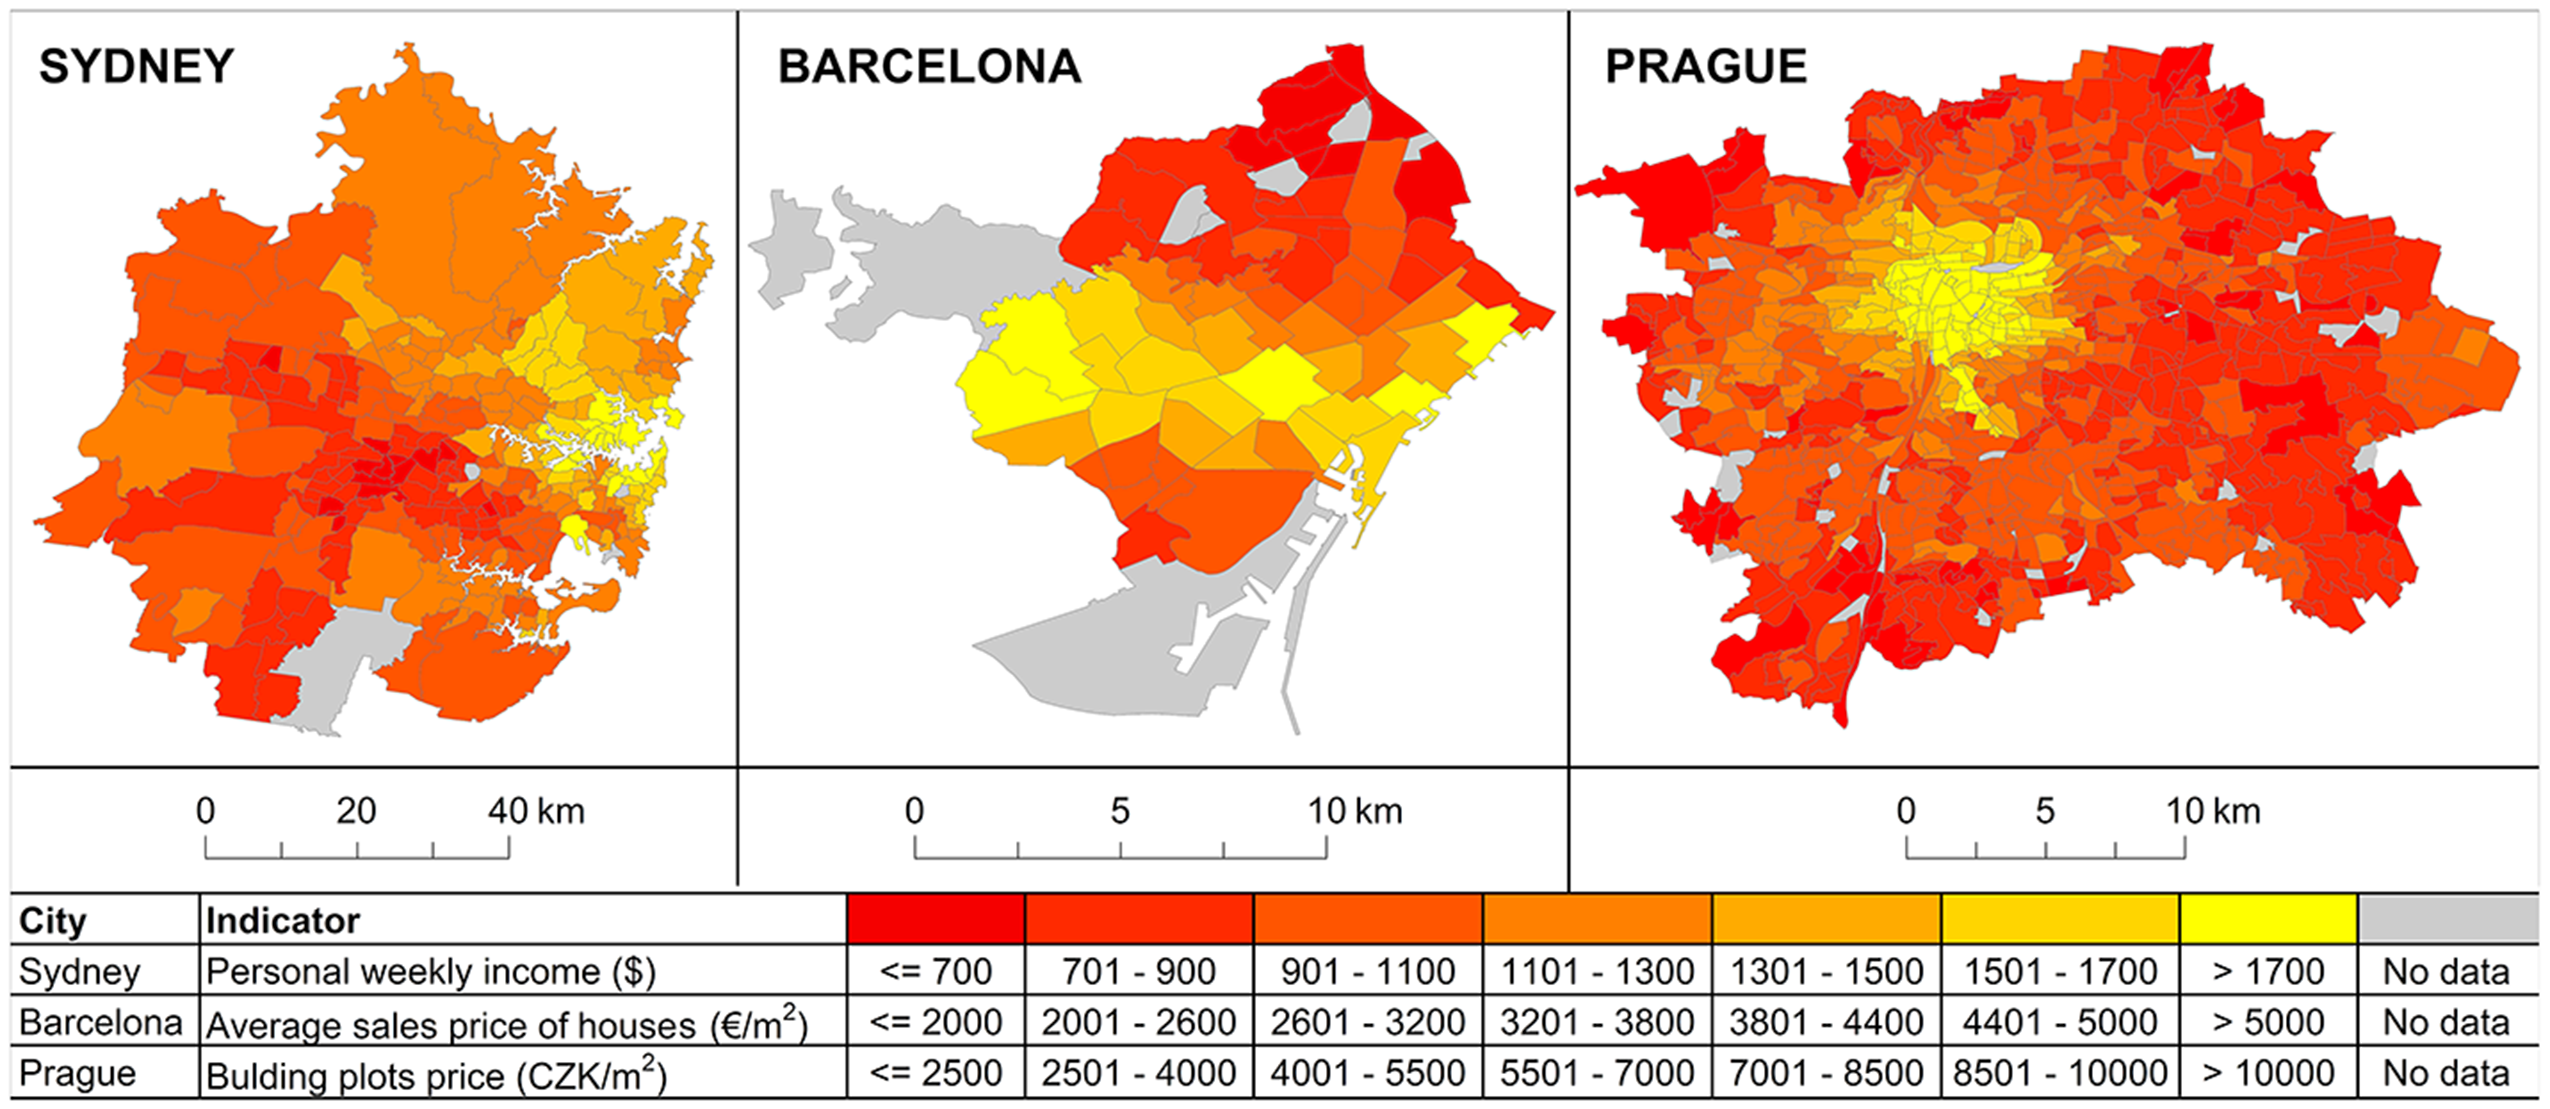
Spatial-economic segmentation of the destination cities.
Data and Methods
Data
We analyzed the most recent and comparable data on the number of immigrants by origin country for the three cities (for detailed information about data and methods, see the Online Appendix). Census data for 2016 were used for Sydney, while data from continuous population registers were used for Barcelona (from 1/1/2017) and Prague (from 31/12/2015). The chosen scale of analysis was driven by the analytical methods, which require as detailed spatial data as possible. However, since the structure of administrative units in each city differs, we could not obtain fully comparable data across all cities. Although census sections in Barcelona and basic settlement units in Prague are similar, smaller statistical areas level 1 units were selected for Sydney. Since there is a higher proportion of immigrants in Sydney, the number of immigrants (and the possibility of detecting spatial patterns) is comparable to that of the other two cities (see Table 1).
Basic Characteristics of the Administrative Units Used in the Analyzes of Immigration Groups’ Spatial Distribution.
Source: Australian Bureau of Statistics, Czech Statistical Office, Instituto Nacional de Estadistica.
Another important issue involved deciding how large immigrant groups 7 should be included in the analysis. Because we aimed to retain the maximum amount of information and achieve the most complex pattern possible, we combined only the smallest groups into regional aggregates and maintained the others, resulting in 143 and 95 groups for Sydney and Prague, respectively. Since the available data for Barcelona were divided into just 54 birth countries/regions, all groups were retained. Although the inclusion of small groups may be disputable, our findings could give rise to recommendations for future research in terms of the appropriate group size for such quantitative analyzes. Moreover, their inclusion adds value, since most existing studies are limited to only a few selected groups (e.g., Peach 1996; Forrest, Poulsen, and Johnston 2006) and, thereby, ignore the complexity of destination societies provided by the presence of multiple groups (Alba and Nee 1997). Furthermore, it would be useful to determine which group analysis brings useful information about immigrant spatial patterns and which does not. Additionally, including most immigrant groups may be beneficial for further case studies by providing basic information about their spatial patterns. However, the inclusion of small groups should be considered when interpreting our results, since we had to adjust our methods to minimize the potential bias caused by the use of these small groups.
To evaluate the role of generational change in immigrant incorporation highlighted by assimilation theories (Alba and Nee 1997), we adopted an alternative approach to the longitudinal and cohort analyzes used most frequently in the incorporation literature (e.g., Forrest, Poulsen, and Johnston 2009; Edgar 2014). Since data on the residential distribution of immigrant group generations in all three cities were unavailable, we collected data on the proportion of the population (excluding children up to 10 years old) residing in the destination city for over 10 years for each immigrant group. We employed the most recent data from the most recent censuses (2016 for Sydney and 2011 for Barcelona) and the population register for Prague. 8
Methods
Given spatial incorporation's supposed multidimensionality, we decided to measure the two dimensions that we considered most important for our analysis: evenness and clustering (as defined by Massey and Denton 1988). Evenness measures the concentration of immigrant group members in localities, regardless of their location. Since the level of incorporation is highly scale dependent (Johnston et al. 2016) and since we used very detailed data, we can capture evenness at the finest level. Conversely, clustering quantifies whether localities with an overrepresentation of one immigrant group have members clustering together; thus, clustering can also detect concentration at a higher spatial level. Both measures may be, but are not necessarily, correlated.
Measures of evenness are generally numerous and highly intercorrelated (Massey and Denton 1988), as was the case for our data (Table A3 in the Online Appendix). Moreover, evenness measures are strongly correlated with group size. This issue, often neglected in the segregation literature (e.g., Peach 1999, c.f., Johnston et al. 2017), was even more severe in our analysis, since we also analyzed small groups whose spatial distribution must be highly uneven because they can only live in relatively few localities (Manley, Jones, and Johnston 2019). Thus, we have taken this dependance into account as follows. For each group i, we calculated a standard Gini coefficient weighted by the localities’ population size. To remove the influence of group size on the coefficient, we used a regression analysis to model the relationship between the Gini coefficient and group size for each city. The computed regression residuals (RGi), then, allowed us to determine the true evenness of groups i independent of their representation in each city. Positive values imply that group members are more concentrated than would be expected based on group size. For simplicity (and to obtain a similar interpretation to the clustering measure), RGi is considered an indicator of unevenness (rather than evenness).
To assess the degree of clustering, we calculated Moran's I, one of the most widely used indicators of spatial autocorrelation (Cliff and Ord 1973). Its value is bounded between −1 and 1. Positive values denote the clustering of localities with a high share of group i, while negative values correspond to a situation (albeit improbable) in which localities with a high share are adjacent to localities with a low share. Finally, values near zero imply the absence of a spatial pattern in the distribution of group i across localities. Pearson's correlations (Table A3 in the Online Appendix) indicate a moderate relationship between clustering measure Ii and unevenness measure RGi, thereby confirming that both assess different aspects of incorporation.
To test the possible spatial aspect of segmented assimilation theory, we evaluated whether (and to what extent) different groups are concentrated in different localities while considering the location of such concentrations and the groups’ length of stay in each destination city. We computed the symmetric Dice coefficient Di,j, which measures the so-called spatial relatedness of two immigrant groups and corresponds to the probability that one group is concentrated in a locality in which a second group is also concentrated (Novotný and Hasman 2015). In contrast to the index of dissimilarity, which can also compare the two groups’ spatial distribution, Di,j is much less dependent on group size (Table A3 in the Online Appendix). Di,j values were used to visualize the patterns of immigrant groups’ spatial structure in each city as an undirected network, where nodes represent particular groups and edges refer to the spatial relatedness between these groups. Groups are colored based on their region (Figure A4 in the Online Appendix), and their labels correspond to their respective International Organization for Standardization country codes. Node sizes correspond to the square root of groups’ population size and node shapes to the proportion of immigrants with lengths of stay greater than 10 years: groups with a proportion over 80 percent are denoted by a circle, while those with 60–79.9 percent by an octagon, 40–59.9 percent by a hexagon, 20–39.9 percent by square, and those below 20 percent by a triangle. Such a network can be considered analogous to a physical system in which nodes (immigrant groups) attract one another by forces proportional to their pairwise relatedness (Di,j). This visualization enables us to evaluate comprehensively the patterns of immigrant groups’ spatial structure in each city and to determine which groups may have mutually distinct spatial distributions (and be segmented in different parts of each city). Consideration of whether immigrant groups are predominantly clustered by color or by shape in the resulting visualizations allows us to assess whether regional origin (i.e., cultural and economic proximity) or length of stay is the more important driver of their spatial incorporation. Finally, groups’ spatial distributions were compared using map outputs obtained from the Local Indicators of Spatial Association (LISA) analysis, which indicates clusters of localities with a high (or low) representation of a given group (Anselin 1995).
Results
The structure of this section corresponds to the three hypotheses introduced in “Research Hypotheses and Expectations”. Based on spatial assimilation theory, we start by comparing levels of unevenness and clustering related to immigrant groups’ characteristics and destination cities’ contexts. In the second part, we verify whether different groups are concentrated in different spatial segments of the cities, a pattern which would indicate a geographical aspect in segmented assimilation theory.
Differences in the Levels of Incorporation Across Immigrant Groups and Destination Cities
Figure 2 compares the values of unevenness (horizontal axis) and clustering (vertical axis) in the three analyzed cities. We begin with the methodological issue of small group analysis. In Sydney, many groups clustered together in a small part of the graph, where values approach zero. This cluster predominantly consists of groups of up to 3,900 members (no groups had an absolute RGi value greater than 0.02, and only Mongolians, Ukrainians, and Israelis had moderate Moran's I values). This finding indicates that detailed data for Sydney did not allow us to measure the level of spatial incorporation for groups with fewer than 3,900 members, which were, thus, omitted from Figure 2. This issue plays a minor role in Barcelona and Prague, where larger administrative units were used. However, for the sake of readability, the smallest groups (up to 180 members) were omitted from Figure 2 for Prague.
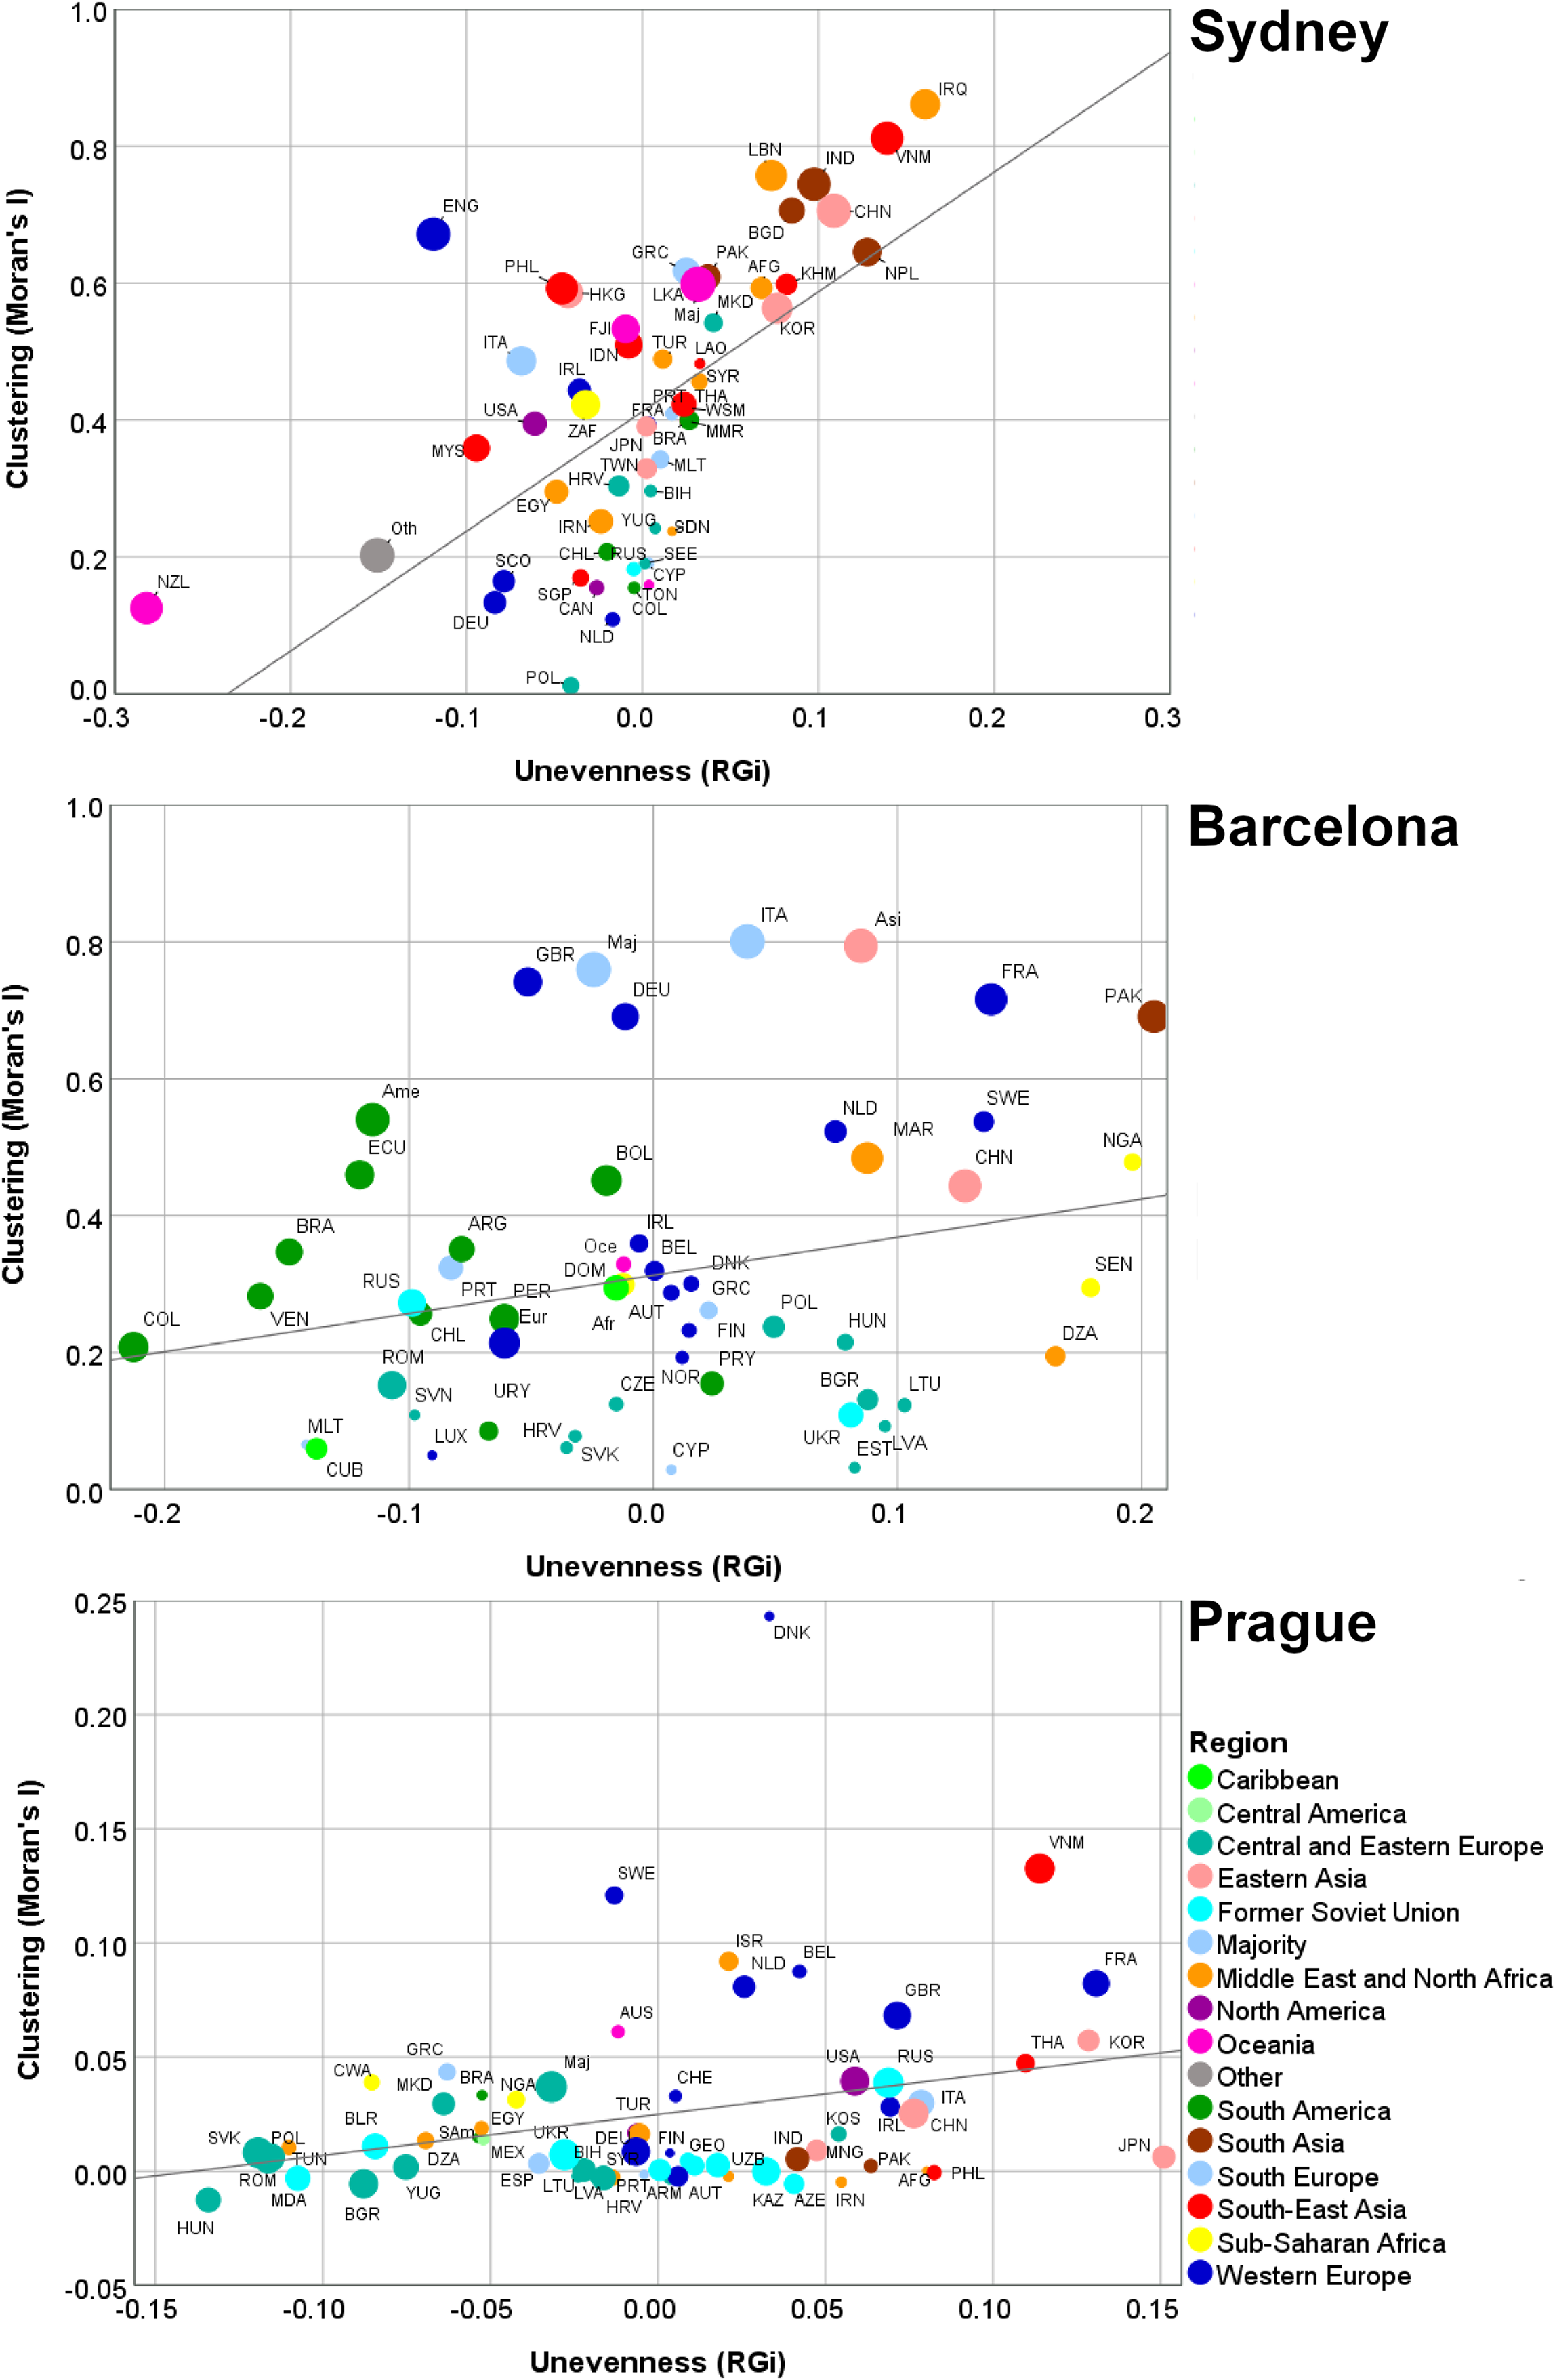
Unevenness and clustering of immigrant groups in Sydney, Barcelona, and Prague.
The first finding from Figure 2 is that there is a relatively weak link between unevenness and clustering, since these dimensions of incorporation were strongly correlated only in Sydney. This correlation was affected by several European groups (e.g., British, German, and Italian) showing very high clustering but only average unevenness in Barcelona, while a generally very low level of clustering was detected for nearly all groups in Prague. Second, patterns of immigrant incorporation differ between cities, particularly for groups with the highest incorporation levels, which include immigrants from Western Europe in Sydney, from Latin America in Barcelona, and from CEE countries in Prague. These groups are culturally (and especially linguistically) related to the majority groups, which confirms language's key role in spatial incorporation (Zhou 1997; Iceland and Nelson 2008) and disputes the importance of economic proximity since groups from Latin America and CEE are at a lower economic level than the majorities in Barcelona and Prague, respectively. The greater incorporation of Latin American groups, compared to African ones, in Barcelona can partly be explained by internal migration (Sabater and Massey 2015), which decreases Latin American groups’ segregation while increasing that of African groups. Sabater and Massey (2015) explain such different trajectories by social networks and language proficiency. Nevertheless, levels of spatial unevenness of African groups remained moderate in Barcelona.
On the other hand, groups with the highest levels of spatial unevenness in all three cities included immigrants from East, South, and Southeast Asia (Figure 2). Since these groups are culturally distant from the majority population in all three cities, we could not distinguish whether their high unevenness stemmed from their cultural distance from the majority or their “typical” characteristics (i.e., popular public beliefs about Asians’ minimal social, civic, and cultural integration are discussed by Forrest et al. 2017). While analyzes of immigrant spatial patterns in Asian cities would help resolve which of the suggested reasons is more plausible, we found no such studies. These results again question the role of economic proximity, since the groups with the highest unevenness came from both high-income (e.g., Japan and South Korea) and low-income (e.g., Pakistan and Vietnam) Asian countries. However, the highest values of both unevenness and clustering in Sydney were observed for groups with a large proportion of refugee-humanitarian settlers (e.g., Iraq, Vietnam, Lebanon, Cambodia, Afghanistan, and Macedonia). Residential choices for such groups are constrained by the strong need for social networks and low economic means (Hugo 2011), which makes them eligible for public sector housing in selected areas of Sydney (Johnston et al. 2016).
The third interesting finding from Figure 2 concerns groups from high-income European countries. Although their high clustering in Sydney is related only to the English, this trend occurs much more often in Barcelona and especially in Prague, where groups from high-income countries also report relatively high unevenness. However, this finding is apparently not a case of marginalization (typical for vulnerable groups) but, rather, of separation to more attractive localities, as defined in Berry’s (1997) typology of acculturation strategies. 9
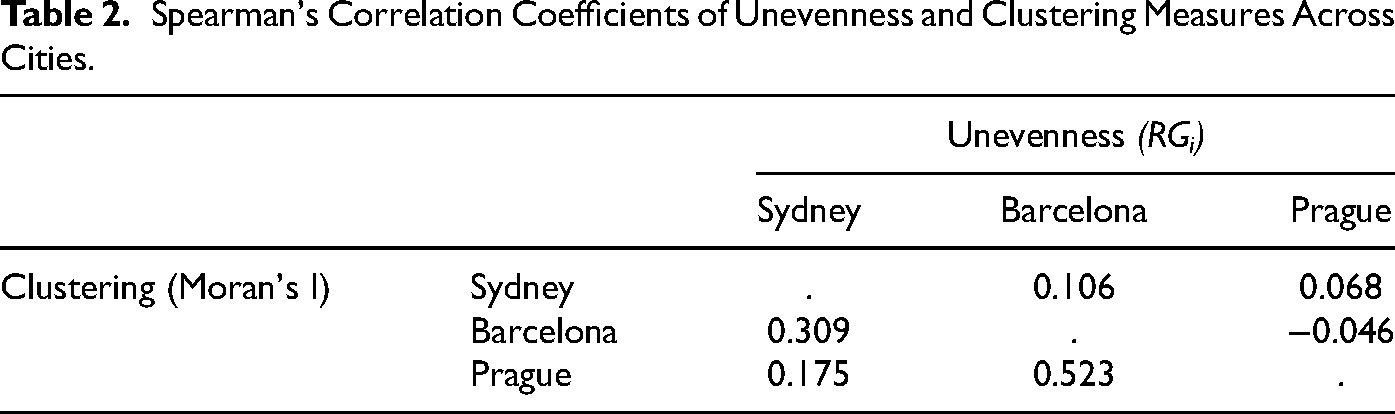
A comparison of spatial unevenness in the three cities (Figure 2) indicates the different positions of certain groups, depending on the destination cities’ context. For example, CEE groups’ unevenness is high in Barcelona, moderate in Sydney, and low in Prague, while South American groups are distributed much more unevenly in Sydney than in Barcelona. The dependance of immigrant incorporation measures on city context is also documented in Table 2, which shows only weak correlations of clustering and especially unevenness of individual immigrant groups across cities. These weak correlations suggest the plausibility of our second hypothesis that large differences exist between groups’ incorporation across cities: certain groups are highly spatially incorporated in some cities and less so in others. Thus, spatial incorporation was not only group specific but also moderated by geographical context. However, spatial incorporation may also depend on the length of stay, as is discussed in the following section.
Spearman's Correlation Coefficients of Unevenness and Clustering Measures Across Cities.
Spatial Segmentation of Immigrant Groups
The previous section showed that levels of spatial incorporation varied greatly between immigrant groups. However, it did not reveal whether immigrant groups were spatially segmented within different parts of a city. Therefore, we created network visualizations and, then, displayed the spatial distribution of selected groups via LISA analysis. When visualizing Sydney's immigration pattern, we also had to deal with the issue of small groups. After omitting the weakest edges (with the lowest Di,j values), all groups under 640 members disappeared. Since other small groups were only weakly connected, retaining groups with over 3,900 members proved most effective.
Most tight clusters in the visualization (Figure 3) consist of nodes that share a common color (i.e., regional origin) rather than shape (i.e., average length of stay). This finding suggests a very high segmentation of immigrant groups in the same parts of the city based on their regional membership, regardless of their average length of stay. Thus, cultural proximity played a greater role than the length of stay for immigrant segmentation in Sydney. Western European and North American groups were most adjacent to the majority, indicating that these economically and culturally proximate groups were concentrated in the same parts of Sydney as the majority, especially in the outer and most affluent districts (Figure 1). However, not all of these groups were characterized by the longest length of stay. While some groups, like the English, exhibited low unevenness at the micro level, they may cluster tightly (see Figure 2 and the LISA map in Figure 4), implying that their concentration at the higher spatial level is relatively considerable (Johnston et al. 2016).
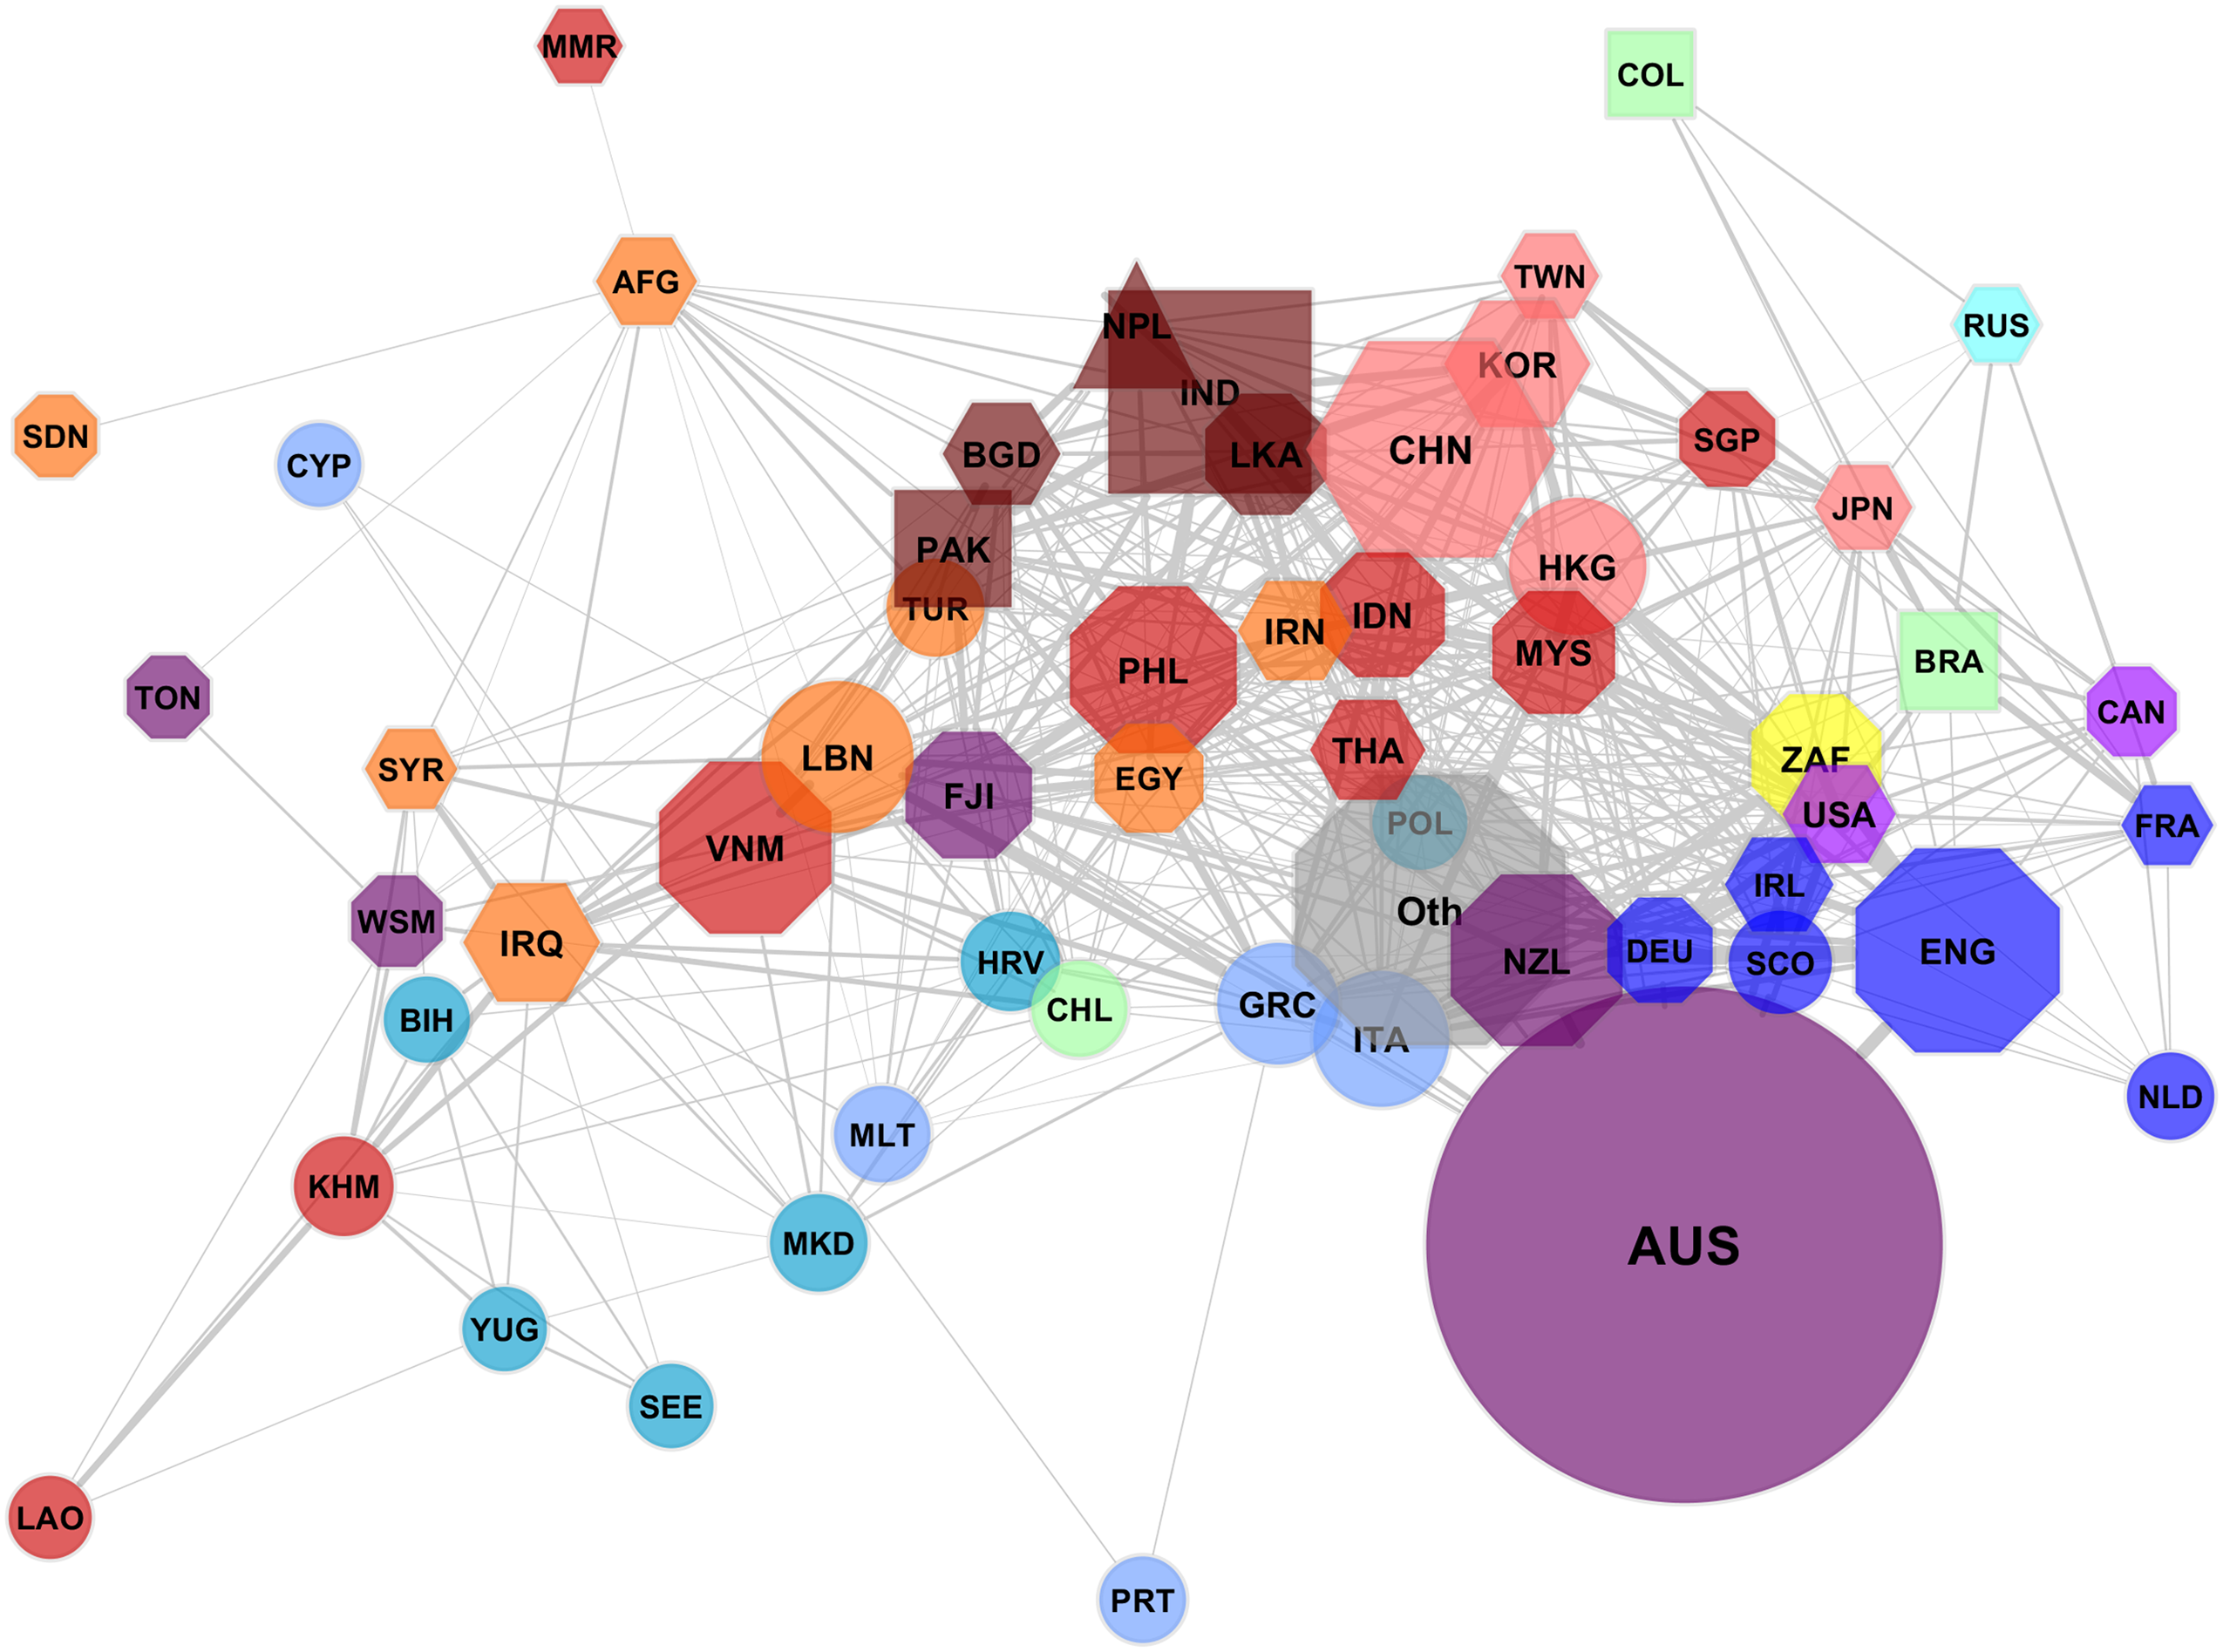
Spatial relatedness network of population groups in Sydney.
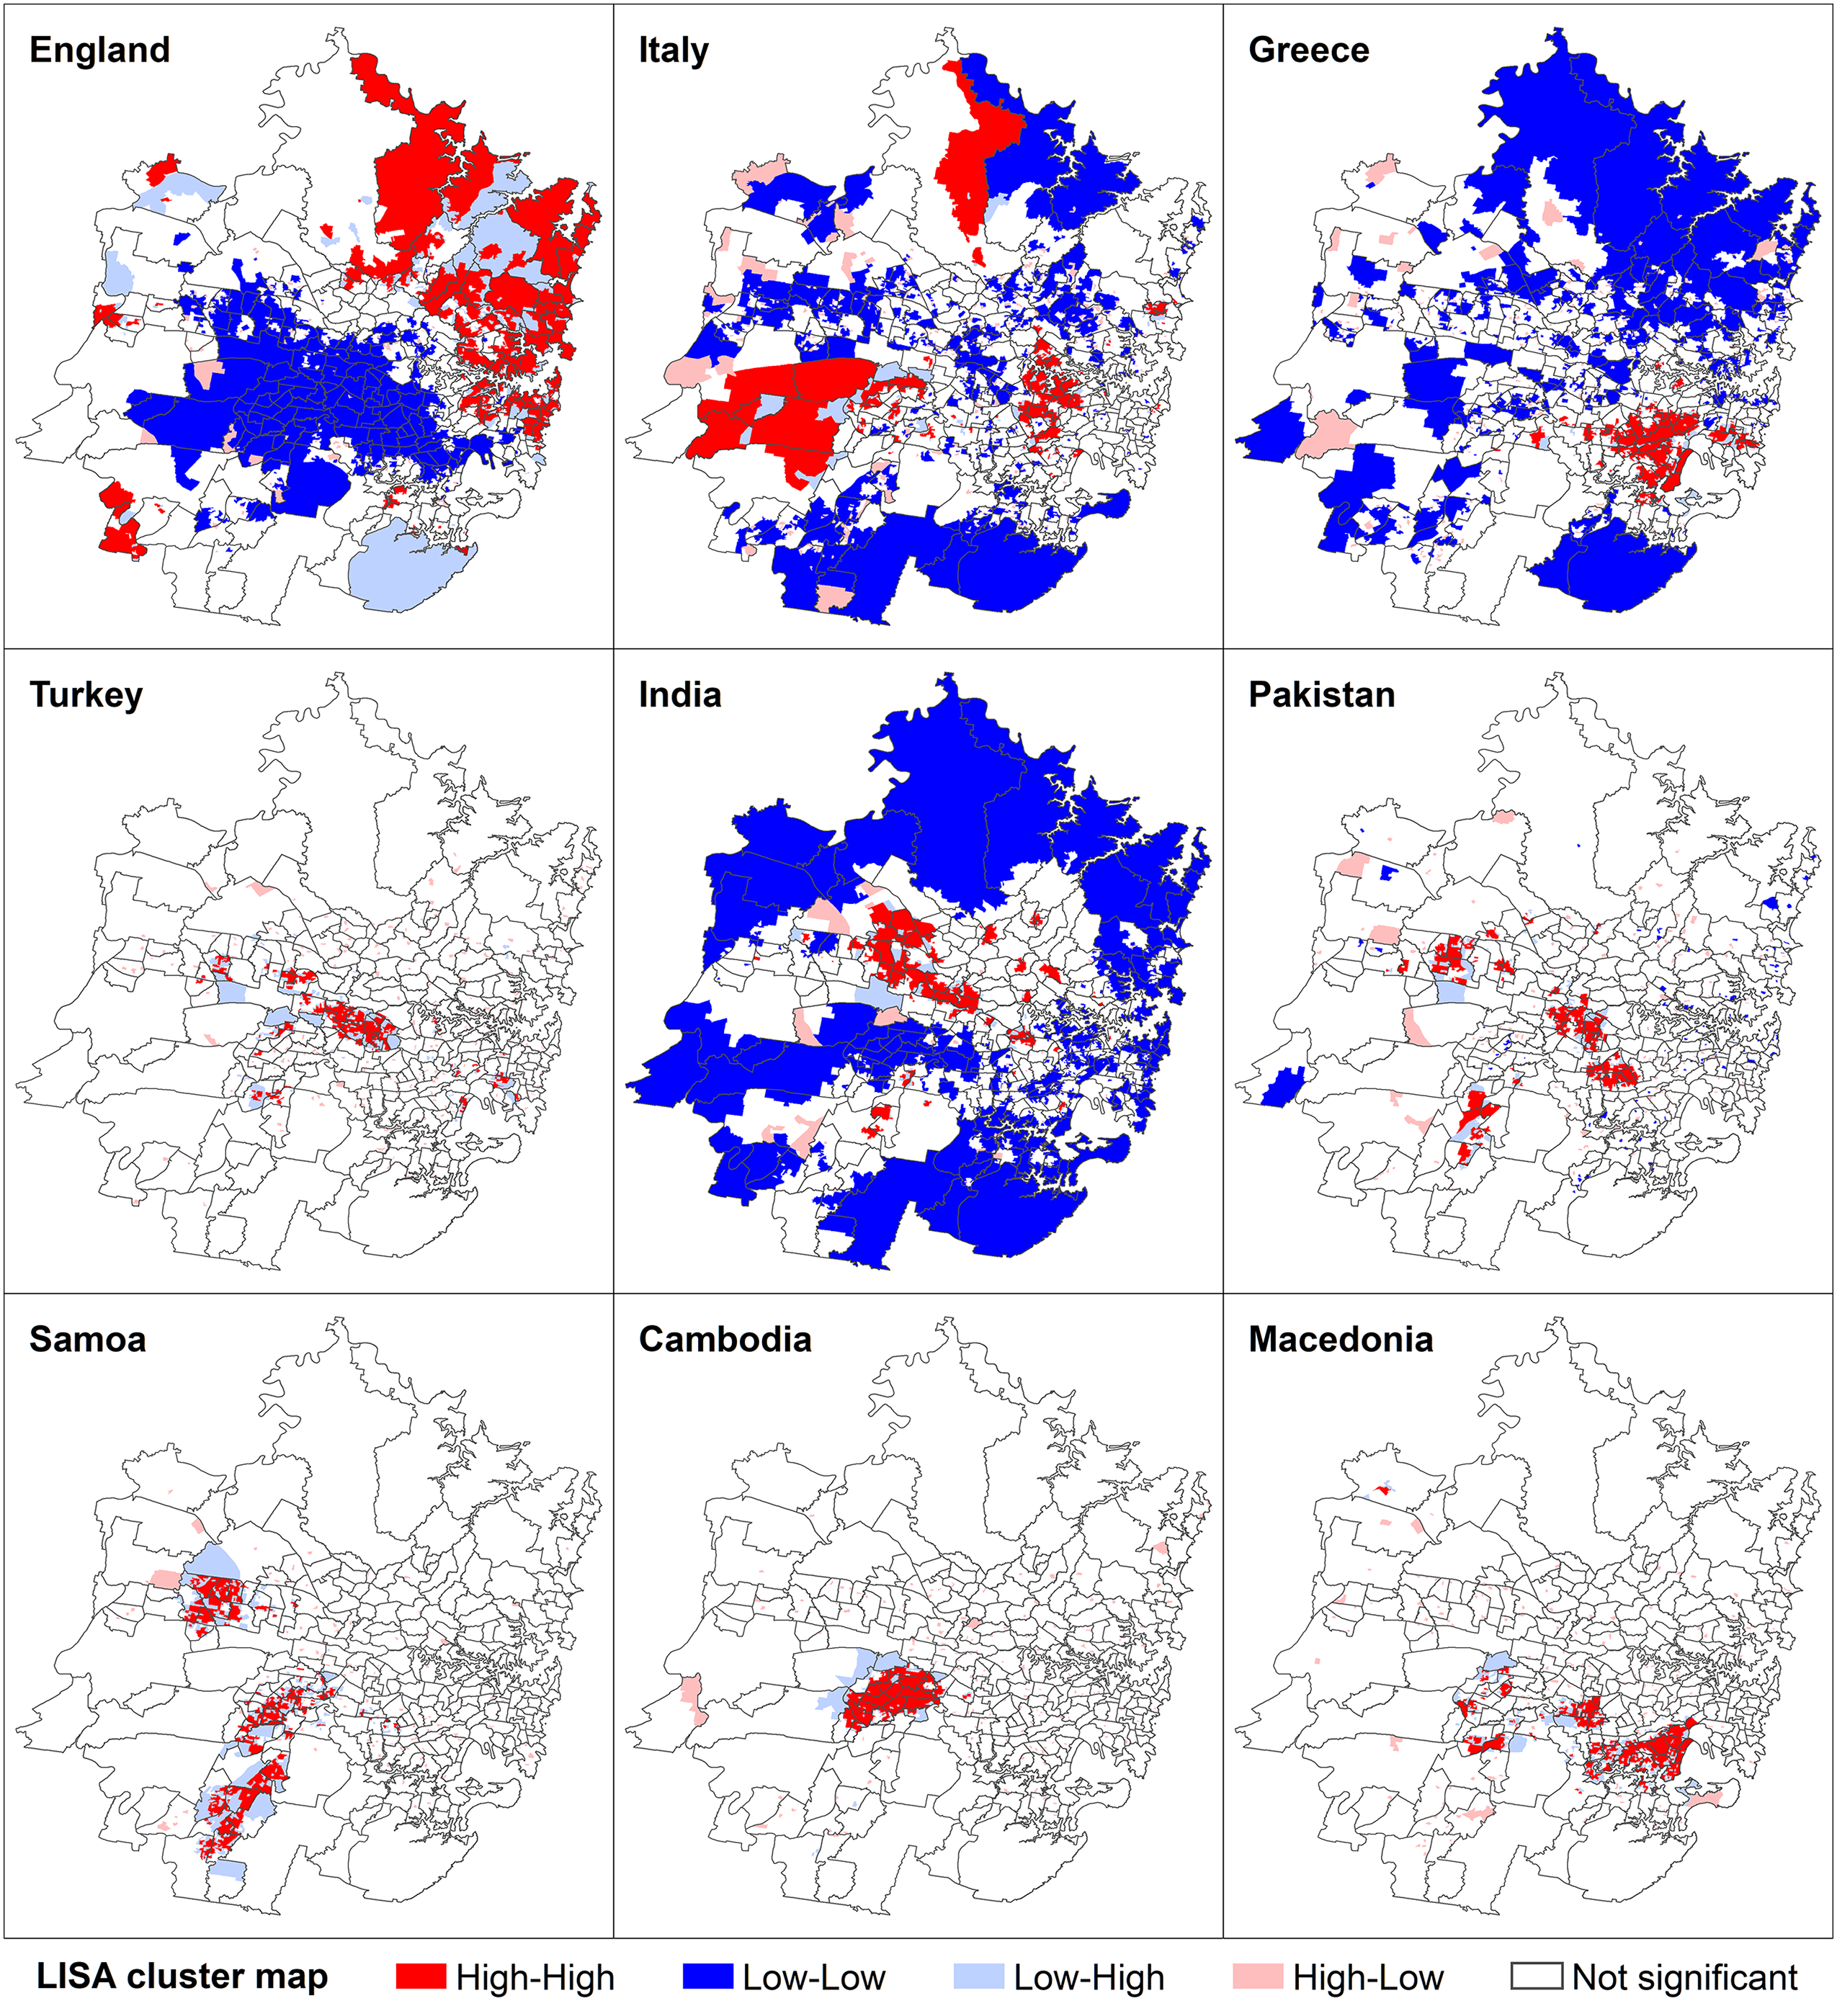
Maps of spatial clustering for selected immigrant groups in Sydney.
The placement of the other immigrant groups in the visualization corresponds to their immigration histories (see Hugo 2011), as different parts of Sydney were settled during different eras. Southern Europeans played an important role in immigration to Australia during the late 1950s (Forrest, Poulsen, and Johnston 2006). While Italians seem more incorporated, since some moved to Sydney's suburbs (see Figure 2), Greeks mostly stayed in the city's less affluent south-central parts near Botany Bay. Mediterranean groups arriving in Australia in the 1960s (e.g., Turks or Lebanese) settled further from the coast in neighborhoods with the lowest mean personal income (Figure 1). Asian groups that arrived from the 1970s onwards are at the top of the visualization, since they are highly concentrated in one (e.g., Indians) or several clusters (e.g., Pakistanis and Chinese) that are mostly further to the northwest. Relatively recent groups (e.g., Samoans) are located in the outer parts of both Sydney and Figure 3. These results are interesting, since they imply that while groups with longer histories (and longer stays) are concentrated in different parts of the city, they are not necessarily more spatially incorporated (see Figure 2, or their position far from the majority in Figure 3). We, thus, confirm the findings of Johnston et al. (2017) that second- or third-generation immigrants are often no less segregated than those of the first generation.
Groups containing refugee-humanitarian settlers can be found together in the left part of the visualization, since they are concentrated in western Sydney (e.g., the Cambodians in Figure 4). Therefore, they remain unincorporated, despite a high average length of stay. Interestingly, the map indicates that some Macedonians are concentrated in the “refugee” area in western Sydney and some near the coast, which is consistent with their location in Figure 3 (i.e., between Cambodia and Greece).
Similarly, immigrant spatial incorporation in Barcelona seems to be driven by group cultural and linguistic similarity, rather than by length of stay in Spain. Figure 5 shows a few clear regional clusters formed by individual country groups with varying lengths of stay; for example, similar segmentation was observed for German and Swedish immigrants, 49.4 and 17.4 percent of whom had resided in Spain for over 10 years, respectively. Considering the question of cultural proximity to the majority, 10 it is unsurprising that groups from Latin America were the most proximate in the network visualization for Barcelona, despite their short length of stay. However, these groups largely consisted of immigrants from lower-income countries (e.g., Bolivia, the Dominican Republic, and Paraguay; see Figure 5) who were most dispersed across the city and, thus, proximate to the majority. Interestingly, Latin Americans were accompanied by Romanians, who are of the same language family as the majority (Figure 2 also confirms their high spatial incorporation).
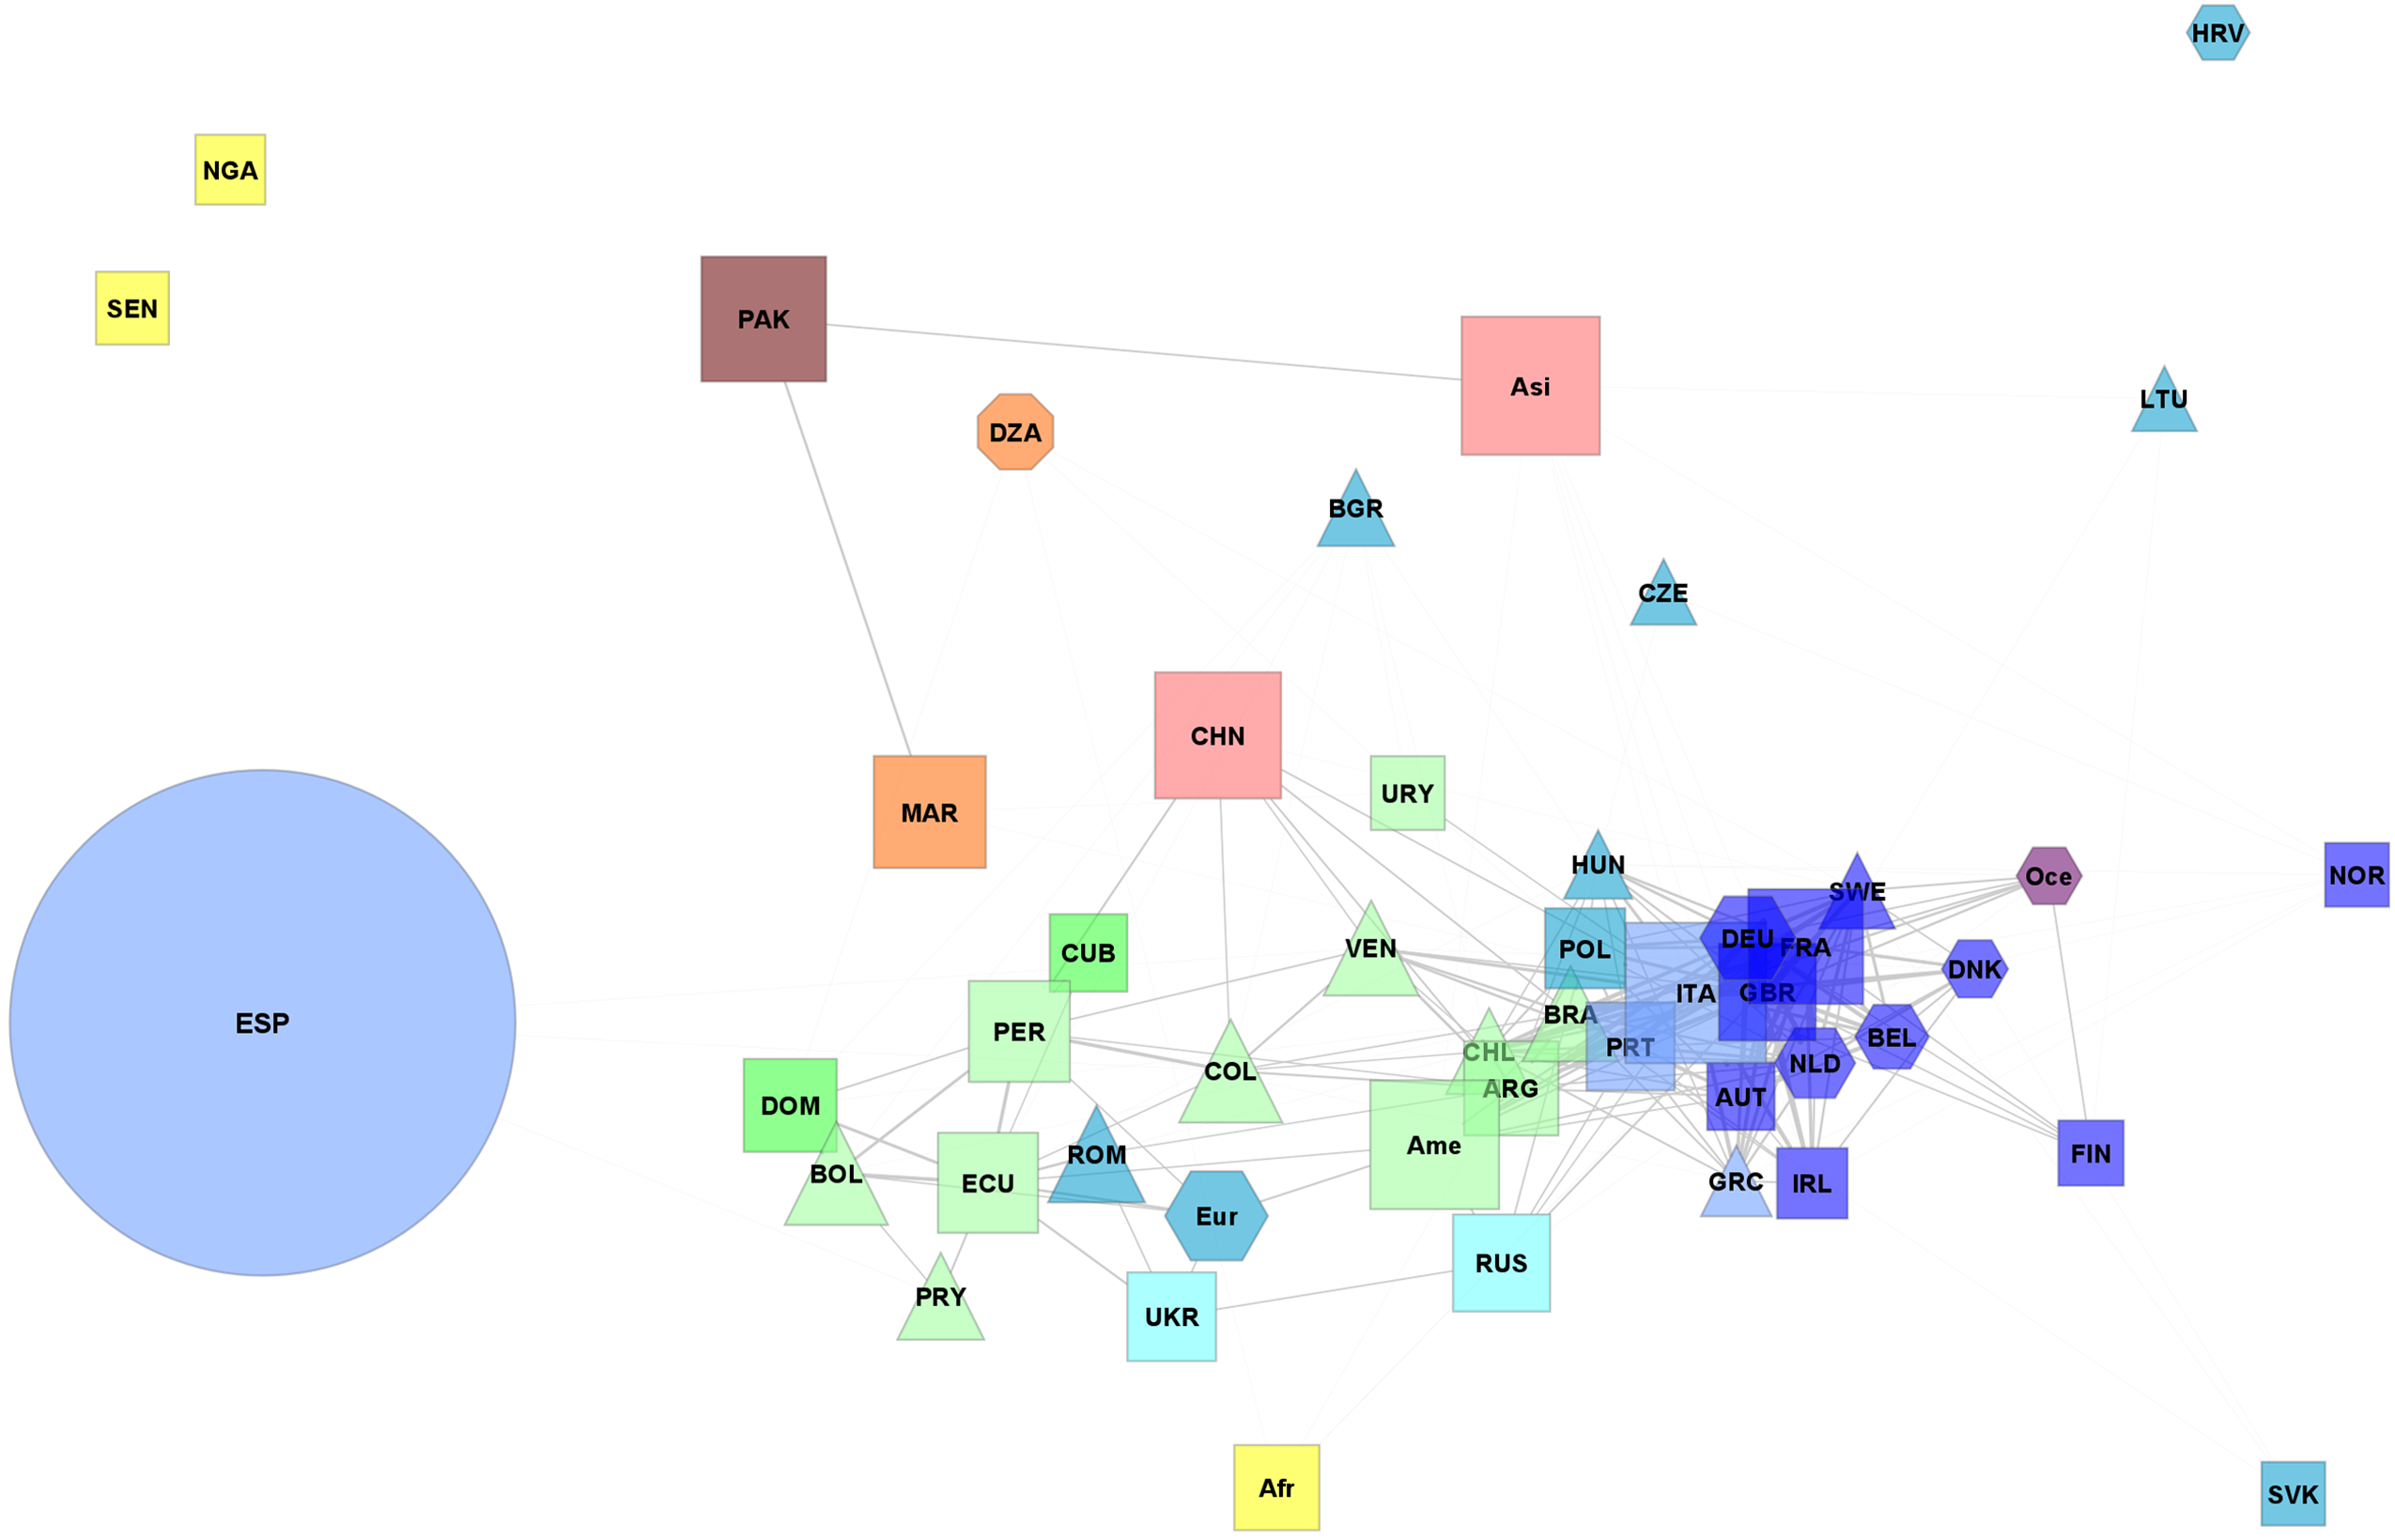
Spatial relatedness network of population groups in Barcelona.
The right side of Figure 5 contains groups from northwest Europe that were mostly concentrated in the belt of more attractive localities (see Musterd and Fullaondo 2008). To the farthest right, we can find small groups like Finns and Norwegians, who were highly concentrated in the Port of Barcelona and eastern suburbs. Larger groups (e.g., Germans and French) were concentrated more to the left part of Figure 5, since they were dispersed over the whole belt of attractive localities (Figure 1), such as the central business district, where the concentration of high-income communities is related to gentrification (Garcia–Lopez, Nicolini, and Roig 2020). This finding again confirms more affluent groups’ specific residential choices and separation from the majority. Despite their low unevenness (Figure 2), the remaining groups from Latin America (e.g., Argentinians, Brazilians, and Chileans) were relatively highly clustered with Southern European groups in the coastal areas of the old town (i.e., Ciutat Vella and Barceloneta) and surrounding areas (and in the central part of Figure 5).
Groups from Islamic countries (i.e., Algerians, Moroccans, and Pakistanis) were located around El Raval's mosques south of the city center, an area characterized by low-cost rental housing (Musterd and Fullaondo 2008) and most of Barcelona's ethnic enclaves (Galeano, Sabater, and Domingo 2015). Other Asian and African groups were also placed in a distinct (top-left) part of the visualization, implying that their residential locations were different from those of other groups. Asians and Africans concentrated in specific parts of Barcelona—either in the center (Chinese) or on the outskirts (especially Nigerians and Senegalese), particularly in northern Barcelona, where rent is low (Figure 1) and where some Latin American immigrant groups (i.e., Ecuadorians, Dominicans) were also partly present. These findings indicate that although low levels of unevenness and a position in the visualization near the majority indicate Latin Americans’ high incorporation, the real situation is more complex and cultural/linguistic proximity is not a panacea. While most Latin Americans were well incorporated into the majority population, a substantial proportion also clustered in either more (see Argentinians above) or less affluent areas (Figure 6).
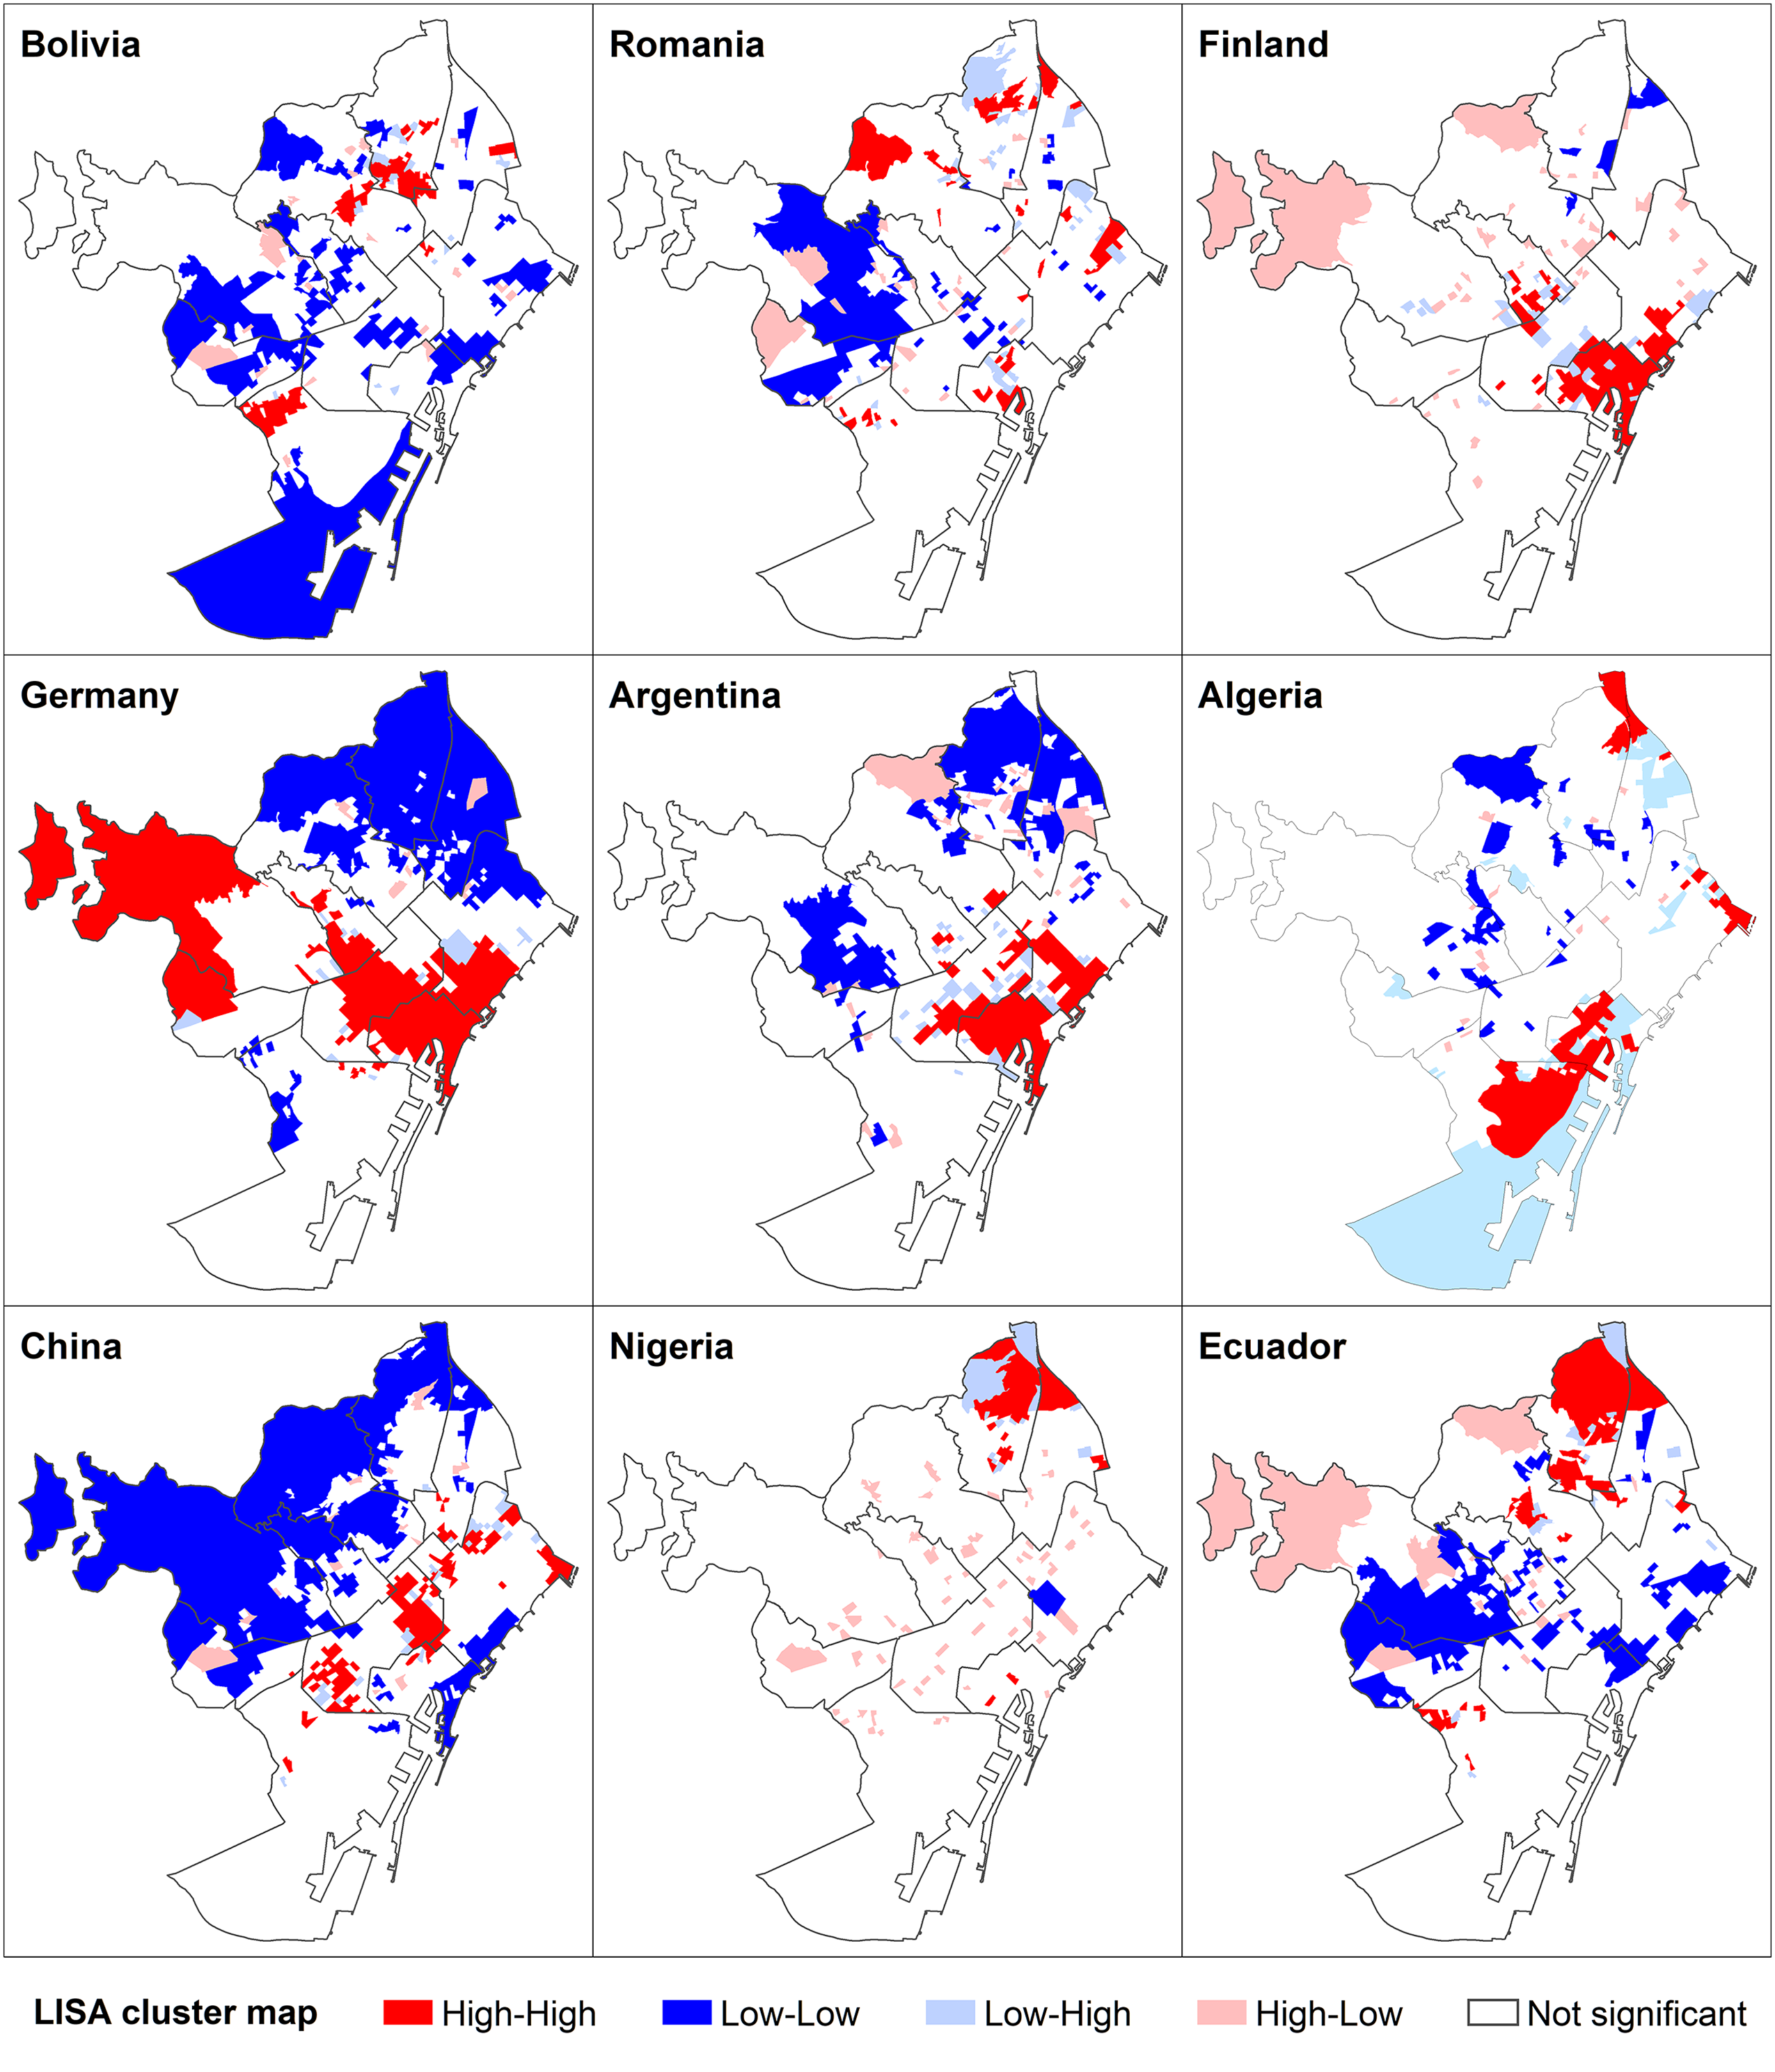
Maps of spatial clustering for selected immigrant groups in Barcelona.
Once again, using only groups with over 180 people proved to be efficient for creating a network visualization for Prague (Figure 7). The first crucial observation is that the majority population was so spatially distinct from other groups that it could not be displayed in the visualization. Such low spatial relatedness may be caused by the rather low segmentation of immigrant groups, which usually co-locate in relatively few localities, resulting in a below-average share of the majority population when compared to their proportion in Prague as a whole. Nonetheless, some segmentation of immigrant groups is evident. Again, immigrant groups’ segmentation apparently stemmed from regional similarities rather than from their length of stay (Figure 7). For instance, immigrants from Macedonia and Bosnia showed very similar residential patterns (see also Columby 2020), despite the very different share of immigrants staying in Prague for over 10 years (16.3 percent of Macedonians compared to 41 percent of Bosnians). Groups from CEE and post-Soviet countries are on the left side of Figure 7. They were the most dispersed groups (see Slovaks and Ukrainians, the two largest groups, in Figure 8) and had the relatively highest spatial relatednesses to the majority. Since they are mostly Slavic (and, thus, linguistically most proximate to the majority), these observations are in line with earlier results from Přidalová and Ouředníček (2017) and confirm our expectation about the role of cultural proximity between the majority population and immigrant groups, as introduced within our first hypothesis.
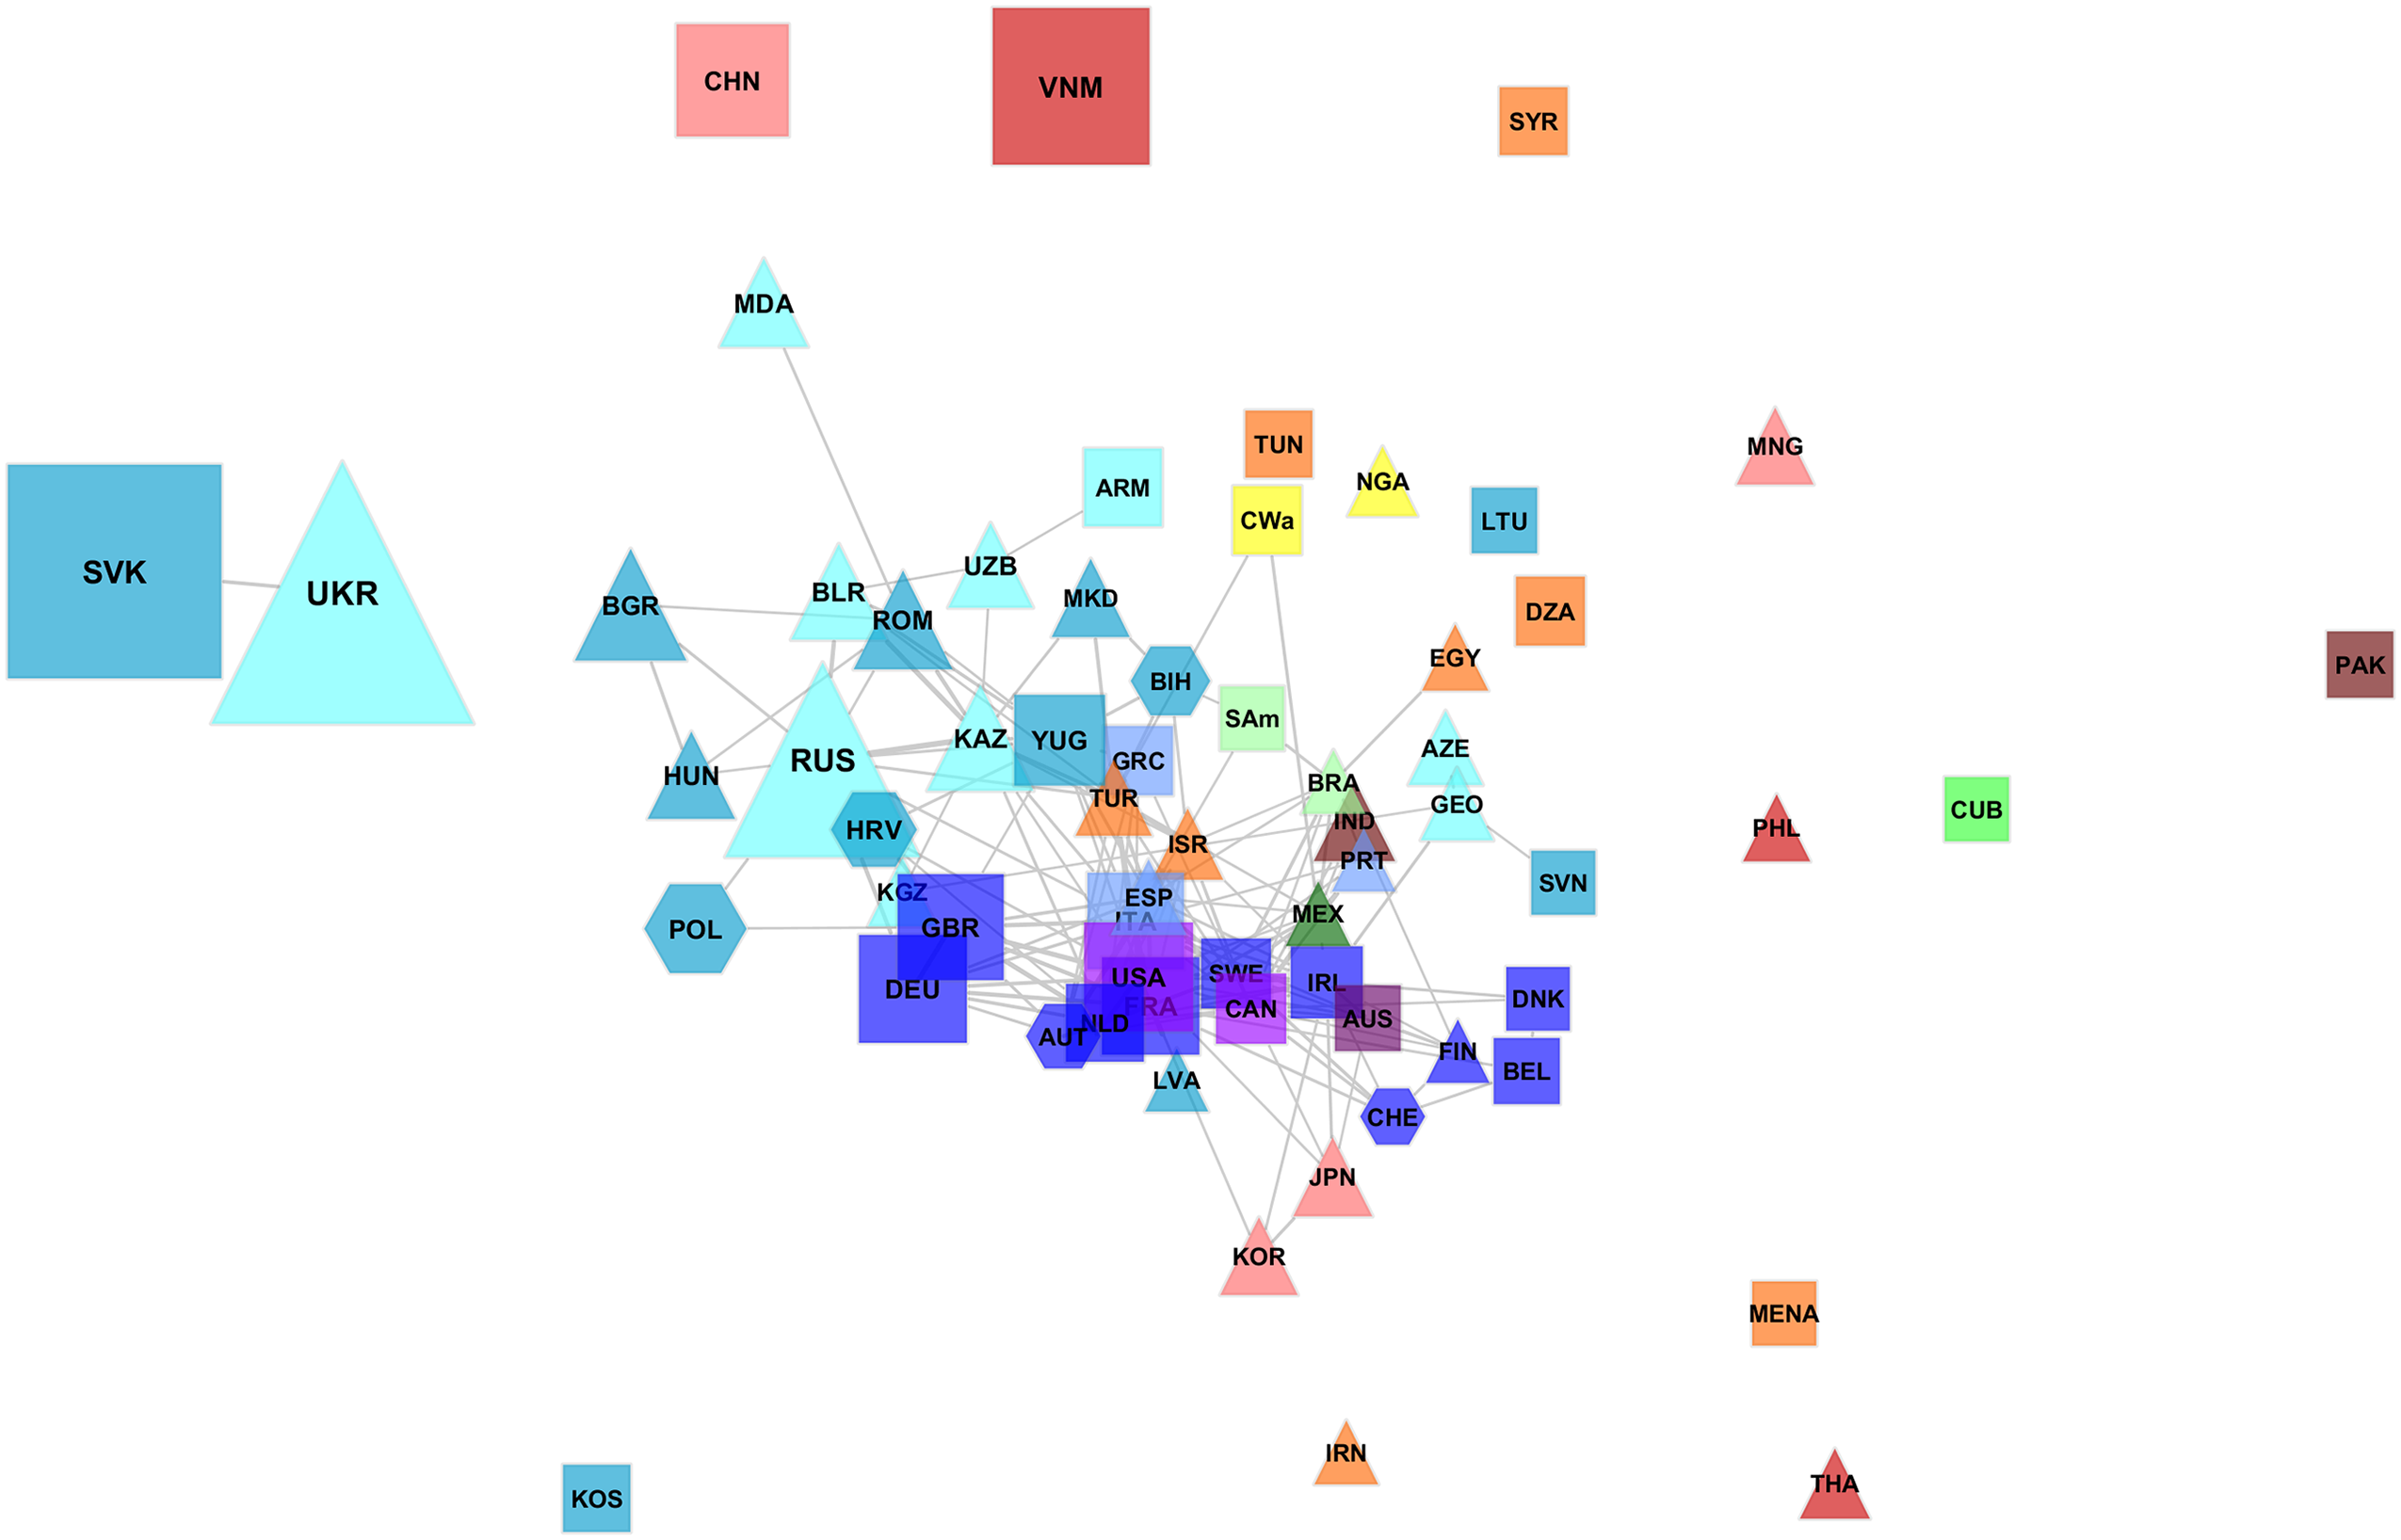
The spatial relatedness network of population groups in Prague.
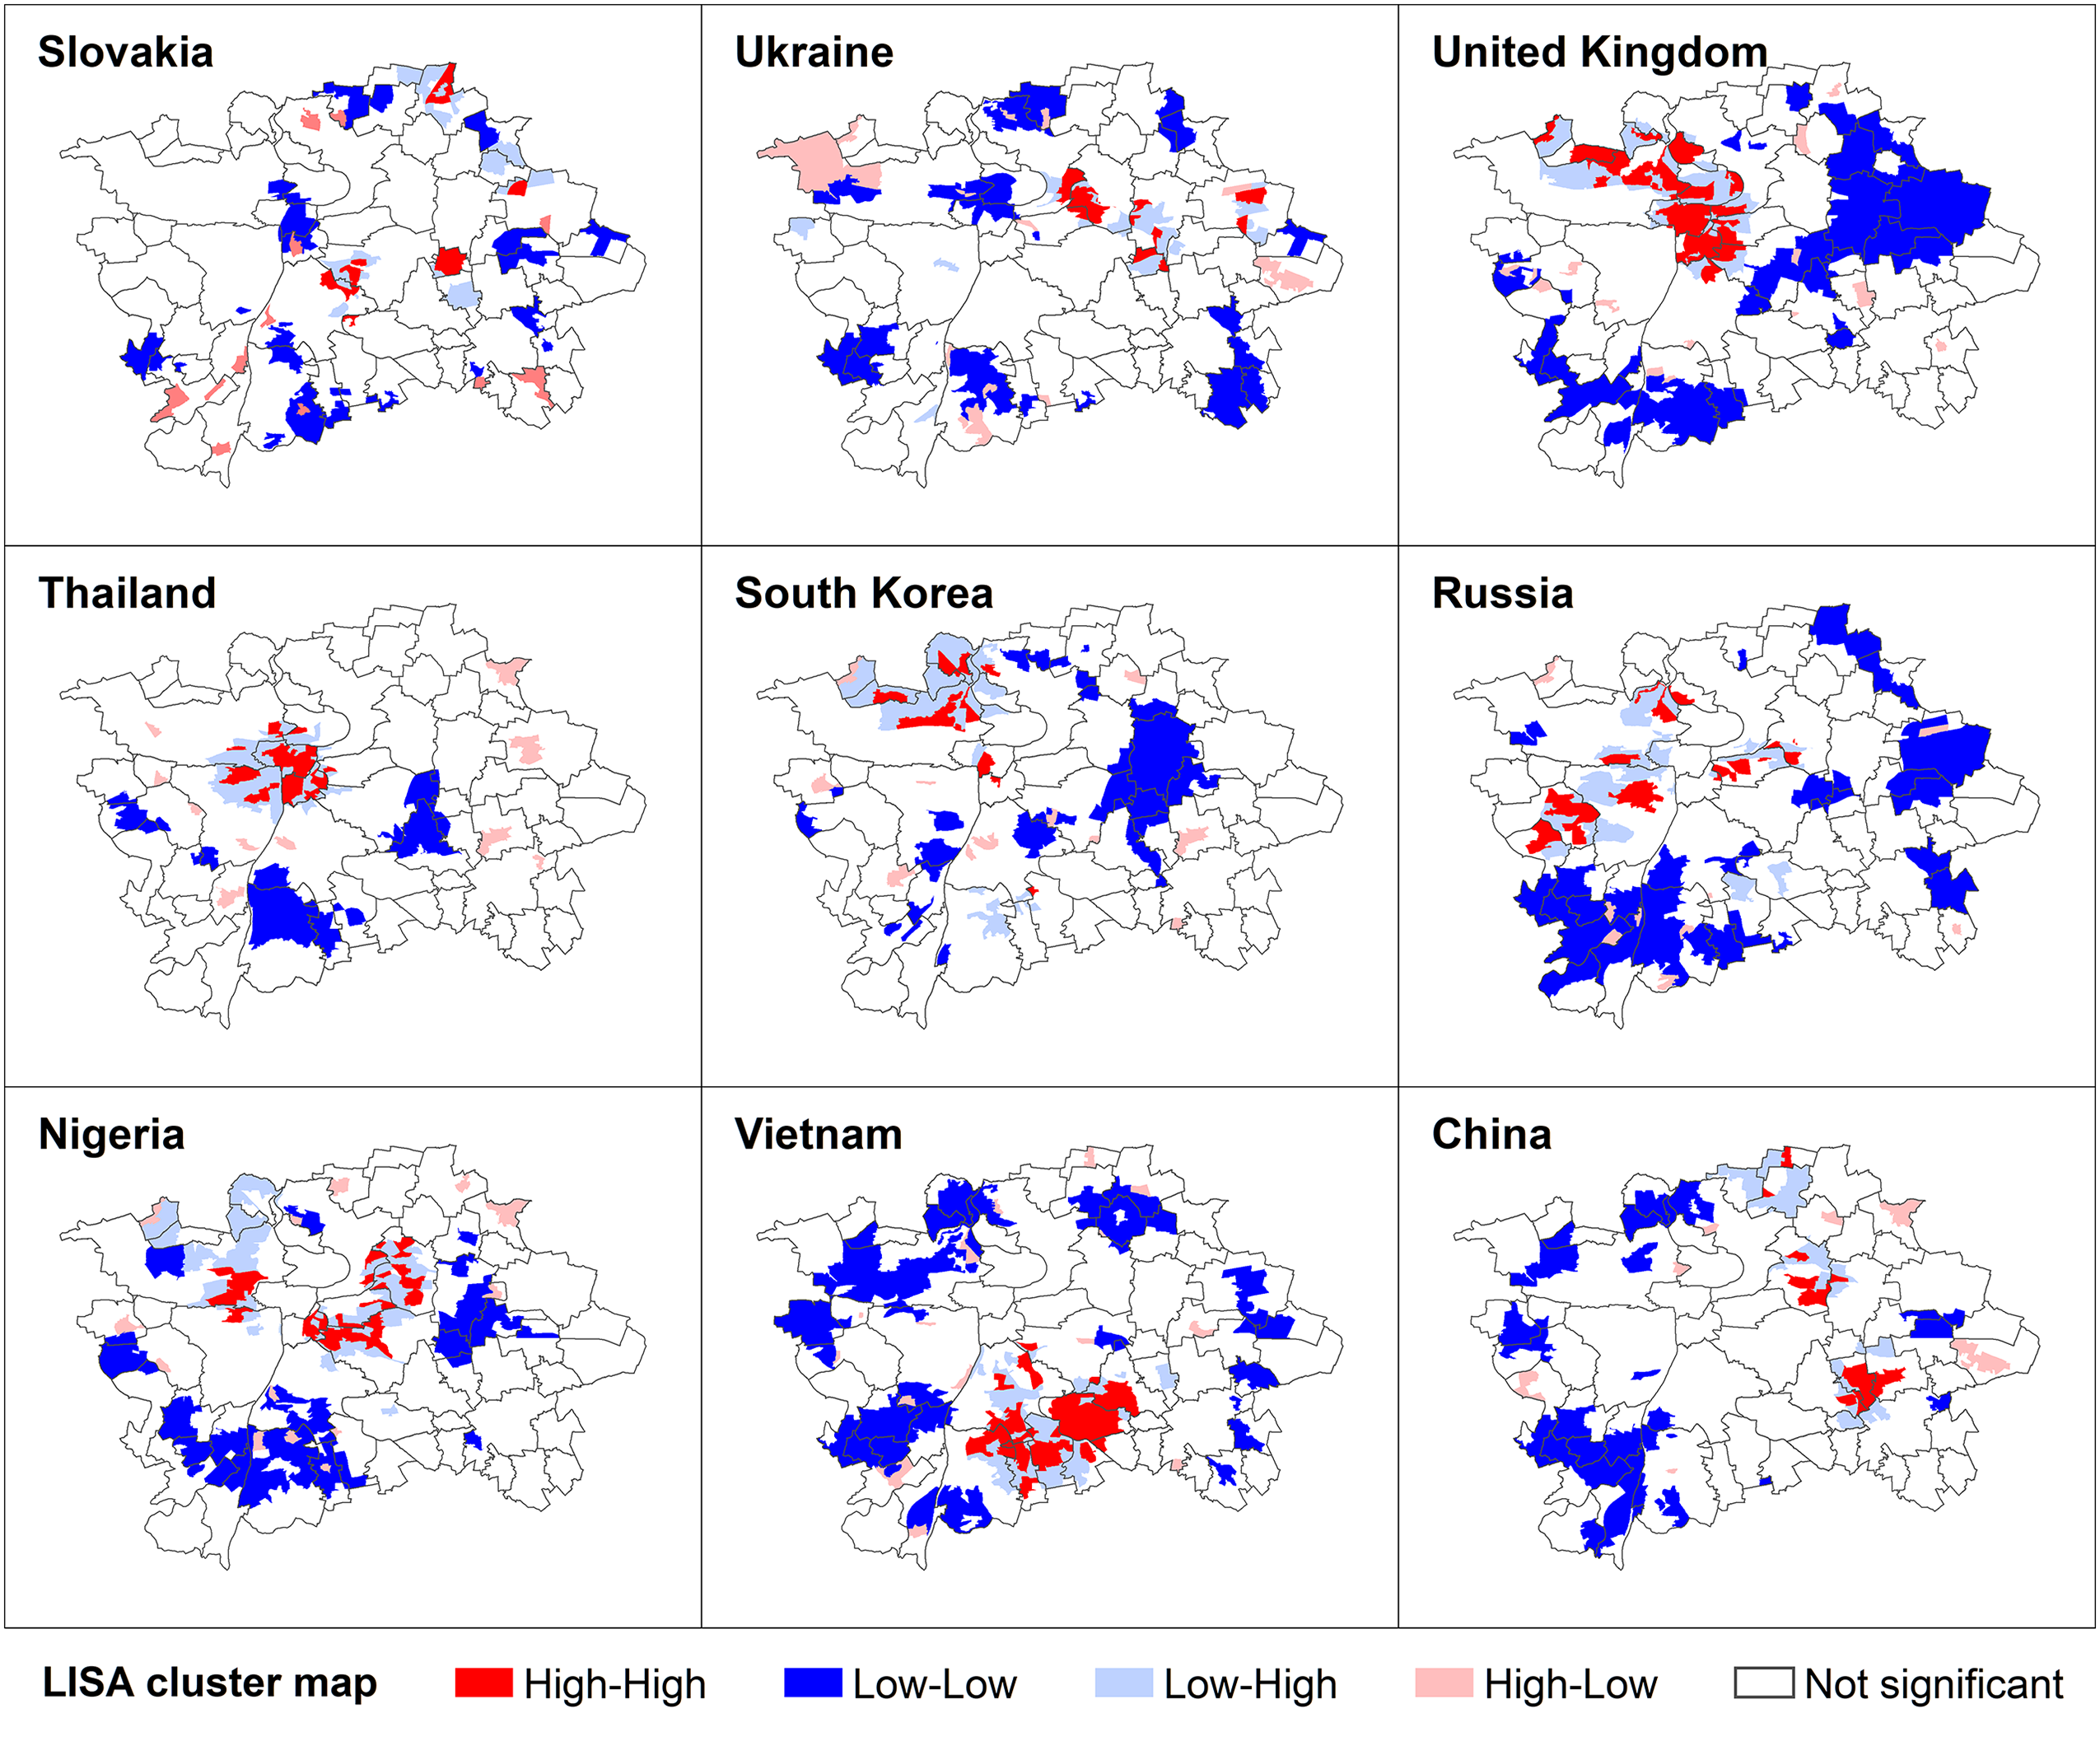
Maps of spatial clustering for selected immigrant groups in Prague.
Groups mainly from Western Europe and North America formed a very tight cluster in the lower-central part of the visualization, since they were highly concentrated (despite their relatively longer stay), particularly in the most attractive localities in central and northwestern Prague (see Figure 1). The spatial pattern of Britons is shown in Figure 8, and the LISA maps for other groups would be very similar. The node for Russians lies between the aforementioned clusters since Russians were partly dispersed across the city and, given their relatively high socio-economic status, in attractive localities (Ignatyeva 2020). Smaller groups that were also only concentrated in these localities—and, thus, had a low spatial relatedness to the majority and CEE groups—are further to the bottom-right of Figure 7 (e.g., Thais, Koreans, and Japanese). African and Latin American groups were located together in the upper-central part of the visualization and clustered in the wider vicinity of the city center in relatively attractive localities, meaning that even groups from lower-income countries did not (yet?) appear to be spatially segregated.
The only groups with apparent clustering in Prague's more peripheral areas seem to be Chinese and Vietnamese immigrants (see also their remote position in Figure 7, which is in line with the concentration observed by Přidalová and Klsák 2017). This finding could be related to their strong cultural distance from the majority, despite some Vietnamese having settled in Prague in large numbers for a relatively long time, which makes their social distance from the majority low and attitudes toward them rather positive (Hasman and Divínová 2020).
Conclusion
To shed more light on the geographical aspect of spatial and segmented assimilation theories, this article has explored immigrant residential incorporation in three cities. Our first two hypotheses aimed to test factors that we found relevant to spatial assimilation theory and to the level of immigrant spatial incorporation. The third hypothesis addressed segmented assimilation theory by identifying differences in the locations of immigrant groups’ residences in individual cities.
Regarding our first hypothesis, we observed notable differences in the level of spatial incorporation among immigrant groups based on their cultural background. The groups most culturally proximate to the majority population were also the most spatially incorporated, suggesting that the destination city's wider context, represented by the prevailing cultural characteristics of the population rather than the local socio-economic level, conditions the extent of spatial incorporation among immigrant groups in the city. Thus, this finding supports Massey’s (1985) expectation of differences in incorporation between immigrant groups and our assumption that local context influences which immigrant groups’ spatial incorporation would most resemble the majority population's spatial distribution.
The highest unevenness was measured among Asian groups, regardless of their economic level and the destination city's context. Such unevenness can stem from their strong cultural dissimilarity from the majority, potentially causing a higher dependance on migration networks, related to the tendency to co-locate (Haug 2008; Harte, Childs, and Hastings 2009). Members of such established ethnic concentrations may find it difficult to leave due to economic constraints, fear of victimization upon moving elsewhere (Phillips 2006; Markus 2014), or a desire to stay close to family and ethnic infrastructure, as hypothesized by the pluralist model. Pluralism has already been noted in earlier work on Australian cities by Edgar (2014) and Harte, Childs, and Hastings (2009). The latter study also documents how pluralism applies to African refugees, as confirmed by our analysis for Sydney, where the highest level of spatial concentration was observed for groups with a large share of refugee-humanitarian settlers of any regional origin.
In relation to our second hypothesis, we found that immigrants’ level of spatial incorporation differed between destination cities, since immigrants were more incorporated in established immigrant destinations (see Figure 2 and Table 2). Conversely, the lowest level of spatial concentration, particularly clustering, was measured in Prague, which could be due to its underdeveloped immigration system (supporting H2). Alternatively, this finding could be explained by the Czech majority's relatively lower income level, leading to most immigrant groups’ higher economic proximity. The exceptions are the most affluent groups from Western Europe (supporting H1), who were characterized by a higher income than the majority of Prague (and Barcelona, to a lesser extent). This economic discrepancy relates to these groups’ very high clustering in the most attractive parts of the cities, which subsequently become places of separation, as defined in Berry’s (1997) acculturation strategies model.
Concerning our third hypothesis, we found that immigrant groups were concentrated in different parts of individual cities. Notably, similarities in their spatial segmentation stemmed from a common regional origin rather than from length of stay: the resulting localization in the three studied cities, thus, mostly depended on groups’ cultural and economic characteristics, which affect both the level of residential concentration (and spatial relatedness to the majority) and the particular location in which the groups concentrated. These results support segmented assimilation theory and indicate that this theory, indeed, has a geographical aspect. In Sydney, where immigrants’ residential structure has developed over a long time period, each group's immigration history also played a major role in its area, but not level, of concentration, thus contradicting the basic assumptions of segmented assimilation theory that the level of immigrant spatial concentration decreases with their increasing length of stay. Furthermore, previous studies detected pluralistic residential choices for some groups in Sydney (Edgar 2014), which may have contributed to their present-day segmentation in specific locations.
This article has both theoretical and methodical merits. First, it aimed to offer new insights into the discussion of two leading concepts: spatial assimilation theory and segmented assimilation theory. Our analysis enriches segmented assimilation theory with a spatial aspect that has largely been neglected to date. Moreover, extending existing case studies proved beneficial, since most studies focus on a single destination and a limited number of immigrant groups (e.g., Johnston et al. 2016, Johnston et al. 2017). Comparing multiple groups and their spatial patterns in three distinct immigration gateways showed that assimilation theories alone cannot account for immigrants’ spatial incorporation. Thus, extending these theories by including the role of geographical context and stage of the migration cycle can increase their explanatory power. Our analysis juxtaposes cultural background and length of stay, showing that immigrants’ spatial segmentation is more clear-cut in the later stages of the migration cycle (e.g., in Sydney and, to a lesser extent, Barcelona), while the ‘immaturity’ of a country's immigration system can be related to less pronounced immigrant spatial segmentation in the cycle's early stage (e.g., in Prague). Prague is, therefore, an interesting example for future research, since it would be valuable to monitor whether (and how) immigrants’ spatial distribution evolves with the shift of its immigration system to the next stage of the migration cycle.
Second, our extensive comparative analysis required innovative approaches, such as the standardization of usual (un)evenness measures and the complex analysis of immigration systems by measuring and visualizing groups’ spatial relatedness. The correlation between (un)evenness measures and group size is a substantial, yet largely ignored, problem in the existing literature on spatial incorporation (e.g., Peach 1999; c.f., Johnston et al. 2017). Dealing with varying group size is particularly important for our analysis, which utilized the most detailed data available (including also small groups) and makes an important step toward acknowledging population diversity—an aspect often neglected in multi-group quantitative studies of residential segregation (Alba and Nee 1997). We showed that when using appropriate methods, only the smallest groups had to be omitted, bringing both methodological and empirical contributions to the spatial incorporation literature. Finally, adding a clustering measure to more typical unevenness indicators generated new findings, since both dimensions of spatial incorporation were only partially correlated and may detect spatial concentrations at different scales.
Despite our efforts, this article is not without limitations. The first is the need to combine data from more sources, which may not always be fully comparable. The most serious issue may be the use of smaller units for Sydney, compared to Prague and Barcelona. The methods chosen, however, allowed us to minimize the impacts of limited comparability. Second, since the three cities under study represent different stages of the migration cycle, our results’ generalizability may be limited. Other cities in the same stage of the migration cycle may differ from the analyzed cities in a number of ways (e.g., specific socio-economic and cultural context or immigrant structure) that may affect the resulting immigrant spatial incorporation patterns. Third, our extensive approach did not allow us to delve deeper into the specifics of individual destination cities and immigrant groups. More intensive research focused on a specific group and/or city can provide more detailed explanations of our findings. Despite these limitations, this article should serve as a useful starting point for further research on spatial incorporation.
To summarize our main findings, we employed both traditional and advanced quantitative methods to identify geographical context as an important, though often neglected, factor in assimilation theories. The characteristics of individual immigrant groups, destination cities, and their interplay emerged as vital determinants of the level and patterns of immigrant spatial incorporation. Cultural proximity is of key importance, since groups coming from countries proximate to the majority population in cultural terms (e.g., the English in Sydney, Latin Americans in Barcelona, Slavs in Prague) were the most spatially incorporated in each city. Economic factors also played a role in immigrant spatial incorporation, particularly for groups from affluent countries, which were highly concentrated in attractive parts of Prague and Barcelona. Finally, we observed that immigrant groups’ embeddedness (proxied by the length of stay) influenced their level of concentration. However, the effect of length of stay was often overshadowed by other immigrant groups’ characteristics, particularly cultural proximity to the majority, lending some support also to the pluralist model.
Supplemental Material
sj-pdf-1-mrx-10.1177_01979183221078017 - Supplemental material for Spatial Incorporation of Multiple Immigrant Groups in Gateway Cities: Comparative Analysis of Sydney, Barcelona, and Prague
Supplemental material, sj-pdf-1-mrx-10.1177_01979183221078017 for Spatial Incorporation of Multiple Immigrant Groups in Gateway Cities: Comparative Analysis of Sydney, Barcelona, and Prague by Jiří Hasman and Ivana Křížková in International Migration Review
Footnotes
Acknowledgments
This paper was created with the support of Czech Science Foundation project: “Residential segregation and mobility of foreign citizens: analysis of neighborhoods, housing trajectories, and neighborhood context” No. P404/19-03211S and of Charles University (UNCE/HUM 018). We are also grateful to Dušan Drbohlav, Martin Lepič, and Jonáš Suchánek for their valuable comments.
Declaration of Conflicting Interests
The author(s) declared no potential conflicts of interest with respect to the research, authorship, and/or publication of this article.
Funding
The author(s) disclosed receipt of the following financial support for the research, authorship, and/or publication of this article: This paper was created with the support of Czech Science Foundation project: “Residential segregation and mobility of foreign citizens: analysis of neighborhoods, housing trajectories, and neighborhood context ”No. P404/19-03211S and of Charles University (UNCE/HUM 018).

Supplemental Material
Supplemental material for this article is available online.
Notes
References
Supplementary Material
Please find the following supplemental material available below.
For Open Access articles published under a Creative Commons License, all supplemental material carries the same license as the article it is associated with.
For non-Open Access articles published, all supplemental material carries a non-exclusive license, and permission requests for re-use of supplemental material or any part of supplemental material shall be sent directly to the copyright owner as specified in the copyright notice associated with the article.
