
Abstract
Active supervision—defined as circulating, scanning, interacting with students, and reinforcing demonstrations of expected academic and social behaviors by a teacher or other staff member—is often considered a component of safe and secure schools. Yet, the evidence base supporting the effectiveness of active supervision has not been synthesized or evaluated for its quality. Therefore, we conducted an evidence-based review and meta-analysis of empirical research evaluating the effects of active supervision in schools. We identified 12 research studies evaluating active supervision, assessed the quality of each study, and calculated effect sizes for student behaviors, including disruptive behavior. Results from the four studies meeting data requirements for estimating standardized mean difference effect sizes suggest that, on average, active supervision reduced problem behavior by almost 2.0 standard deviation units. Only four studies met the What Works Clearinghouse (WWC) design standards and the results of those were mixed, thus not meeting the WWC evidence-based criteria. Limitations and recommendations for future research are discussed.
Federal education and special education law mandate all students be educated in schools that are safe, secure, and conducive to learning (Every Student Succeeds Act, 2015; Individuals With Disabilities Education Act, 2004). Adult supervision of students is a critical component of ensuring student safety (Epstein, Atkins, Cullinan, Kutash, & Weaver, 2008) and is among the most widely used methods to decrease bullying in schools (Sherer & Nickerson, 2010). Research suggests that school crimes are most likely to occur where supervision is limited, such as in hallways, restrooms, locker rooms, and unmonitored exits (Reinke & Herman, 2002). Therefore, adult supervision appears to be essential to meet federal mandates. Supervision is germane for all students, but particularly for students with or at risk for emotional and behavioral disorders (EBD), who are significantly more likely to engage in violent and criminal behavior (Vaughn, Salas-Wright, DeLisi, & Maynard, 2014).
Adult supervision can be conceptualized broadly as simply monitoring student activity or, more specifically, as active supervision, defined as specific and overt behaviors (e.g., scanning, interacting) displayed by teachers and other school personnel (e.g., principals, paraprofessionals) designed to prevent problem behavior and promote rule-following behavior (Colvin, Sugai, Good, & Lee, 1997). In their narrative review of evidence-based classroom management practices, Simonsen, Fairbanks, Briesch, Myers, and Sugai (2008) suggested that active supervision is an evidence-based practice, and it was recently cited as a critical component of effective teaching strategies by the U.S. Department of Education’s Office of Special Education Services (OSEP; 2016). Yet, to date, the active supervision evidence base has not been systematically evaluated, the effect of active supervision on student behavior has not been meta-analyzed, and standards for evidence-based practice have not been applied. Therefore, we conducted a systematic evidence review and meta-analysis of the active supervision literature base.
Generally, active supervision consists of four components (Haydon & Scott, 2008). First, teachers and other school personnel circulate among students, visit problem areas (e.g., proximity control), and remain visible to all students. Second, teachers scan the environment frequently looking for both appropriate and inappropriate displays of academic and social behavior. Third, active supervisors interact frequently with students via greetings and conversations. Finally, teachers who engage in active supervision regularly reinforce the display of expected and appropriate behaviors, usually through verbal or nonverbal praise (DePry & Sugai, 2002).
Some research on active supervision has also included the use of precorrections in tandem with the four components describe above. Precorrections are antecedent instructional events designed to prevent the occurrence of predictable problem behavior and to facilitate the occurrence of more appropriate replacement behavior (Colvin et al., 1997). Precorrections typically consist of verbal reminders, behavioral rehearsals, or demonstrations of rule-following or socially appropriate behaviors presented in or before settings where problem behavior is likely. For example, if students predictably enter the classroom from recess shouting at each other and running into the classroom, a precorrection might consist of a brief role-play of walking into class and using a quiet voice before the students begin recess. Precorrections are not a necessary requirement of active supervision but an additional component of the interaction process designed to increase the likelihood of appropriate student behavior.
Active supervision has been evaluated across a number of school settings, including classrooms (DePry & Sugai, 2002), physical education classes (Van der Mars, Darst, Vogler, & Cusimano, 1998), recesses (Lewis, Colvin, & Sugai, 2000), and transitions to and from school settings (Colvin et al., 1997). The use of active supervision as a Tier-1 support can benefit all students and can prevent behavioral challenges for those with and at risk for EBD (McIntosh & Goodman, 2016). For example, researchers noted a reduction in the following problematic or disruptive behaviors as a result of active supervision: pushing, shouting, and throwing objects (Haydon & Kroeger, 2015); office discipline referrals (ODRs) for tardiness (Johnson-Gros, Lyons, & Griffith, 2008); hands on others and threats (Lewis et al., 2000); physical aggression (Lyons, 2006); and noncompliance with playground rules (Scherer, 2017). However, whether active supervision can in fact be considered an evidence-based practice remains unclear.
As noted, researchers have not yet systematically reviewed the active supervision research. Such a review is necessary to ensure that the recommendations made by researchers (e.g., Simonsen et al., 2008) and federal agencies (OSEP, 2016) are based on high-quality research with clear evidence of effectiveness. As Cook and Cook (2013) noted, “[e]vidence-based practices are instructional techniques with meaningful research supporting their effectiveness that represent critical tools in bridging the research-to-practice gap and improving student outcomes” (p. 71). We believe that active supervision may be a critical tool used in schools to prevent problem behavior, but that belief requires empirical investigation.
In the present study, we conducted a systematic review and meta-analysis of active supervision research, and evaluated the evidence following the U.S. Department of Education’s, Institute of Education Sciences, What Works Clearinghouse (WWC; 2018) evidence standards for evidence-based practices in education. The following research questions guided our review:
Method
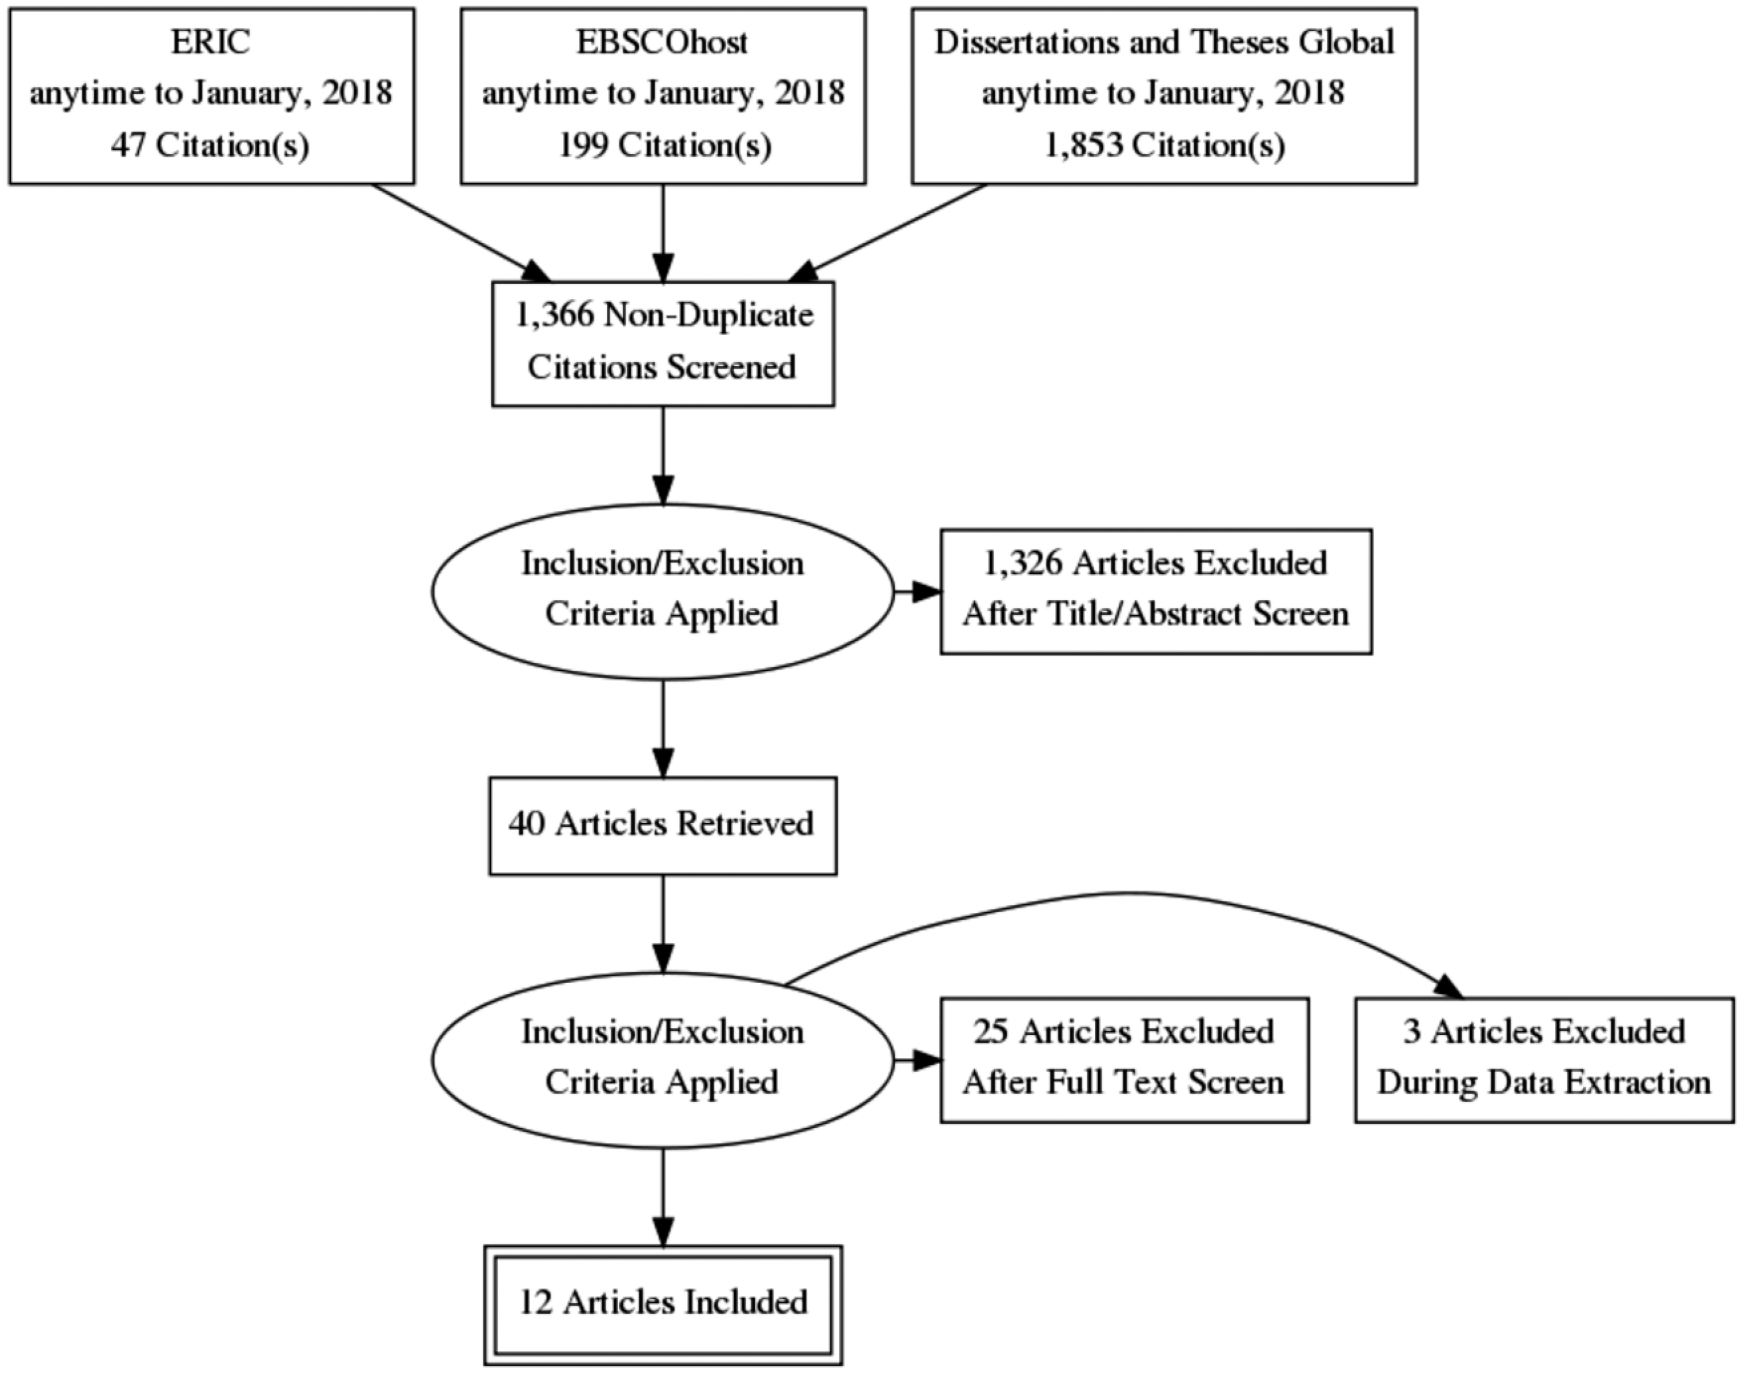
We conducted a systematic review of research studies examining the effect of active supervision on student behavior. The search was conducted in three phases: (a) abstract search and coding, (b) full text review, and (c) final coding and data extraction. A PRISMA flowchart (Figure 1) provides an overview of the three phases.
PRISMA flowchart of the search procedures.
Phase 1: Abstract Search and Coding
We conducted an electronic search using ERIC; PsycINFO, Educational Full Text, Education Index Retrospective, Psychology and Behavioral Sciences Collection, and Academic Search Premier in EBSCOhost; and Dissertations and Theses Global in ProQuest in the fall of 2017. For all, we used the following Boolean search terms: “active supervision” OR “proximity control” to ensure we retrieved all documents with any reference to active supervision. We included proximity control, which often includes all four elements of active supervision defined above, and excluded terms such as scanning or circulating as they typically do not include all four elements (e.g., frequent interaction with students). No date or publication type restrictions were added to the search (i.e., studies published in any year were eligible). Overall, we found 47 abstracts in ERIC, 199 abstracts across all databases in EBSCOhost, and 1,853 dissertations and theses from ProQuest. After duplicate removal, we identified a total of 1,366 abstracts.
Next, we screened all 1,366 abstracts using two inclusion criteria. First, we reviewed all abstracts to determine if the reference was a quantitative, experimental-design study, including single-case design, pre–post design, group-based quasi-experimental design, and randomized controlled trials. We excluded correlational and qualitative research studies. Second, we determined if the abstract described active supervision, defined as the teacher (a) circulating around the classroom, (b) scanning the classroom, (c) interacting with students, and (d) reinforcing demonstrations of expected academic and social behaviors as part of instruction. All abstracts identified as experimental and focused on active supervision were passed on to Phase 2. If we could not determine if the study was experimental and focused on active supervision from the abstract, we coded it as unsure and passed it along to Phase 2. Overall, 40 studies passed Phase 1.
Phase 2: Full Text Review and Ancestral Search
The full texts of all references passed on to Phase 2 were collected. We then reviewed all 40 full texts using three inclusion criteria: (a) Is the full text a quantitative, experimental research study (e.g., single-case design, group-experimental design)? (b) Does the study evaluate the effect of active supervision as an independent variable? and (c) Does the study involve a measure of student behavior (e.g., on-task behavior, disruptions, academic achievement) as a dependent variable? We included studies that measured students’ physical activity in physical education class because it is the expected behavior in that environment and is equivalent to academic engagement in content courses. Studies that focused on teacher proximity were included if the independent variable involved more than just how close the teacher was to the student; the teacher must have performed all four components of active supervision. For example, Conroy, Asmus, Lawig, Sellers, and Valcante (2004) studied the relation between proximity and student behavior, but only measured how close the teacher was; therefore, this study was excluded because no other component of active supervision was measured or described. We included studies that involved active supervision and precorrections per the definition above but excluded studies that paired active supervision with other interventions. For example, we excluded Lewis, Powers, Kelk, and Newcomer (2002), which examined the effect of active supervision and a group contingency on students’ recess behavior. Following Phase 2, 15 research studies were passed on to Phase 3.
Next, we reviewed the reference lists of all 15 studies that passed Phase 2 (i.e., ancestral search). Last, we reviewed the titles and abstracts of articles published in Exceptional Children, Behavioral Disorders, Journal of Positive Behavior Interventions, Journal of Emotional and Behavioral Disorders, and Remedial and Special Education from 1997 to 2017. We chose these journals because they are special education journals that regularly publish behavior-focused research. We limited our hand search to 1997 because that was the year the Colvin et al. study, which operationally defined active supervision as including all four elements described above, was published. No additional studies were found via the ancestral or hand search.
Phase 3: Full Coding and Data Extraction
The 15 included studies were reviewed and the study characteristics were extracted using the followings codes: (a) setting, (b) the number of teachers and staff, (c) the number of students, (d) the independent variable, (e) the student behaviors measured, (f) the research design, and (g) a description of the results (contact first author for a complete protocol, including operational definitions of all codes). The first and third authors extracted all of the data for the meta-analysis. For group-experimental designs, the means, standard deviations, and sample sizes were extracted to calculate standardized-mean-difference effect sizes and the variance of each effect size. For single-case designs, the same two authors independently extracted the values for all data points using two approaches. First, we extracted values using the scaling of the vertical axis and a ruler. Next, we extracted the values using the GraphClick software program (http://www.arizona-software.ch/graphclick/). Then, we correlated the two arrays and found r = .99. The only discrepancy was resolved by the first and third author reexamining the data point, which was incorrectly coded in the ruler dataset. During data extraction, three studies were excluded. One study (Funk, 2013) combined active supervision with other classroom management practices and the unique contribution of active supervision could not be extracted. Two studies (Ryan, 1997; Sariscanny, 1990) examined two different active supervision approaches (i.e., close and distant proximity), but did not include a baseline phase. Figure 1 presents a PRISMA flowchart of the search procedures.
Study Quality Review and Classification of Evidence Base
We applied the U.S. Department of Education, Institute of Education Sciences, WWC (2018) Standards 4.0 for both group and singe-case designs. The first author is a certified WWC reviewer for both group and single-case designs and conducted all quality assessments. As part of the WWC review, visual analysis for each single-case graph was conducted following WWC procedures (see U.S. Department of Education, Institute of Education Sciences, WWC, 2018; for details). The WWC Standards 4.0 set a threshold of (a) at least five single-case design studies meeting evidence standards (with or without reservations), (b) conducted by at least three different research teams at three different universities, and (c) a total of at least 20 cases for an intervention to be considered evidence based using single-case designs.
Procedural Reliability
We conducted reliability assessments of all phases of the systematic review process. During Phase 1, 38% of the abstracts were randomly selected and coded by the third and fourth authors, with 99% agreement across the 521 abstracts. When a disagreement occurred, the second author reviewed the abstracts, a consensus meeting occurred, and a final decision was made. During Phase 2, 100% of the 40 full texts were reviewed by two authors, with 100% agreement across all three criteria for all full texts. All included studies were coded for descriptive characteristics by at least two authors (64% were coded by three authors). Agreement across the study characteristics was 91%, with all disagreements resolved by the first author. The first and third authors independently extracted data from all single-case design studies. Agreement between the two data sets was 100%. Finally, a graduate student was trained by the first author and conducted independent quality assessment reviews using the WWC Standards for 30% of the studies. Agreement was 98%. All disagreements were related to the interrater reliability standards and were resolved by discussion between the first author and graduate student until reaching consensus.
Data Analysis
We conducted visual analysis for all single-case design studies following procedures outlined by WWC, including evaluation of level, trend, and variability (U.S. Department of Education, Institute of Education Sciences, WWC, 2018). The first and third authors independently evaluated each study following WWC visual analysis guideline. Across all studies, there was agreement on all but one study (Lewis et al., 2000), resulting in an initial agreement of 91%. The two raters conducted a consensus meeting and, after reviewing the graph and WWC guideline, agreed that no functional relation was present.
Meta-analysis is contingent on the calculation of a study-level effect size, the variance of the effect size, and sample sizes for the treatment and comparison groups (Borenstein, Hedges, Higgins, & Rothstein, 2009). Most single-case design effect sizes do not meet the assumptions of traditional meta-analysis, particularly with regard to the scaling of the effect size and the calculation of the variance. Therefore, alternative meta-analytic approaches have been developed and used in the single-case design literature. We calculated two non-parametric overlap effect sizes and two parametric, regression-based effect sizes (see Gage & Lewis, 2013, for a review).
Non-parametric, overlap effect sizes
First, we calculated the percent of nonoverlapping data (PND; Scruggs & Mastropieri, 2013), a nonparametric effect size, and the most widely used index for single-case design research (Maggin, O’Keeffe, & Johnson, 2011). PND is computed by identifying the most extreme baseline data point and comparing that value with all data points in the treatment phase. The total number of treatment phase points that are more extreme than baseline is then divided by the total number of treatment data points to derive the PND index. Interpretation of PND values were as follows: large effects are 90% or greater, moderate effects are between 70% and 90%, and small effects are between 50% and 70% (Scruggs & Mastropieri, 2013). We calculated PND using the SCMA package in R (Bulte, 2017).
Next, we calculated Tau-U (Parker, Vannest, Davis, & Sauber, 2011), a nonparametric effect size that can control for trend and results in an estimate of, essentially, the percentage of data that improve over time. Tau-U can be calculated using an online Tau-U calculator (Vannest, Parker, Gonen, & Adiguzel, 2016), which estimates a Tau-U value and the variance of Tau for each case and an aggregate Tau-U and variance of Tau for each study. All Tau-U effect sizes were calculated following procedures described by Bowman-Perrott, Burke, Zaini, Zhang, and Vannest (2016).
Regression-based effect size
We calculated a generalized least squares (GLS) effect size for each graph that met GLS assumptions of at least five data points per phase (Maggin, Swaminathan, et al., 2011). The GLS effect size relies on GLS regression to account for autocorrelation and produces an unbiased estimate of the treatment effect in standard deviation units (Maggin, Swaminathan, et al., 2011). The GLS regression method directly models the autocorrelation allowing for each observation to be considered independent. Then, regression lines are estimated for the two phases (baseline and treatment) being compared. The baseline regression line is extended into the treatment phase with the effect size ultimately representing the average difference between the predicted values of the two lines. The GLS effect size was estimated in five parts: (a) estimating Cochrane–Orcutt adjusted regression coefficients for each phase for each participant using the orcutt package (Spada, Quartagno, Tamburini, & Robinson, 2018) in R, (b) estimating the values of baseline regression line into the treatment phase, (c) obtaining the predicted values of the treatment phase and calculating the differences between the predicted values from baseline and treatment phases, (d) averaging the differences between the predicted and observed points in the treatment phase, and (e) calculating the effect size using the formula outlined in Maggin, Swaminathan, et al. (2011). The GLS developers recommend an effect size of 2.0 or larger be considered evidence of effectiveness.
Last, we calculated the dbetween for single-case design studies (Hedges, Pustejovsky, & Shadish, 2012) that estimates a between-case effect size from each study and not a within-case effect size for each graph as is the case with most other single-case design effect sizes. Two approaches for calculating dbetween have been described in the literature, one by Hedges et al. (2012) and one by Pustejovsky, Hedges, and Shadish (2014). Both share a number of assumptions, including normally distributed residuals and that the treatment effect is constant over cases within a study. A key difference is that Hedges et al.’s effect size assumes no trend in either baseline or treatment phases, whereas the Pustejosky et al. estimates trend and accommodates data with significant trend. We assumed that trend would be present; therefore, we chose the Pustejovsky et al. effect size, dbetween, which is based on a multilevel model and, like the Hedges et al. effect size, is computationally equivalent to d for group experimental designs. We used the scdhlm package in R (Pustejovsky, 2016) to estimate all dbetween effect sizes for studies that included at least three cases.
Meta-analytic procedures
We estimated a random-effects meta-analysis model using the study-level aggregated Tau-U and the dbetween for single-case design studies and the standardized-mean-difference (d) for the group-design study. Although Bowman-Perrott et al. (2016) used a fixed-effect model, we followed the recommendation from Shadish, Hedges, Horner, and Odom (2015) to use a random-effects model as the assumptions are aligned with broader generalization (e.g., to different measures and designs). The models were estimated in the metafor package in R (Viechtbauer, 2010). We estimated the omnibus effect size, as well as two heterogeneity statics, Q and I2.
Results
In this section, we present results related to study characteristics, study quality and classification of the evidence base, and meta-analysis of effect sizes.
Study Characteristics
Overall, we identified 12 experimental research studies that examined the effect of active supervision on student behavior. Four of the studies are dissertations, seven are peer-reviewed publications, and one is both a dissertation and the subsequent peer-reviewed publication of the dissertation results (Patterson, 2000; Patterson & van der Mars, 2008). All but one of the included studies used a single-case design (six multiple-baseline designs, four reversal-withdrawal designs, and one alternating-treatments design); Lyons (2006) used a quasi-experimental group-design method. Complete descriptive characteristics for the included studies and visual analysis results are presented in Table 1.
Characteristics of Included Studies.

Note. Visual analysis following U.S. Department of Education, Institute of Education Sciences, What Works Clearinghouse (2018) standards was used to evaluate functional relations. IV = independent variable; DV = dependent variable; SCD = single-case design; MB = multiple baseline; ODR = office discipline referral; QED = group experimental design without randomization; PE = physical education; AltT = alternating treatment design; MPVA = moderate to vigorous physical activity.
We report all available student information from each study. bDissertation.
Settings
Three of the studies examined the effect of active supervision during classroom instruction, whereas four studies were conducted during recess, and three studies were conducted during physical education class in a school gymnasium. One study focused on active supervision during three different transitions (entering the school building, transitioning to the cafeteria, and leaving the school building; Colvin et al., 1997), and one study examined active supervision in the cafeteria (Jeffrey, 2005).
Sample characteristics
Half of the included studies (k = 6) were conducted in the northwestern United States. Three were conducted in the Midwest (Haydon, DeGreg, Maheady, & Hunter, 2012; Haydon & Kroeger, 2015; Scherer, 2017), two were conducted in the Southeast (Johnson-Gros et al., 2008; Lyons, 2006), and one was conducted in the Mid-Atlantic (Jeffrey, 2005). Six of the studies were conducted in elementary schools, three were conducted in middle schools, two were conducted in high schools, and one was conducted during a summer school program for students in the first to eighth grades. Overall, the studies involved approximately 2,077 students. Lyons (2006) conducted 209 observations of students during recess in two elementary schools with ~300 students in each school, but not all students had the opportunity to be observed; therefore, we report only the number of observations and not the total number of students that attended recess. Overall, the students were diverse. Over 75% of students qualified for free or reduced-fee lunch in two school-wide studies (Colvin et al., 1997; Lyons, 2006), whereas only 44% qualified in another (Lewis et al., 2000). All of the students in Haydon and Kroeger (2015) were Black, whereas 95% of the students were White in the study by Schuldheisz and van der Mars (2010).
Independent and dependent variables
Active supervision was the primary independent variable in all of the studies. Six of the studies paired active supervision with precorrections. Two studies examined differences in student outcomes when active supervision was conducted with students in close proximity to the teacher and with students at a distance from the teachers (Patterson, 2000; Scherer, 2017), whereas another examined the effects of active supervision with and without background music during physical education class (McClain, 2008).
Seven of the 12 studies evaluated student problem behavior, including disruptive (e.g., shouting, running, not following directions, throwing, whistling) and aggressive behavior, using direct observation. One study examined transition time using direct observation (Haydon et al., 2012), and one study used ODRs for tardiness as a proxy for direct observation of transition times (Johnson-Gros et al., 2008). The three physical education studies measured physical activity as a proxy for engagement with instruction.
Visual analysis following U.S. Department of Education, Institute of Education Sciences, WWC (2018) procedures established a functional relation between the independent and dependent variables for five of the 11 single-case design studies (45%). The one group quasi-experimental design study found no statistically significant differences between treatment and comparison groups on any of the student measures.
Study Quality and Classification of the Evidence Base
We evaluated all studies using the WWC Standards 4.0 (U.S. Department of Education, Institute of Education Sciences, WWC, 2018; see Table 2). Only four studies met WWC Design Standards: one without reservations (Jeffrey, 2005) and three with reservations (Colvin et al., 1997; McClain, 2008; Scherer, 2017). Jeffrey (2005) and Colvin et al. (1997) produced strong evidence of a treatment effect, Scherer (2017) produced moderate evidence of effects, and McClain (2008) produced no evidence of effect. Based on the WWC Standards 4.0, the active supervision literature does not meet criteria for an evidence-based practice on the basis of single-case design research, which requires that a practice be supported as effective by five single-case studies that meet WWC standards, were conducted by at least three different author teams, and collectively include at least 20 cases. There were only four single-case design studies that met WWC 4.0 Standards; two of the author teams, Colvin et al. (1997) and Jeffrey (2005), were at the same institution; and there were less than 20 cases across these studies. Although both Colvin et al. and Scherer (2017) included a large number of students, setting was the case (e.g., recess, hallway). Therefore, active supervision is not considered an EBP according to the WWC standards at this time.
Study Quality Ratings.
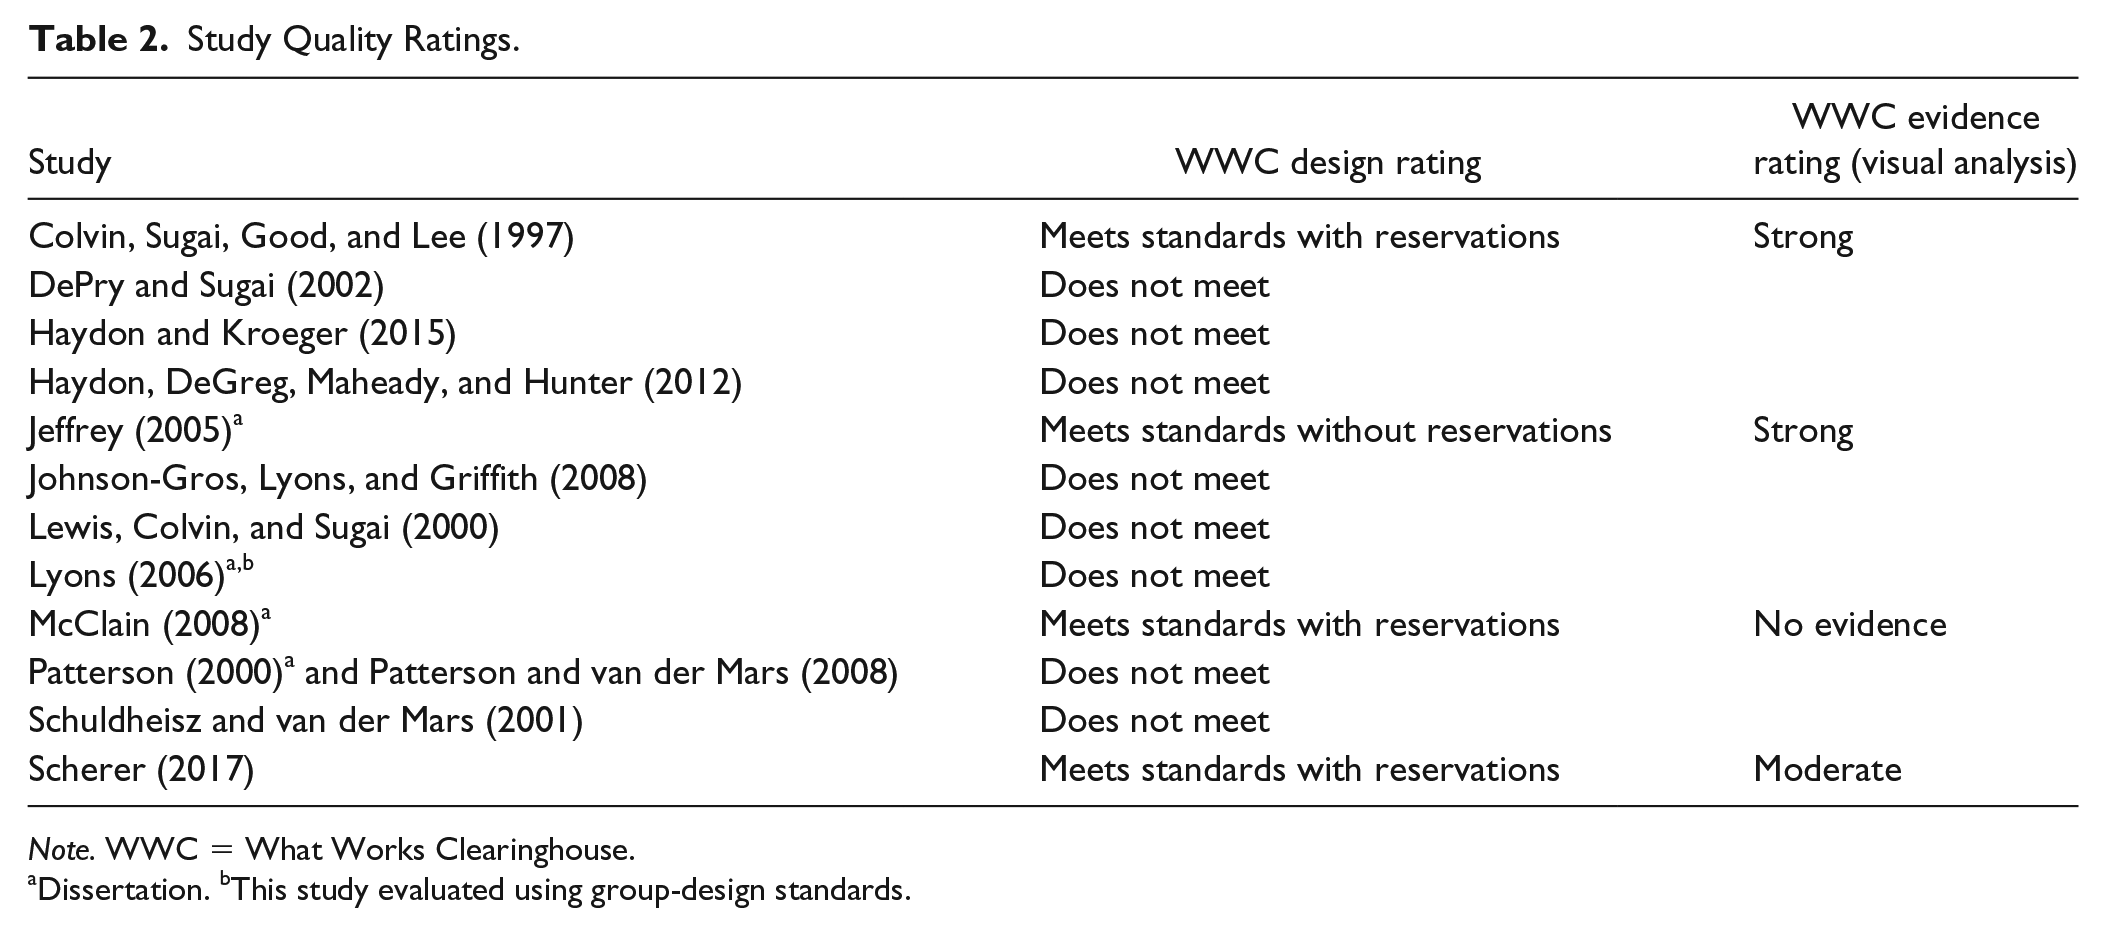
Note. WWC = What Works Clearinghouse.
Dissertation. bThis study evaluated using group-design standards.
Meta-Analysis
As noted, we used two established approaches and calculated four different single-case design effect sizes. We calculated PND and Tau-U for all included studies. Unfortunately, due to data and design limitations (e.g., McClain, 2008, used an alternating-treatments design), we only calculated GLS effect sizes for two studies, one of which did not meet WWC criteria because the authors used a multiple probe design and probe points were not conducted just prior to introducing the independent variable (Lewis et al., 2000). Furthermore, we could only calculate four dbetween effect sizes due to data limitations, namely too few cases (e.g., DePry & Sugai, 2002; Scherer, 2017) or replications (Johnson-Gros et al., 2008). The effect sizes for each study are presented in Table 3. We excluded Patterson (2000) and Patterson and van der Mars (2008) because the design implemented two different versions of active supervision, and the unique effects of active supervision could not be calculated.
Single-Case Design Effect Size Results.
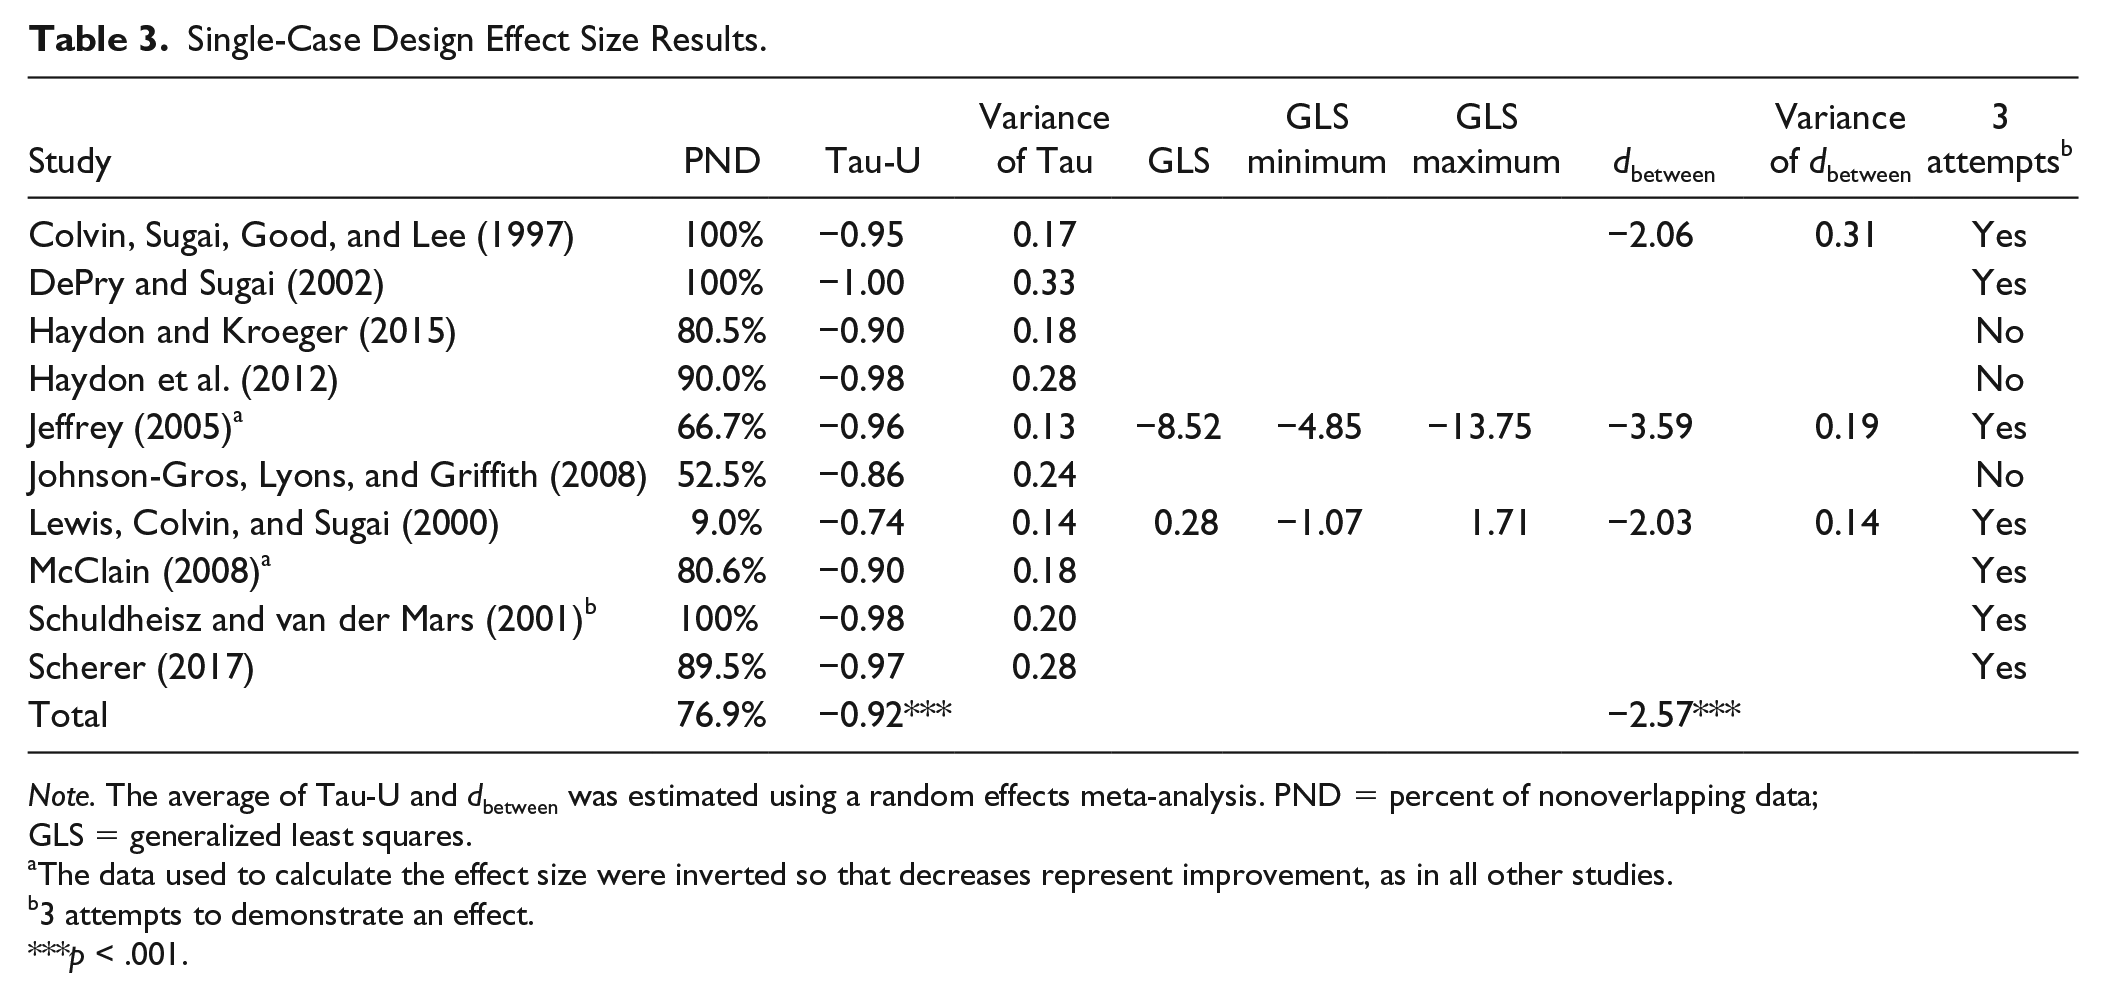
Note. The average of Tau-U and dbetween was estimated using a random effects meta-analysis. PND = percent of nonoverlapping data; GLS = generalized least squares.
The data used to calculate the effect size were inverted so that decreases represent improvement, as in all other studies.
3 attempts to demonstrate an effect.
p < .001.
The results for PND averaged over the full sample of single-case design studies, which includes studies that (a) do not include three attempts to demonstrate an effect (Haydon et al., 2012; Haydon & Kroeger, 2015; Johnson-Gros et al., 2008) and (b) do not demonstrate a functional relation via visual analysis (Lewis et al., 2000; McClain, 2008), is 85.4%, which falls in the moderate effect size range. The average PND for studies that met WWC Standards was 82.4%, whereas the average PND for the three studies that do not have three attempts to demonstrate an effect (i.e., case studies) was 74.3%. The PND for the two studies that demonstrated an experimental effect via visual analysis but had too few data points to meet WWC Standards (DePry & Sugai, 2002; Schuldeisz & van der Mars, 2001) was 100%, whereas the one study that had three attempts but no functional relation had a PND of 9.0% (Lewis et al., 2000). The two studies with the smallest PND values also had the smallest Tau-U values. However, one study with a small PND value (Jeffrey, 2005) had a large Tau-U value. The discrepancy is due to a single outlier data point in baseline that significantly impacted PND, but not Tau-U, because the study included a large number of observations (>30 observations for all three cases).
We were only able to calculate two GLS effect sizes: one for a study meeting WWC Standards (Jeffrey, 2005) and one for a study not meeting WWC Standards (Lewis et al., 2000). The results confirm the visual analysis reported in Table 1 for each study, with a large effect for Jeffrey (2005) and a small effect for Lewis et al. (2000). Results for the dbetween were almost identical for Colvin et al. (1997) and Lewis et al. (i.e., ~dbetween = 2.00), whereas Jeffrey again had the largest effect size.
We estimated a series of random-effects meta-analysis models to estimate an omnibus effect size. The overall Tau-U was −0.92, which was statistically significant. Furthermore, the Q-statistic was not statistically significant, suggesting homogeneity of effect sizes. Results for the dbetween for single-case design studies indicate the average effect size was −2.57, which was also statistically significant. However, there was significant heterogeneity based on the Q-statistic (p < .05) and the I2 value was 75%. Finally, we estimated a meta-analysis that combined the three single-case design studies with dbetween effect sizes and the group-experimental design study (Lyons, 2006) following recommendations by Shadish et al. (2015). The overall estimate of effect of active supervision on student behavior was −1.97 (p = .004). The smallest effect size was for the group experimental design (d = −0.24). Note that all four studies in the dbetween meta-analysis focused on student problem behaviors (e.g., disruptive behavior, physical aggression); none were conducted in physical education settings. Again, the Q-statistic was significant and I2 was 90%, indicating that a moderator analysis may be necessary. Unfortunately, a moderator analysis could not be conducted because too few studies were included in the meta-analysis. The final forest plot for the between-groups effect size meta-analysis is presented in Figure 2.
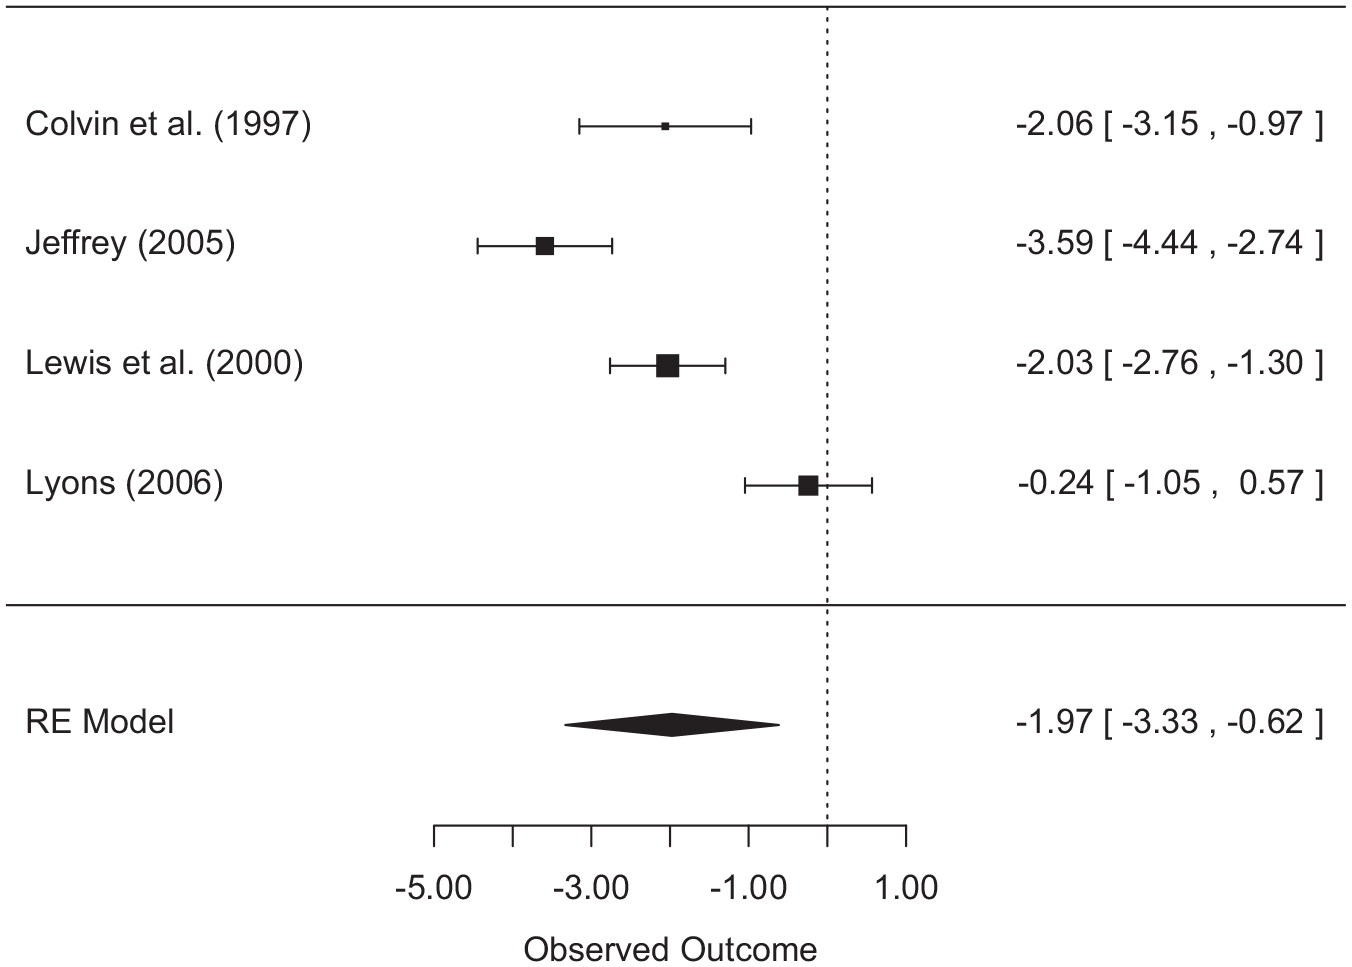
Forest plot of dbetween for single-case design studies and d for group-design studies.
We estimated models only for studies that met WWC standards. All four studies that met WWC standards were also amenable to Tau-U calculations. The weighted mean Tau-U from the four studies was −0.94 (SE = 0.21, p < .001). The result was slightly larger than the total effect including all studies with Tau-U values. Finally, we estimated a model with the two studies that met WWC standards and were amendable to dbetween effect size calculations. The weighted mean effect size was −2.86 (SE = 0.76, p < .001).
Discussion
In this evidence-based review and meta-analysis, we set out to answer a series of research questions about the characteristics and quality of the active supervision literature and the average effect on student behavior. The results indicate more research is needed. Visual analysis established a functional relation for five of the 11 single-case design studies, and the one group quasi-experimental design failed to find any significant differences between treatment and comparison groups. Four single-case design studies met WWC design standards, and there were mixed results across the four studies; subsequently active-supervision is not currently classified as evidence based according to the U.S. Department of Education, Institute of Education Sciences, WWC (2018) standards. The meta-analysis results varied across the different metrics. The overall PND value suggested moderate evidence of effectiveness (Scruggs & Mastropieri, 2013). No guidelines have been presented for the dbetween effect size, but if interpreted similarly to those forwarded for the GLS metric, the results are just above the 2.0 threshold of effectiveness. Unlike PND and dbetween, the Tau-U results suggest large and significant effects overall. Although there was variability across all of the studies, effects for higher quality single-case design studies were consistently large and clinically significant. For example, Colvin et al. (1997), which met WWC evidence standards, had a PND of 100% and dbetween greater than 2.0. However, the only group-experimental design study (Lyons, 2006) resulted in an effect size of only 0.24 standard deviation units, and the differences between the treatment and control groups were not statistically significant. Taken together, the active supervision literature is limited in both quantity and quality, the results are variable, and there is a clear need for more high-quality research.
The limited high-quality experimental research focused on active supervision was not an anticipated outcome. Of the 12 studies, seven were single-case designs that included three attempts to demonstrate an effect. We excluded pre–post case studies (i.e., AB designs) during the search process (i.e., we only included single-case experimental designs, but included the five single-case studies that did not have three attempts because they described their studies as experimental single-case designs). And of those seven studies that did have three attempts, two did not demonstrate an effect via visual analysis (Lewis et al., 2000; McClain, 2008), and others had too few data points to calculate the regression-based effect sizes. Overall, not a single study demonstrated a large effect size across all of the single-case effect size indices. Jeffrey (2005) had the largest effect size, except for PND, which was small. It is worth noting that visual analysis, following WWC Standards, found a strong effect for Jeffrey (2005).
Although not directly related to active supervision, one noteworthy issue arose with the application of single-case design effect sizes. We found discrepancies across the effect size indices. Beyond the data limitations of the regression-based effect sizes (i.e., GLS and dbetween), a few additional issues arose. The PND results for Johnson-Gros et al. (2008) and Lewis et al. (2000) were congruent with visual analysis (i.e., no functional relation), whereas the results for Jeffrey (2005) were vastly different, which was due to an outlier effect that resulted in a small (<70%) PND. The outliers did not systematically impact the other effect size indices (e.g., Tau-U, GLS), thus Jeffrey had (a) a strong effect via WWC Standards and (b) the largest effect size for the GLS and dbetween indices. Finally, although the results for the two GLS effect sizes were congruent with visual analysis, the similarity in effect size values for Colvin et al. (1997) and Lewis et al. on the dbetween does not agree with visual analysis results. We hypothesize that the discrepancy may have been due to variability and mean shift, but more research is needed on the relation between the visual analysis and the different effect sizes.
Limitations
A number of limitations necessitates further discussion. First, best practice in meta-analysis of single-case design research is to only calculate effect sizes for studies that have a demonstrated functional relation (Vannest & Ninci, 2015). We chose to report effect sizes for all studies when possible because of the limited number of studies. Readers should be aware that effect sizes are reported for studies that do not meet single-case design standards. Second, we limited our search to studies that specifically evaluated active supervision as defined in prior research studies and excluded studies that combined active supervision with other classroom and behavior management strategies, such as group contingencies. Third, we did not calculate publication bias due to the lack of agreement for a reliable bias statistic for single-case design studies. We included dissertations as a means to reduce the likelihood of publication bias (Gage, Cook, & Reichow, 2017). Finally, there is no consensus around which single-case design effect sizes to report. Based on the lack of agreement across the included metrics, it is clear more research is needed to identify the most accurate and reliable single-case design effect size metrics.
Conclusion
We believe and research suggests (e.g., Simonsen et al., 2008) that active supervision may be a necessary and effective component in the prevention of problem behavior. Unfortunately, the empirical evidence is limited, and based on WWC standards, active supervision is not an evidence-based practice at this time. That is to say, more rigorous research across multiple sites with larger samples of students is needed to determine whether active supervision can be recommended as an evidence-based practice. Considering the large effects identified in the meta-analysis, replicating and extending current research with designs meeting established standards (e.g., WWC) could help classify active supervision as an evidence-based practice. We believe that active supervision is an important foundational practice and, through future research, will demonstrate positive effects and meet evidence standards.
Footnotes
Declaration of Conflicting Interests
The author(s) declared no potential conflicts of interest with respect to the research, authorship, and/or publication of this article.
Funding
The author(s) received no financial support for the research, authorship, and/or publication of this article.