
Abstract
An alternating treatments design was used to evaluate and compare the effects of two interdependent group contingencies on the academic performance, on-task behavior, and disruptive behavior of eighth-grade students in a social studies class. All students were enrolled in a self-contained alternative school for students with behavior problems. Delivering rewards contingent upon participants’ average percent correct enhanced on-task behavior and percent correct on independent seatwork assignments; however, delivering rewards contingent upon participants’ on-task behavior yielded more consistent and larger increases in percent correct and on-task behavior. Neither group contingency resulted in consistent or meaningful changes in disruptive behavior. Theoretical and applied implications related to direct and indirect effects of interdependent group rewards are discussed along with directions for future research.
Keywords
The term emotional and behavioral disorders (EBDs) is used to identify children whose social, emotional, and/or behavioral exceptionalities make it difficult for them to succeed in school. Recent estimates on the prevalence of EBD in schools vary from 6% (U.S. Department of Education, Office of Special Education Programs, 2015) to over 20% (Brauner & Stephens, 2006; Kauffman & Landrum, 2012; National Institute of Mental Health, 2001). Students with EBD often exhibit distinct problem behaviors and experience academic skill deficits (Landrum et al., 2003).
Schools regularly employ independent group contingencies designed to prevent and remedy behavior problems and enhance academic skills and performance (Skinner et al., 2009). With such contingencies, the target behavior, criteria, and consequences are the same for the group (e.g., class, school), and because each student gains access to positive and negative consequences based solely on their own behavior, they are considered independent group contingencies (Litoe & Pumroy, 1975). Examples of independent group contingencies frequently used in schools include grades assigned for student academic work. Here, the target behaviors (i.e., expectations for academic performance on specific assignments), criteria for earning a specific grade (e.g., 90% correct to receive an A), and consequences (i.e., the grades each student receives) are relatively consistent across all students in a class. When these independent group contingencies are insufficient, educators may have to supplement these contingencies with other procedures designed to address behavior problems and academic skills and performance deficits.
When interdependent group reward contingencies are applied in a classroom, all students earn a reward based on the group (i.e., class) meeting a group-oriented criterion (Litoe & Pumroy, 1975). For example, everyone in a class could earn 10 min of bonus free time if the class averages 90% or higher on a weekly spelling test. Interdependent group rewards have many advantages. With these contingencies, each student is more likely to earn a reward when they and their peers do well, and students may be less likely to interfere or disrupt classmates’ efforts (Skinner et al., 2009).
Within an interdependent group contingency, teachers deliver rewards to all students or not. As such, these contingencies may decrease some specific antisocial behaviors associated with independent group rewards. For example, when independent group rewards are applied, students who do not earn rewards may engage in a variety of inappropriate behaviors including belittling the rewards or the students who earned rewards (Skinner et al., 1996). Alternatively, when everyone earns a reward based on class performance, students are likely to encourage and socially reinforce peers’ desired behavior and celebrate their group’s success (Skinner et al., 2004; Slavin, 1991). Interdependent group contingencies have been successfully used with students with EBD to improve academic performance (e.g., Popkin & Skinner, 2003) and reduce disruptive behavior (e.g., Theodore et al., 2004). In fact, results from recent meta-analyses summarizing school-based research over several decades indicated group contingencies, including interdependent group contingencies, were generally effective for improving behavioral and academic outcomes for students with EBD or behavioral difficulties (Maggin et al., 2012, 2017).
Target Selection Problem
Researchers who developed The Good Behavior Game applied interdependent group contingencies by rewarding groups for decreased levels of disruptive classroom behaviors including inappropriate vocalizations, out of seat, and physically aggressive behaviors (Barrish et al., 1969). Others have adapted these procedures and found decreases in undesired behavior (e.g., Gresham & Gresham, 1982; Kelshaw-Levering et al., 2000; McKissick et al., 2010). Meta-analytic researchers have found that using interdependent group contingencies to reward students for lower levels of disruptive behavior can cause meaningful reductions in inappropriate behaviors (Little et al., 2015; Maggin et al., 2012; Stage & Quiroz, 1997).
There are several concerns associated with providing interdependent group rewards contingent upon reductions in disruptive behaviors. In order for a behavior to be disruptive, it must be observed and attended to by others (e.g., classmates). Thus, when a class does not earn an interdependent reward, classmates may know which peer’s behavior caused them to fail to earn the reward (Skinner et al., 2009). This may occasion inappropriate behaviors including peers blaming, threatening, or aggressing against other students who engage in disruptive behaviors that capture classmates’ attention (Heering & Wilder, 2006; Pigott & Heggie, 1985; Romeo, 1998). In addition, reducing disruptive behaviors may not enhance academic performance or desired behaviors (Reddy & Richardson, 2006; Winett & Winkler, 1972) and can result in one inappropriate behavior being replaced with another (McKissick et al., 2010).
Interdependent group contingencies have also been used to enhance behaviors associated with learning (Finn & Zimmer, 2012), such as on-task behavior or academic engagement (Crouch et al., 1985; Heering & Wilder, 2006; Maggin et al., 2012; Rapport et al., 1982). On-task is often defined to include observable behaviors that are desired across academic activities (e.g., teacher-led instruction, independent seatwork, media presentations), such as the student’s head oriented toward school work (white board, book) or speaker (Lentz, 1988). Although interventions designed to enhance on-task behavior may be more likely to enhance academic performance than those designed to decrease disruptive behavior (Hoge & Andrews, 1987; Ruggles & LeBlanc, 1985), there are concerns with rewarding or targeting on-task behavior. Students who appear to be attending or on-task, may not actually be engaged in schoolwork. Even if on-task students are academically engaged, that engagement may not occasion meaningful increases in academic performance (Lentz, 1988; Snider, 1987).
There is evidence indicating desired indirect effects of rewarding on-task behavior with interdependent group contingencies. Heering and Wilder (2006) reinforced on-task behavior, and teachers reported that their students’ academic performance improved. Herrera (2016) found that both interdependent and dependent group contingencies designed to reinforce increases in on-task behavior and decreases in disruptive behavior resulted in increased academic performance; however, because the contingencies were in place simultaneously, these improvements could not be attributed to either contingency alone.
Other researchers have developed and evaluated interdependent group rewards that directly reinforced academic performance (Skinner et al., 2009). These behaviors include homework completion and accuracy (Lynch et al., 2009; Reinhardt et al., 2009); reading quiz performance (Sharp & Skinner, 2004); and performance on mathematics, spelling, and language arts assignments and tests (Popkin & Skinner, 2003; Scott et al., 2017). In many studies, these increases were meaningful. Scott et al. (2017) found that interdependent group rewards increased a first-grade class’s average performance on independent math seat work from approximately 63% to 83% correct. Students scoring below 60% correct showed an average gain of 48%. Working with EBD students, Popkin and Skinner (2003) found increases in class average math scores (i.e., from 67% to 87% correct) and even larger average increases in spelling scores (i.e., from 62% to 96% correct).
There is also evidence of indirect effects associated with using group contingencies to reward academic performance. Page and Edwards (1978) employed either an interdependent or independent group contingency targeting academic performance. If students met a certain percent correct criterion on their assignment, they had the opportunity to earn extra recess time. Researchers found that the interventions decreased disruptive behavior from an average of 54% during baseline to 36% and 34% during independent and interdependent contingencies, respectively. However, because researchers did not measure academic performance, the direct effect of the intervention on academic performance could not be assessed.
Using interdependent group contingencies to provide additional bonus rewards contingent upon decreased inappropriate behaviors, improved academic performance, and increased on-task behavior have all been shown to influence the behaviors being reinforced (e.g., Barrish et al., 1969; Heering & Wilder, 2006; Popkin & Skinner, 2003). However, evidence is mixed or limited on whether using a single interdependent group reward intervention to alter one class of behavior also indirectly influences other classes of behavior. In addition, no studies were identified that compared the relative effects of two or more interdependent group reward interventions, with the primary difference across interventions being the class of behavior being rewarded (e.g., on-task behavior and academic performance), across dependent variables assessing different classes of behavior (e.g., measures of on-task behavior, academic performance, and inappropriate behavior). Consequently, studies are needed to evaluate and compare the effects of providing rewards contingent across different classes of behavior on both direct outcomes (i.e., effects on the behavior being rewarded) as well as indirect outcomes (i.e., effects on other behaviors not being rewarded).
Purpose
This study was designed to extend research on interdependent group rewards by evaluating and comparing the effects of two interdependent group contingencies on the academic performance, on-task behavior, and disruptive behavior of eighth-grade students with EBD while they were engaged in social studies independent seat work. One interdependent group contingency was designed to reward academic performance and the other was designed to reward on-task behavior. An interdependent group reward was not applied contingent upon lower levels of disruptive behaviors because of concerns that students may blame, threaten, and/or aggress toward peers who engage in public, observable disruptive behaviors, which prevented the class from earning a reward (Pigott & Heggie, 1985; Romeo, 1998).
Rewards and criteria were randomly selected and unknown to students across both contingencies. These procedures allowed researchers to keep the two contingencies similar, except for the rewarded behavior (i.e., on-task vs. academic performance). In addition, randomly selecting criteria may have avoided setting criteria that were perceived as too high, which could cause students to give up, or too low, which could cause students to put forth less than their best effort (Skinner et al., 2009). Finally, randomly selecting rewards may have increased the probability that there was at least one quality reward available for each student (Skinner & Watson, 2000).
Method
Participants and Setting
Participants were recruited from an eighth-grade social studies class at an alternative middle school in the Southeastern United States with a focus on remedying chronic or high-intensity problem behavior. Students were placed in the alternative school because behavioral problems were not being appropriately addressed at their home schools. Students from 16 middle schools are eligible for placement in the alternative program during their long-term suspensions from their home school. In any given year, between 75 and 90 students are served at the school with a 3:4 student-to-teacher ratio. The student population was approximately 56.6% White/Caucasian, 35.5% African American, and 3.9% Hispanic. Approximately 86% of the students were males.
After obtaining permission from the appropriate institutions, consent and assent were solicited for all 11 students in the class. Consent and assent were provided for seven of the students. All seven participants were boys between 13 and 15 years of age; five were Caucasian and two were African American. The classroom teacher had over 5 years of teaching experience, and this was her second year in this school. The study was conducted over 8 weeks during the spring. Toward the end of the study (i.e., Sessions 19 and 21), two of the seven participants transferred out of the school and back to their home schools, but because these two students participated in the majority of the alternating-treatment phase conditions, their data were included in all analyses. During the study, two students were added to the class; however, no data were collected on these students.
The study took place during social studies class, which was 50 minutes long each day. The social studies classroom included a white board and the teacher’s desk at the front of the room. Typically, the class included 20 individual student desks, placed in rows, facing the teacher’s desk and white board. Seats were assigned, and students typically had empty desks between them to discourage disruptive behavior. The class typically consisted of the teacher leading instruction for the first portion of the class, and the students completing independent seatwork during a second portion of class. A teaching assistant sat at an additional desk to the left of the classroom. His primary role during this class period was to monitor student behavior and remove points when students engaged in problem behavior; however, he rarely interacted with students during class time.
Design and Independent Variables
An alternating treatments design (ATD) with a no-treatment series (NTS) embedded within the alternating treatments (AT) phase was used to evaluate and compare the effects of two interventions on participants’ academic performance, disruptive behavior, and on-task behavior (Skinner et al., in press). During baseline, the teacher implemented typical classroom procedures (TCPs), which included instructional activities and behavioral management procedures which were already occurring in the classroom. During the AT phase, one of the two treatments was alternatively applied to supplement already-occurring TCP. Specifically, the two treatments were an academic performance contingency (APC) and an on-task contingency (OTC). These were interdependent group-oriented contingencies with rewards delivered contingent upon the participants’ average percent correct on independent seatwork assignments (APC intervention) or percent on-task behavior (OTC intervention). During both contingencies, criteria and rewards were randomly selected.
In addition, during the AT phase, students were periodically returned to baseline conditions (i.e., no-treatment or TCP). Including this design element allows researchers to assess for and possibly rule out threats to internal validity by comparing NTS data across baseline and AT phases (Sindelar et al., 1985; Skinner et al., in press). If, during the AT phase, one or more threats to internal validity caused changes to one or both data series assessing each treatment, then these same threats should have caused similar changes to the no-treatment data collected during the AT phase (Scott et al., 2017; Skinner & Shapiro, 1989). For example, if something beyond the contingencies enhanced student performance when the contingencies where applied, those changes should also have occurred during the AT phase when the no-treatment data were collected. Also, if one treatment caused improvements in performance which spilled over to days when the other treatment was implemented, this carryover effect should also have enhanced performance during the AT phase no-treatment condition (Scott et al., 2017). However, if no-treatment data during the baseline and AT phase conditions are similar, researchers can rule out numerous threats to internal validity (Scott et al., 2017; Sindelar et al., 1985).
Dependent Variables
The dependent variables were average percent correct on academic assignments, average percent participants on-task, and percent intervals scored with disruptive behavior. Percent correct was measured by collecting and scoring each participants’ independent seatwork at the end of each class. Items were scored as correct or incorrect. Incomplete items were scored as incorrect. After calculating percent correct for each student’s worksheet, the class’s average percent correct was calculated each session.
Direct observation procedures were used to collect on-task and disruptive behavior data. Observers entered the classroom prior to the class and sat toward the back of the classroom on the wall that did not contain the assistant teacher desk. They used their mobile phones and earpieces to signal time intervals. Behaviors were recorded on experimenter-developed data collection sheets. Experimenters began collecting data 10-s after the last student received his assignment and continued until all students had finished their assignment or the teacher signaled the end of the independent seat work period. Across the study, data collection sessions ranged from 7 to 26 min.
On-task was defined as the participant’s head oriented toward the speaker or school-related materials (e.g., assignment) and measured using momentary time sampling with 15-s intervals and 5-s of scoring time. When a 15-s interval was signaled, the observer noted the number of students on tasks at that moment and then circled the number of participants on-task. At the end of class, the observer calculated the percentage of participants on-task for each interval. Then, an average percent of participants on-task was calculated for the session.
Disruptive behavior was defined as inappropriate vocalizations. An inappropriate vocalization consisted of any noise that was not precipitated by being called on by the teacher (e.g., talking out, singing, making mouth noises). Disruptive behavior was measured on a 15-s partial interval schedule, followed by a 5-s interval used to score on-task. If any participant engaged in any inappropriate vocalizations at any time during the 15-s interval, the interval was scored with disruptive behavior. At the end of class, percent of intervals scored with disruptive behavior was calculated.
Procedures
Once the baseline phase began, procedures were run on consecutive school days, excluding Thursdays because no independent seat work was assigned; instead, students discussed current events. Before collecting any data, the primary researcher met with the classroom teacher to develop and refine all procedures. Before collecting any baseline data, the primary researcher and another experimenter spent 3 days practicing collecting direct observation data. Over the last two practice days, interobserver agreement exceeded 90% for both on-task and disruptive behaviors.
Baseline
During baseline, four sessions of TCP were applied during 50-min classes. When students entered the classroom, they took their seats. The teacher would begin the class with teacher-led instruction (e.g., lectures, recitations, videos). Teacher-led instruction typically lasted 20 to 35 min. Next, the teacher distributed the independent seatwork assignments, and students were expected to spend the remainder of the class working on these assignments. The researchers began collecting data 10-s after the last student received his assignment. When a participant finished his assignment, he raised his hand and received permission to turn it in (i.e., walking to the teacher’s desk or the teacher walking to the student’s desk). At this point, researchers ceased recording on-task data for that participant but continued recording disruptive behavior until all students turned in their assignments. When students finished early, they were allowed to use their laptops, read, or work on other assignments.
Consistent with school protocols, during TCP several independent group-oriented contingencies were applied. With each of these contingencies, behaviors and criteria were held constant across students and consequences were delivered to each student based solely on their own behavior. First, students earned grades based on their performance on academic assignments and exams. Second, a response cost system was implemented. Here, upon entering the class each day, each student had 100 points, and students lost points for rule violations (i.e., respect for self and others, stay in assigned area, and follow directions). Students who lost points, lost privileges (e.g., talking during lunch). The student with the most behavior points was allowed to sit in a special chair the following day. Point sheets were sent home with students each day to allow for school/home communication. Third, the school used a school-wide system for rewarding appropriate behavior using a token economy (school dollars); students could earn dollars for appropriate behavior and exchange dollars for tangible items, edibles, or special privileges (e.g., getting to sit in a special chair during class). The teacher occasionally delivered school dollars, both to the class and to individuals, for exceptional behavior or academic performance. Finally, students could earn “positive office referrals” for commendable behavior at their teacher’s discretion. This positive office referral would allow them to meet with the principal and earn a reward such as a “shirt pass” (get to wear an out of uniform shirt), school dollars, or small snack.
AT phase
The AT phase lasted 20 consecutive school days (excluding Thursdays) during which one of the three conditions were applied. All TCP procedures used during baseline were in place each day throughout this phase. Thus, the interventions provided the opportunity for everyone in the class to earn an additional bonus reward contingent upon the class’s behavior.
Prior to beginning the intervention (AT) phase, the APC was randomly selected as the first intervention and was implemented for two consecutive school days. The OTC was then implemented for the next two consecutive school days. This initial two-consecutive-day protocol was applied to increase the probability that participants acquired an understanding of and could distinguish between the interventions (Scott et al., 2017). Next, the TCP condition was randomly assigned to a different day of the week. Thus, the TCP condition occurred on different school days. After the first AT-phase days, the APC and OTC interventions were randomly assigned to days that were not predesignated as TCP days.
After 4 days of baseline, researchers visually analyzed the repeated measures graphs (e.g., trend, variability, levels) and decided to begin the AT phase. Next using procedure described in the previous paragraph, they applied the three conditions in the following order: APC, APC, OTC, OTC, OTC, TCP, APC, APC, TCP, APC, OTC, APC, OTC, TCP, APC, OTC, APC, OTC. After 20 AT phase sessions, researchers ceased experimental procedures based on their ongoing visual analysis of their repeated measures graphs.
On the first AT phase day, the primary researcher provided an overview of the Academic and Behavior Reward game, which was adapted from Scott et al. (2017) and Popkin and Skinner (2003). Students were informed that they would have the opportunity to earn rewards based on either the class’s average on-task behavior or the class’s average percent correct on assignments. Students were informed that on some days they would not play the game. The researchers provided and described operational definitions of on-task behavior and demonstrated on- and off-task behavior. Students were told that rewards would be delivered to all or no members of the class contingent upon the class meeting a criterion; however, they were told that each day they played the game, both the criterion and reward would be unknown and randomly selected.
Next, the researcher read aloud each slip of paper with a different reward written on it and placed it in the reward envelope. These rewards were selected by both the teacher and students and included hard candy, two types of salty snacks, 5 min of computer time, 5 min of free time, and flavored water. Next, the researcher repeated the procedures with the criteria. The criteria were selected based on previous research (Popkin & Skinner, 2003), baseline performance, and teacher and researcher judgments. The goal was to have a mix of easy and difficult criteria so that students always had an opportunity to win the game, but would also try their best (Skinner et al., 2009). The 13 criteria were 40%, 49%, 50%, 53%, 59%, 63%, 67%, 73%, 77%, 80%, 83%, 87%, and 90% and were the same for both dependent variables (i.e., criteria for average percentage of students on-task for the session or average percent correct for the independent seatwork assignment).
At the beginning of the next class session, the teacher would announce whether the class had met the reward criteria from the previous day. If the class met the criteria, they were told that everyone would get the reward. The researcher clarified that the rewards would be based on average performance, not any individual student’s performance and that rewards would be given to all or no students. Although behavior and academic performance were only recorded for the seven participants, the entire class received the same instructions, feedback, and rewards.
During OTC days, the teacher announced that today would be an “On-Task Day.” She reminded the class what constituted on-task behavior, and she randomly selected slips of paper, one with the criterion and one with the reward, and placed them in an envelope without informing the students what was written on the slips of paper. She placed the sealed envelope on a table in the front of the class and began the teacher-led portion of the class. The teacher implemented OTC procedures in addition to TCP.
During APC days, the teacher announced it was an “Academic Reward Day.” She reminded students that they could earn a reward based on their average performance on independent seatwork assignments. Students were reminded that incomplete items were scored as incorrect. As in OTC days, the teacher randomly selected slips of paper with the criterion and reward, placed the slips of paper in an envelope without telling students which criterion and reward were selected, sealed the envelope, and began leading instruction. The teacher implemented APC procedures in addition to TCP.
During TCP days, the teacher announced that they would not be playing either game that day. The teacher reminded students of her expectations and stated that they could still earn rewards based on their behaviors and academic performance (i.e., reminded them of TCPs).
Each day following either contingency condition, the teacher announced whether the students earned the reward or not at the beginning of class. If participants earned the reward, they were told their average performance, the randomly selected criterion, and the randomly selected reward, before each student was given a reward. If they did not earn a reward, they were told that they did not win the game and were given no information regarding the randomly selected criterion or reward or their average performance on the previous day. Next, the teacher announced if the current day was an APC, OTC, or TCP day, briefly described the condition, randomly selected criteria, and reward slips and placed them in the envelope on the table in the front of the room and began teacher-led instruction. When the class switched from teacher-led instruction to independent seatwork, the researcher(s) collected on-task and disruptive behavior data. After the class ended, the primary researcher calculated direct observation data and scored independent seat work and provided results to the teacher.
Analysis
After each class session, class-wide data were calculated and plotted on repeated measures graphs. Visual analysis of variability, trend, and level data were used to decide when to begin and end the AT phase and to evaluate intervention effects. Visual analysis was supplemented with an effect size estimate, Kendall Tau. To test for baseline trends, each baseline-phase series (i.e., on-task, percent correct, and inappropriate vocalizations) was contrasted with itself and results revealed that no corrections were needed to control for baseline trend. Thus, Tau was used to estimate effect size rather than Tau-U, which provides a calculation of effect size through the percentage of nonoverlapping data, while controlling for baseline trends, when occurring (Parker et al., 2011). Tau allows one to test for statistically significant differences (Brossart et al., 2018). Differences were considered statistically significant at the p < .05 level. If differences were not statistically significant, effect sizes were not interpreted. We also examined descriptive statistics (e.g., mean values, standard deviations) for each condition. Based on our initial findings, we ran unplanned correlations to examine relationships across dependent variables.
Social Validity Measures
A researcher-developed social validity questionnaire, adapted from Scott et al. (2017), was given to the four participants who attended school the day following the last data collection day (three participants were absent on the final day of the study). Students were given brief instructions and each participant completed the questionnaire independently while in their assigned seat. At the same time, the teacher completed a similar eight-item Likert-type scale which was adapted from acceptability measures developed by Fudge et al. (2008). After class, the teacher completed a more in-depth acceptability interview to gain more open-ended feedback.
Procedural Integrity and Interobserver Agreement
An independent researcher and assistant teacher independently completed a treatment integrity checklist for 25% of sessions for each treatment (i.e., two of eight sessions for both APC and OTC) for each treatment. Results from both observers revealed 100% procedural integrity across all sessions; interobserver agreement for integrity was also 100%. A second trained researcher independently collected direct observation data and scored assignments for 25% of the sessions for each condition by phase (i.e., one of the four TCP sessions for both the baseline and intervention phase and two of the eight sessions for both the APC and the OTC). Percent agreement was calculated on an interval-by-interval or item-by-item basis by dividing the number of agreements by the number of agreement plus disagreement and multiplying by 100. For on-task behavior, interobserver agreement ranged from 81% to 90%, M = 86%. Interobserver agreement for disruptive behavior data ranged from 85% to 98%, M = 93%. Interscorer agreement for academic performance was 100% across all sessions.
Results
The participants met or surpassed the unknown, randomly selected contingency criteria and earned a reward on 13 out of 16 sessions (81%). They earned a reward on six of the eight sessions under the APC (75%) and on seven of the eight sessions under the OTC (87.5%).
Visual Analysis of Repeated Measures Figures
Percent correct
Percent correct data are presented in Figure 1. During baseline, the participants’ average percent correct on assignments during TCP showed no clear trend and ranged from 50% to 65%. When the intervention phase was applied, the TCP data again show no clear trend and greater variability than during baseline. Average percent correct during TCP was 55% during the baseline phase and 45% during the intervention phase. During the intervention phase, the participants’ average percent correct under the APC intervention showed an immediate increase over baseline. Intervention-phase data were variable and showed a decreasing trend followed by an increasing trend. Comparing percent correct across the APC intervention and the TCP condition (both baseline and intervention phase), shows that five of the eight APC sessions fall within the TCP range (i.e., fall within 25%–65%) and three fall above the TCP range. These comparisons suggest no consistent positive effect of the APC on the participants’ average percent correct.
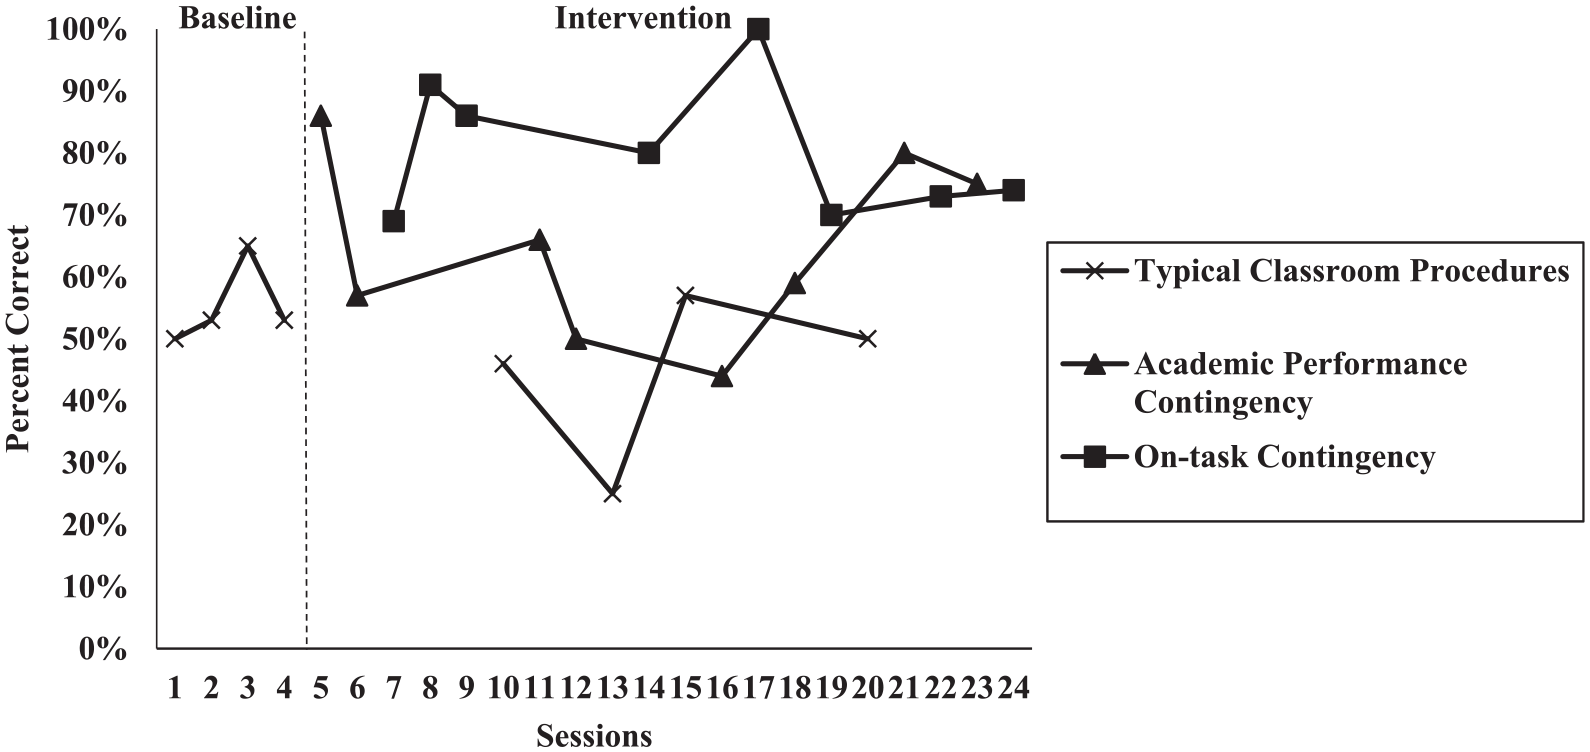
Class average academic performance on independent social studies assignments across baseline and alternating treatment phases.
When the OTC intervention was applied, percent correct data show a small immediate increase and no clear trends. Percent correct under the OTC ranged from 69% to 100%. When comparing the OTC intervention with the TCP condition, all points fall above the TCP range. These data suggest that the OTC caused a consistent improvement in academic performance. When comparing the APC and OTC, there are no consistent differences favoring either intervention; however, excluding the very beginning and end of this phase, the OTC resulted in higher percent correct than the APC.
Percent on-task
Figure 2 shows that during baseline percent on-task shows no clear trend; the first data point appears to be an outlier. During the AT phase, percent on-task during the TCP condition shows no clear trend. Baseline and AT phase TCP data averaged 41% and 51%, respectively. Under the APC, on-task data showed a similar pattern to percent correct data, an immediate increase is followed by a decreasing trend and then an increasing trend. When comparing the APC data series to the combined TCP data series (both baseline and intervention phase), no consistent differences emerge.

Average percent of students on-task across all intervals during baseline and alternating treatment phases.
On-task data under the OTC shows an immediate increase over baseline and no clear trends. During the OTC, on-task data ranged from 68% to 94%, and, with the exception of the initial baseline phase datum point, are always higher than the TCP condition. When comparing on-task data across the two treatment conditions, after the initial two sessions, on-task behavior is consistently higher under the OTC than under the APC.
Percent disruptive
Visual analysis of baseline-phase disruptive behavior suggests that the first baseline point is an outlier (see Figure 3). However, the high variability of the TCP data during the AT phase suggests that disruptive behavior across both phases is best characterized as highly variable, with no clear trends or outliers. During the APC intervention, there was an immediate decrease in disruptive behavior, which was followed by highly variable data with no clear trend. During the OTC intervention, there was no immediate decrease in disruptive behavior, and data were highly variable. The highly variable disruptive behavior data across phases and conditions do not allow one to conclude that any differences occurred across conditions or phases.

Percent of intervals with disruptive behavior across baseline and alternating treatment phases.
Statistical Analysis
Because we found no systematic differences in TCP data (percent correct, percent on-task, and percent disruptive behavior) across phases, TCP data were combined across baseline and intervention phases to calculate Tau and descriptive statistics (Scott et al., 2017), which increased the number of TCP points to eight. Therefore, there were eight data points for each condition (TCP, OTC, APC). Effect sizes were only interpreted when Tau scores revealed statistically significant difference. The following criteria suggested by Vannest and Ninci (2015) were used to interpret Tau, 0–0.2 = small effect, 0.2–0.6 = moderate effect, 0.6–0.8 = large effects, and anything above 0.8 was considered a large-to-very-large effect.
Academic performance and on-task
Average percent correct scores were 50% (SD = 11.5) during TCP, 65% (SD = 14.8) during the APC, and 80% (SD = 11.1) during the OTC. Average on-task data were 47% (SD = 15.9) during TCP, 62% (SD = 13.5) during the APC, and 76% (SD = 8.6) during the OTC. These condition-mean data indicate similar increases in the two dependent variables (percent correct and percent on-task) relative to TCP. There was a 15% increase in both percent correct and percent on-task under the APC intervention compared with TCP, and there was a 29% and 30% increase in percent correct and percent on-task, respectively, under the OTC intervention compared with TCP.
When comparing performance across conditions, statistical interpretations were similar for both percent correct and percent on-task (see Table 1). Relative to TCP, Tau scores suggest that the APC was associated with nonsignificant increases in percent correct and on-task, while the OTC was associated with very large increases in percent correct and on-task compared with TCP. When comparing the two interventions, Tau scores suggest that the OTC intervention resulted in moderately higher percent correct scores than APC. Also, OTC resulted in higher level of on-task behavior and the difference was large.
Tau Comparisons Across APC, TCP, and OTC Conditions.

Note. APC = academic performance contingency; TCP = typical classroom procedures; OTC = on-task contingency; NS = nonsignificant effect (p > .05); VL = very large effect size; M = moderate effect size; L = large effect size.
Disruptive behavior
Average percent intervals scored with disruptive behaviors were 64% (SD = 32.3) under TCP, 55% (SD = 28.2) under the APC intervention, and 65% (SD = 26.7) under the OTC intervention. Relative to the other two dependent variables, average disruptive behavior difference scores across conditions were smaller, and within each condition standard deviations were larger. All Tau scores were not significant (see Table 1).
Unplanned correlations
Based on our visual analysis, descriptive statistics, and Tau analysis, simple correlations were calculated using data from all sessions, regardless of condition or phase. Differences were considered significant at the p < .05 level and all analyses were directional. Results showed a statistically significant positive correlation between percent on-task and percent correct (r = .45) and a statistically significant negative correlation between percent disruptive and percent on-task (r = –.35). The relationship between percent disruptive and percent correct was not statistically significant (r = .16).
Individual Analysis of Percent Correct
Table 2 provides mean values and standard deviations by conditions for each participant. Under TCP, Bill averaged 99%, which leaves little room for improvement. He averaged 99% and 98% during the APC and OTC interventions, respectively, which suggests that neither intervention hindered his performance. Scoring 92% correct during TCP, Carry had little room to improve, yet enhanced his performance under the APC and OTC treatments to 99% and 97%, respectively.
Percent Correct Mean Values and Standard Deviations (SD) for Each Participant Across TCP, APC, and OTC Conditions.
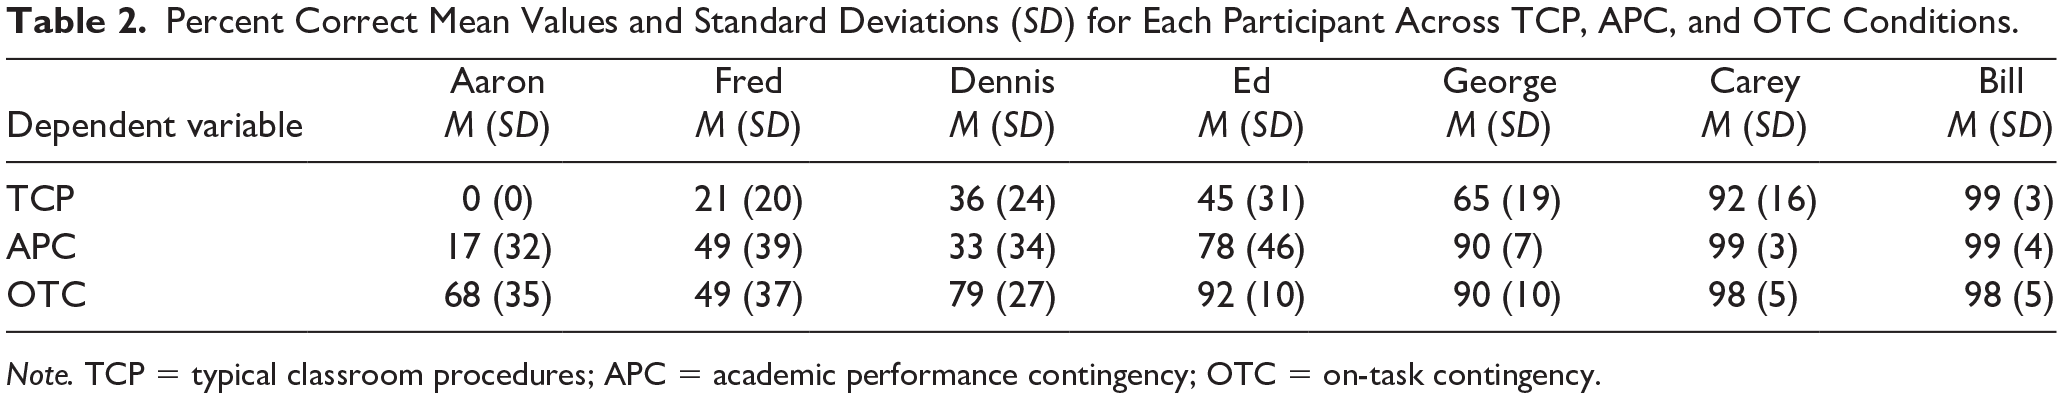
Note. TCP = typical classroom procedures; APC = academic performance contingency; OTC = on-task contingency.
Each of the other five participants whose average percent correct TCP score was below 66% (letter grade of D or F), increased their average score under the OTC, with increases ranging from 25% to 68% and a mean increase of 42.2%. Four of these five students increased their performance under the APC, with only Dennis showing a small decrease (i.e., 36% during TCP to 33% during the APC). When comparing percent correct scores across treatment conditions, Aaron, Fred, and Dennis were 51%, 46%, and 14% higher under the OTC, relative to the APC. For the other four participants, average percent correct differences across the two treatments were not meaningful and ranged from 0% to 2%.
Social Validity
Results of the teacher social validity interview, survey, and student survey indicated that both the teacher and participants felt they benefited from the interventions. The teacher reported that she thought the reward games were very successful in motivating students to complete their work and somewhat successful in improving classroom behavior, though these improvements were inconsistent. The teacher reported that the interventions were easy to implement and that she planned on continuing to similar procedures in her classroom. Results of the student survey indicated similar acceptability. Due to absences and students leaving the school, only four participants completed the acceptability survey. Three (75%) respondents reported that they liked social studies more with the reward game and all reported that they would like to use the game in other classes. The participants did not indicate a preference for either the APC or OTC; rather, they reported that they were equally beneficial and enjoyable. These results indicate that the intervention was acceptable for both the teacher and participants.
Discussion
This study was designed to evaluate and compare the effects of two interdependent group contingencies on the on-task behavior, disruptive behavior, and academic performance of eighth-grade students with EBD. The failure to find meaningful or consistent across-phase changes in TCP data suggest that threats to internal validity (e.g., history effects, spillover effects) had little influence, which suggests that the observed changes in dependent variables under the APC and the OTC were caused by each treatment (Scott et al., 2017; Sindelar et al., 1985; Skinner et al., in press).
Visual analysis of repeated measures graphs, effect size calculations, and descriptive statistics of group data support similar conclusions. Analyses suggest that the APC resulted in higher average levels of on-task and academic performance relative to TCP, but these increases were inconsistent and insignificant. Alternatively, OTC caused very large improvements in on-task and academic performance relative to TCP. Analyses comparing the APC with the OTC suggest that the OTC resulted in greater levels of academic performance and on-task behavior, and the differences were in the moderate to large range. Within-student analysis of descriptive data suggests that neither contingency hindered strong students’ academic performance, and both the OTC and APC either enhanced or had no meaningful effects on weak performing students. Treatment comparison data suggest that relative to the APC, the OTC caused greater increases in low performing students’ academic performance across more students. No analyses suggest that either group contingency had any effect on disruptive behavior.
Several outcomes that were supported across analyses (e.g., individual and group data, statistical and visual analysis), have implications related to theory, research, and practice. When considering these implications, one must also consider limitations of this study.
Students with EBD often exhibit behavior and academic performance deficits. Researchers have reasoned that applying interdependent group-oriented rewards for academic performance or on-task behavior could reduce disruptive behaviors because a student who disrupts classmates would decrease his chances of receiving a reward. Thus, even students who do not choose to engage in academic tasks may be less likely to disrupt engaged classmates (Skinner et al., 2009). The current results do not support this hypothesis as neither contingency decreased inappropriate vocalizations. Also, our unplanned correlation shows no significant relationship between academic performance and disruptive behavior. Although the relationship between on-task and disruptive behavior was statistically significant, the amount of shared variance (r2) across the two measures was only 12%. These findings suggest several directions for future researchers.
One plausible explanation for why neither contingency decreased inappropriate verbalizations is that inappropriate verbalizations may not have disrupted or interfered with the participants’ on-task or academic performance. One reason this may have occurred is that our participants (students in a self-contained school for students with behavior problems) may have become habituated to inappropriate vocalizations and have developed the ability to attend to instruction and complete assignments while they are occurring (Thompson, 2009). Thus, researchers should conduct similar studies across participants. A related factor may be an interaction between disruptive behaviors and academic activities. Perhaps, these inappropriate vocalizations were disruptive, but the nature of the social studies tasks was such that these disruptions did not interfere with academic performance. Future researchers should conduct similar studies across academic activities. For example, researchers may find that inappropriate vocalizations are disruptive and hinder academic performance when students are engaged in tasks that require a higher degree of sustained attention.
Another factor that hindered our ability to detect differences in inappropriate vocalizations was that these data were highly variable within phases and conditions.
This was an applied study and our only systematic manipulation was to supplement TCP with our contingencies. Thus, a plethora of uncontrolled factors (TCP factors) may have introduced variability across sessions. Assignments, assignment length (they ranged from 7 to 26 min), and attendance were all highly variable and each could have influenced inappropriate verbalizations. For example, inappropriate vocalization behaviors may have been influenced by which students attended each day (e.g., these vocalizations may have been higher when two students who sit in close proximity attended each day). In addition, these variables could interact. For example, when a participant finished his assignment, collection of on-task data stopped, but researchers continued to record inappropriate verbalization data. Students who finished rapidly may have been extremely engaged during the initial part of the data collection session and therefore less likely to engage in inappropriate vocalization. However, after finishing their assignment, they may have been more likely to engage in inappropriate vocalization because they no longer engaged in their independent seatwork. Thus, inappropriate vocalizations may have been inconsistent within sessions and influenced by session length, with a higher percentage of intervals scored with inappropriate vocalizations on longer sessions. Additional research is needed to gather more information on these extraneous factors.
Previous research targeting on-task behavior and/or academic performance also indicated that highly variable levels of disruptive behavior within conditions and phases (e.g., baseline) hindered their ability to detect differences in inappropriate behaviors across conditions (Ayllon & Roberts, 1974; Ferritor et al., 1972; McKissick et al., 2010). The variability we found in inappropriate vocalizations may accurately represent the behavior of our students with EBD (Christle & Yell, 2013; Kauffman, 2009; Wehby et al., 2003).
Partial interval time sampling was used to measure inappropriate vocalizations and momentary time sample was used to measure on-task behavior. Previous research suggests that partial interval time sampling procedures systematically overestimate durations, while momentary time sampling can both over- and underestimate durations (Lentz, 1982; Powell et al., 1977). More recent research suggests that our time sampling procedures may have introduced some additional unsystematic measurement error when assessing students with EBD (Briesch et al., 2015). Regardless, because inappropriate vocalization data were so variable, additional studies are needed before concluding that either contingency has no effect on disruptive behaviors. However, because we were able to detect differences across our other two dependent variables, results suggest that some treatment effects (i.e., comparisons to TCP) and relative treatments effects (i.e., comparing OTC to APC) were strong enough to overcome some of the variability associated with this applied study.
Some have suggested that applying procedures designed to enhance on-task behavior could increase academic performance and learning (Hoge & Andrews, 1987; Ruggles & LeBlanc, 1985), while others have cautioned that enhancing on-task may not cause meaningful increases in academic performance (Lentz, 1988; Snider, 1987). The current results support the hypothesis that increasing on-task behavior can enhance academic performance. These increases were meaningful as the participants’ average percent correct was 50% under TCP and improved to 80% when on-task behavior was rewarded. Also, the five participants who averaged between 0% and 65% correct on assignments during TCP increased their percent correct during the OTC and these increases ranged from 25% to 68%.
Analysis of data collected by Slate and Saudargas (1986, 1987) suggests the changes in on-task levels under the OTC were also meaningful. Slate and Saudargas found that on-task levels in EBD students being served in general education classrooms averaged 63.1% and 66.8%, respectively. Across both studies, average on-task levels for general education students were slightly higher, 66.2% and 67.5%, respectively. The current findings revealed average on-task levels of 47% during TCP, lower than the EBD samples of Slate and Saudargas, which may be one reason why the current participants were being served in a self-contained school. During the OTC, average percent on-task increased to 76%, which is higher those of the general education students studied by Slate and Saudargas.
Some have suggested that if the goal is to enhance academic performance, it may be best to reward academic performance (Popkin & Skinner, 2003; Skinner et al., 2009). Current results suggest that rewarding academic performance may have enhanced academic performance, but the improvements were not statistically significant. However, reinforcing on-task behavior caused significant and very large increases in academic performance that were meaningful (TCP average = 50%; OTC average = 80%). In addition, reinforcing on-task behavior resulted in statistically significant higher percent correct scores than reinforcing academic performance (APC = 65%; OTC = 80%). Thus, this study suggests that reinforcing on-task behavior resulted in greater increases in on-task behavior (i.e., direct effects) and academic performance (i.e., indirect effects) than reinforcing academic performance.
Although this results suggest that when applying interdependent group rewards, it may be better to provide those rewards contingent upon on-task behavior than academic performance, there are numerous reasons why no strong recommendations for practice should be made at this time. No other studies were identified where researchers compared the direct and indirect effects of two interdependent group contingencies, one which rewarded on-task behavior and the other which rewarded academic performance. The caution that all research findings require replication and confirmation studies is even more relevant as previous researchers who have investigated the effects of various independent group contingency targeting on-task behavior, disruptive behavior, and/or academic performance found mixed results regarding indirect effects (e.g., Dolezal et al., 2007; Dougherty & Dougherty, 1977; Ferritor et al., 1972; Lentz, 1988; Ruggles & LeBlanc, 1985; Snider, 1987). It is possible that additional replication and extension studies of interdependent group rewards will also produce mixed results.
Another reason why no firm conclusions should be drawn from this findings is that this study provides no evidence that enhances our understanding of why rewarding on-task behavior resulted in better academic performance than directly rewarding academic performance. Thus, additional studies designed to clarify causal mechanisms are needed. For example, on-task behavior is public and peers can look around the room and determine which classmates are on-task and which are not. However, in this study and in most school activities, students are not given access to peers’ academic performance. Perhaps, students were more responsive to the OTC because classmates could observe, evaluate, and respond to each other’s on-task behavior. For example, classmates may have praised others on-task behavior, prompted off-task classmates to get on-task, and/or blamed peers for causing them to fail to earn a reward based on their on-task behavior (Heering & Wilder, 2006; Skinner et al., 2009).
One concern with within-subject comparative effectiveness studies is related to multiple treatment interference, including carryover effects and student not being able to distinguish the two treatments (Kazdin, 2011). To help students clearly understand each treatment, when a treatment was first introduced it was applied for two consecutive days. Our results suggest little differences between the no-treatment or TCP data series across baseline and treatment phases. This suggests that treatment effects did not carry over to the no-treatment condition, which provides some evidence that treatment effects from one condition did not carry over to the other treatment (Scott et al., 2017; Skinner et al., in press). Also, results revealed differences in treatment effects across two dependent variables, on-task and academic performance. This differential responding across treatments suggests that students were able to distinguish between the two treatments. Regardless, additional studies are needed to confirm these results.
Another limitation associated with this study is that we only collected data on seven of the 11 students from the class. The four excluded students did not provide informed consent and assent for data to be collected on their behavior. In addition, in our internal review board application, we indicated that we would only spend one session collecting social validity data. On this day, only four of the seven participants were in social studies class. Additional studies on class-wide interventions should include all students from a class.
Researchers should address external validity limitations associated with this study. Additional studies should be conducted across participants (e.g., general education students, students with learning disabilities), settings (e.g., students with EBD in general education classrooms), classrooms (e.g., mathematics, reading), and disruptive behaviors (e.g., out of seat). As discussed earlier, additional studies should be conducted across different academic tasks (e.g., tasks that require different levels of sustained attention). In this study, behavioral measures were only taken after teacher-led instruction ended; thus, researchers should conduct additional studies during other school activities (e.g., small group work, teacher-led instruction).
Summary
Findings from this study can inform educators who teach students with EBD who often have co-occurring behavior and academic performance problems. Although numerous researchers have suggested that increasing academic performance or enhancing engagement may reduce disruptive behaviors, this study suggests that this will not always occur. Consequently, educators may have to apply other procedures designed to reduce inappropriate behaviors. For example, they may have to apply interdependent contingencies where rewards are delivered contingent upon low levels of disruptive behavior (Barrish et al., 1969; Wills et al., 2014). Although some behaviors may have to be directly targeted, in some instances rewarding a correlate of a behavior may be more effective than rewarding that behavior. In this study, rewarding on-task behavior caused greater increases in academic performance than rewarding academic performance. This study highlights the need for additional studies to enhance our understanding of the direct and indirect effects of rewarding different behaviors via the application of interdependent group contingencies.
Footnotes
Declaration of Conflicting Interests
The author(s) declared no potential conflicts of interest with respect to the research, authorship, and/or publication of this article.
Funding
The author(s) received no financial support for the research, authorship, and/or publication of this article.