



Abstract
Classroom observations are frequently conducted with the purpose of comparing the behavior of a target student to that of other peers within the same classroom. A variety of procedures may be utilized by researchers and practitioners to collect such data; however, little is known of the accuracy of estimates of behavior produced by such procedures relative to continuous behavior recording for the target student, peers sampled as a representation of the class, and the class as a whole. The purpose of the present study was to evaluate the accuracy of estimates of frequently utilized peer comparison observation procedures relative to duration recording. Data were simulated for 4,000 classroom observations, with variations in level of classroom behavior and length of observation being simulated. Results indicated that an Every Fifth interval procedure resulted in the lowest levels of absolute error during single observations for target students, with planned activity checks resulting in the most accurate estimates of class-wide behavior. Despite differences being apparent in level of accuracy of single observations, differences in accuracy across procedures were not apparent when all observations of the same type (i.e., duration, level of classroom behavior, and observation procedure) were compared.
Systematic direct observation (SDO) remains the gold standard of school-based behavior assessment (Riley-Tillman et al., 2008) because it produces objective estimates of student behavior from the time and place in which the behavior occurred. Despite the existence of many variations (e.g., frequency count, time-event recording, interval-based), interval-based SDO is commonly used in schools. Using interval-based SDO, a fixed-length observational period (e.g., 20 min) is subdivided into equal length intervals (e.g., 15 s) so that an observer can make frequent and repeated determinations about whether a student was engaged in the target behavior. Termed “time-sampling,” the percentage of intervals in which the target behavior was observed is often used as an estimate of the continuous duration of the target behavior. Even within time-sampling, multiple sampling methods exist (e.g., momentary, partial interval recording, whole interval recording); however, the focus of this manuscript is on momentary time sampling (MTS), in which decisions about the occurrence of a behavior are made quickly at the end of each interval. There is evidence to suggest that estimates generated using MTS (intervals up to 30 s within 30 min observations) are accurate compared with continuous duration recording (e.g., Devine et al., 2011; Rapp et al., 2008), which is valued considering common classroom intervention targets (e.g., academically engaged behavior, off-task behavior) are often defined as duration-based behaviors.
The utility of SDO is broad, allowing school personnel to assess the behavior of a single student (e.g., Spanjers et al., 2008), a group of students (e.g., Stahmer et al., 2016), or an entire classroom of students (e.g., Dart, Radley, Battaglia, et al., 2016) for a variety of purposes. These data can then be used to evaluate the effectiveness of individualized or class-wide behavior interventions or determine the need for additional behavioral support. That is, SDO represents a formative assessment technique that can be used for progress monitoring purposes to evaluate students’ responsiveness to intervention. Because SDO involves little inference or subjectivity and it is sensitive to even small changes in behavior, SDO is ideal for repeated administrations within a data-based decision-making framework.
Another common use of SDO in the classroom is to produce two different estimates of student behavior, one for a target student and one for a comparative sample (i.e., a student or group of students to which the target student is compared). In doing so, a local normative sample of behavior is produced that can be used to make relative comparisons between it and a target student. These types of observations may be utilized as a component of a special education evaluation or used in assessment of Attention-Deficit/Hyperactivity Disorder (ADHD: Abikoff et al., 2002). In these cases, it may be particularly useful to school personnel and other service providers to determine whether an individual student’s behavior is occurring more or less frequently than his or her peers within the same classroom environment. These peer comparison observations might also be useful within a multitiered system of support (MTSS) to determine whether a student’s response to a behavioral intervention is sufficient compared with the classroom average. Highlighting the utility of such observations, multiple procedural variations exist in the literature.
Peer Comparison Observation Schemes
An informal search of extant peer comparison observation schemes revealed two main parameters that vary across methods. The first is the number of students that comprise the comparative sample. We identified schemes that sampled the behavior of a single peer (e.g., Ling et al., 2011), three peers (e.g., Hunt, 2012; Rafferty et al., 2011), and five peers (e.g., Junod et al., 2006). Another method compared the target student’s behavior with a composite of all other students in the classroom (Rafferty, 2012). Typically, these peers are sampled randomly from the classroom; however, as mentioned previously, observers may sample comparison peers from a smaller subset of students (e.g., male students) to maximize representativeness of the comparative sample. In either case, the comparative sample remains the same throughout the entire observation period.
The second parameter is the way in which estimates of the target student and comparative sample are generated. Peer comparison observation schemes, like most other school-based SDO procedures, frequently use a time-sampling technique to generate estimates of student behavior; however, when two observational targets are present (i.e., target student and comparative sample), the observer must make a decision about how to sample each during the same observational period in a way that will yield accurate estimates of both. In the literature, researchers have sampled the comparative sample every other observation interval (e.g., Lo & Cartledge, 2006), every third observation interval (e.g., Noltemeyer, 2005), and every fifth observation interval (e.g., Junod et al., 2006; Steiner et al., 2014). Another technique includes a “three on, three off” scheme whereby the target student and the comparative sample are observed on an alternating basis every three intervals (Hoff & Ervin, 2013). A final technique involves observation of the comparative sample during the first and final quarter of the observational period and observation of the target student during the second and third quarters of the observational period (Reinke et al., 2007).
Currently, we have no evidence to support the accuracy of peer comparison observations despite their widespread use in research and practice; however, conducting these comparison observations simultaneously (i.e., collecting peer and target student data concurrently within a single observation) makes intuitive sense as it minimizes environmental differences (e.g., academic subject, day of the week) that could potentially reduce the comparability of separate observations. That is, conducting these observations separately (i.e., target student on one day, comparison peers the next) may introduce too many extraneous variables to allow direct comparisons between the two. Thus, the question about which combination of observational parameters results in the most accurate estimates of student behavior while balancing feasibility is critical. Logically, a larger sample of comparison peers will result in a more representative estimate of class-wide behavior; however, it may be less demanding on an observer to observe fewer peers so optimizing the comparison sample would be ideal. Furthermore, one would expect more frequent samples of behavior to produce more accurate estimates of students’ behavior; however, these observations require striking a balance between sampling target students and comparison peers and the degree to which we should do either is unknown.
Combining these two parameters yields a large number of peer comparison observation options. Although not all combinations have been reported or widely used in the literature, it may be worthwhile to investigate each one to determine which provides estimates of student behavior that most accurately depict what is occurring in the classroom. Previous research on the accuracy of SDO for different purposes (e.g., class-wide behavior assessment; Briesch et al., 2015) has been used to make definitive recommendations regarding assessment specifications. In addition, other researchers have utilized simulated data to investigate the accuracy of SDO under ideal conditions (Dart, Radley, Briesch, et al., 2016). Using simulated data in this way is associated with two major advantages over naturalistic data. First, simulated data make it feasible to examine every iteration of peer comparison observational methods, which would not be practical in a naturalistic environment. Second, assuming the simulated data are plausible and representative of real world conditions, it is possible for researchers to know the “true score” against which each observational method can be compared with confidence.
Purpose
It is imperative that we investigate the extent to which any or all of these schemes produce accurate estimates of student behavior if researchers and practitioners are making decisions using the data derived from peer comparison observations. Within each peer comparison observation scheme there are three different outcome measures that can be analyzed for accuracy; thus, the purpose of this article is threefold. First, we wanted to determine if any of the peer comparison observation schemes yielded an accurate assessment of target student behavior. Second, we wanted to determine if any of the peer comparison observation schemes yielded accurate assessments of the comparative sample’s behavior. Finally, we wanted to determine if the estimate of the comparative sample’s behavior accurately represented the entire classroom of students across all observation schemes. Identifying which peer comparison observation schemes generate the most accurate estimates (i.e., absolute accuracy compared with a criterion and relative accuracy between the methods) of student behavior would allow us to provide concrete recommendations to researchers and practitioners about the utility of each.
Method
To analyze the accuracy of each method, a large sample of student behavior was required. Previous studies examining the accuracy of observational methods have used simulations of student behavior for this purpose (e.g., Dart, Radley, Briesch et al., 2016; Rapp et al., 2008). Thus, we used a similar methodology in this study.
Data Simulation
A total of 4,000 classroom observations were simulated using a Microsoft Excel-based Markov chain simulator developed by the primary author. Markov chains are stochastic processes in which the probability of a future event is dependent only upon the previously observed state (Roberts, 1996). This type of simulation allows for naturalistic runs of behavior states, an advantage over previous models of simulation in which states were randomly determined within each observational interval (e.g., Dart, Radley, Briesch et al., 2016)—a procedure likely to result in rapid switching between states.
Data were simulated to represent on-task behavior, which may be defined as actively (e.g., answering a question) or passively (e.g., looking at the teacher) participating in classroom activities. Simulations were completed such that the output of one simulation would resemble observation in a classroom with one target student and 20 comparison peers. This yields a class size of 21, consistent with the average elementary school classroom in the United States (Goldring et al., 2014). A total of 4,000 classroom simulations were completed—1,000 each for observations of 10, 15, 30, and 60 min in length. Four different observation lengths were included to provide data regarding potential influence on observation length and coding scheme on accuracy, as previous literature indicates that longer observations may yield more accurate estimates of behavior (e.g., Mudford et al., 1990). For each observation length, 200 classrooms each were simulated with one of five possible mean levels of classroom on-task for each of the observation durations.
Student-level simulation
Simulation of individual student data began by randomly determining the probability that an interval of observation indicating on-task behavior would be followed by an interval indicating on-task behavior and the probability that an interval of observation indicating off-task behavior would be followed by an interval indicating off-task behavior. Ranges of probabilities for state changes differed across three programmed levels of on-task behavior (i.e., low, moderate, high). Probabilities for state changes are presented in Table 1. For low students, these probabilities resulted in observed levels of on-task behavior that ranged from 23% and 65%; for moderate students, on-task behavior ranged between 58% and 81%; for high students, on-task behavior ranged from 71% and 98%. The goal of the student-level simulations was to produce a wide variety of behavioral profiles on which the observational methods could be tested; thus, they were not based on normative data for student on-task behavior. Instead, we developed these parameters using professional judgment regarding what we believed teachers and school personnel may identify as low, moderate, and high levels of student engagement, as well as what would produce variations in patterns of simulated on-task behavior.
Ranges of Probabilities of Engagement Across Student Levels.

To begin the simulation, the program first identified the level of student on-task behavior to be simulated (i.e., low, moderate, high). Next, the program randomly selected probabilities of state changes from within the ranges presented in Table 1. The program was then instructed to simulate 3,600 rows of random numbers between 0 and 1 in the first column of the worksheet. Each cell in the 3,600 rows represented 1 s of student behavior—resulting in a simulated 60-min observation. The initial state of engagement of the student (i.e., on-task, off-task) was then randomly determined and placed in the first cell of the second column of the worksheet. States of engagement were dichotomous (binary), with a 0 representing off-task behavior and a 1 representing on-task behavior. For each subsequent cell in the second column, the simulator would determine the current state of engagement and compare the corresponding random number of the first column with the probability of state change for that student. If the random number did not exceed the probability of a state change for a given state, the student continued to engage in the same behavior during the subsequent interval (e.g., on-task behavior followed by on-task behavior). If the random number exceeded the probability of a state change for a given state, the student switched to the alternative state during the subsequent interval (e.g., off-task behavior followed by on-task behavior). This process continued until all 3,600 rows had been populated with data (i.e., either a 0 or 1). For an observation programmed to be 10 min in duration, the first 600 rows were retained; for observations programmed to be 15 min in duration, the first 900 rows were retained; for observations programed to be 30 min in duration, the first 1,800 rows were retained; for 60 min observations, all rows were retained.
Classroom-level simulation
Following simulation of individual students, classrooms were constructed from the simulated data. Each classroom contained a target student and 20 comparison peers. Classroom compositions were arbitrarily selected to provide a range of possible compositions for which to test observational procedures. A total of five different classroom compositions were constructed that demonstrated varying levels of on-task behavior (i.e., low, low–moderate, moderate, moderate–high, and high). Levels of on-task behavior varied at the classroom level through differing student compositions. These compositions are presented in Table 2. Once the target student and comparison peer data had been simulated, the simulator imported all student data into one worksheet. The worksheet contained 21 columns representing the 21 students within the classroom, and either 600, 900, 1,800, or 3,600 rows of data for each student, representing 600, 900, 1,800, or 3,600 s of student behavior. The ordering of the students was then shuffled, resulting in students being placed in a random observation order (i.e., students were not grouped by level of variability).
Distribution of Peer Comparison Students by Classroom Type.

Observation Simulation
Following construction of simulated classrooms, 20 different observational schemes were applied to extract data. As mentioned previously, each scheme differed in the frequency with which a comparison peer was observed and the number of comparison peers observed. A description of each of the observational schemes is provided below.
Criterion schemes
The criterion scheme, which represented sampling of behavior at 1-s intervals, served as the basis of comparison for all other observational schemes. The criterion scheme for the comparison peers was calculated by averaging the percentage of occurrence of on-task behavior for all comparison peers within the classroom. This was accomplished by averaging the binary data across 12,000, 18,000, 36,000, or 72,00 cells (i.e., 20 students × the number of intervals of observation per student)—the result of which represented the average duration, in seconds, of on-task behavior of comparison peers. The criterion scheme for the target student was calculated by averaging the binary data for the target student across the number of intervals of observation (i.e., 600, 900, 1,800, or 3,600). This calculation resulted in the total duration, in seconds, of on-task behavior of the target student.
Sampling schemes
In addition to application of the criterion schemes, sampling schemes were implemented which varied in the number of peers observed and the frequency of peer observation. Whereas simulated on-task behavior in the criterion schemes was considered in 1-s intervals to approximate true durations of behavior, the sampling schemes considered behavior in 10-s intervals—a frequency of behavior sampling commonly observed in published literature (e.g., Meany-Daboul et al., 2013).
Variations in number of peers observed
Across sampling schemes, the number of comparison peers observed was varied. For the one, three, or five random peers schemes, a random number generator was utilized to randomly select either one, three, or five comparison peers within a classroom. When three or five random peers served as comparisons, peers were observed in the same order, repeatedly, throughout the duration of the observation (e.g., Peer 1, Peer 2, Peer 3, Peer 1, Peer 2, Peer 3). For schemes in which all peers in the classroom were sampled (i.e., whole class), an Individual-Fixed method of observation was utilized (e.g., Briesch et al., 2015; Dart et al., 2016). Using an Individual-Fixed method, all peers in the classroom were placed in a randomized order. During the first interval of observation for a comparison peer, the behavior of first peer in this order was assessed. During each subsequent comparative sample interval, observation proceeded through the randomized order. The same order of observation was repeated once all peers had been observed until the conclusion of the observation. Planned Activity Checks (PAC; Cooper et al., 2007) consisted of taking a tally of the number of comparison peers engaged in the target behavior during each comparative sample interval. The number of peers engaged in the target behavior was then divided by the total number of comparison peers, yielding a percentage of peers engaged in the target behavior during each comparative sample interval. To calculate an overall level of variability using PAC, the percentages are summed across all comparative sample intervals and divided by the number of intervals observed. PAC is similar to other methods evaluated in that it is a measure of student engagement in a target behavior at a particular moment in time (e.g., end of observational interval). It differs in that it considers the behavior of multiple students within one interval, whereas the other methods only consider the behavior of one student per interval. PAC was not simulated at intervals less than 30-s, as the researchers perceived this to be impractical in applied settings.
Variations in frequency of peer observation
The frequency of peer observation, or the number of consecutive 10-s intervals of observation of the target student prior to observing the peer or peers, also varied within the sampling schemes. A total of five variations in frequency of peer observation were implemented: Every Third, Every Fifth, Every Other, Three On, Three Off, and Middle Fifty.
The Every Third method entailed the observation of a comparison peer during every 30th interval—representative of MTS of comparison peer behavior every 30 s. As such, at the 10th and the 20th interval, data were collected for the target student. At the 30th interval, the behavior of a comparison peer was sampled. This procedure was then repeated until the observation was complete. Five variations of Every Third observations were simulated, with variations differing in the number of comparison peers observed. Procedures simulated observation of one, three, and five randomly selected comparison peers, as well as the whole class. Finally, procedures were simulated such that a PAC was completed during every third interval.
The Every Fifth method entailed the observation of a comparison peer during every 5th interval, representative of MTS of peer behavior every 50 s. Using this procedure, the target student was observed during the 10th, 20th, 30th, and 40th interval. A comparison peer was then observed during the 50th interval. This procedure was repeated until the observation was completed. Variations in the number of peers observed were identical to those described in Every Third, such that five variations of Every Fifth were simulated for each classroom observation (i.e., one, three, and five random peers; whole class; PAC).
The Every Other method entailed the target student being observed during the 10th interval and a comparison peer was observed during the 20th interval, representative of MTS of peer behavior every 20 s. This procedure was repeated until the observation was completed. Four variations of Every Other observations were simulated for each classroom, including: one, three, and five random peers, as well as the whole class. PAC were not simulated during Every Other observations due to hypothesized limitations in feasibility of such a procedure in real world settings.
The Three On, Three Off method entailed the observation of the target student for three consecutive intervals, followed by observation of a comparison peer for three consecutive intervals. Using this method, the target student would be observed during the 10th, 20th, and 30th interval, followed by observation of a comparison peer during the 40th, 50th, and 60th intervals. This procedure was then repeated until the observation was complete. Four variations in Three On, Three Off observations were simulated, with variations differing by either considering the behavior of one, three, or five random peers, or the whole class.
The Middle Fifty method entailed observation of a comparison peer during the first 25% of an observation. The target student was then observed during the middle 50%, followed by observation of a different comparison peer during the final 25% of the observation. For all observations using the Middle Fifty method, two comparison peers were randomly selected from the classroom.
Data Analysis
Average absolute error
The average absolute error for each observation method was calculated using difference scores between the criterion and the sampled duration of behavior—a procedure frequently utilized to evaluate the accuracy of assessment methods within school settings (e.g., Dart et al., 2016; Riley-Tillman et al., 2009). This procedure is particularly useful in that it ensures that over- and underestimations do not negate each other when averaged. Difference scores were calculated at three levels for each classroom observation. First, the difference between the sampled duration of behavior and the criterion for the target student was calculated. Next, the difference between the sampled duration for the sampled peers and the criterion for the sampled peers was calculated. Finally, as peer comparison sampling methods are assumed to provide an estimate of behavior at the class level, the difference between the sampled duration for the sampled peers and the criterion for the classroom was calculated. Difference scores were calculated by subtracting the sampled duration of behavior from the criterion and taking the absolute value (Dart et al., 2016). Finally, an average for the recording scheme was calculated for each classroom composition–duration–combination.
Results
Accuracy of Estimates for Target Student Behavior
The first research question addressed was whether the observation schemes yielded accurate assessments of target student behavior. The average absolute error observed within each coding scheme with respect to the target student’s sampled behavior and their criterion is presented in Table 3. In general, longer observations were associated with a decreased amount of error. The difference in absolute error across coding schemes and durations was relatively small, with a range of about 4% between the least and most error. Compared with the other coding schemes, the Every Fifth method (i.e., target student observed for four intervals, then the comparison peer during the fifth interval) was associated with the lowest amount of absolute error.
Descriptive Data for Target Peer Data.

Accuracy of Estimates for Sampled Peers’ Behavior
The second research question addressed whether any of the observation schemes yielded accurate assessments of the comparison peers’ behavior. The absolute error observed within each coding scheme with respect to the peers’ sampled behavior and their criterion is presented in Table 4. The difference in absolute error across coding schemes and durations ranged from approximately 2% to 12%. Substantial differences were observed in level of error across coding schemes, with the lowest being observed for a 60 min observation, Every Other, one random peer, in the Moderate–High classroom (M = 2.03), and the greatest error observed for a 10-min observation, Every Fifth, three random peers, in the Low classroom (M = 11.60). Across classroom compositions, the Every Other and Three On, Three Off procedures were consistently associated with the lowest amount of absolute error compared with all other coding procedures across all classroom compositions. Regarding the number of peers sampled, 1, 3, and 5 Random Peer strategies were identified as resulting in the lowest absolute error with very similar frequencies (18, 21, and 18 times, respectively).
Descriptive Data for Comparison Peer to Comparison Peer Data.
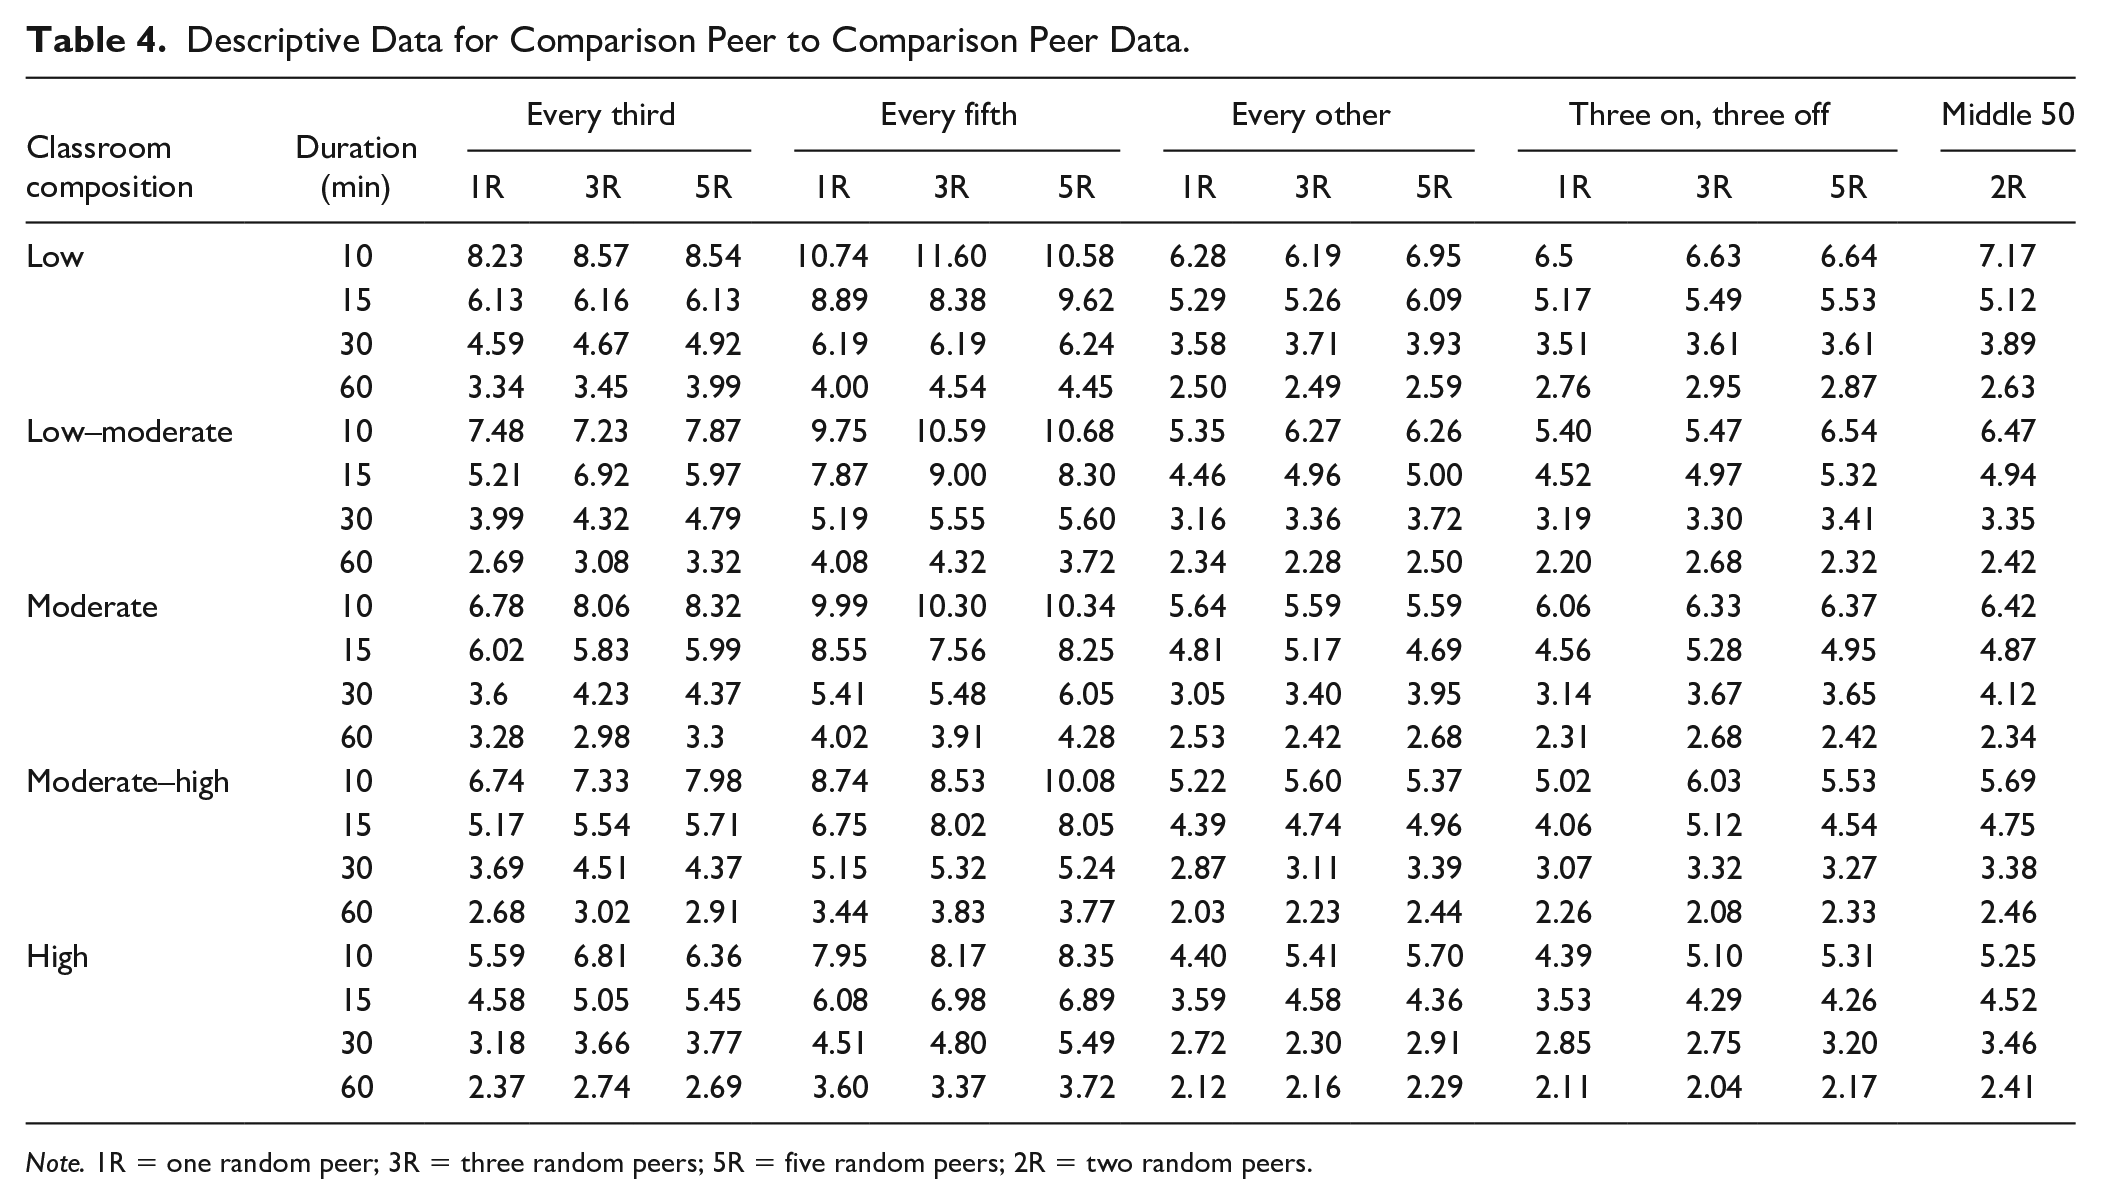
Note. 1R = one random peer; 3R = three random peers; 5R = five random peers; 2R = two random peers.
Accuracy of Estimates for Class-wide Behavior
The third research question addressed whether the comparison peer data generated within the observation schemes accurately represented the behavior of all students within a classroom. The absolute error observed within each coding scheme with respect to the peers’ sampled behavior and the class’ true duration of behavior is presented in Table 5. Substantial differences were observed between the lowest level of absolute error observed (60 min observation, Every Third, PAC, High classroom; M = 0.59) and the greatest (10 min observation, Every Fifth, one random peer, Low–Moderate Classroom; M = 20.32). Compared with other coding schemes, PAC conducted during Every Third was associated with the lowest amount of absolute error across all classroom compositions.
Descriptive Data for Comparison Peer to Classroom Data.

Note. CC = classroom composition; 1R = one random peer; 3R = three random peers; 5R = five random peers; WC = whole class; PAC = planned activity check; 2R = two random peers.
Discussion
Classroom observations are regularly conducted as part of special education evaluations with the purpose of generating estimates of the behavior of a target student and of other students in the same classroom. This type of classroom observation provides school personnel with a local normative sample of behavior which may be used to determine the need of services or the effect of intervention on a target student. Although time-sampling methods have been empirically evaluated and considered accurate in comparison with continuous recording methods (Meany-Daboul et al., 2013), there is an absence in the literature regarding the accuracy of peer comparison observation strategies. Despite frequent use, substantial variation in peer comparison observation strategies exist in the literature—with different procedures potentially resulting in different levels of error and limiting comparability across studies using disparate procedures. Because these data are often utilized in high-stakes decision making (e.g., special education classification, intervention intensity), it is necessary that these procedures be empirically evaluated. As such, the current study sought to identify levels of error inherent to frequently utilized strategies through the analysis of simulated classroom data. These results of this study may serve as a guide for practitioners when selecting an appropriate peer observation scheme.
Results of the current study provide estimates of accuracy for observations for both target students and their comparative sample. When considering data for the target student, the lowest levels of inaccuracy across observation durations and classroom compositions were found when using an Every Fifth interval strategy, closely followed by an Every Third interval strategy. This finding may be attributed to the relative frequency with which the behavior of the target student was sampled in comparison with other methods. Specifically, this method allowed for collection of data on the behavior of the target student during 80% of the observation, whereas other methods collected data on the target student during 50% to 66% of the observation. The higher proportion of intervals devoted to assessment of the target student’s behavior results in the behavior of the target student being more accurately represented by the estimate produced.
Regarding the accuracy with which the behavior of the peers sampled is represented by the peer estimate produced, methods in which peers were observed with equal frequency as the target student (i.e., Every Other; Three On, Three Off; Middle 50) were the most accurate. Of these equal-frequency methods, none were consistently identified as most accurate. These data suggest that the frequency with which peers are observed may be more important than the order in which peers are observed. Just as methods in which the target student is observed during Every Fifth interval, these methods are likely to be more accurate due to the fact that a greater sample of behavior is included in the estimate produced. No single number of peers sampled was consistently identified as most accurate across observation durations, with one random peer, three random peers, and five random peers being identified as producing the lowest amount of error at similar frequencies. Differences in the level of error may not have been observed due to the process by which classroom data was generated. These data may be better obtained in a practical classroom setting in comparison with computer simulated classrooms.
Although there was a lack of divergence regarding error levels for peer estimates representing the peers sampled, results of the study clearly identify a method of observation that results in the smallest difference between the criterion of classroom behavior and the estimate produced by the observation procedure. Across observation durations, PAC was identified as the most accurate procedure. PAC was not evaluated at every other interval as such a procedure would likely be infeasible in real-world settings (i.e., class-wide frequency counts every 20 s), but more frequent use of PAC was typically associated with lower rates of error. However, it should be noted that differences between PAC implemented Every Third and Every Fifth were often small, suggesting that PAC may reasonably be utilized during Every Fifth interval with acceptable levels of error. Overall, PAC is likely to generate the most accurate estimates of class-wide behavior due to the frequency with which peers were sampled. Specifically, PAC results in the behavior of each peer in the classroom being assessed during each observational interval, whereas all other methods utilized only assess the behavior of a single peer during each interval. As only one peer’s behavior is considered during each interval, these methods are insensitive to student behavior that occurs outside of the interval of observation—a problem not encountered when PAC is utilized. Although less frequently utilized in research, these results add to a growing body of literature supporting the accuracy of PAC in assessing behavior within classrooms (Dart et al., 2016).
For accuracy of single data points, a trend was noted across comparisons (i.e., target estimate to target true duration; peer estimate to peer true duration; peer estimate to classroom true duration) in observations of longer duration being associated with lower error. These findings are similar to previous research indicating that shorter observation durations may result in greater error (e.g., Karweit & Slavin, 1982; Mudford et al., 1990). Extending previous literature, the current data set allows for comparing the effect of duration on accuracy across estimate and criterion comparisons. Relatively larger differences in error between 10 min and 60 min observations were observed for peer estimate to peer criterion and peer estimate to classroom criterion, with differences being small for target student data regardless of the observation duration. Although the data collected in the current study do support the fact that longer observation durations produce more accurate estimates of behavior, they do call into question the practical significance of these differences. When using an Every Fifth PAC method, the data suggest that longer duration observations (e.g., 60 min) do not confer any substantial benefit over shorter duration (e.g., 10 min) observations. These results add to the literature suggesting that shorter duration observations may yield sufficiently representative estimates of behavior (e.g., Tiger et al., 2013).
Limitations
The results of the current study should be considered in light of its limitations. First, all observational procedures were applied to simulated data. As such, it is unknown whether procedures evaluated in the current study could be utilized effectively and efficiently in applied settings. Thus, although methods such as an Every Fifth PAC are robust under the simulated conditions evaluated in the current study, future researchers must replicate these findings in applied settings. Second, various parameters utilized in the simulated data may not approximate some applied settings. Specifically, behaviors demonstrated by students in applied settings may differ from the classroom compositions evaluated in the current study. However, as the purpose of the study was to evaluate the accuracy with which the observational procedures were able to generate estimates that approximate true duration of behavior, we believe that the simulated data were sufficient for these purposes. Relatedly, class size and duration of intervals (i.e., 10 s) were held constant in simulations. Future research should consider examining the accuracy of data across various lengths of intervals (e.g., 15 s) as previous research suggests that interval length can have an impact on the accuracy of data. Although the current study provides data regarding the accuracy of methods across a range of classroom compositions, real-world evaluations of these procedures in classrooms of varying sizes and behavioral compositions should be conducted.
Implications for Practice
As substantial variability was found in level of error across the procedures examined, current study highlights the need to carefully consider observational procedures utilized when conducting peer comparison observations for both evaluation and progress monitoring purposes. Error within observational data may result in incorrect decisions being made regarding the need for intervention or progress made during an intervention. In turn, incorrect decisions have the potential to delay change that may be necessary for a student’s academic or behavioral progress. In research settings, error within observational data may lead researchers to draw inaccurate conclusions about functional relationships between variables. When practitioners and researchers are selecting methodologies for behavioral assessment, they may consider the percent of error associated with each methodology. For high-stakes decisions (e.g., special education determination, research drawing functional relationships), methodologies that produce the most accurate estimates of behavior should be utilized. One way to account for these estimates of error may be to include them in future reports and manuscripts to aide in reviewers and practitioner’s decision-making processes.
The results of the current study suggest that an Every Fifth interval method produces the most accurate estimates of target student behavior, with PAC being the method associated with the lowest error regarding classroom behavior. As such, an Every Fifth PAC method may be considered ideal for conducting peer comparison observations. Previous literature has suggested that PAC may be challenging to conduct in some settings due to assessment of the behavior of all students within the classroom during one interval, as well as challenges in assessing interobserver agreement (Dart et al., 2016). As such, an Every Third Whole Class approach may be considered as a secondary option for conducting peer comparison observations. Although this approach is associated with greater error with respect to both target student and classroom behavior, it represents a feasible option that balances error in the assessment of both target student and classroom behavior. Furthermore, this method may require future evaluation regarding feasibility of the procedure in applied settings, given the already widespread use of such a procedure compared with PAC.
SDO is used frequently in schools to make decisions about students’ educational performance and progress; however, the accuracy of such decisions is contingent on the accuracy of the assessments used to inform them. Although future researchers should evaluate these procedure in applied settings, this study provides evidence that an Every Fifth PAC method provides the most accurate estimate of behavior when conducting peer comparison observations.
Footnotes
Declaration of Conflicting Interests
The author(s) declared no potential conflicts of interest with respect to the research, authorship, and/or publication of this article.
Funding
The author(s) received no financial support for the research, authorship, and/or publication of this article.
