
Abstract
Background:
The positive and negative affect schedule (PANAS) is widely used to assess positive (PA) and negative affect (NA). Despite its extensive global validation, its psychometric properties remain unexamined among the Indian youth population (IYP). This study aims to evaluate the structural validity, reliability (internal consistency), and criterion validity of the PANAS among IYP.
Methods:
This cross-sectional study involved 660 students (57.4% females, mean age 16.25 ± 2.79 years) from 10 educational institutions across five cities in [State name], India. Participants were selected using random sampling. They underwent a comprehensive assessment, including face-to-face semi-structured interviews using the PANAS, anxiety measures, depressive measures, and happiness measures. The SPSS (version 16) and JASP (version 0.14.1) software were used for reliability, validity, and factor analysis.
Results:
Confirmatory factor analysis (CFA) confirmed a two-independent-factor structure with satisfactory fitness indices (goodness-of-fit index [GFI] = 0.96; root mean square error of approximation = 0.07; standardized root mean square residual = 0.06). The PANAS factor loads ranged from 0.44 to 0.73. Internal consistency (Cronbach’s alpha) was 0.85 for PA and 0.83 for NA. Analyses showed adequate criterion validity.
Conclusion:
The findings demonstrate adequate structural validity, internal consistency, and criterion validity of the PANAS, confirming its suitability for assessing effect in IYP. However, some indices in CFA suggest further refinement.
Keywords
The PANAS has been validated for use in the IYP, demonstrating good reliability and validity in assessing positive and negative effects. This study confirmed a two-factor structure for PANAS, with satisfactory model fit and adequate internal consistency. This validation enables using PANAS in Indian settings to assess affective states.Key Messages
The positive and negative affect schedule (PANAS), is a widely used tool for measuring emotional experiences. 1 PANAS evaluates two primary emotional dimensions: Positive affect (PA), characterized by enthusiasm and joy, and negative affect (NA), marked by fear and sadness. Its ease of use and robust psychometric properties make PANAS a popular choice in psychology, education, and health sciences research. Researchers have investigated the PANAS’s factor structure, internal consistency, test-retest reliability, and convergent validity.2,3
The PANAS has been widely used and adapted globally, with translations in over 20 languages. A systematic review by Torres et al. identified three new scales, 19 translations, and 23 validation studies across various languages and regions. 4 The PANAS psychometric properties have been evaluated in diverse populations, including Spanish, 5 UK, 3 Portuguese, 6 Canadian, 7 Brazilian, 8 Hungarian, 9 Chinese, 10 French, 11 Korean, 12 and Indian populations. 13
However, research on the original PANAS’s factor structure in adolescent populations is limited, with only eight studies conducted to date.14–21 These studies yielded inconsistent findings, with some reporting poor model fit for two-factor models and others supporting two-factor models. These mixed results suggest the PANAS’s potential utility for assessing adolescent emotional experiences, but further research is necessary to confirm its validity and reliability in this population.
In India, previous studies have validated the PANAS, specifically among employees in manufacturing and service sector organizations. 13 The PANAS has been revised and culturally adapted for India to include two 13-item subscales: PANA 22 (Agrawal et al.). 23 Pandey and Srivastava developed a Hindi version of the PANAS (PANAS-H). They demonstrated its reliability and validity among a heterogeneous sample of 179 Hindi-speaking individuals, but further research is necessary to establish its convergent-discriminant validity and criterion-related validity. 24
Despite its widespread use, the PANAS psychometric properties remain largely unexplored among Indian adolescents and emerging adult populations. Torres et al.’s review highlights the need for rigorous translations and adaptations, particularly in diverse cultural contexts. Previous studies in India have primarily focused on employees in the manufacturing sector and a heterogeneous sample of Hindi-speaking individuals. In contrast, adolescents and emerging adult populations (10–30 years) are in critical developmental stages characterized by significant emotional and social changes. According to Erikson’s Psychosocial Theory, adolescence is marked by identity formation and exploration, 25 while Arnett’s theory describes emerging adulthood as a period of exploration, instability, and self-focused identity formation. 26 The cultural and socioeconomic contexts of Indian youth influence their emotional experiences and expressions, highlighting the need for culturally sensitive assessments.
To address these gaps, our study aims to evaluate the psychometric properties of the original PANAS in Indian adolescents and emerging adult populations (youth). Our study boasts a more diverse and representative sample of the Indian youth, comprising college students and CBSE school students from various regions. Notably, we selected a larger sample size (N = 660) to increase statistical power and precision. Our study employs a comprehensive validation approach, including confirmatory factor analysis (CFA), criterion validity assessments with anxiety, depressive measures, and a subjective happiness scale (SHS). This research contributes to the ongoing evaluation and refinement of this widely used measure. Ultimately, our findings will ensure the continued utility of the PANAS in research and applied settings, providing valuable insights into the emotional experiences of Indian youth.
Methods
Sample
This cross-sectional study randomly selected five cities in the (state name) and one school and one college from each city. Students from junior (8th–10th), high secondary (11th–12th), and graduate levels aged 10–30 were recruited through random sampling. The required sample size was determined using intra-class correlation coefficient (ICC) criteria, with a predetermined alpha level of 0.05, power of 0.95, and ICC of 0.25, resulting in a required sample size of 202.
Assessment Criteria
The inclusion criteria were: (a) Age: 10–30 years, (b) Enrollment in junior (8th–10th), high secondary (11th–12th), or graduate programs, (c) Proficiency in English (reading, writing, comprehension), and (d) Willingness to participate in the study by providing written informed consent. Exclusion Criteria included: (a) Not present at the time of the study, (b) History of severe mental illness, (c) Current substance abuse, (d) Significant cognitive impairment, (e) Receiving treatment for mental health issues, and (f) Chronic physical illness (e.g., diabetes, hypertension).
Procedure
The ethical approval of the research has been obtained from the Institutional Ethics Committee. Permission was obtained from school and college authorities to collect data from students. The investigator explained the study’s purpose to authorities, students, and parents. The students were contacted in their respective schools. Participants were assured of voluntary and anonymous involvement, with the right to withdraw at any time. Parental/guardian consent was obtained for all participants below the age of 18 (for such participants, assent was obtained).
This study began by explaining the questionnaire instructions to the participants. Initially, 700 students were contacted; of these, 660 (94%) completed the survey. Forty participants were excluded: 26 due to incomplete data, eight for failing to meet inclusion criteria, four with chronic medical disorders, and two receiving ongoing mental health treatment. The remaining 660 participants underwent a comprehensive assessment, which included face-to-face semi-structured interviews using the PANAS, anxiety measures, depressive measures, and happiness measures. Figure S1 (Supplementary online material) illustrates the participant selection process.
Upon completion, participants and authorities were thanked for their contribution and provided with contact information to request the study’s results. Data collection took place from March 2021 to January 2022.
Tools
Subjective Happiness Scale
The SHS is a 7-point Likert-type self-rating tool. The scale consisted of four items. The inner consistency of the scale was reported between 0.79 and 0.94 in different samples. Test-retest reliability was found between 0.55 and 0.90. The convergent validity of the SHS was supported by significant positive correlations, ranging from 0.52 to 0.72, with other well-established happiness measures. 27
Generalized Anxiety Disorder (GAD-7)
The GAD-7 was used to measure the severity of self-reported anxiety. 28 The GAD-7 is a reliable and valid instrument for assessing generalized anxiety symptoms in the general and clinical populations. The response options were: 0 = “not at all,” 1 = “several days,” 2 = “more than half the days,” and 3 = “nearly every day.” For the GAD-7, a total score of ≥10 indicated possible anxiety, with the optimal points for sensitivity (89%) and specificity (82%).29–31 The Cronbach’s alpha coefficient of the GAD-7 was 0.95.
Patient Health Questionnaire (PHQ-9)
It is a 9-item self-report questionnaire. Each item is rated on a 4-point scale, that is, 0–3 (“not at all” to “nearly every day”), with a total score ranging from 0 to 27—the higher the score, the higher the severity of depression. Cronbach alpha for the questionnaire was 0.89, and test-retest reliability was also excellent. 32 The Cohen kappa value of the scale is 0.65, with a sensitivity of 75% and specificity of 90% 0.28. A score of ≥10 on PHQ-9 indicates clinical depression. A short form of PHQ-9 is available as PHQ-2. 33 The Hindi version of the scale has been evaluated for its psychometric properties. 34
Positive Affect Negative Affect Scale
We used the state version of the PANAS, asking participants to report on their emotions experienced over the past week. The scale consisted of 20 affective expressions, 10 of which are PA and 10 of which are NA. It has a 5-item Likert-type answer sheet (1- Very slightly or not at all to 5- Extremely). Watson et al. reported the inner consistency of the scale as 0.86–0.90 for the “positive emotions” dimension and 0.84–0.87 for the “negative emotions” dimension. 1
The study is reported as per the STROBE statement. 35
Data Analyses
Exploratory factor analysis (EFA) and CFA were performed with the SPSS (16th version) and the JASP-0.19.3.0-Windows software. Summary statistics mean and standard deviation, frequencies, and percentages were used for reporting demographic characteristics. We conducted CFA using the maximum likelihood method to examine the factor structure in the sample. The satisfactory indices of fitness of the CFA model were evaluated with the help of the goodness-of-fit index (GFI), comparative fit index (CFI), Tucker–Lewis index (TLI), root mean square error of approximation (RMSEA), and Standardized root mean square residual (SRMR). Reliability was analyzed by calculating internal consistency (Cronbach alpha) separately with the PA and NA items. To examine criterion validity, correlations between the PA and NA and measures of anxiety (GAD-7), depression (PHQ-9), and Happiness (SHS) were calculated.
Results
The mean age of the participants was 16.25 (2.79) years. Females constituted 57.4% of the total sample. The number of participants under 15–19 was 487 (73%). Of the participants, 467 were from rural areas, and 149 were from urban areas. Regarding education level, 89 participants were from middle school, 242 were from high school education, 291 were from high secondary education, and 38 had some form of post-secondary education. The majority of parents (96.1%) were employed in government jobs, with smaller percentages in part-time jobs, business, private jobs, and other occupations. The detailed characteristics of the participants are reported in Table S1 (Supplementary online material).
We compared the mean PA and NA according to gender, age, education, and locality. The ANOVA results revealed that locality has a significant impact on both PA and NA. Specifically, the results showed that individuals from rural, semi-urban, and urban localities differ significantly in terms of PA (F = 3.79, P = .02) and NA (F = 2.97, P =.05). This suggests that the environment and cultural context in which individuals live play a role in shaping their emotional experiences.
In contrast, the results showed that education level and age do not have a significant impact on either PA or NA. This suggests that emotional experiences may not be strongly influenced by educational background or age. Additionally, the results revealed that gender does not have a significant impact on either PA or NA, indicating that males and females do not differ significantly in terms of emotional experiences. Overall, these findings highlight the importance of considering the environmental and cultural context in which individuals live when seeking to understand and promote mental well-being.
Exploratory Factor Analysis
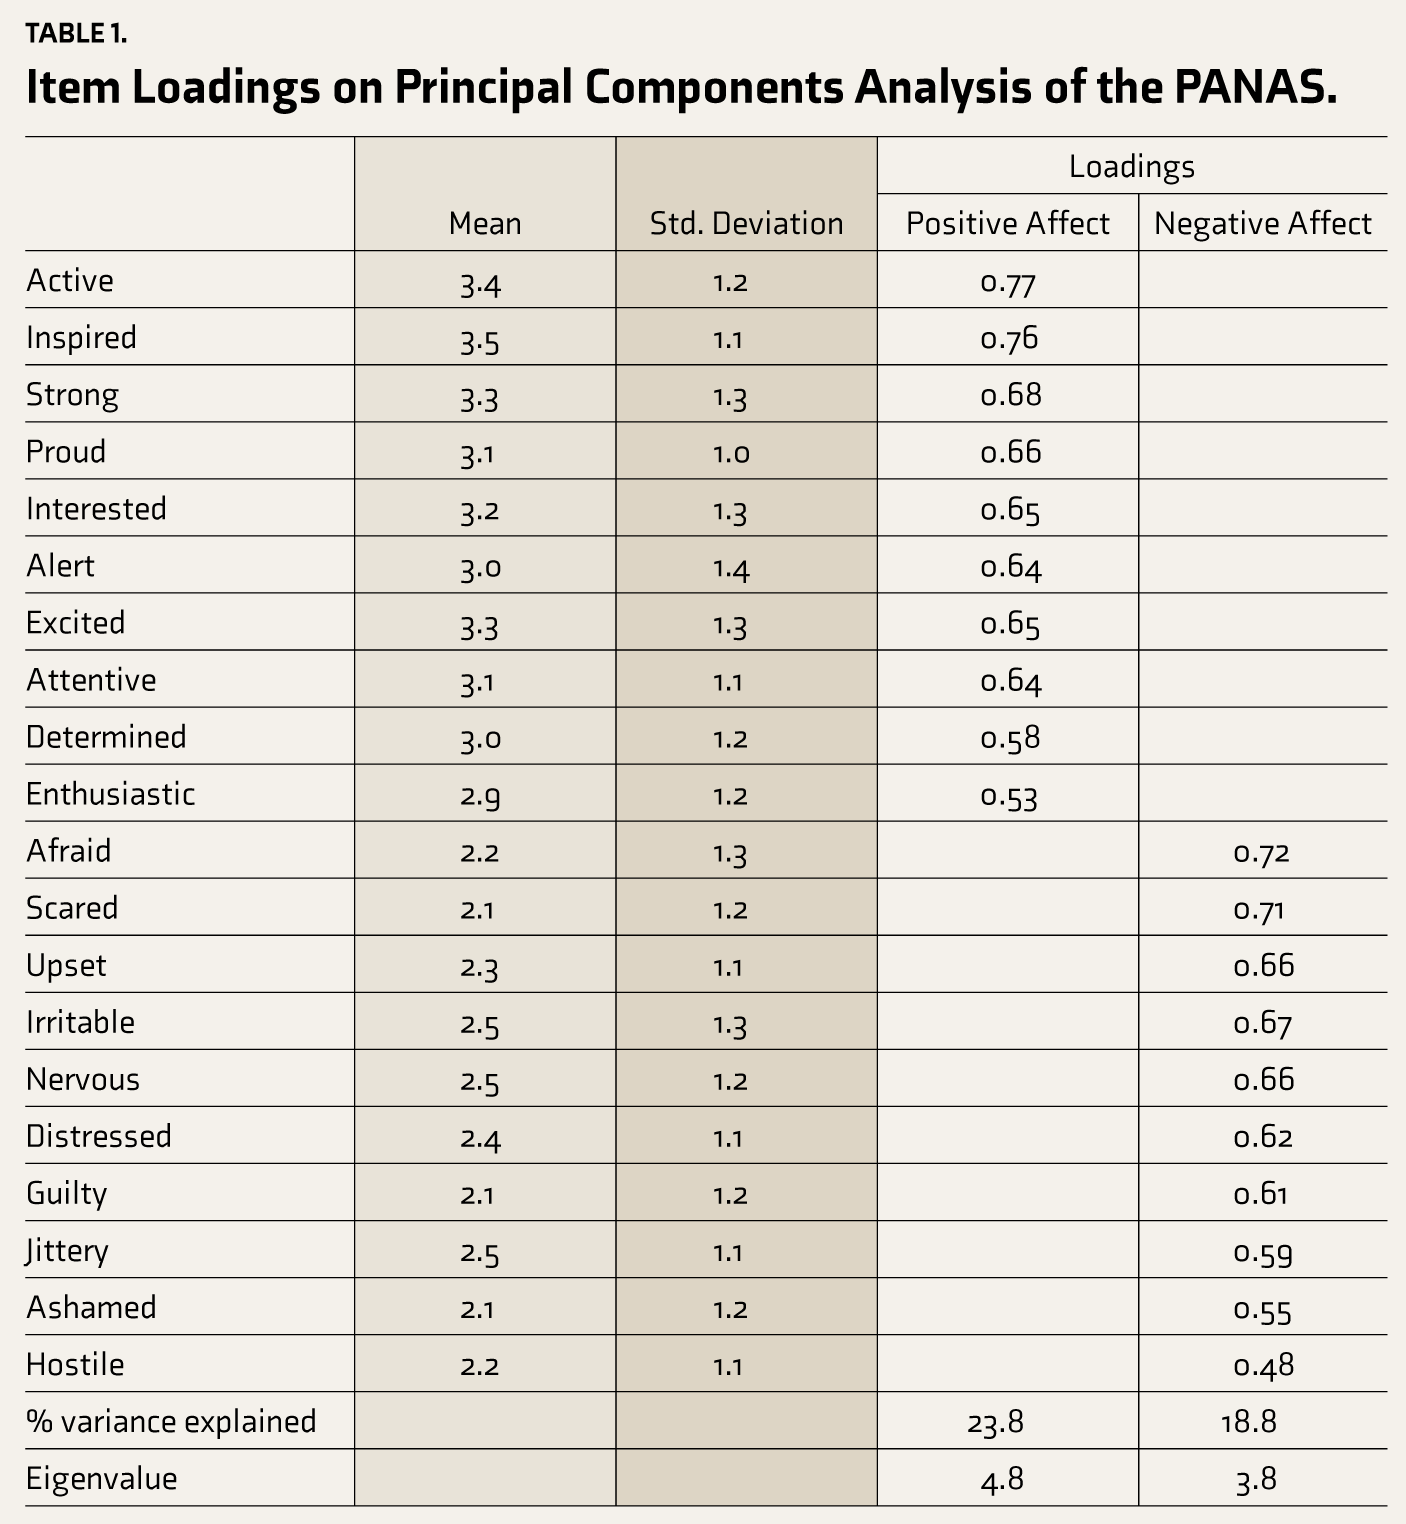
The data were checked for suitability for EFA. The results showed a Kaiser-Meyer-Olkin (KMO) value of 0.86, indicating adequate sampling, and Bartlett’s test of sphericity revealed significant inter-item correlations (P < .001), confirming the data’s good fit for analysis. Eigenvalue (>1.0) was considered to examine the number of factors in the PANAS. Eigenvalues of the EFA indicate that two factors explain 23.84 and 18.77 of the variances, respectively. Overall, two factors accounted for 43% of the variance in the variable (Table 1). The Varimax rotation method was used to achieve rotated factor loadings for the scale. The factor loadings, ranging from 0.48 to 0.76, indicated strong relationships between items within each factor.
Item Loadings on Principal Components Analysis of the PANAS.
Structural Validity
Confirmatory Factor Analysis
The CFA was performed for PANAS, and the results confirmed the two-factor model in a sample consisting of school and college students of Chhattisgarh. We used a subset of commonly reported fit indices (e.g., CFI, TLI, RMSEA) to evaluate the model’s suitability. Model fit was good in the samples (see Table 2).
Model Fit Score of CFA Among the Total Sample.
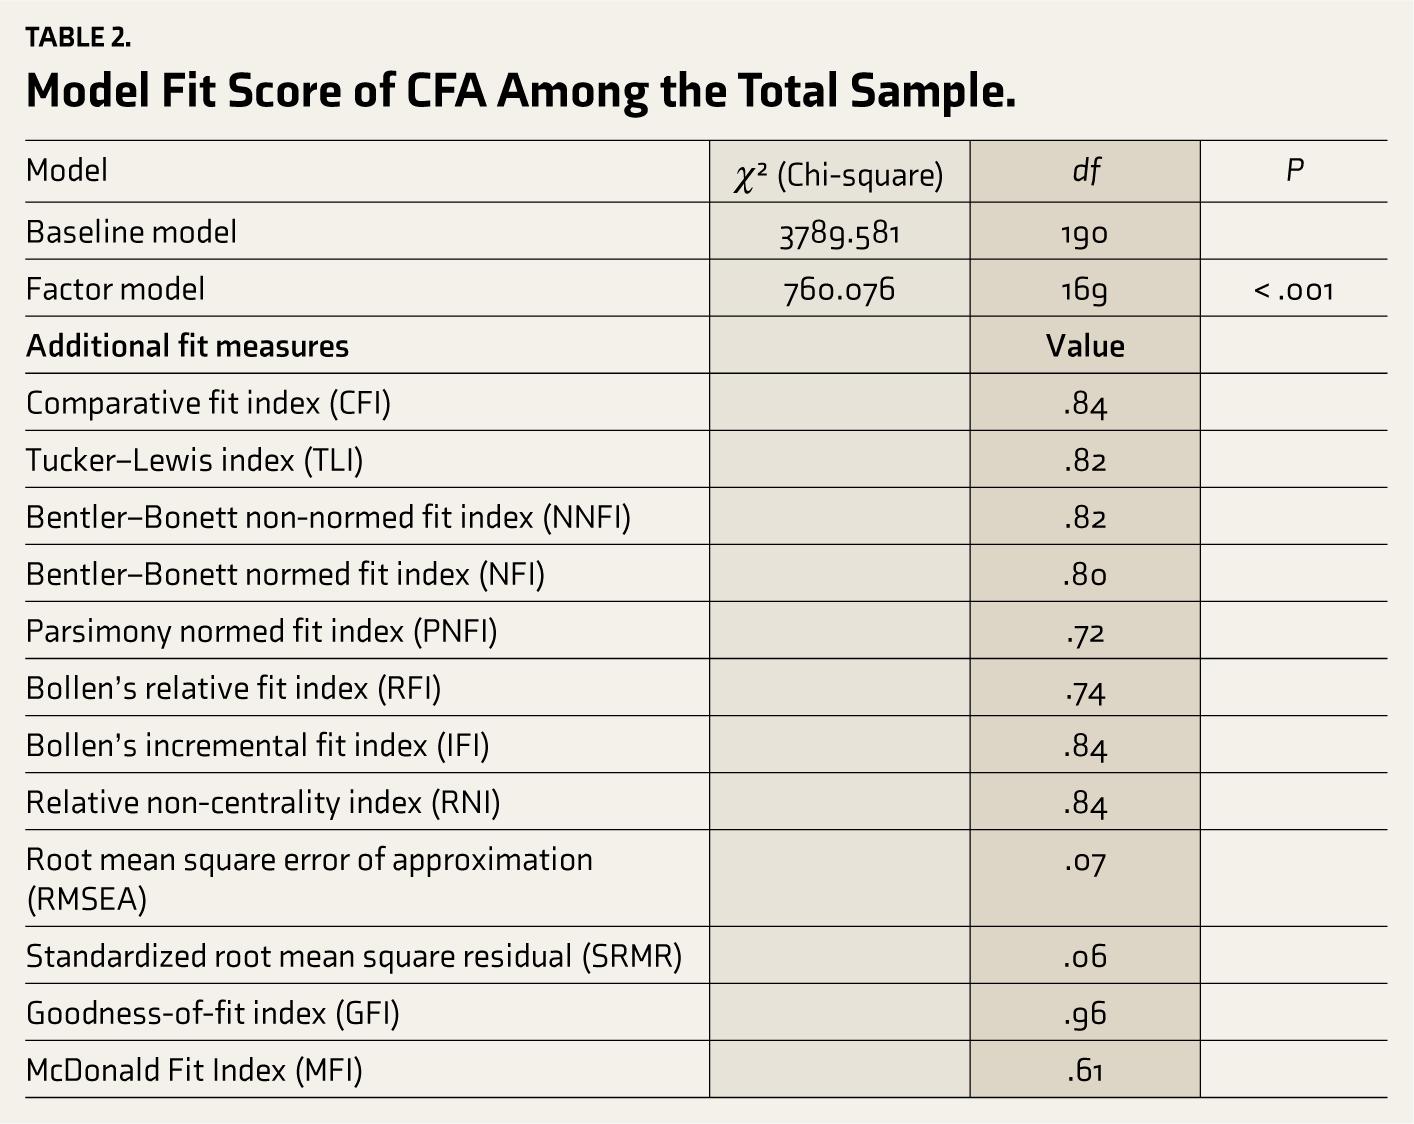
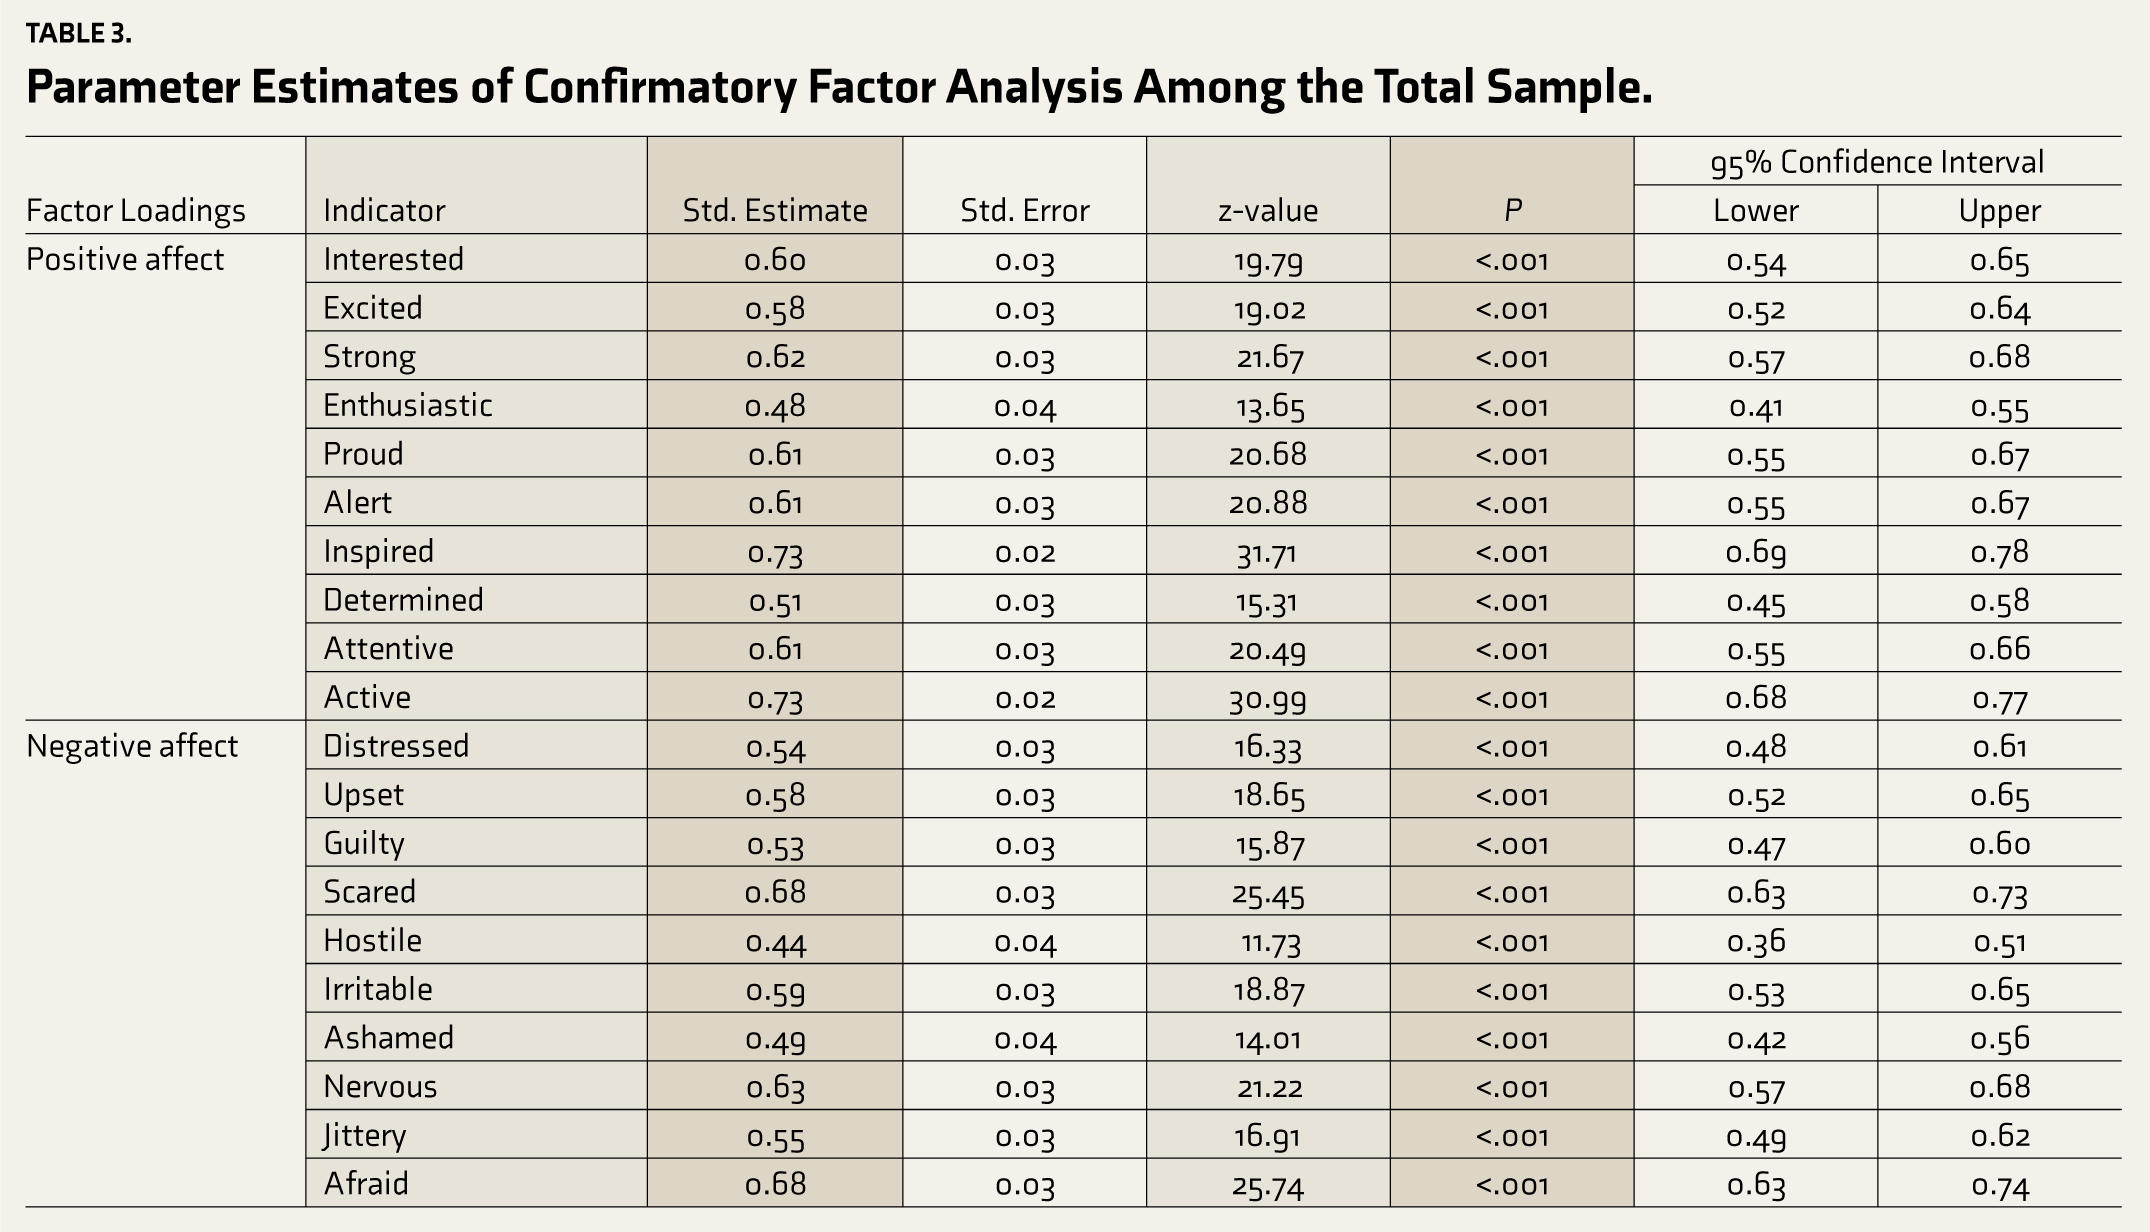
Figure S2 and Table 3 show the regression weights for the CFA model. All values depicted in Figure S2 and Table 3 for all participants–PA and NA subscales show the most significant values (>0.44). As mentioned above, all factor loadings were statistically significant (P < .001) and large. Concerning the first factor (NA), all standardized loadings ranged from 0.44 to 0.68. Regarding the second factor (PA), standardized loadings were significant again with a minimum of 0.48 and a maximum of 0.73. Standardized factor loads and z-value regarding items of CFA are presented in Table 3 and Figure S2.
Parameter Estimates of Confirmatory Factor Analysis Among the Total Sample.
Reliability Study
Our results demonstrate excellent internal consistency for SHS (Cronbach α = 0.70), GAD-7 (Cronbach α = 0.86), PHQ-9 (Cronbach α = 0.87), and PANAS (Cronbach α = 0.83 for NA, Cronbach α = 0.86 for PA). The McDonald’s omega coefficient (ω) for NA is 0.83, and for PA, it is 0.86, indicating excellent reliability. Tables 5 and 6 display separate correlations among PA items and NA items, respectively, along with Cronbach alphas when omitting items, and corrected correlations between each item and the total score. These results indicate that the scale exhibits high-reliability values. Deleting any item does not significantly improve the overall Cronbach α values (Tables 4 and 5).
Correlations Between Items, Cronbach Alpha if an Item is Deleted and Corrected Item-total Correlations of Positive Affect.
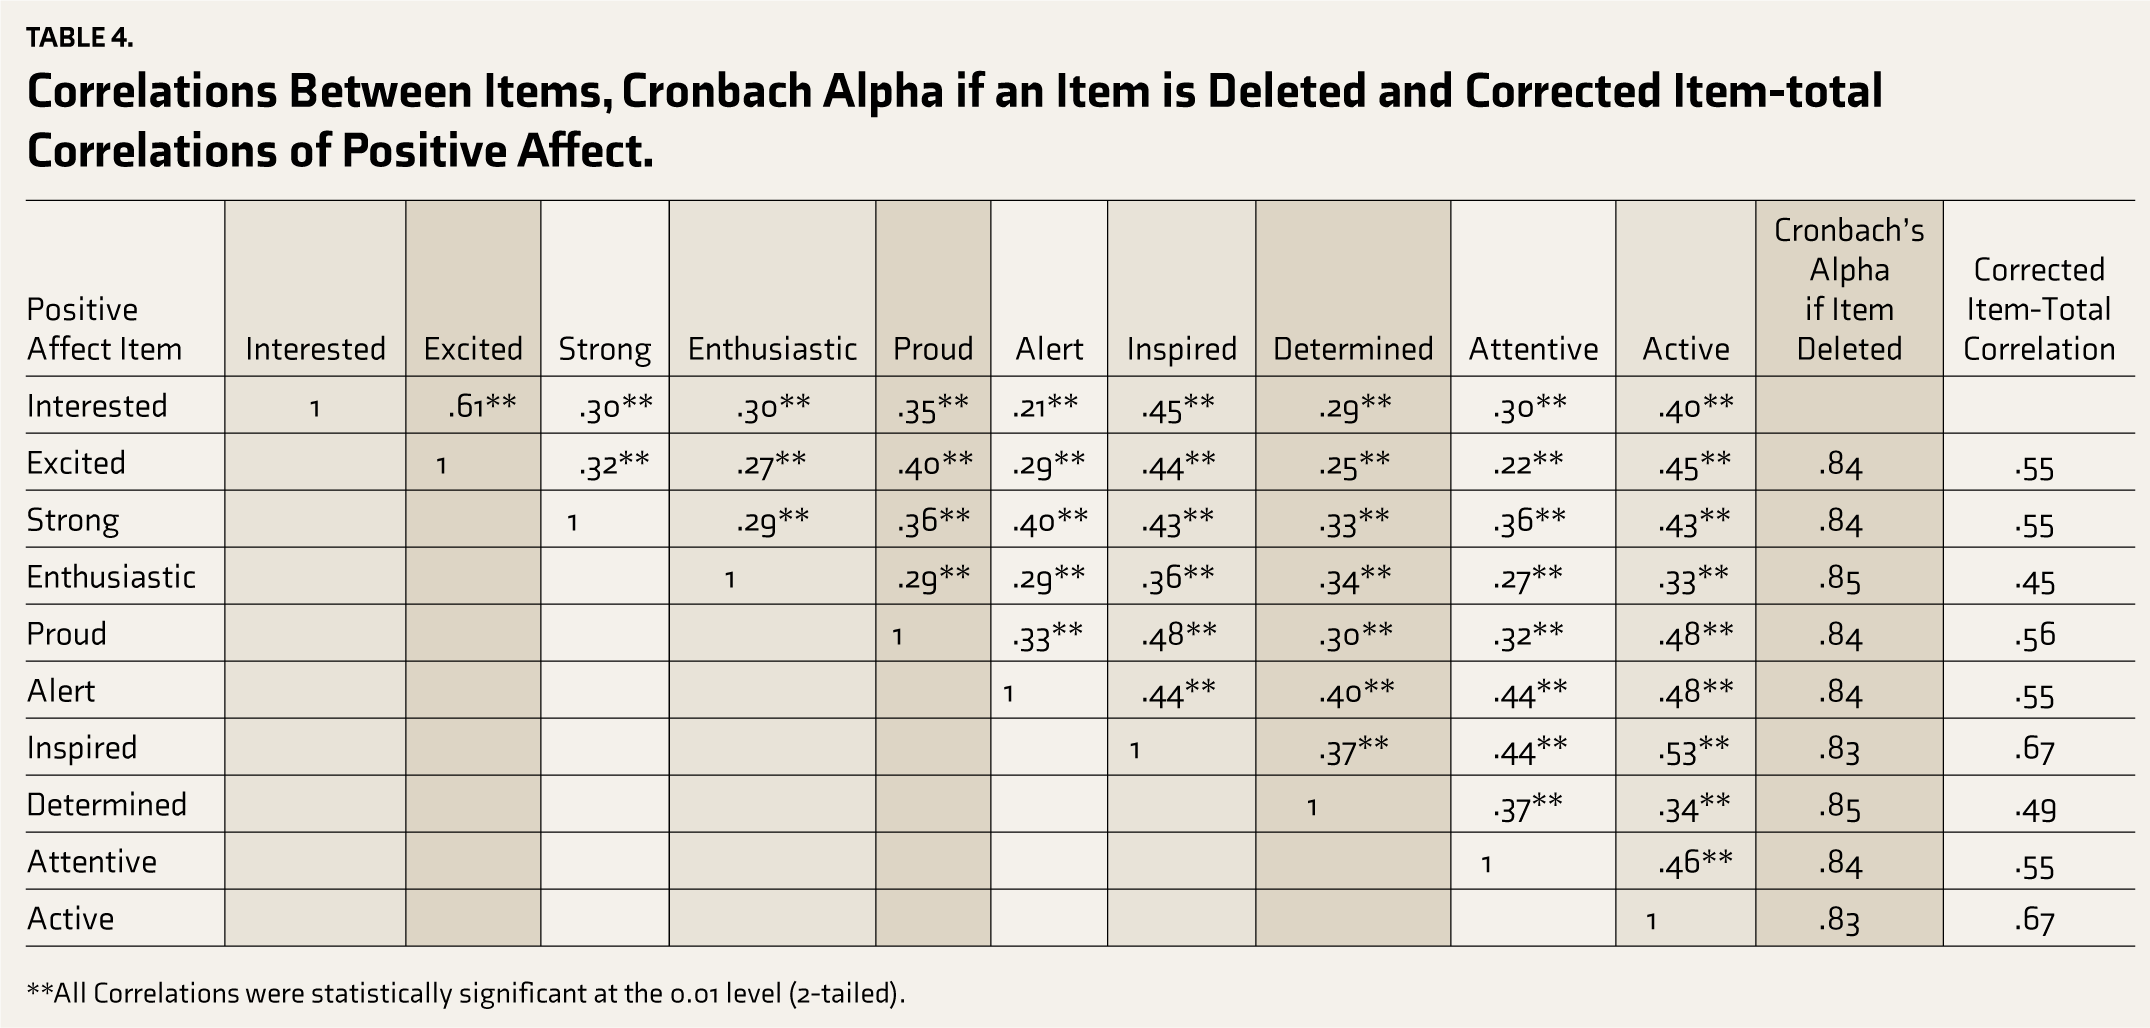
**All Correlations were statistically significant at the 0.01 level (2-tailed).
Correlations Between Items, Cronbach Alpha if an Item is Deleted and Corrected Item-total Correlations of Negative Affect.
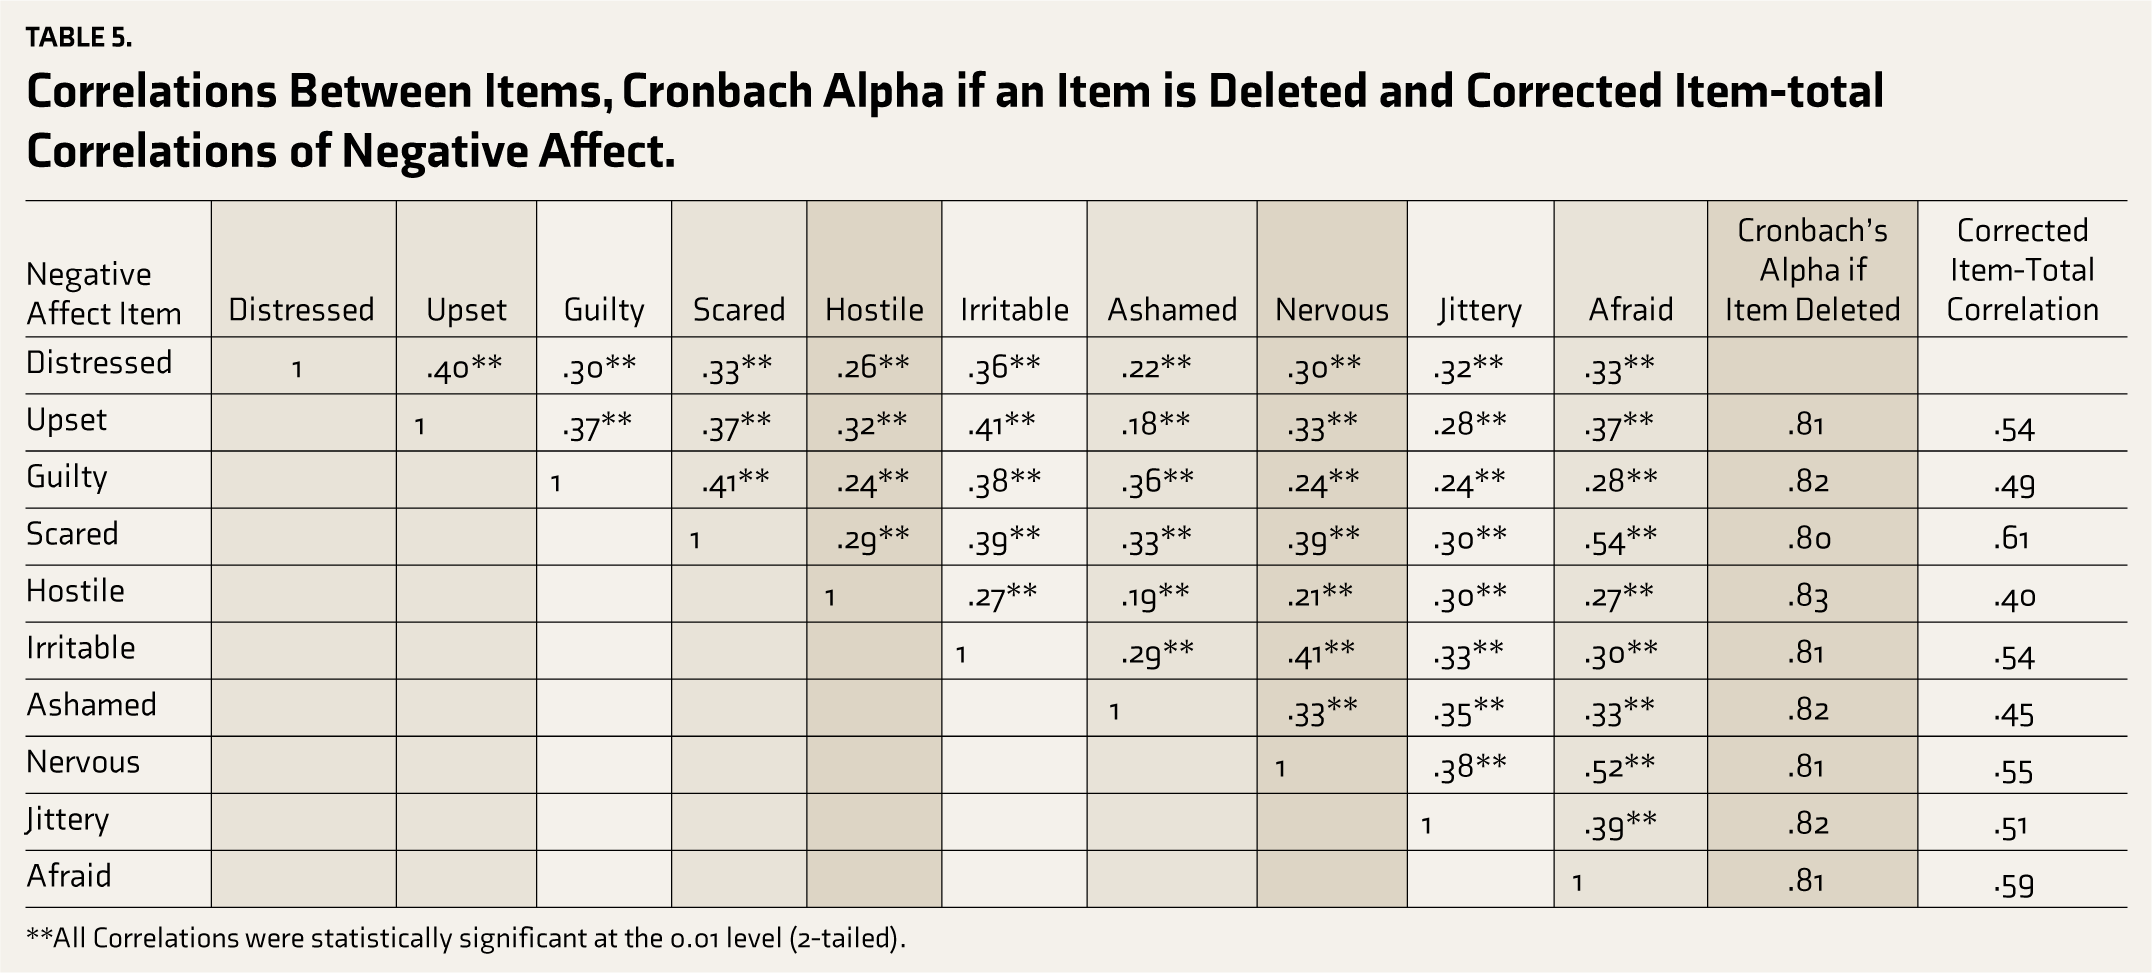
**All Correlations were statistically significant at the 0.01 level (2-tailed).
Validity
Table 6 shows the correlations between PA and NA and criterion validity measures. Significant correlations were found between PA and NA and all the measures. A negative correlation was found between NA and PA (r = −0.16, P < .01). Negative correlations were found between NA and SHS (r = −0.11), P < .05). By contrast, positive correlations were found between NA and depression (PHQ-9: r = 0.50, P < .01) and anxiety measures (GAD-7: r = 0.43, P < .01). Finally, a negative correlation was found between PA and depression (PHQ-9: r = −0.12, P < .01) and anxiety (GAD-7: r = −0.10, P < .05) and a positive correlation was found between PA and SHS (r = 0.34, P < .01).
PHQ, Patient Health Questionnaire, GAD, Generalized Anxiety Disorder, SHS, Subjective Happiness Scale.
Discussion
This study assessed the psychometric properties of the PANAS, originally developed by Watson, 13 among the Indian youth population (IYP). An exploratory principal components analysis yielded two distinct factors, corresponding to negative and PA, which is consistent with the theoretical framework of the PANAS. Notably, each item demonstrated a clear factor with high loadings. The analysis revealed a two-component structure, mirroring findings from previous research conducted among adolescents and adults.1,36,37 The two factors collectively accounted for approximately 43% of the variance, aligning with the explained variance reported in earlier studies.38,39 These results provide evidence for the factorial validity of the PANAS among the IYP.
A CFA was conducted to validate two factorial structures among IYP. The results showed that the factor model demonstrated a significantly better fit than the baseline model, as evidenced by a chi-square value of 760.076 (df = 169, P < .001) compared to 3789.581 (df = 190). Most fit indices indicate a relatively good fit, with values above 0.80 for CFI (0.84), 40 TLI (0.82), 41 NNFI (0.82), NFI (0.80), 42 IFI (0.84), 43 and RNI (0.84). 44 However, some indices are below 0.80, including PNFI (0.71) and RFI (0.78).
According to Kline, commonly used fit indices such as the GFI Index, Adjusted Goodness-of-Fit Index (AGFI), NFI, NNFI, CFI, and IFI should ideally exceed 0.85 45 (Kaya and Altinkurt; Vassallo and Saba).46,47 Alternatively, Byrne and Campbell suggest that AGFI, GFI, and CFI values above 0.80 are acceptable, 48 (Nayir). 49 Specifically, Sica and Ghisi recommend GFI ≥ 0.85 and AGFI ≥ 0.80 as indicators of a good fit. Notably, both GFI and AGFI are sensitive to sample size. 50
The Root Mean Square Error of Approximation (RMSEA) (0.07) value indicates a relatively good fit, as values less than 0.08 are considered acceptable. RMSEA values between 0.05 and 0.08 are acceptable, values between 0.08 and 0.1 are marginal, and values greater than 0.1 are poor. 51 The Standardized Root Mean Square Residual (SRMR) (0.06) value also indicates a good fit, as values less than 0.08 are considered acceptable.45,52–54
Additionally, the GFI (0.96) value indicates a good fit,55–58 while the MFI (0.61) value is a bit low, as values greater than 0.90 are considered good. Overall, the factor model has a good fit, but some indices suggest room for improvement. The present study also replicates these findings and provides cross-cultural validation of the staging model proposed by the author. These findings provide evidence for the structural validity.
The scale demonstrated high Cronbach’s alpha for the PA scale and the NA scale. Cronbach’s alpha values were slightly lower compared to the original scale. Similarly, adolescent samples studied by Crocker yielded alpha coefficients of 0.88 for PA and 0.79 for NA 0.62. In contrast, a Cronbach’s alpha value of 0.80 for a scale is considered a good indicator of the scale’s internal consistency. Hence, the PANAS has good internal consistency, and the items of each factor assess similar characteristics. According to Gozum and Aksayan, 59 a Cronbach Alpha coefficient in the range of 0.60–0.80 is considered reasonably reliable. In contrast, a coefficient in the range of 0.80–1.00 is considered highly reliable. The high McDonald’s omega coefficient (ω) suggests that PANAS demonstrates strong internal consistency. This indicates that the items within the scale are highly correlated and effectively measure the intended construct.
The correlations presented in Table 6 reveal significant relationships of PA and NA with various validity measures. NA is positively correlated with depression (PHQ-9) and anxiety measures (GAD-7), suggesting that increased NA is associated with higher levels of depression and anxiety. In contrast, PA is negatively correlated with depression (PHQ-9) and anxiety measures (GAD-7), indicating that higher PA is linked to lower levels of depression and anxiety. Additionally, PA is positively correlated with the SHS, suggesting that individuals with higher PA tend to report greater happiness. These findings support the criterion validity of the PA and NA measures, highlighting their relationships with established measures of depression, anxiety, and happiness. 60 The relationship between the two factors, PA and NA, was statistically significant, which aligns with previous findings.36,60
Correlations of Positive Affect and Negative Affect with Criterion Validity Measures.
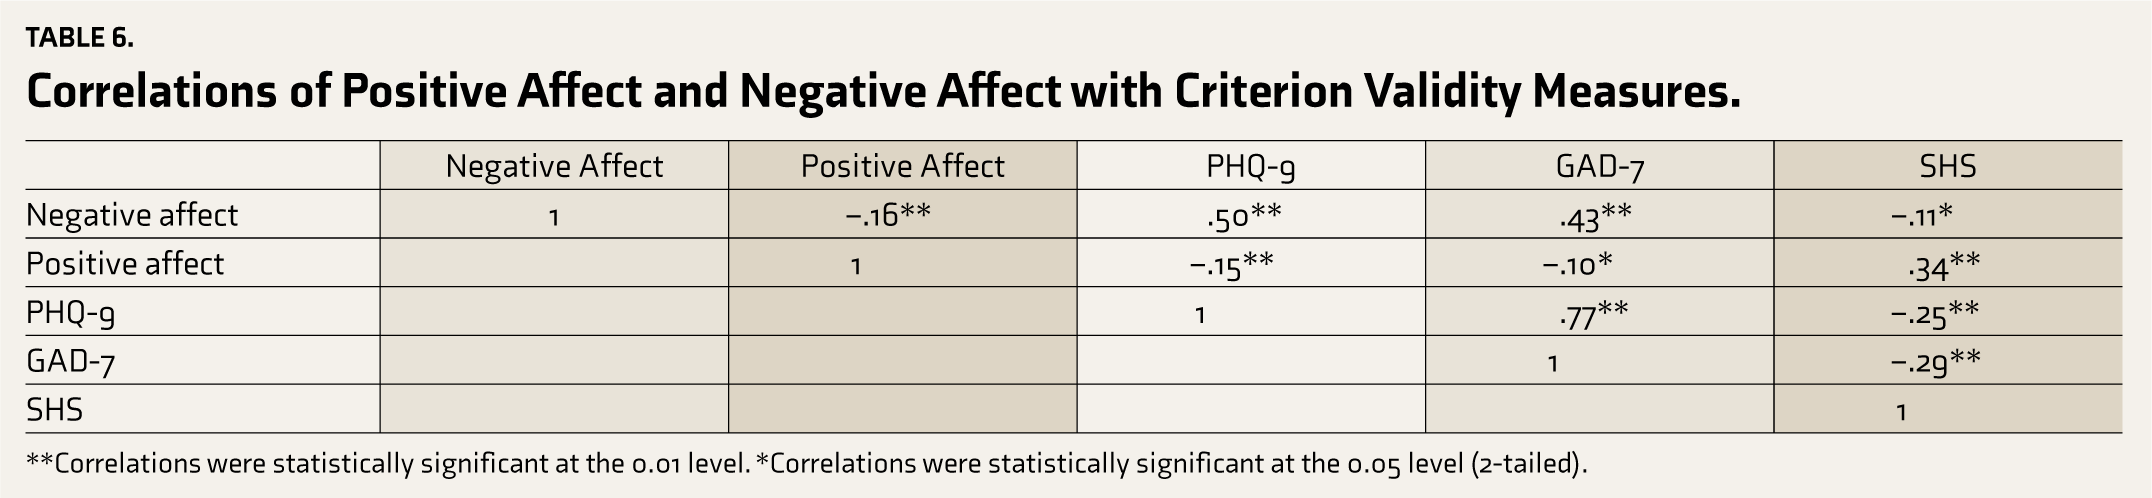
**Correlations were statistically significant at the 0.01 level. *Correlations were statistically significant at the 0.05 level (2-tailed).
Limitations
First, the sample was limited to school and college students aged 10–30, which may not be representative of the broader population. Additionally, the geographic scope was restricted to one state (Name) of India, potentially limiting generalizability to other regions or cultural contexts. The study only examined internal consistency using Cronbach’s alpha and McDonald’s alpha, and future studies should consider test-retest reliability to establish stability over time. The cross-sectional design limits causal inferences and understanding of temporal relationships. The study only included English-proficient participants, excluding those who may not comprehend English. The study lacked longitudinal follow-up, which could have investigated the stability of PANAS scores over time or the predictive validity of the measure. Lastly, while providing cross-cultural validation, cultural adaptation of PANAS for the IYP may require further investigation. The findings may not generalize to clinical populations or individuals with severe mental health conditions. These limitations highlight areas for future research to strengthen the validity and reliability of PANAS in diverse contexts.
Conclusions
CFA confirmed the PANAS two-factor structure with good model fit indices, but some indices suggest further refinement. The scale exhibited adequate internal consistency, structural validity, and criterion validity, establishing its suitability for assessing positive and negative effects in IYP.
Supplemental Material
Supplemental material for this article available online.
Supplemental Material
Supplemental material for this article available online.
Supplemental Material
Supplemental material for this article available online.
Footnotes
Acknowledgements
The authors would like to acknowledge all the participants who helped in validation of Positive and Negative Affect Schedule.
Declaration of Conflicting Interests
The authors declared no potential conflicts of interest with respect to the research, authorship, and/or publication of this article.
Declaration Regarding the Use of Generative AI
We did not use AI tools to collect or analyze data, produce images or graphs, or write this article. We assume full responsibility for the entire content of the manuscript..
Ethical Approval
The ethical approval of the research has been taken by Institutional Ethics Committee (IEC) Pt. Ravishankar Shukla University, Raipur Chhattisgarh (6917/Acad.Ph.D./2018).
Funding
The authors received no financial support for the research, authorship and/or publication of this article.
Informed Consent
A written Informed consent was obtained from Individual participant after a brief description about the aims and objectives of the study.
References
Supplementary Material
Please find the following supplemental material available below.
For Open Access articles published under a Creative Commons License, all supplemental material carries the same license as the article it is associated with.
For non-Open Access articles published, all supplemental material carries a non-exclusive license, and permission requests for re-use of supplemental material or any part of supplemental material shall be sent directly to the copyright owner as specified in the copyright notice associated with the article.