
Abstract
The university academicians who form the backbone of the higher education set-up need better policies, training programmes, managerial support and frequent satisfaction measures to ensure their productivity, motivation and commitment to work are enhanced. The benefits of a high job satisfaction have been well-documented, but there is a definite gap in its measurement in academia. An exhaustive literature review across nine countries has shown that job satisfaction of academicians remains a lagging area of study. This article is based on a doctoral dissertation that measured the job satisfaction of 350 teachers of four higher education institutions of India using the teacher job satisfaction questionnaire (TJSQ) developed by Paula Lester. The sample was selected randomly with proportionate stratified sampling based on designations across four institutes of higher learning: Delhi University, Jamia Millia Islamia, Indian Institute of Management, Lucknow, and Indian Institute of Technology, Delhi. The findings suggested the teachers are satisfied with their jobs with the highest satisfaction reported with teaching responsibility, advancement opportunities and work itself. However, working conditions, pay and recognition were the most-cited causes for dissatisfaction. Factor analysis showed some interesting results where the number of factors remained the same at nine but their nature was slightly different. Further analyses of personal, institutional and socio-economic factors through regression models revealed interesting insights. It was also observed that these findings resonate with those observed globally among teachers, showing a need for teacher development across the world.
Introduction
Since being defined for the first time by Hoppock (1935), job satisfaction has remained widely popular among researchers, as well as the practitioners. Its positive outcomes of reducing attrition, absenteeism, and enhancing motivation, organizational commitment and happier employees across sectors have made it an extremely important tool for managerial success. In the education sector, job satisfaction has been found to increase productivity in terms of better examination results and research output by teachers, making it all the more significant for researchers. In India, there have been a number of studies focussing on primary and secondary school teachers and their satisfaction; however, there has been limited work done on university level academicians’ satisfaction. This is surprising as there has been an exponential growth in higher education here. With a growing young population and parents’ aspirations, the number of students entering higher education has increased, and the government has started a number of new state and central universities as well as premier institutions of higher learning. This, in turn, has aggravated the issues plaguing the higher education faculty in India. The vacancies have gone up, the management is compromising with both quantity and quality of teachers, the gap between pay and other facilities of corporate workers and teachers has become very wide and the private institutions are exploiting their faculty. In a survey of 6,494 teachers across 546 cities and towns of India, 45 per cent students were described as not actively engaged with 42 per cent decline in their values and ethics reported by the teachers (Pearson, 2017). Moreover, engagement to learning shows a sharp drop while entering higher education. Only 30 per cent higher education teachers were satisfied with training support while for school teachers, this number stood at 70 per cent. In an earlier survey by Pearson, it was reported that a huge qualification–job skill gulf exists where the students graduating are repeatedly reported to be lacking basic communication, as well as computer and analytical skills to perform jobs (Pearson, 2016).1
In such a scenario, one small step is to ensure that the teachers, who have such a profound effect intellectually on their pupils, are satisfied and content in their jobs. Further, the study also explores how the individual factors that impact job satisfaction are perceived by the academicians in order to assess their role towards it.
Higher Education in India
In 2018, the Indian higher education system consisted of 903 universities with more than 39,000 colleges with 47 central universities, 370 state universities and 343 private universities along with many other deemed, open and other kinds of higher educational institutions (Ministry of Human Resource Development, 2018). For an enrolment of around 36.6 million students in the Indian higher education sector in 2017, 1.28 million teachers were employed in these institutions in 2017–2018 as compared to 0.46 million in 2004–2005. Most academics (84%) were associated with affiliated colleges and only 16 per cent taught in the universities and associated colleges (Ministry of Human Resource Development, 2015). Teachers in universities had an average of 30 students in class; however, the faculty in private institutes were handling more than 70 students per class. Recent developments, like the replacement of the University Grants Commission (UGC) established in 1957 by a new Higher Education Commission of India (HECI) among many others, have also affected the status quo in higher education (Sundar, 2018).
To complicate matters further, teaching, which was never a lucrative profession, is miles away from the remunerations offered by the corporate sector today and cannot match the facilities provided therein. The vacancies in teaching positions, especially rampant for the more senior roles, are casting a body blow to teaching along with the diminishing quality of available teachers. The Pay Review Committee (2008) had reported that there are 58 per cent vacant teaching positions across the country (Pay Review Committee, 2008).2 The shortfall of teachers makes training programmes a difficulty as well; as how does one spare scarce resources? The teachers are today expected to keep abreast of all current affairs, move in line with the demands of the industry and update their pedagogy and courses with time. The private institutes use their faculty members as event managers and placement in charges, further amplifying their plight. Employment of part-time or ad-hoc teachers, who are often graduates from the same institute, is a rampant practice today. These temporary replacements are ill paid, often abused with the undesirable chores by senior faculty members and have no job security or prestige. These teachers, who have not been made part of this study, are increasingly taking classes and mentoring roles.
The next major issue is the outmoded infrastructure, both physical and procedural. The ever-increasing population demands computerized systems for maintaining records, state-of-the-art teaching aids, regular tie-ups with industry and frequent curricula updations, amongst other measures. Federation of Indian Chambers of Commerce and Industry (FICCI), 2012, has reported that the Chinese publish five times more research papers than the Indian academics. As a result, Indian researchers have only half the world’s average citations (Federation of Indian Chambers of Commerce and Industry [FICCI], 2012). This suggests immediate remedial measures to improve the quantity, as well as the quality of publications.
It is projected that by the year 2030, 10 per cent of the world’s youth will be of Indian origin (United Nations, Department of Economic and Social Affairs, 2014). India’s economy is growing at a rate of 6–7 per cent annually with the current rate of growth at 7.4 per cent (News on Air, 2018). This growth will stagnate unless skilled labour is available to fuel it with estimates of a demand for 250 million workers in the near future (Shekhawat & Sodha, 2016; The World Bank, 2017). Reports even suggest that India may even catch up to the US by 2020 and China by 2030 to become the greatest education system in the globe (British Council, 2014). Again, to fuel this growth in the education system, there is a need for infrastructure which includes the faculty. As a result, it is necessary to explore the factors that attract academics to their job and retain them in it. These factors will be of immense use to attract industry veterans who can be offered honorary positions for teaching. Further, teachers who are not satisfied are not likely to fulfil these requirements and perform their roles well. They are unlikely to act as good ambassadors and spokesmen for the job as well. Therefore, their job satisfaction needs immediate and consistent attention.
What Is Job Satisfaction?
Job satisfaction has been defined by many luminaries. Mobley and Locke (1970) believed ‘Job satisfaction and dissatisfaction are functions of the perceived relationship between what one expects and obtains from one’s job and how much importance or value one attributes to it’. Locke (1970) had described job satisfaction ‘as a pleasurable or positive state of mind resulting from the appraisal of one’s job or job experiences’. Happiness at work is a cornerstone for creativity, innovation, organizational commitment and citizenship and is bound to be transferred to others. Imagine a workplace full of irritable, disgruntled and cranky employees who are deeply unhappy with their jobs and what effect it would have on a new recruit. ‘More Job satisfaction benefits include reduction in complaints and grievances, absenteeism, turnover, and termination; as well as improvement in punctuality and morale. It is also linked with a healthier work force’ (Robbins & Judge, 2015).3
Job satisfaction can be explained as a single dimension as well as a multi-dimensional construct. As a single dimension, it measures whether a person is satisfied or not, as a whole. While as a multi-dimensional construct, job satisfaction will allow measurement of the various factors that make up an individual’s satisfaction. For the purposes of this study, we have measured job satisfaction as a whole, as well as all the factors of job satisfaction as they appeal to the teachers. The nine factors covered in this study are supervision, colleagues, working conditions, work itself, advancement, responsibility, recognition, security and pay. These variables are also identified as being significant to teachers’ job satisfaction by other studies (Fernet, Trépanier, Austin, & Levesque-Côté, 2016; Machin & Oswald, 2000; Usop, Askandar, Langguyuan–Kadtong, & Usop, 2013; Vygovskaya-Kazarina, Kutieva, Orekhova, & Safronova, 2018). As satisfaction is a function of the perceived effort extended to achieve something and the reward at the end of the perseverance, it will be interesting to see how teachers evaluate their satisfaction with the individual factors.
Job Satisfaction in Academia
Teaching is a profession that attracts individuals drawn by other factors than pay (Machin & Oswald, 2000; Rosen, 1986; Stevens, 2005). The prestige, sense of self-esteem, independent style of working and relatively loose supervisory controls may be some of these factors. To be a better teacher, one needs to groom, train and enhance one’s own personality. The job is very similar in this respect to an actor’s. The feedback of a good ‘performance’ is instantaneous, as the audience is in effect their customers. Another aspect of teaching is research, which has also been found to enhance job satisfaction. What causes dissatisfaction for teachers must be the external aspects of the jobs, which were defined as hygiene factors by earlier authors (Graham & Messner, 1998; Herzberg, 1966; Sergiovanni, 1967).
Unlike office employees, job dissatisfaction in teachers does not only translate to bad performance, lack of morale, absenteeism and attrition alone. Teachers need sufficient tenure, commitment and cooperative colleagues to feel rewarded (Jones, 2016). Research has shown that teachers’ job satisfaction improves their professionalism, decision-making, development and growth, and make them feel empowered, have a more favourable view of their institutes and working conditions (Pepe, Addimando, & Veronese, 2017; Roch & Sai, 2017; Stearns, Banerjee, Moller, & Mickelson, 2015). For teachers, the most damaging effect of dissatisfaction is the harm done on the young minds that are in close contact with them every day. Perhaps the fall in students’ enthusiasm for teaching profession can be partly blamed on the way they visualized their own teachers. In fact, satisfaction of teachers has been called a policy issue as it translates to student achievement (Chamundeswari, 2013). The work–life balance and general life satisfaction that are so intricately associated with job satisfaction are also affected by it. A teacher’s job is to indoctrinate such values, attitudes and work habits that channelize students in the right direction. For all these reasons, it is highly necessary that teachers exhibit above-average satisfaction levels. Choi and Tang (2011) and Walls and Nardi (1998) have both stressed that effective teachers are satisfied with their work while ineffective teachers are dissatisfied and unconcerned.
Regular and frequent job satisfaction studies like the COACHE surveys can be used to diagnose problem areas, find solutions tailor made to the issues and establish successes (Emory et al., 2016; The Collaborative on Academic Careers in Higher Education, 2014). These will help find what works for other similar institutes, using the exercise for benchmarking best practices and moving towards a more comprehensive and workable policy making application on a national level that is deriving data from the grass roots.
Job Satisfaction of Academicians Beyond India
Low job satisfaction has been reported for teachers around the world (Machado, Soares, & Gouveia, 2010; Munyengabe, He, & Yiyi, 2016; Oshagbemi, 1996; Pepe et al., 2017; Richmond, 2013; Thadathil, 2017). Macia, Markow and Lee (2013), who conducted the annual survey of American teachers (N = 1000) organized by MetLife in 2013, declared that the teachers showed the lowest levels of job satisfaction since the start of the survey in 1984. The growing size of teacher–pupil ratios, cuts in funding and a closer scrutiny of the teachers’ jobs were cited as reasons by the respondents in the survey. Merely 39 per cent respondents were identified as satisfied in their jobs, while a majority (86%) complained about financial issues at school affecting their work and a lack of partnership with the community and other professional agencies. This result is particularly disturbing as the reach of the Internet has made it easier for different stakeholders in the teaching process to connect with each other. Ward and Sloane (2000) who studied the satisfaction of teachers in Scotland had brought to light an interesting point of view that teachers were satisfied with pay equity rather than the pay itself in its absolute numbers. Moreover, non-pecuniary aspects of their jobs like the social environment, the work itself and the research work conducted by them were more associated with their satisfaction levels (Ward & Sloane, 2000).
In 1991, an international survey of teachers in 14 countries—Australia, the UK, Germany, Hong Kong, Israel, Japan, Korea, The Netherlands, Sweden, Brazil, Chile, Russia, Mexico and the US provided invaluable insights into the role of cultural and institutional differences in job satisfaction of teachers (Carnegie Foundation for the Advancement of Teaching, 1991). With more than 20,000 respondents, the data collection for this study itself took over 3 years. The findings showed that three-fourths of the respondents were satisfied in their jobs, with the social environment, their work itself and job security being the highest contributors. Promotions and supervision contributed the most to dissatisfaction. A mean value of 3.4 was reported out of a maximum score of 5 but the variations in scores across countries were high, as shown in Table 1.
Job Satisfaction of Academicians Across the World

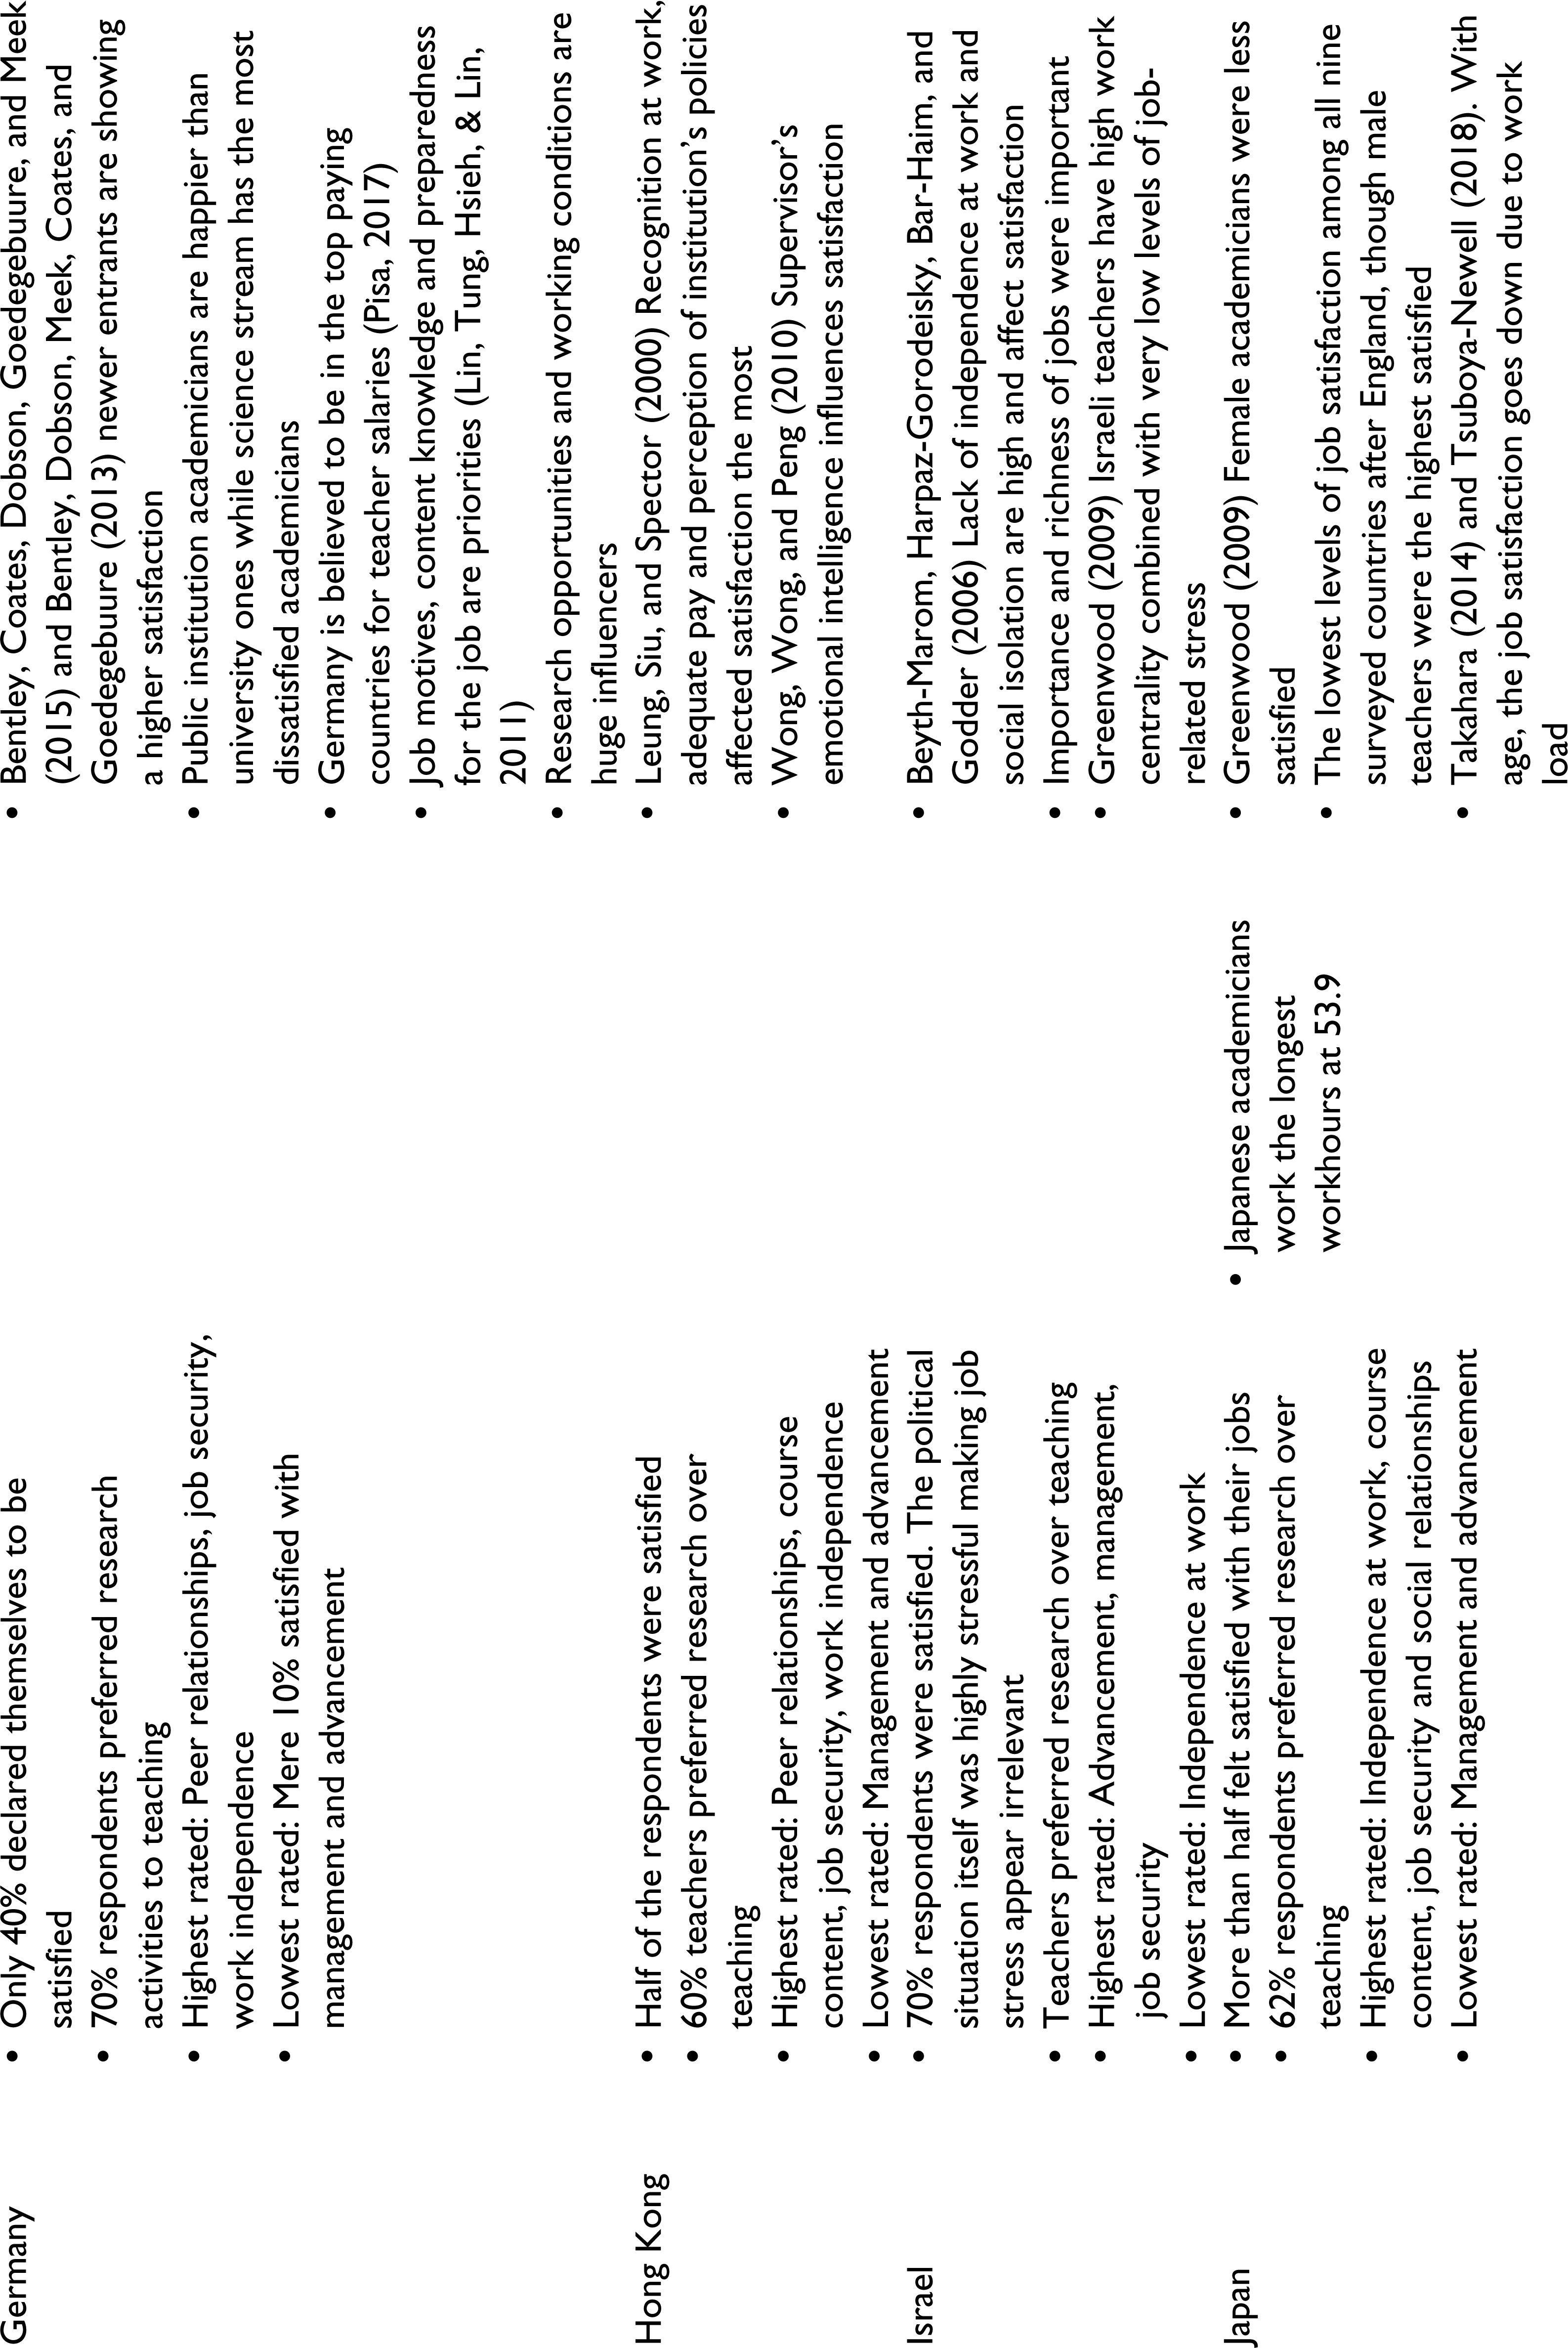
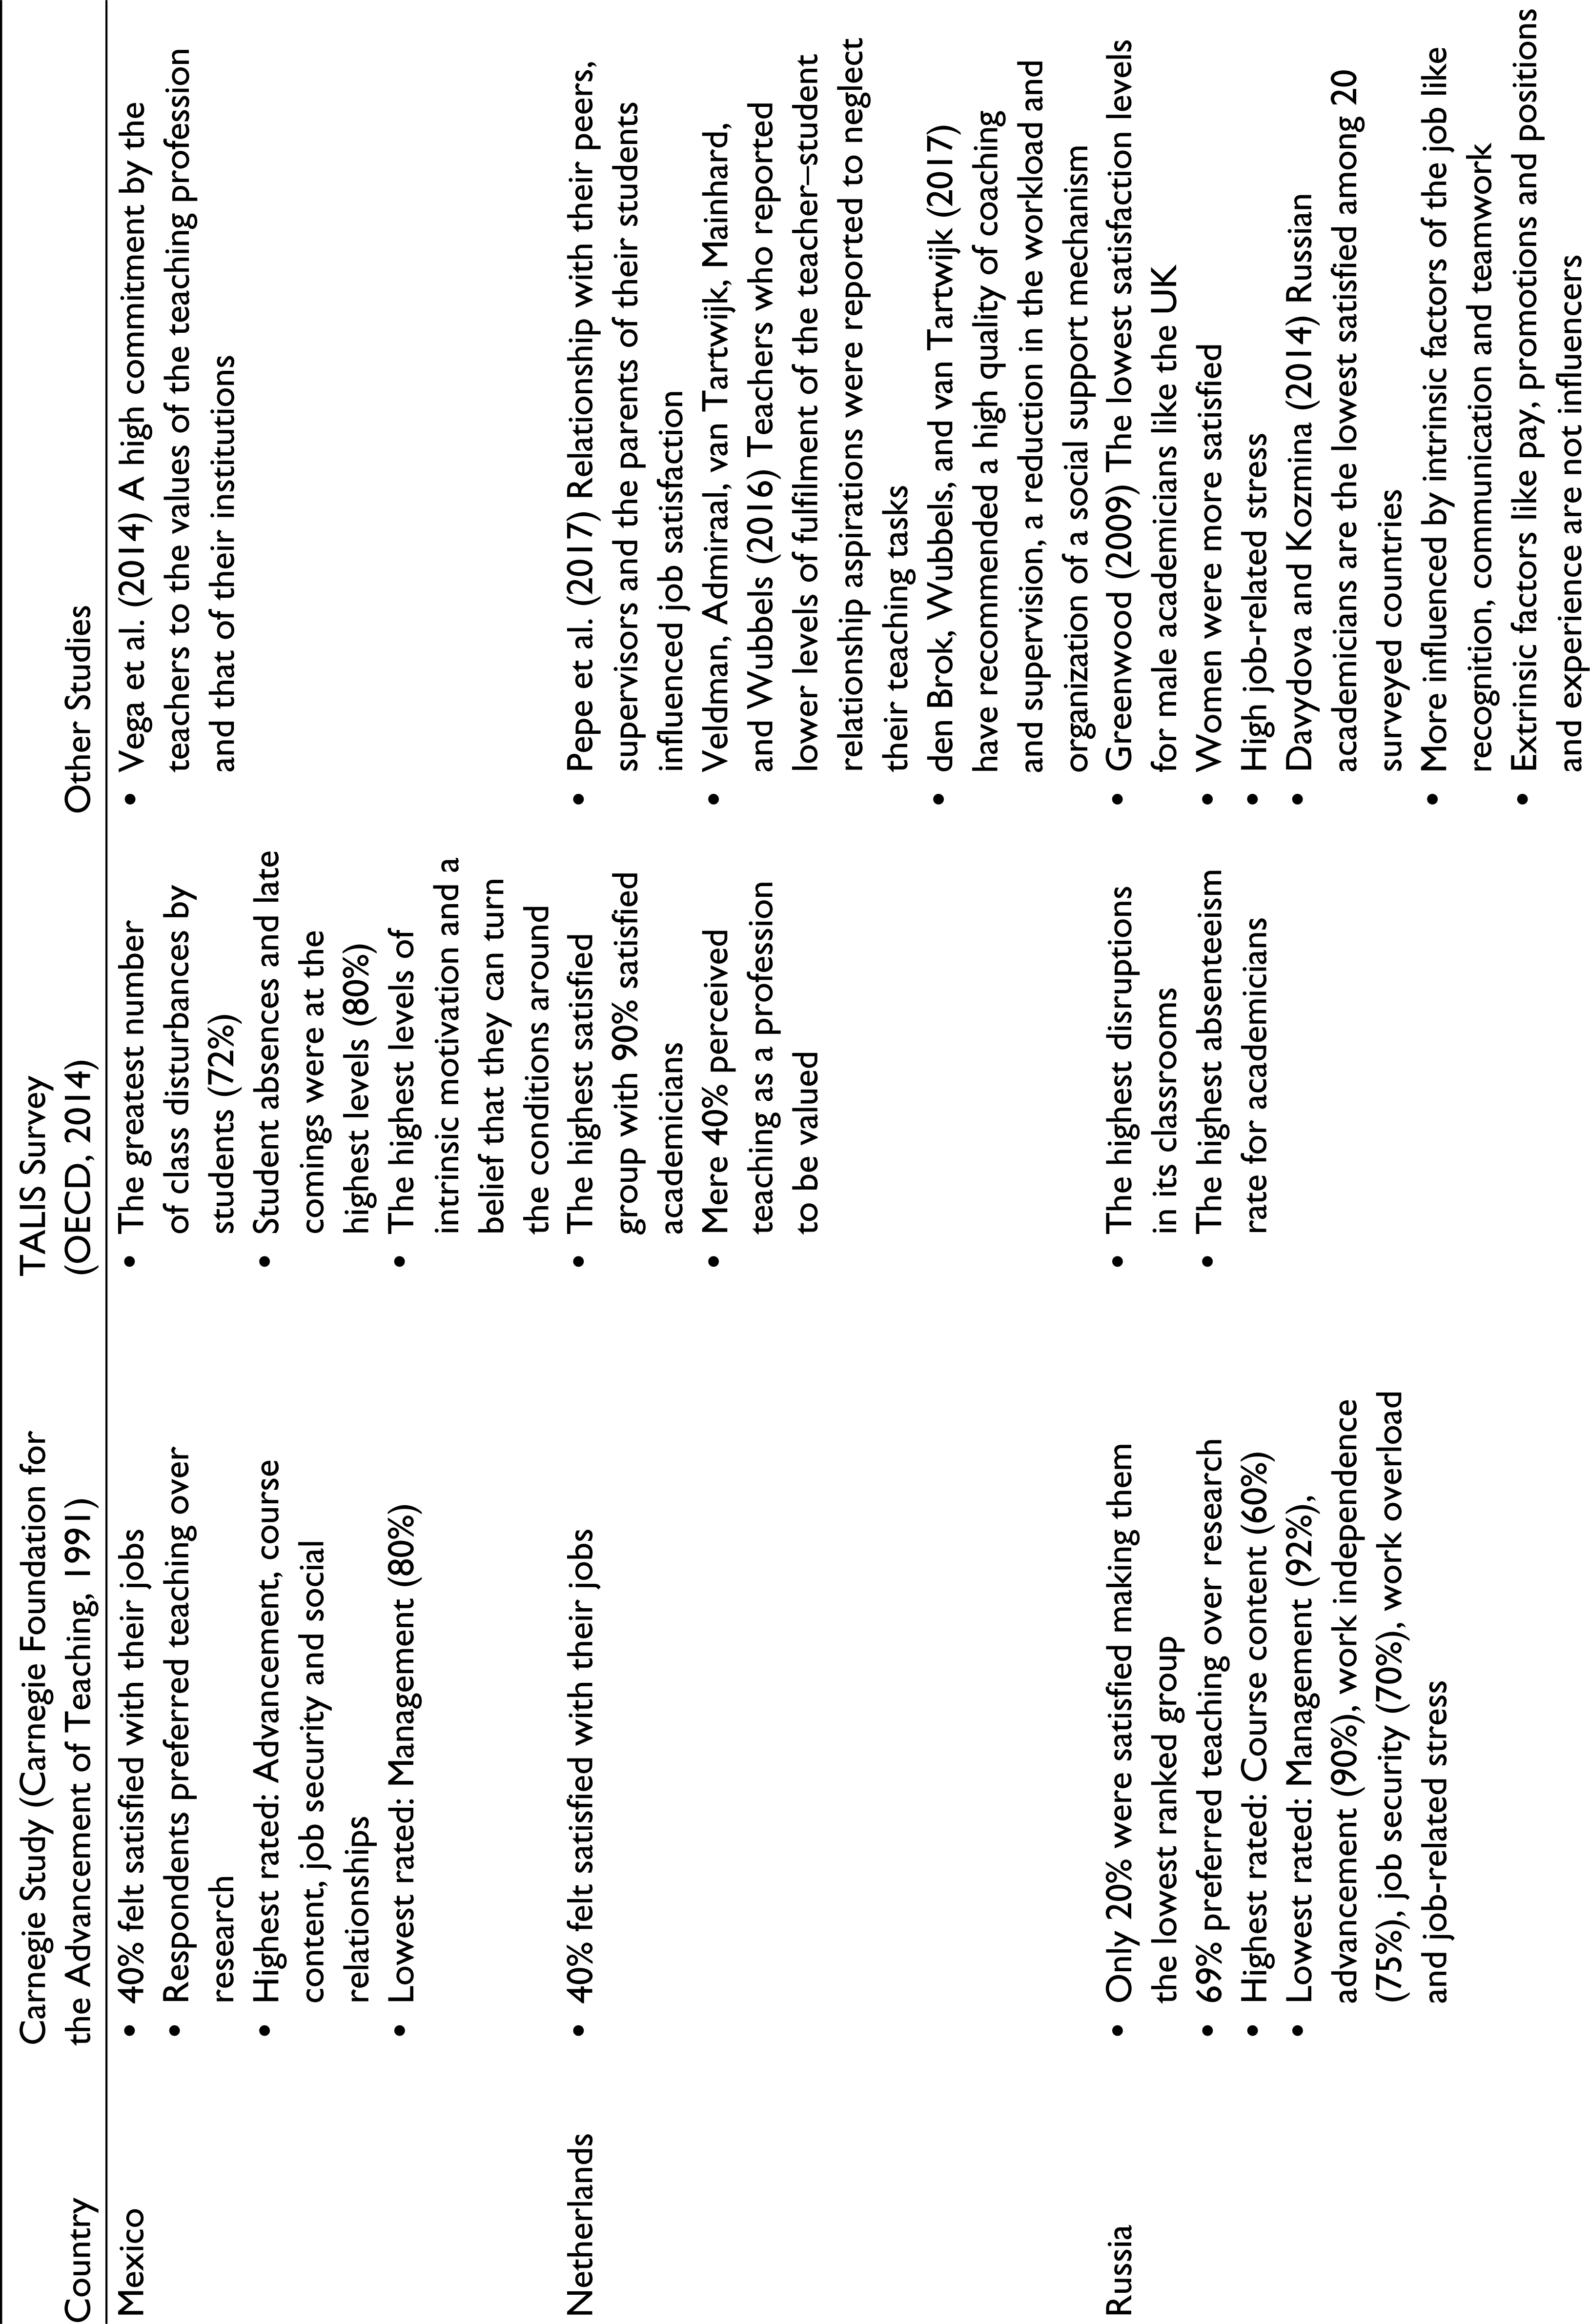

Table 1 shows the history of job satisfaction and its factors across some major countries of the world. The results show that, in most countries, studies of job satisfaction levels are lacking, especially in today’s environment. It is evident that the review of recent literature has shown the highest degree of need for intervention is required in the UK where teachers have reported a consistent low level of satisfaction and are now eager to leave the profession.
Research Methodology
Objectives of the Study
To ascertain job satisfaction levels of university teachers.
To examine the contributing factors of their job satisfaction.
To explore the association of job satisfaction with personal, institutional and socio-economic factors.
Sampling
A total of 350 Indian academicians were selected randomly from carefully chosen samples based on their numbers in each designation through a proportionate stratified sampling with the designations (assistant professors, associate professors and professors) forming the strata. This sampling ensured that a representative sample from each designation was a part of the final sample, thereby making the findings more robust for generalization. A sampling frame of all teachers with at least a job experience of 2 years was used to select a random sample using the following formula:
where nh = sample size for a designation or stratum, Nh = population size for a designation or stratum, N = total population size of teachers and n = total sample size.
A total of 53 academicians from IIT Delhi, 12 from IIM Lucknow, 96 from Jamia Millia Islamia, and 189 from Delhi University were selected. Of these, 112 academicians were assistant professors, the entry position in the universities for teachers, 86 were associate professors and 152 were professors. These numbers are based on a data collection carried out in 2013, therefore the numbers will vary at present.
Instruments Used
A demographic and work profile measuring gender, age, years of teaching experience and educational level and a modified version of the Teacher Job Satisfaction Questionnaire (TJSQ) (Lester, 1984; Lester & Bishop, 1997) were used. As a result of a pilot study, 12 items were removed from the original questionnaire based on Cronbach alpha values.
Limitations and Scope of Study
This study has not included a qualitative research approach that could investigate the teachers’ opinions and attitudes towards job satisfaction and its factors that can yield rich and detailed data for this context.
The changing student needs and aspirations with respect to their education and preferred learning styles have also not been accommodated in this study.
The scope of the study is limited to only four educational institutions due to the limitations of the researcher’s personal resources, therefore the generalization of the findings should be done with due care and reflection.
Results
There were 71.71 per cent males and 28.29 per cent female teachers, which was in consonance with the percentages of these genders in the population as well. The respondents had a mean age of 48 years. A majority of the participants were married with no separated respondents. The majority of respondents were Hindus, with 24 per cent Muslims, and small percentages of Sikhs, Christians and others.
Job satisfaction scores for all teachers were segregated in three categories: ‘Highly Satisfied’ for those teachers who achieved a score of more than 202, that is, 75 per cent; ‘Satisfied’ for teachers with scores of 136–202, that is, 50–75 per cent; and ‘Dissatisfied’ for scores between 0 and 135, that is, below 50 per cent. Most teachers are satisfied with their jobs, with 58 per cent showing 50–75 per cent scores. Only 1.7 per cent teachers are dissatisfied, and further analysis revealed them all to belong to Delhi University. A percentage of 40.3 teachers were highly satisfied with scores above 75 per cent. The factors studied in Paula Lester’s TJSQ are supervision, colleagues, work itself, working conditions, responsibility, recognition, advancement, security and pay.
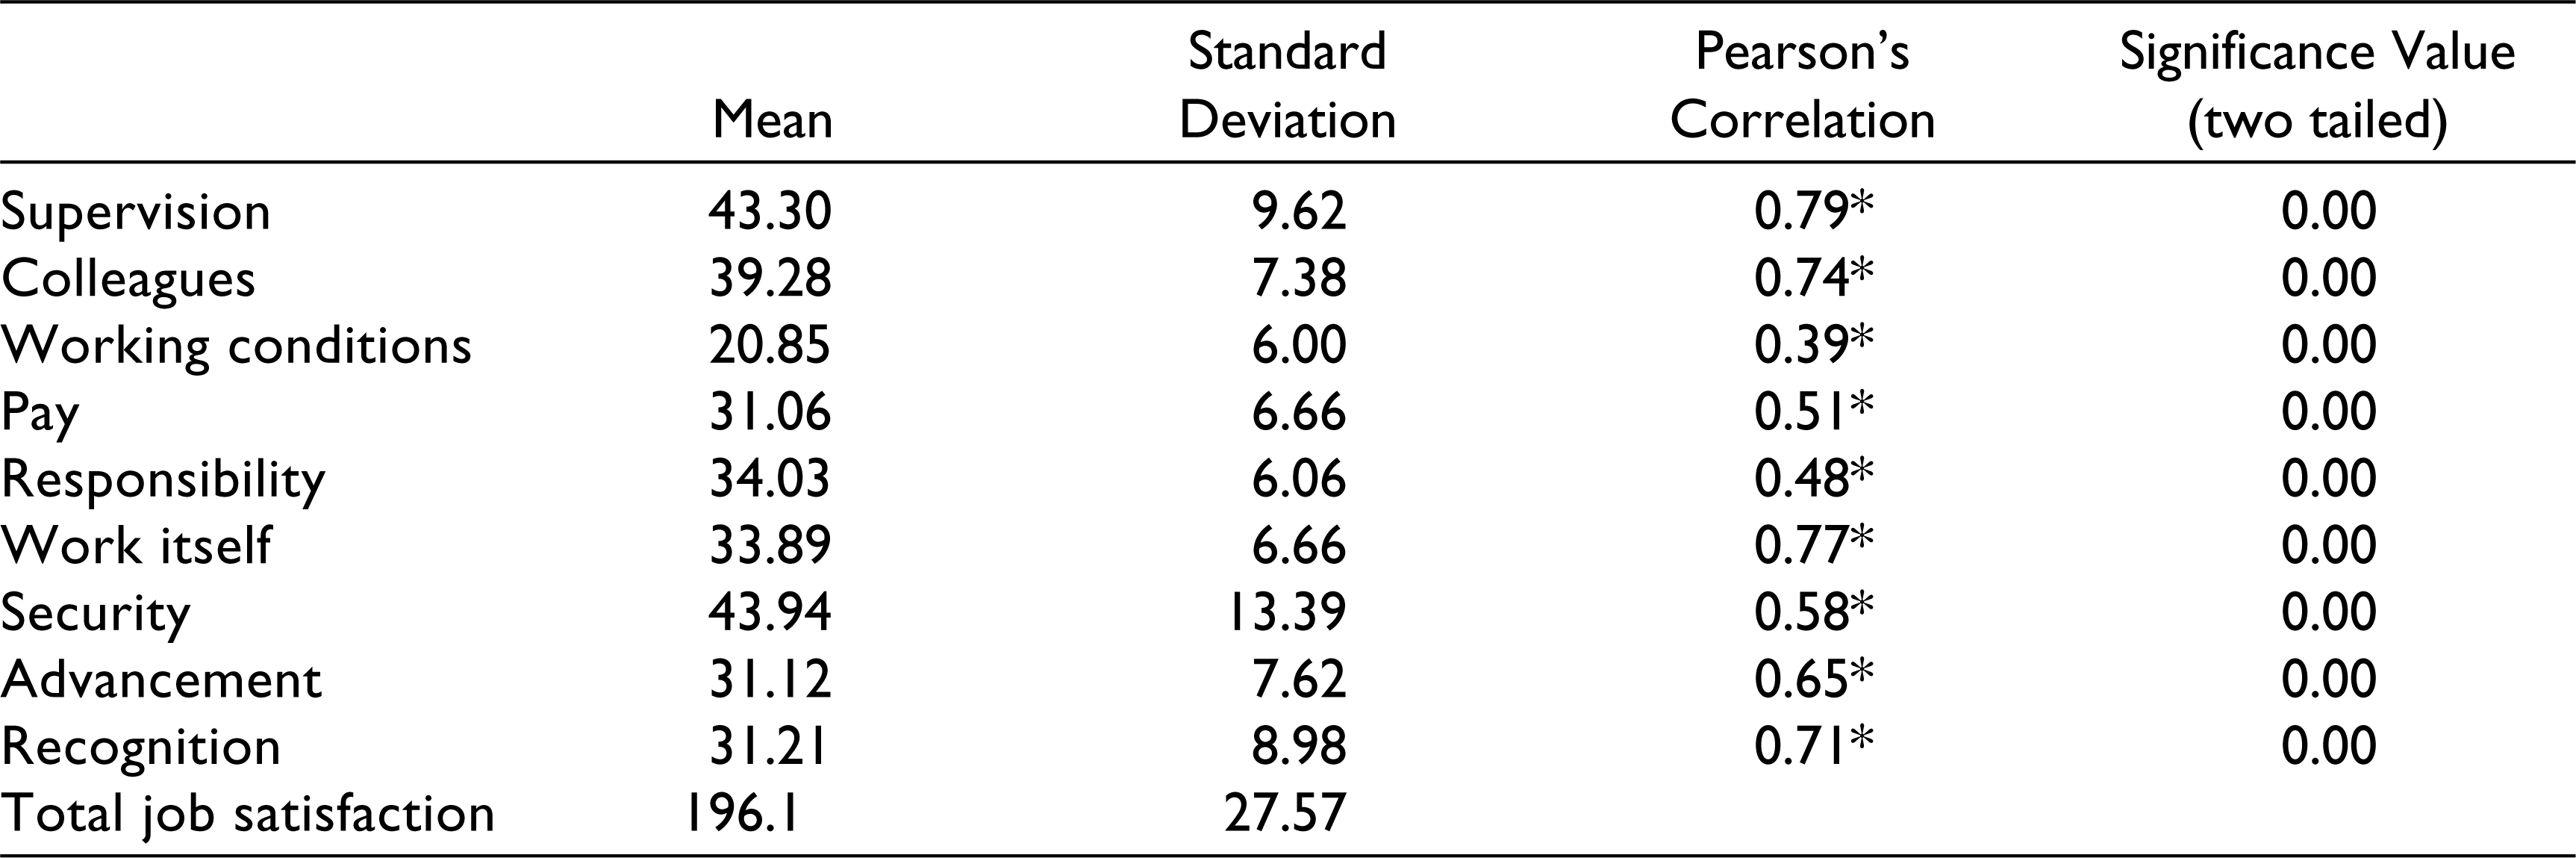
According to Table 2, all nine factors correlate significantly with the job satisfaction scores, proving that they all exert influence on the job satisfaction of teachers. The mean values ranged from 43.94 for security to a low of 20.85 for working conditions. The highest deviation in mean values was shown by security, whereas the other factors ranged between 6 and 9. Preliminary analyses were conducted to ensure that the data was normally distributed. The strongest association with job satisfaction is shown by supervision, work itself and colleagues. According to Cohen ‘r’ values which are greater than 0.5 denote strong relationships (Cohen, 1988). Going by Cohen’s definition, we find that only responsibility and working conditions have a moderate level of correlation.
Factors of Job Satisfaction
Earlier studies also reflect similar findings (Pan, Shen, Liu, Yang, & Wang, 2015; Waqas et al., 2014; Yezzi & Lester, 2000). De Nobile and McCormick (2010) opined that ‘the intrinsic factors of teaching i.e. work itself, responsibility and recognition are about aspects of the real work that goes on in teaching—dealing with students and some level of supervision and support with regard to work’. It can be argued that without intrinsic satisfaction, as is shown by the Russian academicians for example, real job satisfaction cannot be expected as these factors form the satisfiers in Herzberg’s two-factor theory of motivation (Herzberg, 1966).
A factor analysis was also conducted to ascertain the factors determined as constituents of job satisfaction of academics in the collected data. According to Tabachnik and Fidell (2001), a sample size of at least 300 is found comforting for factor analysis. As this study had a sample size of 350, this condition was believed to be fulfilled. Factor extraction, which is defined as the determination of the least number of factors that can represent a dependent variable under study (Gudgeon, Comrey, & Lee, 2006), was conducted using principal component analysis. It is necessary to maintain a balance between finding the least number of factors that can explain a variable while ensuring the maximum variance in scores to be explained. Another consideration is the factorability of the correlation matrix which should ideally show a Pearson’s correlation coefficient value of 0.3 or higher. The SPSS analysis of the correlation matrix for all 54 items showed that 11 statements had a correlation of 0.3 or more. Moreover, the Kaiser–Meyer–Olkin Measure of Sampling Adequacy (KMO) had a value of 0.842 which is sufficiently higher than the required value of 0.6 (Beavers et al., 2013). Further, the Bartlett’s test of sphericity value was significant with a significance value of 0.00. As a result, the preliminary conditions of using factor analysis were deemed to be fulfilled.
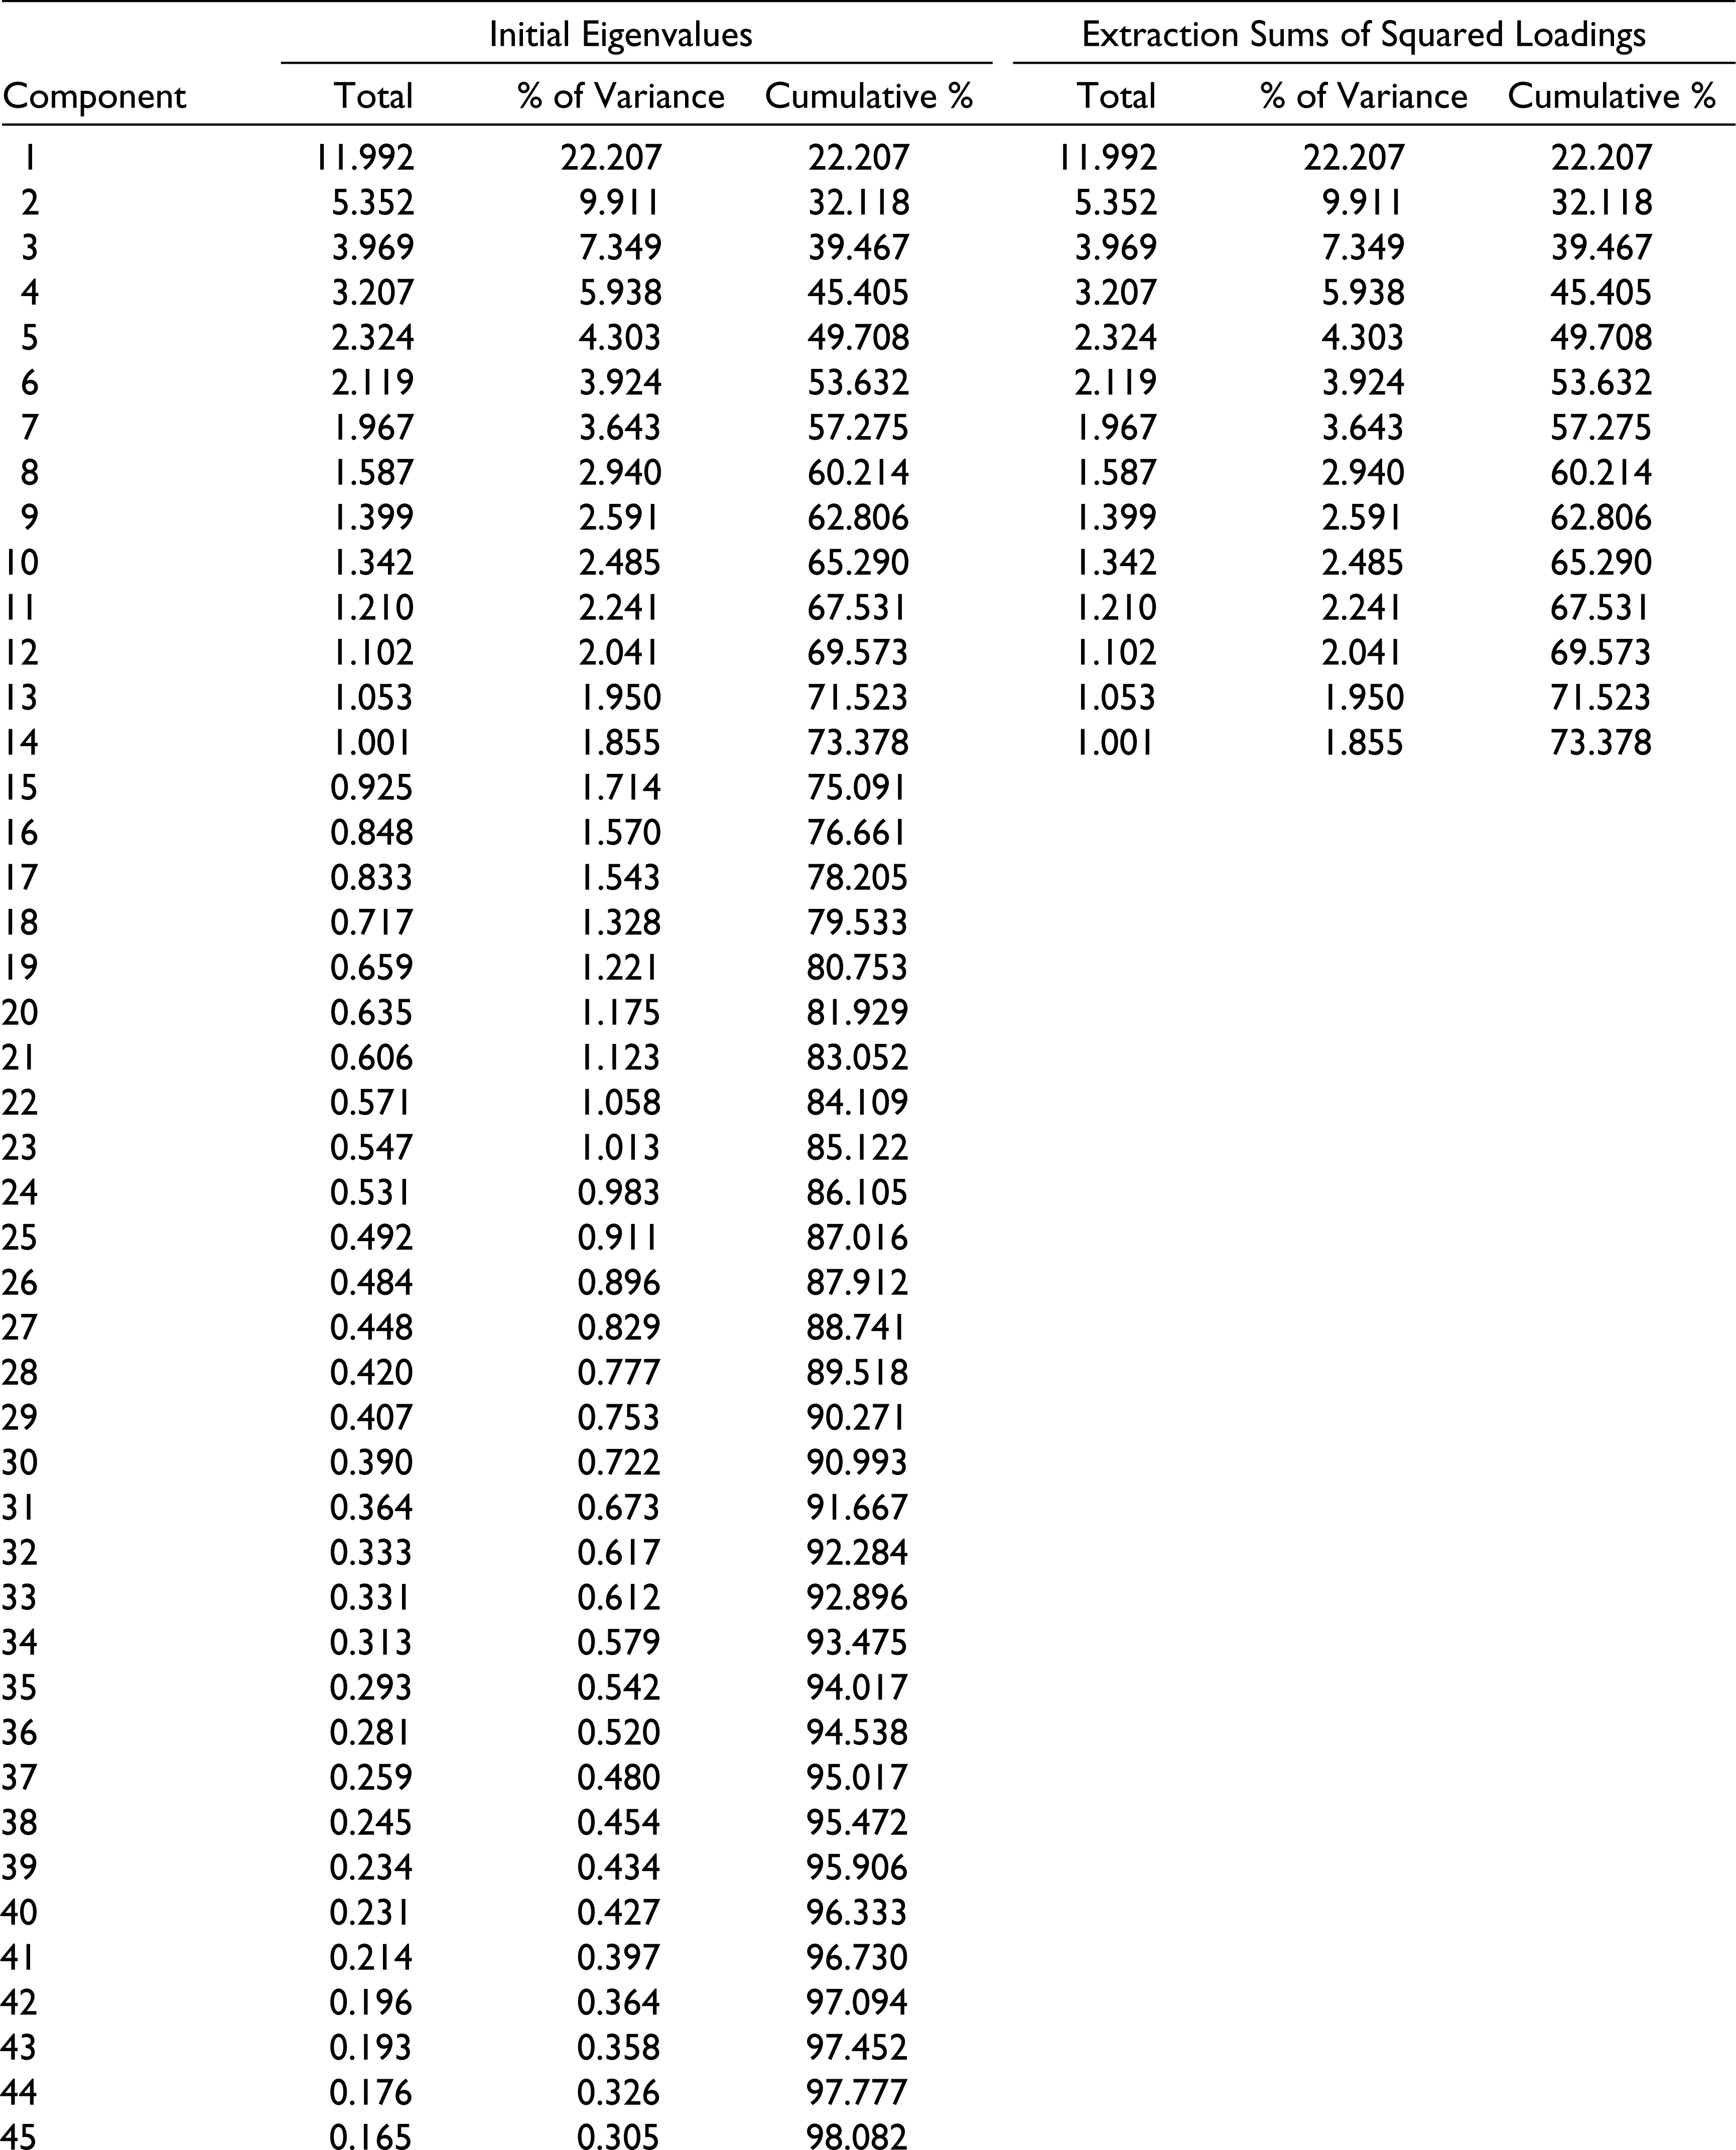
Kaiser’s criterion analysis was used to identify the salient factors which were all expected to have an eigenvalue of 1 or more. The eigenvalue signifies the total variance explained by the particular factor. However, as shown in Tables 3 and 4 factors were found to have an eigenvalue of above 1, which is also a criticism of Kaiser’s criterion as it does reflect too many factors (Braeken & van Assen, 2017; Solanas, Manolov, Leiva, & Richard, 2011). The total variance explained by these factors was 73.38 per cent.
Total Variance Explained

One of the ways to reflect on the number of factors if there are too many that have been indicated by Kaiser’s criterion, is to look at the screeplot.
The screeplot in Figure 1 clearly shows an elbow or a turn in the shape of the plot with seven factors above the turn. Even among these seven factors, there is a clear break between the first and the second, and then, the fourth and the others. The final table considered for factor analysis is the component matrix.
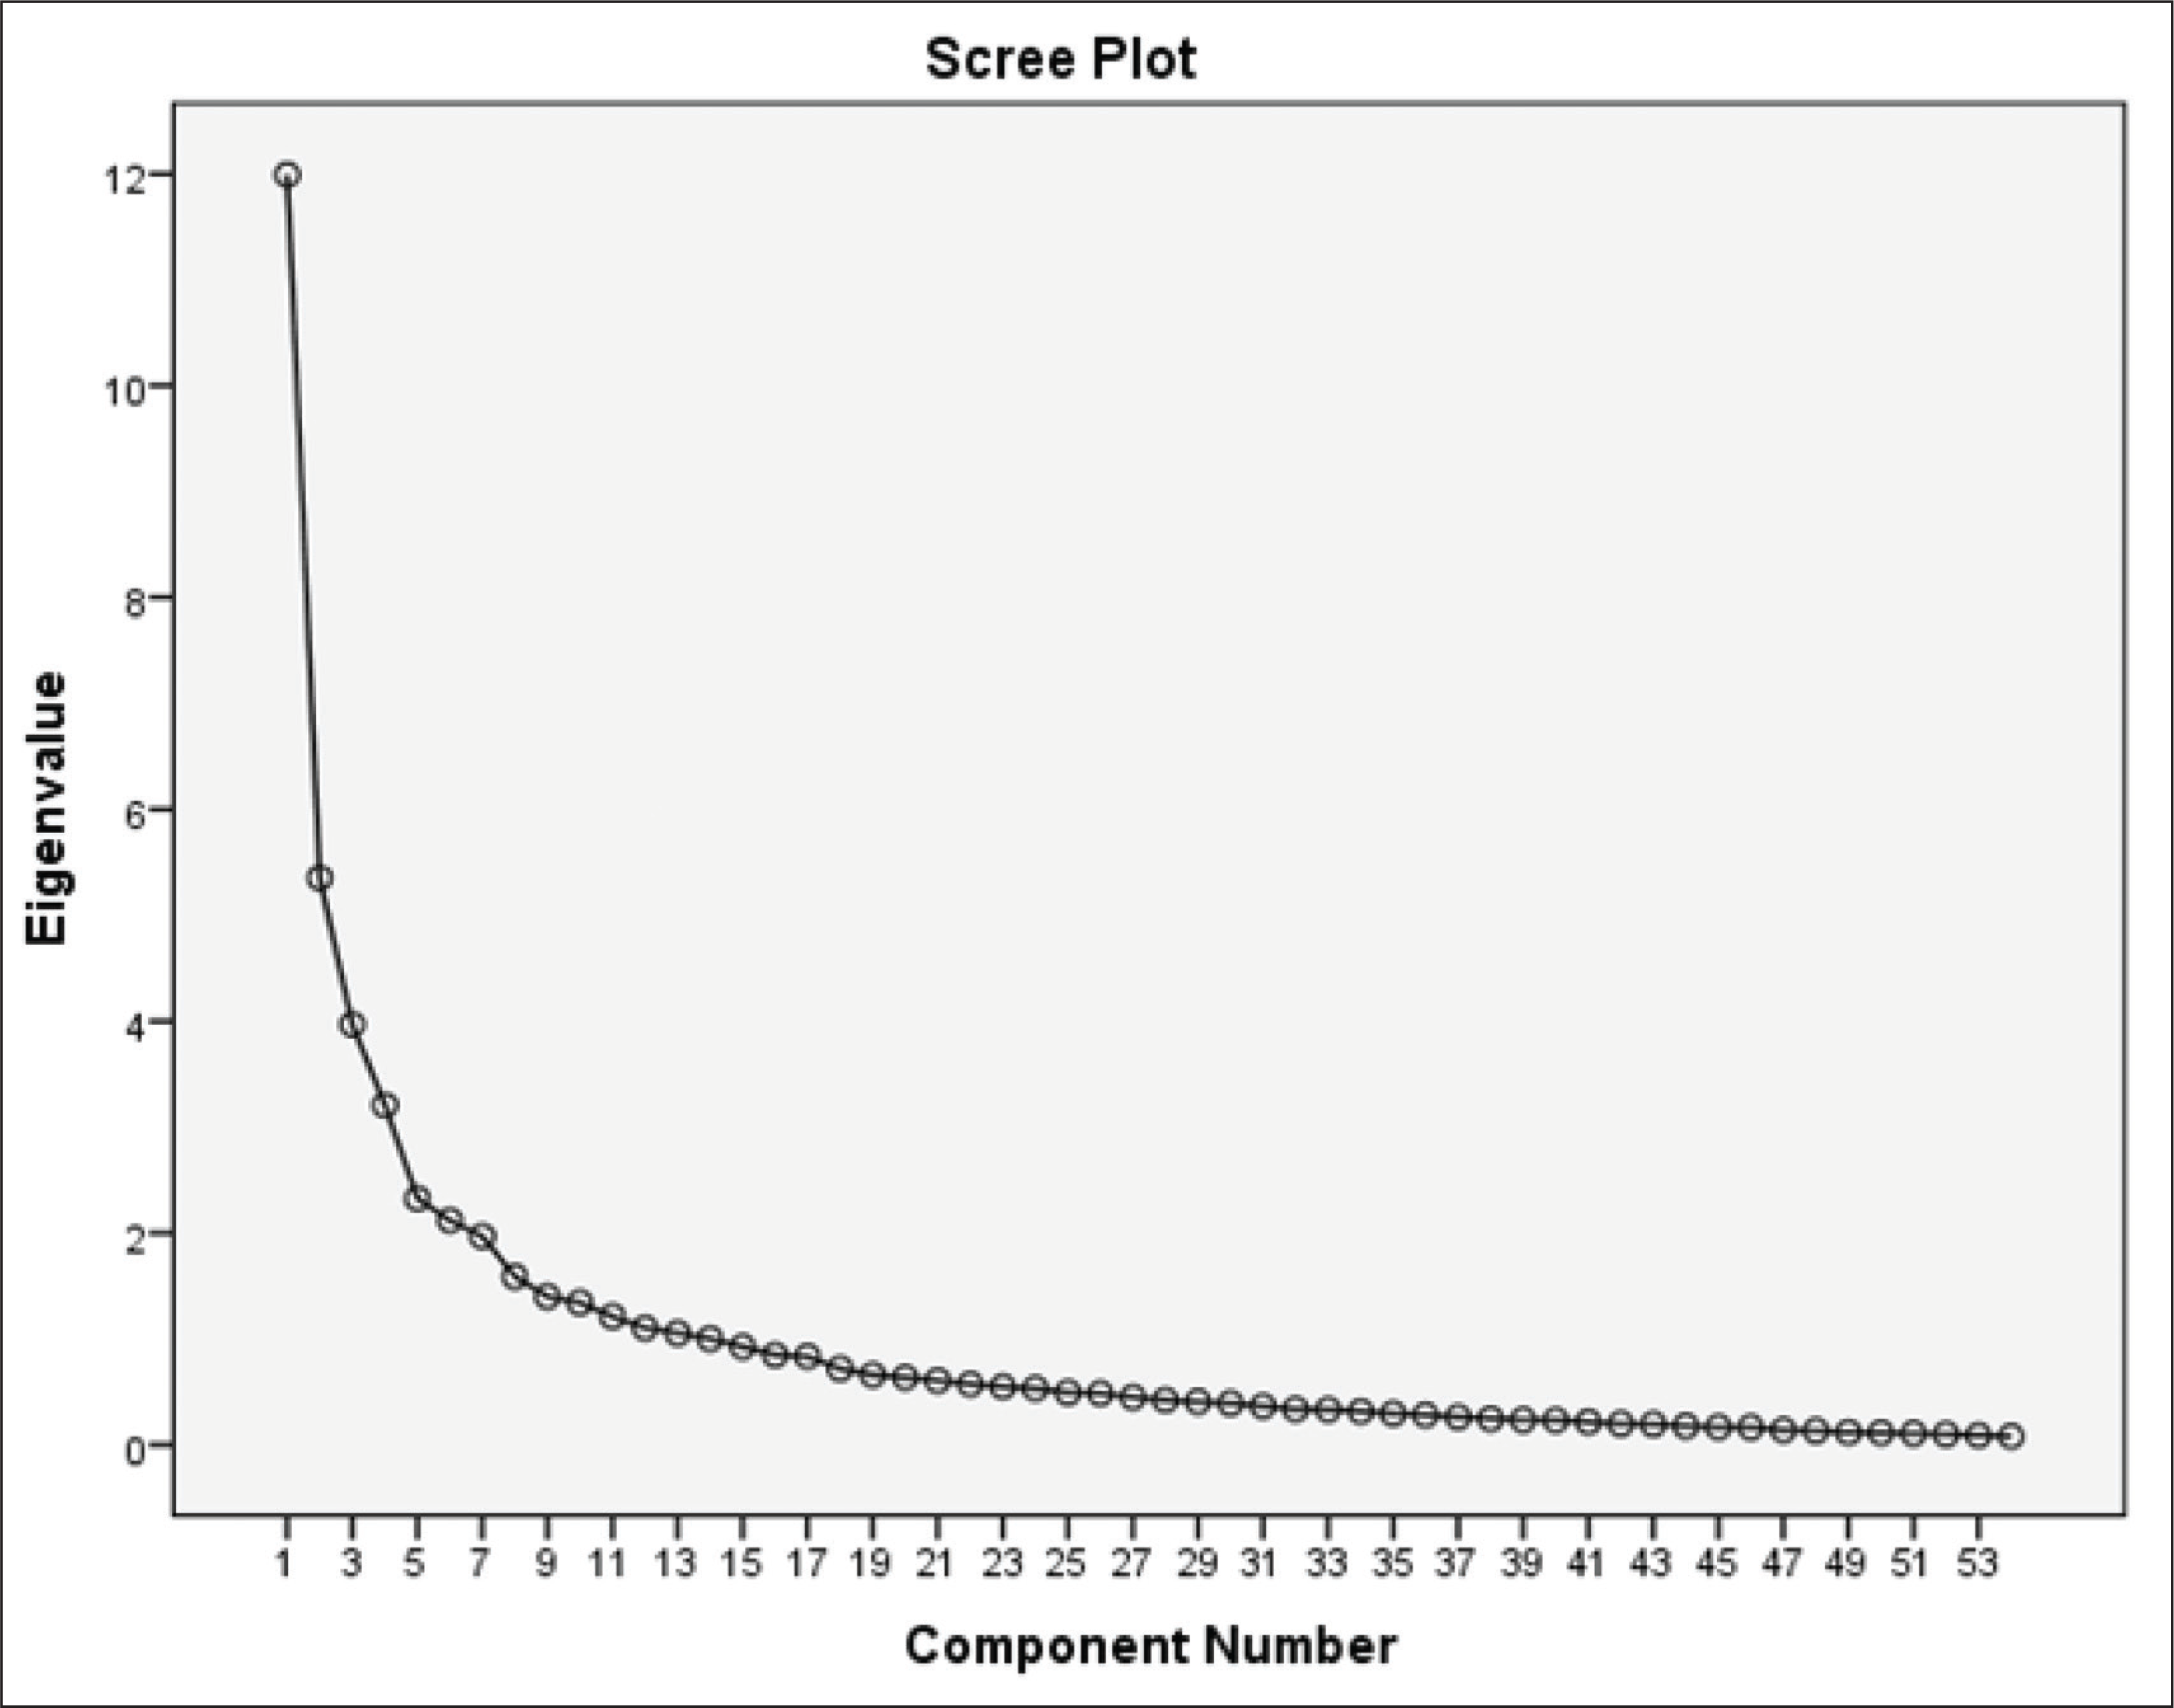
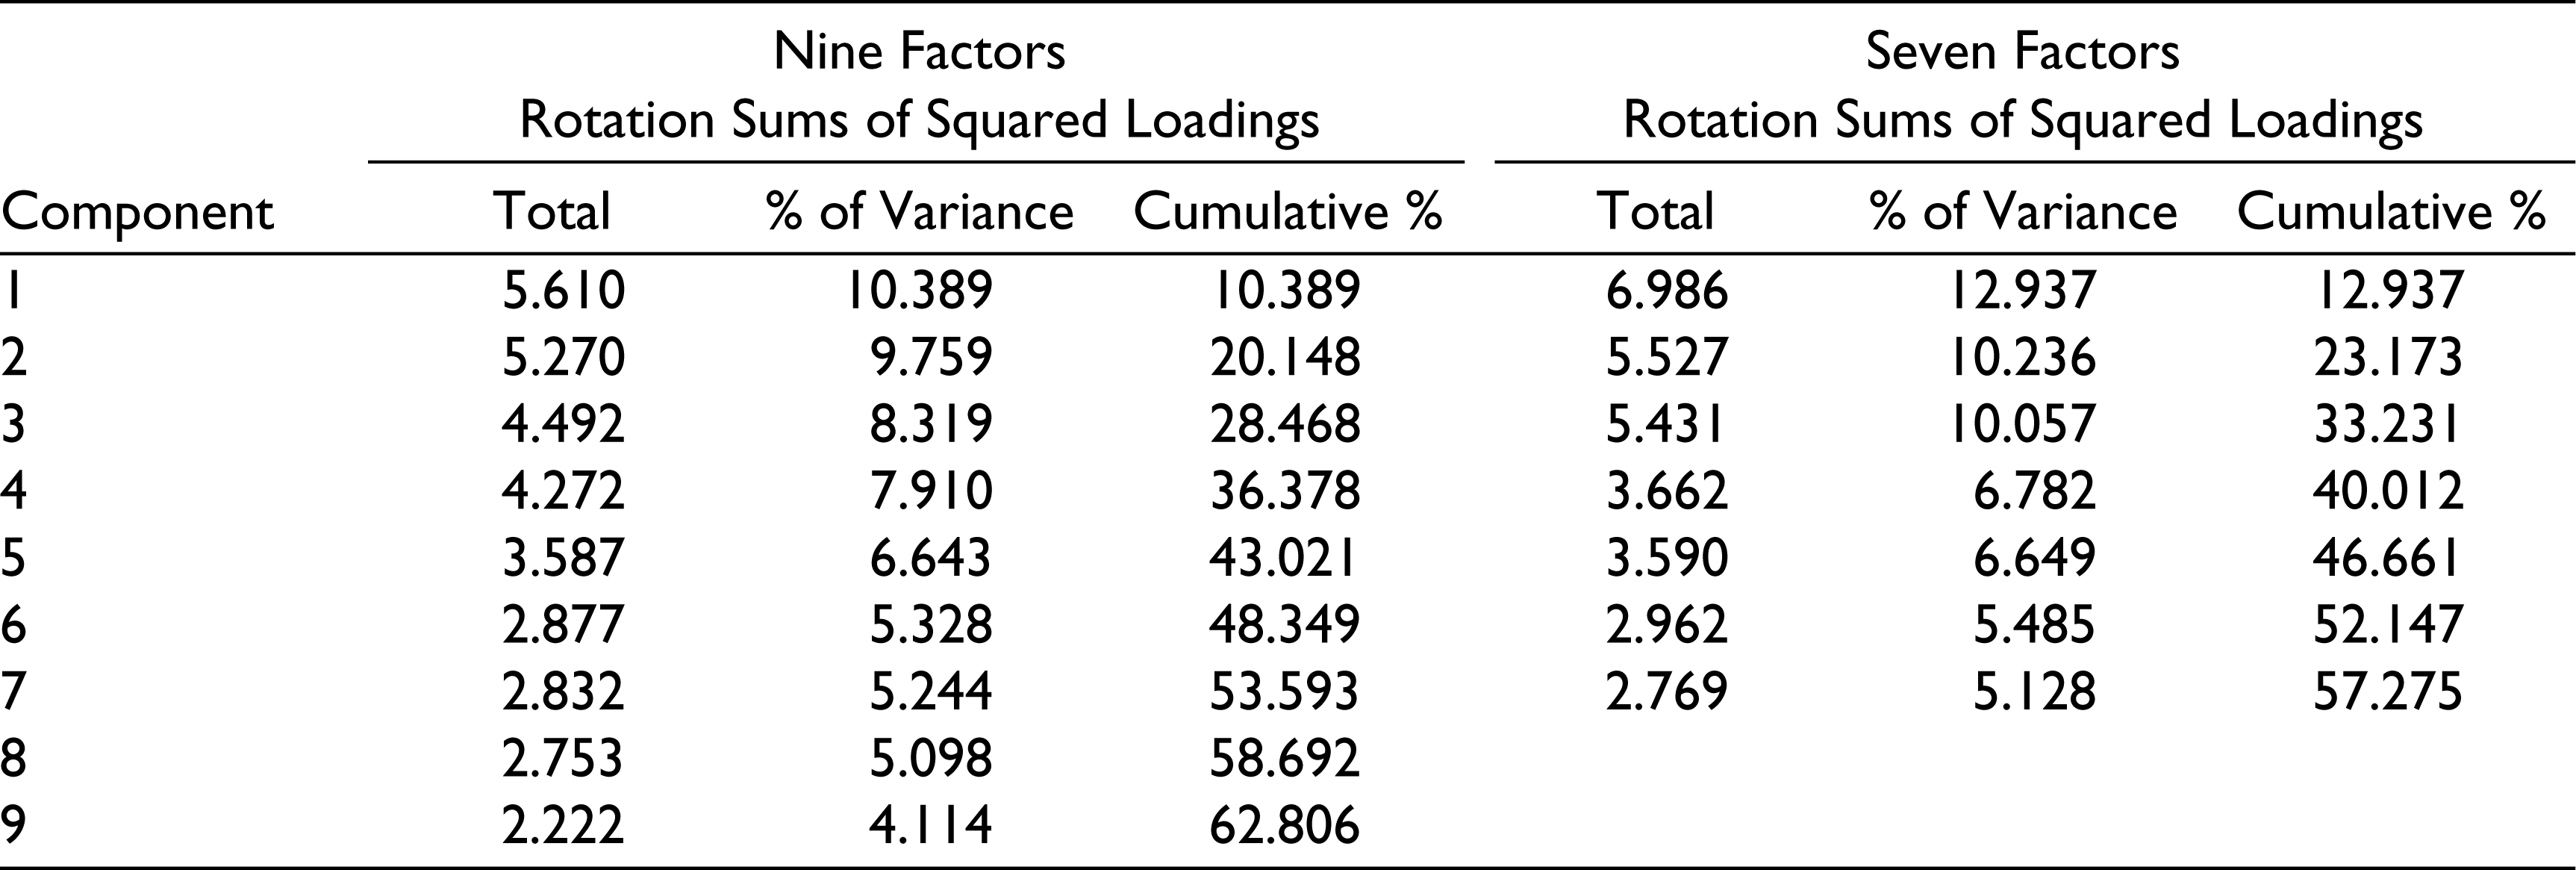
The component matrix uses the factors identified in Kaiser’s criterion. The criterion analysis in Table 5 reflects that the first seven factors do show loadings of nearly 0.4 while the others do not. To simplify the findings, factor rotation was also carried out using two alternatives of nine factors and seven factors each. Nine factors explained 62.8 per cent of total variance while seven factors explained 57.28 per cent. As a result, based on the findings of the Screeplot, the Component Matrix, and the Criterion analysis, it is suggested that nine factors explain job satisfaction of Indian academicians best.
The rotated component matrix shows the loadings for all the selected factors. It is these loadings that give a clue about the nature of the selected factors by comparing them to the items they answer to. Looking at the matrix for nine factors in Table 4, the following details were observed.
Component Matrix
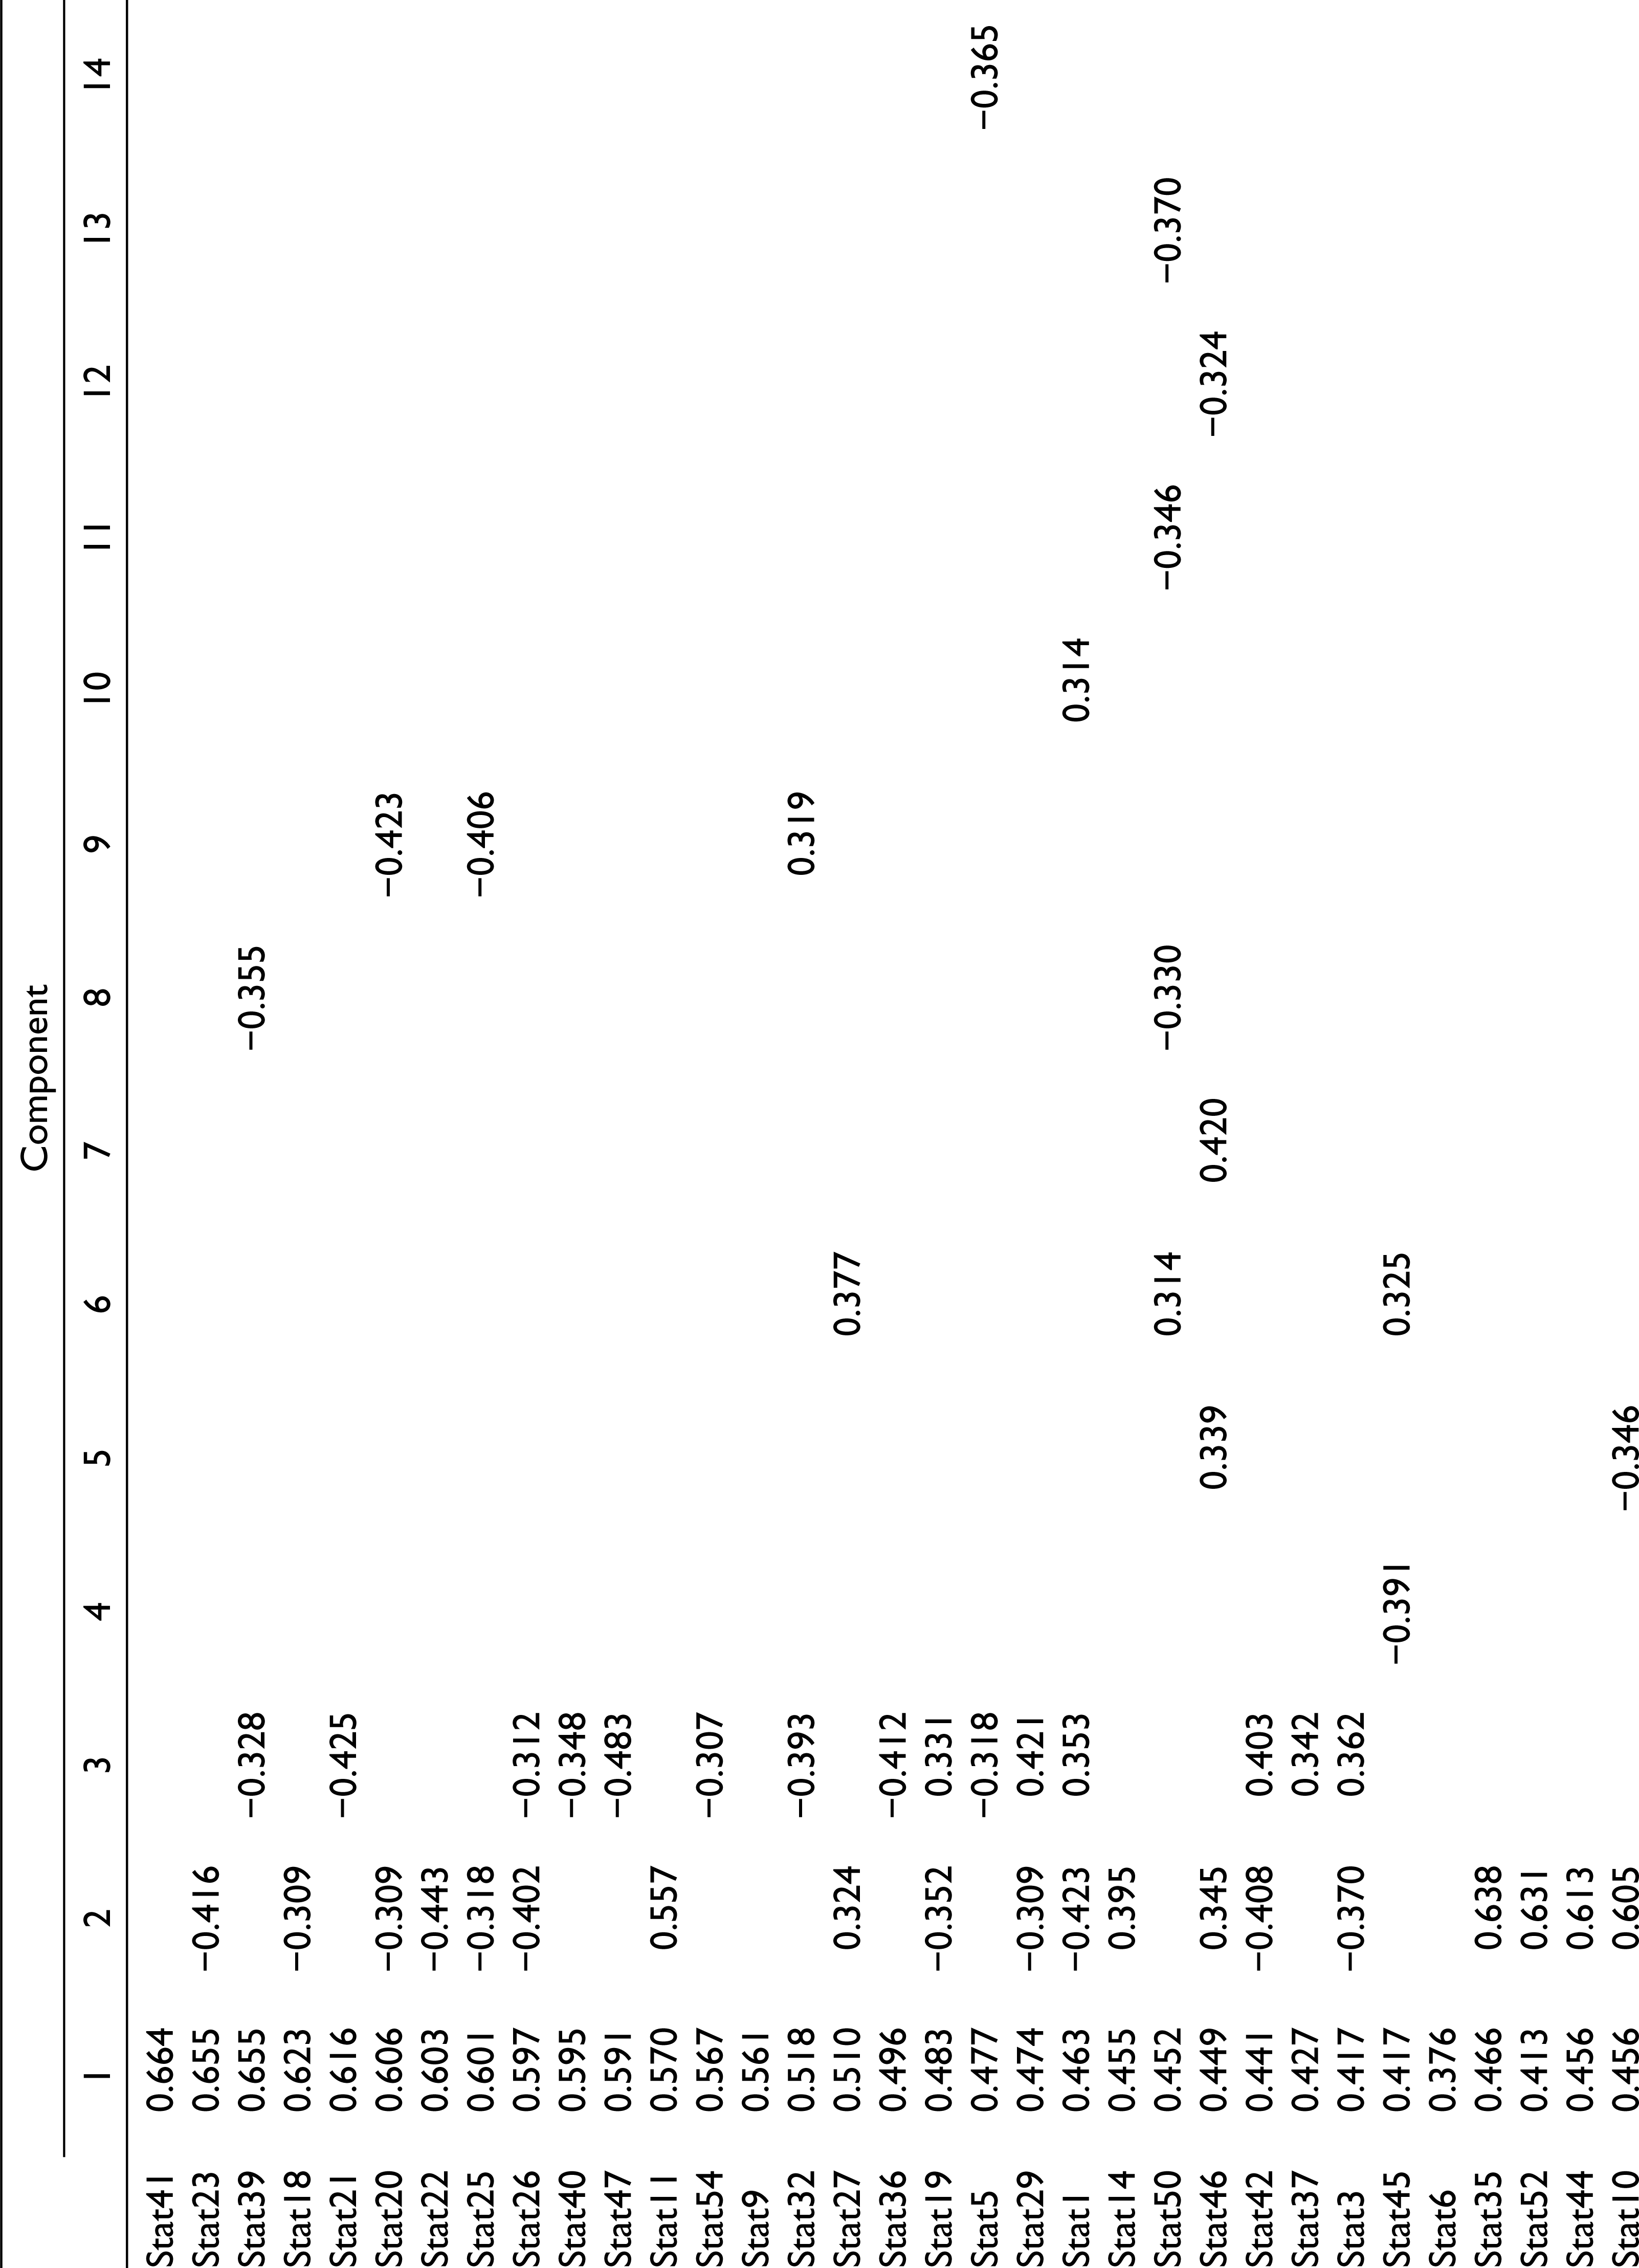
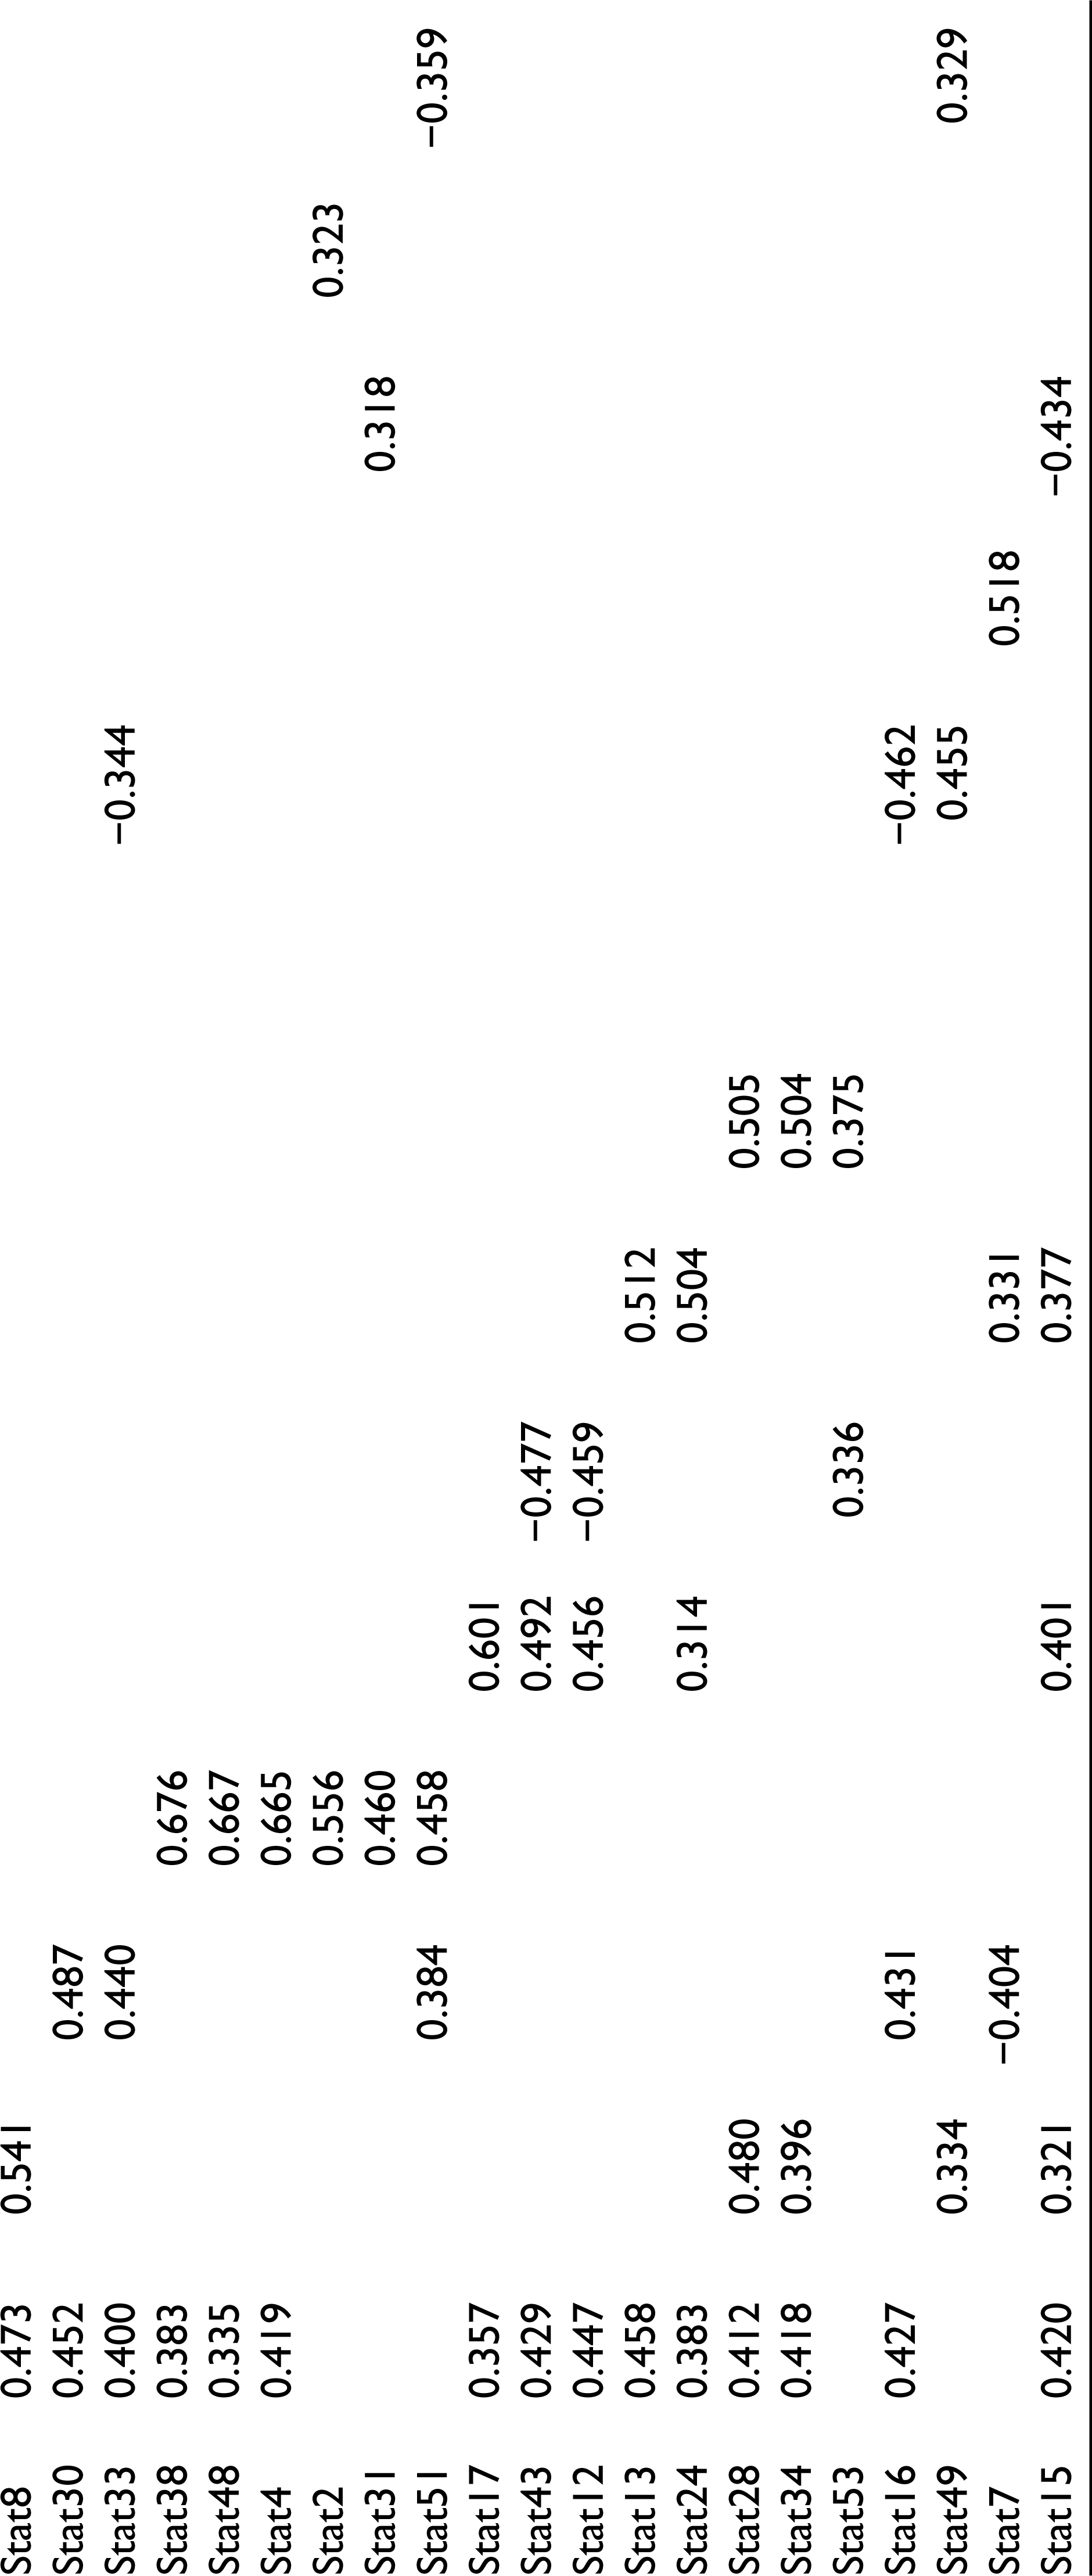
It is important to mention here that some items were correlated with more than one component, in which case, the higher correlation was given precedence. As is apparent in Table 6, some components were easily identifiable like pay, colleagues, job security and supervisions; however, others showed a mix of factors. In such cases, the items were revisited to understand if they could be explained by a single dominant factor, as per the researchers’ subjective opinion or if a new factor name could explain them better.
Total Variances Explained for 9 and 7 Factors
Rotated Component Matrix
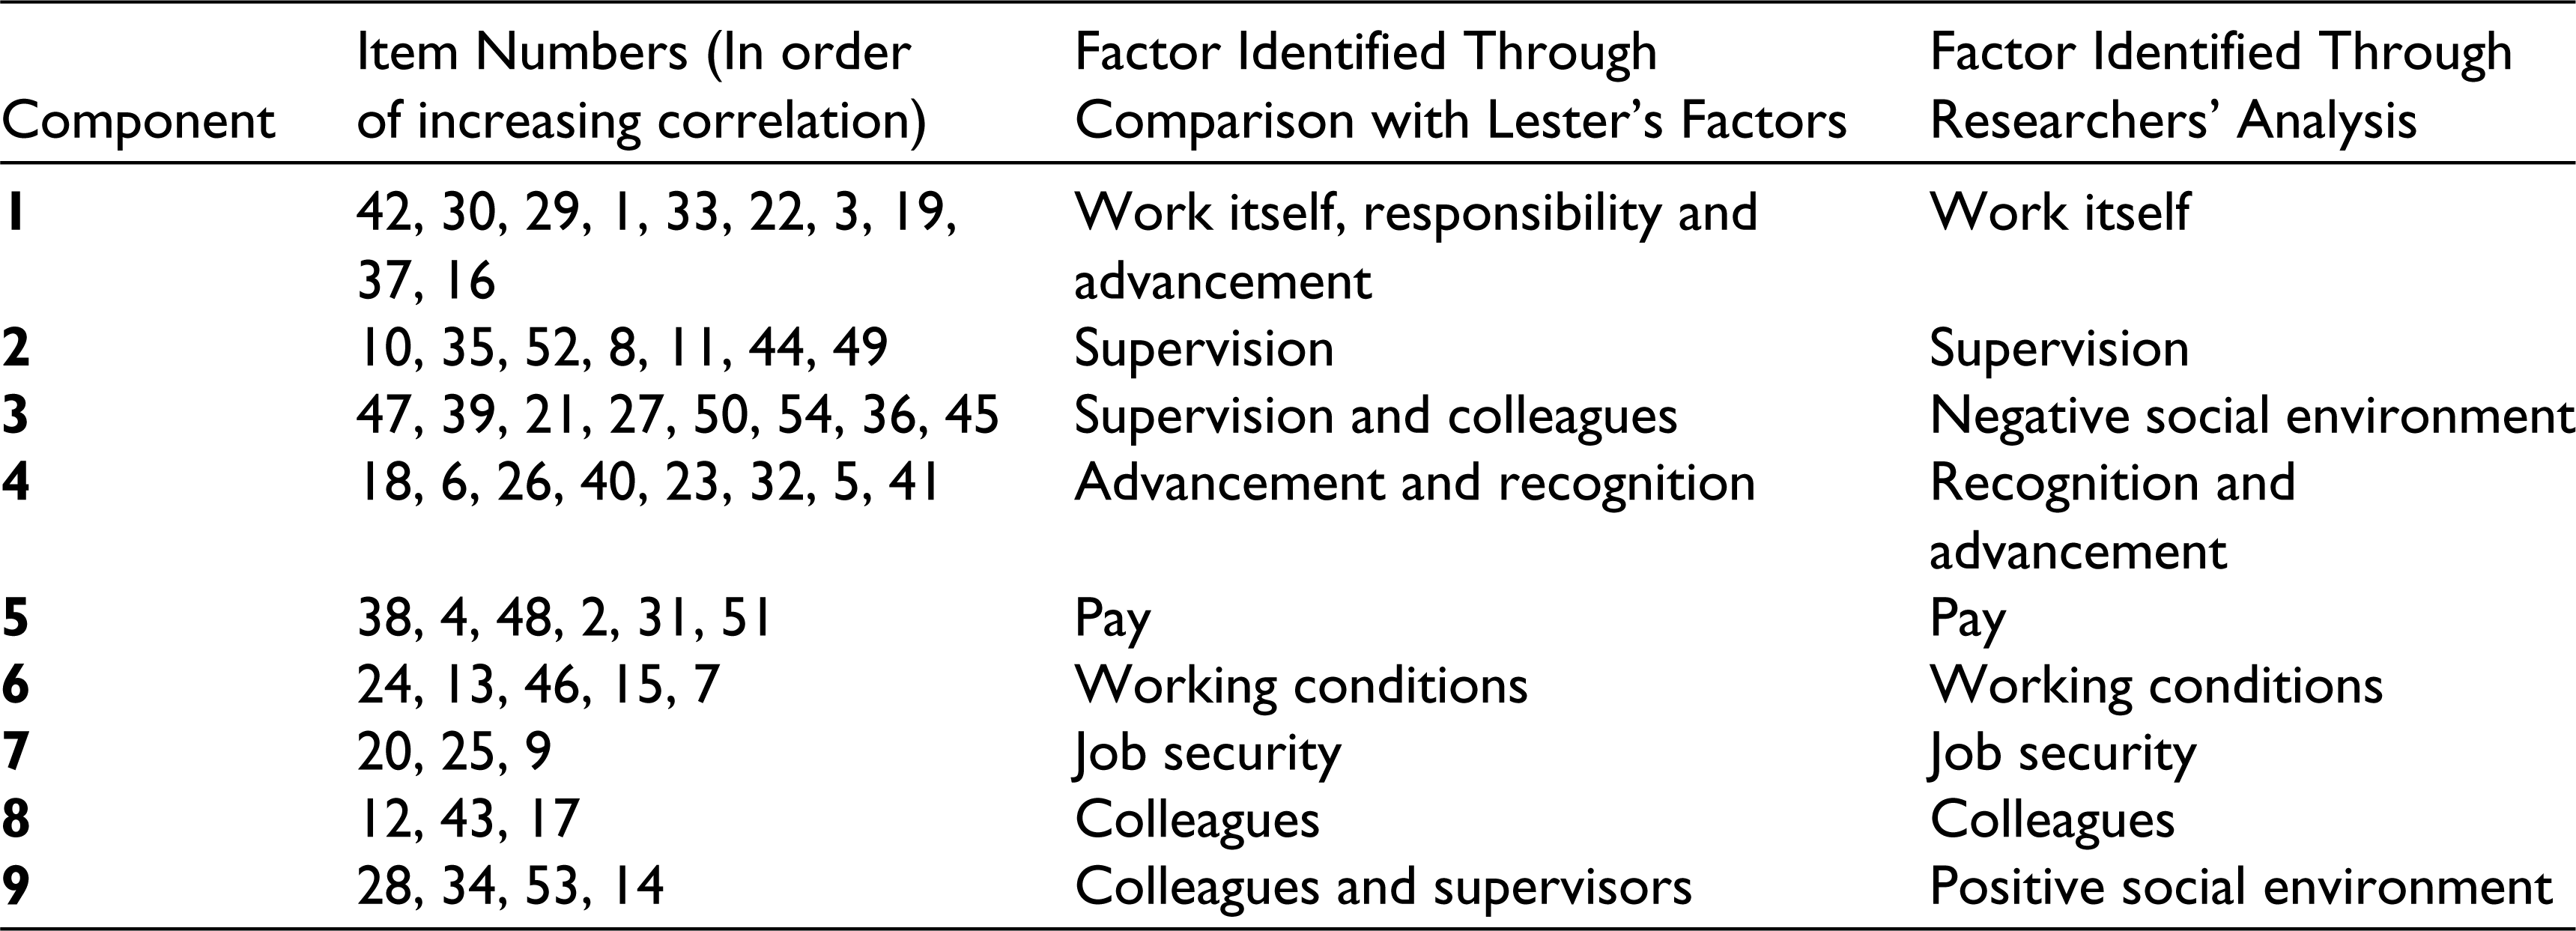
Such an analysis showed interesting results where there was a clear differentiation of what respondents liked in their social environment which included both colleagues and supervisors, and what they did not. Work itself was also better defined through the statements. Moreover, it is apparent that the supervision, colleagues and their combined effect has a particular importance for the respondents. Work itself remained the first and most important variable which was contributing to the teachers’ satisfaction.
To further analyse the original nine job satisfaction factors, we again relied on the same rating methodology as has been used for classifying job satisfaction levels earlier in the study. Respondents scoring 75 per cent and above scores in individual factors were deemed to be ‘highly satisfied’ with that factors, 50–75 per cent scoring respondents were considered to be ‘satisfied’ and, lastly, less than 50 per cent scores were segregated to the ‘dissatisfied’ category. Using this rating criteria, Table 7 shows level of satisfaction with each factor for the university teachers.
Detailed Analysis of Factors of Job Satisfaction
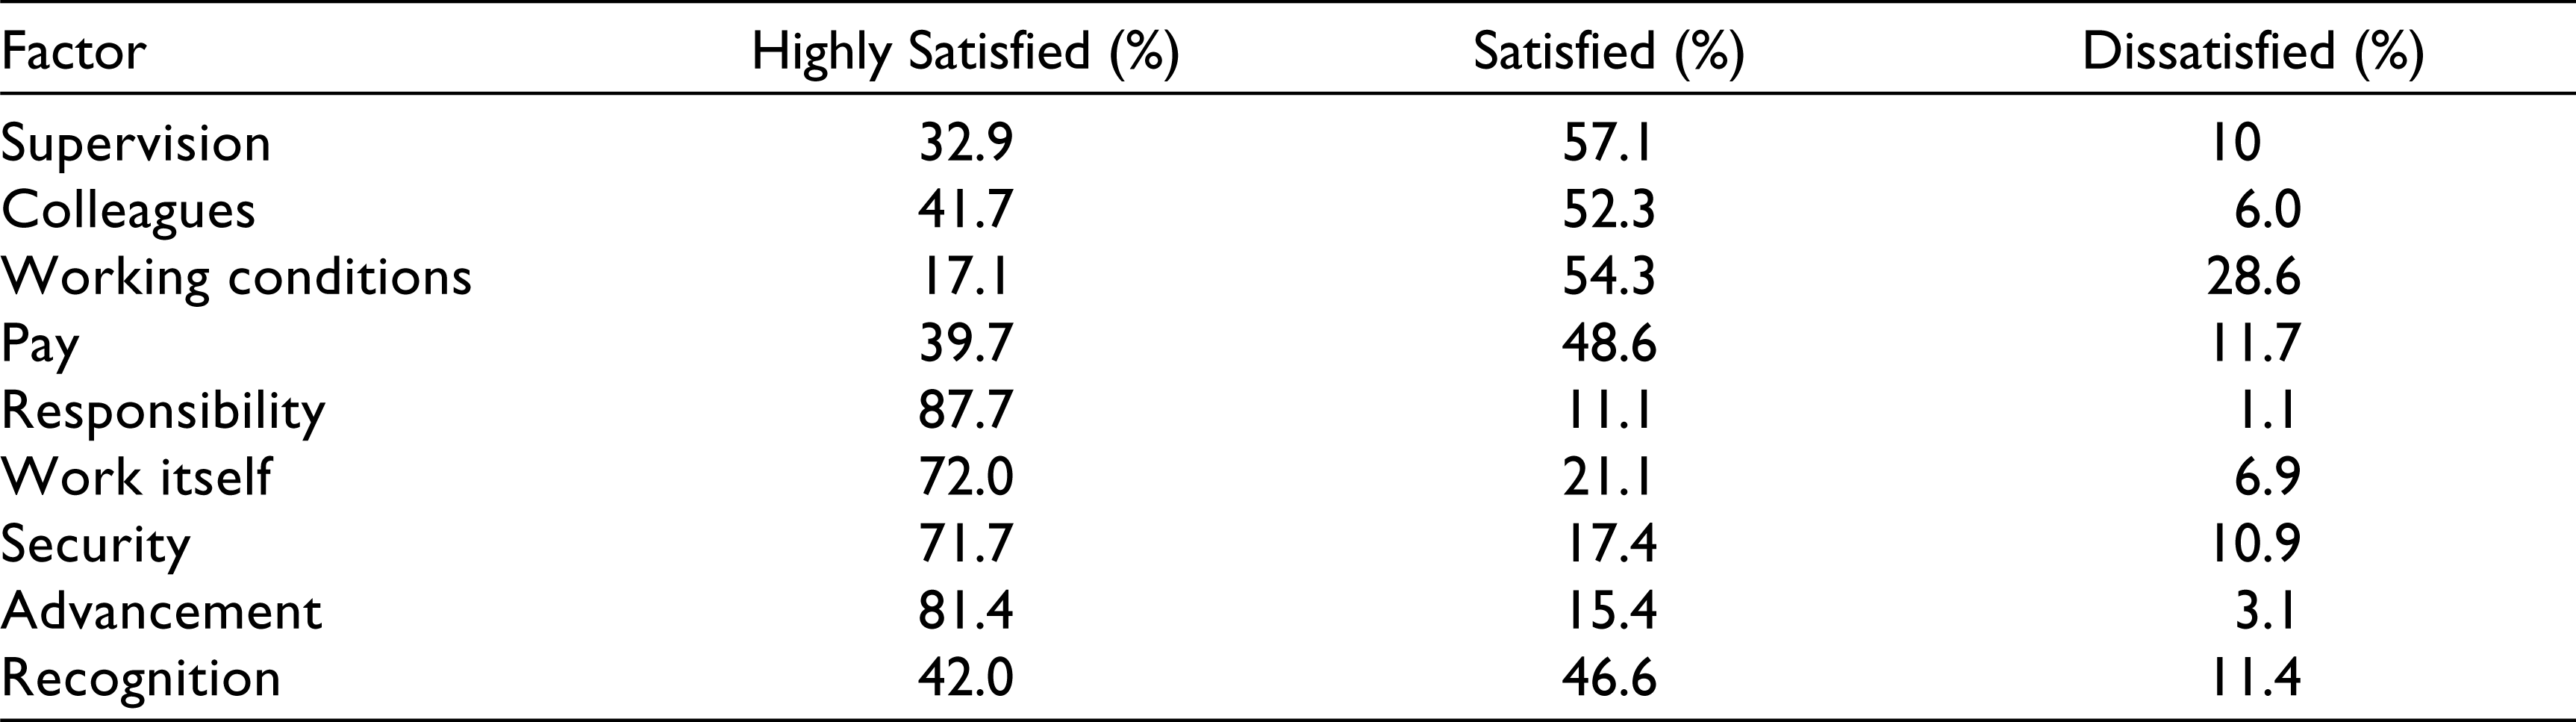
Table 7 shows that 57.1 per cent university teachers were satisfied with their supervisors and 10 per cent were dissatisfied; 32.9 per cent were extremely happy with their heads of the departments or deans, exhibiting more than 75 per cent of total scores; 52.3 per cent teachers were satisfied with the relationships they share with their co-workers, with only 6 per cent dissatisfied members. A healthy percentage of 41.7 were highly satisfied with the social relationships at work, and 54.3 per cent teachers were satisfied with their working conditions, but a sizeable percentage of 28.6 showed displeasure with the existing infrastructure and work environment.
A percentage of 48.6 teachers were happy with their salaries, 39.7 per cent were extremely happy, making the total satisfied numbers to 88.3 per cent, which is an encouraging figure. A massive 87.7 per cent of teachers were extremely satisfied with the responsibility associated with their jobs. A meagre 1.1 per cent felt dissatisfied with this factor, and 72.1 per cent respondents felt extremely happy with the work of a teacher, and extremely secure in their jobs. However, 17.4 per cent were satisfied with the security offered by teaching profession; 81.4 per cent teachers were extremely satisfied with promotion policies and opportunities, with 15.4 per cent more being satisfied with it; 42 per cent teachers were highly satisfied and 46.6 per cent were satisfied with the recognition factor. These figures have shown the relative importance placed by the respondents to various factors of job satisfaction which can be useful to indicate the areas that need improvement.
The third research question was answered by conducting multiple regression models to analyse how the cohorts of personal, institutional and socio-economic factors interacted with the job satisfaction levels of the teachers. As regression analysis is an extremely sensitive test which is affected if any multicollinearity exists among the variables in the model or if the scores are not distributed normally, preliminary tests were conducted in all three regression models to satisfy these prerequisites. None of the three models violated the assumptions of multicollinearity and normal distribution of data. Table 8 shows the R square values for the three models and other important results of the regression analyses. It is important to note here what constituted the factors in each of the models. Personal factors included age, gender, marital status, years of experience, current job duration and religious beliefs of the respondents. The institutional factors included the type of institution (central universities and premier institutes of learning) and the disciplinary affiliation of the teachers (social sciences, sciences, engineering, management, medicine and others). Lastly, the socio-economic factors considered in this study included pay, recognition, colleagues, designation and qualifications of the teachers.
Results of the Regression Analyses of Job Satisfaction with Other Factors

It is observed that personal factors could predict only 3.3 per cent (percentage of R square value) variance in the scores of job satisfaction for the teachers. Looking at the beta coefficients for personal variables, it is evident that years of experience, followed by gender and religious beliefs, contribute the most to this model, in that order. However, none of the variables are found to be significantly related to job satisfaction as is the model.
The institutional factors showed an R square value of 0.055 which was quite low as it could only explain 5.5 per cent of the variations in the scores of the job satisfaction. The type of institution was significantly related to job satisfaction and also contributed more than disciplinary affiliation in the model.
Finally, the socio-economic factors were found to significantly influence job satisfaction together and predict 84.3 per cent of the variations in its scores. All constituent variables in the model except qualifications of the teachers were found to be significantly related to job satisfaction. The three highest contributors to this model were colleagues, recognition and pay, in that order.
The effect size for the model is calculated by using a measure called Eta squared. The calculation for Eta squared is the division of sum of squares between groups and the total sum of squares. The Cohen (1988) definition of effect sizes for group comparisons is employed to estimate the strength of the model. He classifies 0.01 as a small effect, 0.05 as a medium effect and 0.8 as a large effect size. A small effect is one which is visible only after careful analysis and study, while variables that show a large effect size are visible to the naked eye or in general analysis.
The ANOVA tests conducted as part of the regression model in Table 9 show the effect sizes for the three kinds of factors. The effect size for the personal variables model does not hold any value as the model is not significantly related to job satisfaction. The institutional factors model is significantly related to job satisfaction and shows an effect size of 0.055 which is close to a medium effect as per Cohen’s definition. Finally, the socio-economic factors are found significantly related to job satisfaction, and with an effect size of 0.843 they are showing a large effect.
Results of the ANOVA Tests for the Regression Models

Discussion
Teachers and parents form the basic building blocks of our society. They prepare young minds, impart not only education, but also healthy attitudes and behaviours that shape the world. This necessitates that our teachers should be one of the best offered by our world and they should be highly motivated to do their jobs. However, the increasing numbers of vacancies in teaching and the decreasing quality of teachers have dented the teaching profession in India over the last decade. This study has attempted to find the satisfaction levels of teachers, in general, as well as their pleasure with the different constituents of job satisfaction. The following points were found after data analysis:
On the whole, the university teachers of India are satisfied with their jobs with 58 per cent teachers showing high levels of satisfaction; 40.3 per cent teachers were highly satisfied with their jobs and 8.3 per cent of them scored below 55 per cent scores, making them dissatisfied. All nine factors show strong, positive correlation with job satisfaction. Supervision, work itself and colleagues show the strongest relationships, with only responsibility and working conditions exhibiting a moderate relationship. Table 2 shows that 57.1 per cent university teachers were satisfied with their supervisors, 10 per cent were dissatisfied, that is, 35 teachers were not happy with their supervision; 32.9 per cent were extremely happy with their heads of the department or deans, exhibiting more than 75 per cent of total scores; 52.3 per cent teachers were satisfied with the relationships they share with their co-workers, with only 6 per cent dissatisfied members. A healthy percentage of 41.7 were highly satisfied with the social relationships at work; 54.3 per cent teachers were satisfied with their working conditions, 17.1 per cent were extremely satisfied and a sizeable percentage of 28.6 showed displeasure with the existing infrastructure and work environment. Responsibility, advancement, work itself and job security showed the highest numbers of teachers who were extremely satisfied with these factors. This can be explained by the fact that responsibility and work itself are both intrinsic factors associated with the basic nature of the teaching job. According to Herzberg, satisfied employees tend to give credit to the intrinsic factors associated with their job for their satisfaction (Herzberg, 1966). In teaching, advancement opportunities and policies are standardized, with clear pathways to promotion, which keep confusion, chances of nepotism and favouritism or bias to a minimum and contribute to happier employees. Lastly, teaching in India is one of the most secure jobs, meriting firing of employees a rare occasion, driven by a serious academic misconduct only. Hence, job security is also a highly rated factor. Factor analysis showed that nine factors could explain 62.81 per cent of the variance in scores. However, these nine factors differed a little in their nature from the factors defined by Lester. The most important factor identified for the Indian academics was work itself, while supervision and colleagues formed a major part of four other identified factors. Pay, supervision, colleagues and job security remained the same as in the original questionnaire’s definition. The highest numbers of teachers that were dissatisfied with a factor were shown by working conditions, pay and recognition, respectively with 28.6, 11.7 and 11.4 per cent dissatisfied teachers voting for them. Working conditions for teaching need an overhaul in rural areas and a lot of work in the urban ones. The infrastructure in rural colleges and universities is either crumbling or in bad shape. The basic teaching aids are not available, and teachers cannot be expected to perform or remain motivated in such cases. Fulfilling the demands of the industry and keeping abreast of current affairs require basic computers, Internet facilities, laboratory equipment and regular conferences and workshops, all of which need infrastructure. The policies and systems in place for teachers are also found inadequate. In recent times, a plethora of studies have been ordered by successive central governments, most of which are discarded or, at best, implemented in a piecemeal fashion, defeating their purpose. Hence, working conditions definitely need attention from the proper authorities. Regression analysis of the cohorts of variables that comprised personal, institutional and socio-economic variables were carried out to see their influence on job satisfaction. Personal and institutional factors had very limited impact on the job satisfaction of the teachers, though the type of institute was strongly related. On the other hand, socio-economic variables were found to explain more than 84 per cent variations in the scores for job satisfaction. As these factors are those which are associated with the job and its environment rather than the individual, these findings support Herzberg’s two-factor theory to a certain extent (Herzberg, 1966).
Conclusion
In the case of teachers, pay scales are fixed, and need frequent changes, in order to keep teaching, if not lucrative, at least a viable option for better quality of students to choose it as a profession. Recognition, that has shown a considerable 11.4 per cent teachers’ dissatisfaction, is an intrinsic factor associated with teaching. Hence, its inclusion in the lowest rated factors merits attention. On closer inspection, it is clear that teaching does not have close managerial controls that allows a lot of independence in decision-making associated with daily lessons and choice of research by teachers. It, however, reduces the amount of feedback the teachers get from their supervisors or co-workers, regarding their work. Private institutions have begun monitoring classes on CCTV cameras and holding student feedback sessions. These exercises, however, are held as more of a fault-finding session than a genuine feedback mechanism. Well-performing teachers may not be informed about their performance in class, but the lower scoring ones are reprimanded. Therefore, there is a need for an establishment of a proper recognition programme for teachers. This is all the more necessary, because the pay and promotions are relatively fixed and controlled by the government. There is a fundamental need for individuals to feel they are growing in their jobs, that they do a better job every day and how they are doing it. Recognition programmes might be the best solution for increasing the satisfaction of teachers in India.
It is important to mention here that over time the needs and demands of the industry as well as the aspirations, learning preferences and attitudes of the students have changed. Students who belong to generation Z now are associated with a high technology savviness (Staples, 2014), social media usage (Baer, 2016) and preference for interactive, digital and visual media for learning (Mohr & Mohr, 2017). These changes are bound to influence teacher satisfaction; however, they have not been explored in this study. It is recommended that future researchers include the perspective of the students while measuring teacher satisfaction. Including their perspective will help to understand the context of job satisfaction better and enable the authorities to improve the working conditions and other factors which are in their control. However, factors like the work itself and even peer relationships, supervision and recognition involve the perspective and expectations of each individual teacher. Therefore, it is important that such exercises that measure job satisfaction and its factors are conducted regularly that improve awareness among the teachers and the authorities and help in making the educational systems more receptive and responsive.
Footnotes
Declaration of Conflicting Interests
The authors declared no potential conflicts of interest with respect to the research, authorship and/or publication of this article.
Funding
This research did not receive any specific grant from funding agencies in the public, commercial or not-for-profit sectors.