
Abstract
The research has attempted to assess the effects of income tax benefits on adoptions of health insurance and on tax compliances. Following thematic literature review, four hypotheses have been set and following the cross-sectional research design through it have gathered data from 120 respondents chosen through stratified random sampling technique oscillated in four stratums. The significant inferential statistical results have indicated to nullify all the hypotheses and it has been documented that selective demographics and enhanced tax deductions are likely to motivate health insurance enrolments; and such tax deductions would increase tax compliances and reduce tax evasions.
Introduction
Health insurance (hereafter HI) has been referred to as any stipulated premium-based financial mechanism, which is operated by the insured for minimizing the expenditure on healthcare whenever any health emergencies arise (Bodenheimer & Grumbach, 1994; Gupta & Alam, 2000). The healthcare budget of India has reached a trivial amount of 1.5 per cent of its gross domestic product (GDP) from 0.9 per cent in 2006 (Baru, Acharya, & Acharya, 2010). Interestingly, many countries have been spending significantly in double digits, for example, the USA (17.1%), Tuvalu (16.5%), Sweden (11.9%), Switzerland (11.7%), Austria (11.2%), Cuba (11.1%) and New Zealand (11%) (WHO, 2014). Such meagre spending has catalyzed for launching of multiple HI schemes, for example, social health insurance (SHI), community-based health insurance (CBHI), micro health insurance scheme and private health insurance (PHI) (Chakrabarti & Shankar, 2015; Duggal, 2007b; Forbes, 2012). Literature has validated notwithstanding, the number of schemes that have been introduced by the central and state governments; the quality of Indian healthcare system has not improved as per expectations (Ahlin, Nichter, & Pillai, 2016). Inasmuch as the poor healthcare system has been identified as the major impediment for healthy India, private healthcare system has been booming and consequently, the HI schemes have flourished (Forgia & Nagpal, 2012; Reddy, 2012; Sharma, 2015). Research has validated around 10 per cent Indian population were within the coverage of the CBHI in 2012 (Selvaraj & Karan, 2012). The poor performance of government-sponsored health programmes compelled the Indians to spend heavily on private treatments like expenditures on out of pockets (OOPs) and on medicine (Dror, van Putten-Rademaker, & Koren, 2008; Ghosh, 2011; Mohanty, Chauhan, Mazumdar, & Srivastava, 2014; Porter & Grills, 2015). Taking these into cognizance, the Government of India has adopted the National Health Policy (NHP) with the coexistence of public and private HI providers (Reddy et al., 2011). It has attempted to promote the HI by enhancing the tax benefits on the payment of premiums for senior citizens up to the tune of 0.05 million per annum (under Sec. 80D of the Income Tax Act, 1961) (Sharma, 2015). Literature is divided into two streams of opinions about improving the Indian healthcare system. The first school of thought has advocated HI coverage to cope with catastrophic medical events (Dao & Nichter, 2016; Sodhi & Rabbani, 2014), while the other has emphasized on wide coverage of HI for reducing the substantial expenditure on healthcare (Patel et al., 2011; Wagstaff & Bergkvist, 2011; Yellaiah, 2013). Post liberalizing the HI sector and streamlining the entry norms by Insurance Regulatory and Development Authority of India (IRDA) in 1999, around 40 private HI companies have been operating in India but have just covered merely 2 per cent of the population in the first part of the current decade (Sen, Pickett, & Burns, 2014). Multiple impediments in the success of the sector have been pointed out, viz. poor infrastructure and lower levels of awareness (Vellakkal & Ebrahim, 2013) notwithstanding, that HI schemes have good prospects for expansions (Burns, Srinivasan, & Vaidya, 2014).
Literature has concurred government-subsidized healthcare schemes practising globally, for example, in China (Pan & Liu, 2012; Yip, Hsiao, & Chen, 2012), in Canada (Thompson, 1991) and those schemes assessed by the scholars (Qin, Pan & Liu, 2014). The tax benefits on the payment of HI premiums were reported in many countries such as in Canada (Stabile, 2001), the USA (Falkenberg, 2011; Tanner, 2013), Chile (Frenz, Delgado, Kaufman, & Harper, 2014), Ghana (Mills et al., 2012), China (Chen, 2013), Indonesia (Sparrow, VandePoel, & Hadiwidjaja, 2014) and in Tanzania (Levin, 2005). Research has pointed out the impediments on wider HI coverage such as language barriers, especially the English HI literature in Mexico (Schur & Albers, 1996) and even the HI-related jargons (Kim, Braun, & Williams, 2013; Paez et al., 2014).
In delve studies so far have been attempted addressing the multiple facets of the Indian HI saga such as the determinants (Chakrabarti & Shankar, 2015), the ability of the poor to participate in the schemes (Ahuja & Narang, 2005), skewed socio-economic determinants (Bhat & Jain, 2006), acceptability of HI (Jain, Selva, Zeena, & Raghavan, 2014) and reduction in health expenditures in the community health insurance (CHI) schemes in rural India (Aggarwal, 2010; Devadasan et al., 2010; Rajendran & Raya, 2010). Inadequate government support for participations (Devadasan, Ranson, Van Damme, & Criel, 2004), poor quality of healthcare facilities (Drechsler & Jütting, 2005), inaccessibility to information (Bhat & Jain, 2006) and low premium collections in CHI schemes (Criel & Waelkens, 2003) along with lack of government’s requisite and timely emphasis on CHI schemes (Michielsen et al., 2011) have also been reported. Attracting multinational insurance companies with tax incentives (Duggal, Sunil, & Vadir, 1995; Purohit, 2001) all-round innovative measures (Shaw, 2017) and long-term sustainability of healthcare-providing NGOs (Baru et al., 2010; Duggal, 2007a) have been emphasized. The substandard quality of services by the Health Department staffs has been identified as a major impediment in accessing quality healthcare (Berman, Ahuja, & Bhandari, 2010). Further, mechanisms to improve the quality of healthcare under the CHI schemes (Devadasan et al., 2010) with consumer-centric empowerment approaches (Bhatia, Yesudian, & Gorter, 2006) and subsidized rural HI schemes (Forbes, 2012) have been reported. The gravity of multiple diseases in Northeast India (NEI) such as malaria, Japanese encephalitis, lymphatic filariasis and dengue/chikungunya as well as the determinants of healthcare utilization in the rural NEI have been reported (Barman, Bhattacharya, Lyngdoh, & Jamil, 2015; Dev, Sharma, & Barman, 2015; Lyngdoh, 2016). The regional disparities in healthcare system (Lyngdoh, 2015; Neogi, 2010; Sheet & Roy, 2013) and the poorest conditions of healthcare infrastructure of NEI (Saikia & Das, 2012; Sengupta, 2009) have also been highlighted. The status of healthcare facility, challenges, remedial measures and scope for further improvements of healthcare facilities in the entire NEI have been documented (Hazarika, 2014; Sinha, 2014). Further, the significant improvement in healthcare infrastructure has been reported after the implementation of National Rural Health Mission (NHRM) in the NEI, nevertheless in a skewed manner (Baru, Acharya, & Acharya, 2010; Hazarika, 2013; Kumar, 2013). A careful review of literature has produced a trend of studies so far been attempted, encompassing divergent issues across the states but no single study has been traced to measure the relationships between individual subscriber’s tax benefits and their tendency for HI adoption not even in the NEI. The study has spotted the shortfall in the literature and has attempted to close the gap to the extent possible.
The contribution of this study towards literature has been categorized as first, it has reported the effects of income tax benefits on HI enrolments resulting in claiming of tax deductions, that is, tax compliances, likely be the first on in NEI. Second, it has conceded that demographics such as education levels, age, marital status and castes have significantly impacted HI enrolments (Lin, Liu, & Chen, 2009) but, has contradicted with few studies (Wagstaff, 2007). Moreover, influence of family income has been validated, aligned with Indian and overseas studies (Chakrabarti & Shankar, 2015), but has contested with few Indian studies (Bhat & Jain, 2006). As far as impacts of gender are concerned, it has been in corollary with few studies about significant positive impacts (Bucher-Koenen, Lusardi, Alessie, & VanRooij, 2014), but has differed from few authors who have conceded with no such precedence (Bartholomae, Russell, Bonnie, & Teresa, 2016). Third, it has validated the positive impacts of tax deductions on higher rate of HI enrolments, in tune with prior studies (Saravanan & MuthuLakshmi, 2017). Finally, following the Indian and global tax literature, it has reported the significant influence of tax compliance, resulting in reductions in tax evasions (Deb & Chakraborty, 2017; Zaklan, Westerhoff, & Stauffer, 2009).
The study has attempted to assess the effects of income tax benefits on adoptions of health insurance and on tax compliances.
The study has been designed in the remaining eight sections. A strand of prior studies have been thematically reviewed, which has been reported with the research hypotheses in the second section, the adopted research methodology has been elaborated in the third section, findings and discussion have been presented in eth fourth and fifth sections, respectively, the conclusion has been drawn in the sixth section. Finally, the managerial implications and future research roadmap have been presented in the seventh and eighth sections, respectively.
Related Literature and Hypotheses
The study has reviewed the prior literature to set the research hypotheses.
Demographics and Health Insurance
Gender
Literature has shown women have low rate participation in HI plans, for example, in the USA (Bucher-Koenen et al., 2014; Peerson & Saunders, 2011; Vart, 2010), while few studies have concluded no such findings (Barber & Odean, 2001; Bartholomae et al., 2016).
Age
Scholars have assayed the impacts of age on HI, for example, on child healthcare, in particular in Vietnam (Nguyen & Wang, 2013) and in general in Chile (Frenz et al., 2014; Sojo, 2011). The young population is mostly uninsured in the USA (Tanner, 2013).
Income and Education Levels
Income and education levels of insured people have been identified as significant motivators for taking the HI (Chakrabarti & Shankar, 2015; Logan et al., 2015; Lusardi & Mitchell, 2011; Mee-Udon, 2014).
Caste
Literature has validated marginalized population, that is, the scheduled caste (SC), scheduled tribe (ST) and other backward communities (OBC) people, have been lagging behind in HI coverage (Chanana, 1993; Filmer & Pritchett, 2001), while in the Indian scenario SC and OBC population have high inclinations towards enrolment in CGHS (Chakrabarti & Shankar, 2015).
Marital Status
The marital status and decision for enrolments in the HI coverage have been extensively studied (Lin et al., 2009; Monheit & Harvey, 1993; Wang, Zhang, & Yip, 2006). Based on these, the study has framed the research hypothesis as:
Tax Deductions and Health Insurance
Scholars have validated the complexities of the Indian tax system and ways for its rationalization (Jha, 2013; Kumar, 2014; Rao, 2005), highlighting the Chapter VI (Tax deduction sections) of the Income Tax Act, 1961. Tax benefits US$80 have been highlighted in the literature (Ghuge & Katdare, 2015; Saravanan & MuthuLakshmi, 2017), which has risen cumulatively with the assessee and her senior citizen parents to ₹0.1 million for the assessment year 2019–2020 (The Business Line, 2018). Globally, tax deductions in the form HI premiums have been reported (Goldhill, 2013; Richmond & Fein, 2005). Based on this, the relevant research hypothesis has been framed as follows:
Tax Deductions and Tax Compliances
Literature has divided tax compliance costs into different categories such as computational costs, planning costs and advisory costs (Chan, Cheung, Ariff, & Loh, 1999) and into commencement costs, temporary costs and regular costs (Evans & Walpole, 1997). Studies have indicated ill-effects of tax complexities like risk-taking attitudes (Ackermann, Fochmann & Mihm, 2013), enhanced tendency for taking tax advices (Eichfelder & Schorn, 2012) and even less tax compliances (Hodge & Guyton, 2014). Further, reduced tax burden has enhanced tax compliances (Arsić, Arandarenko, Radulovic, Randelovic, & Jankovic, 2015). Taking into cognizance the commencement costs which are likely to arise when government introduces major changes in tax rates and/or tax system, the current study has hypothesized that such cost would decrease as tax deductions ceiling US$80 have been raised significantly in the Union Budget of 2018, which would motivate assessees for more tax compliances. Accordingly, the research hypothesis has been set as:
Tax Compliances and Tax Evasions
High rate of tax compliances has inverse relations with tax evasions and such compliances have been influenced by multiple factors (Alm, McClelland, & Schulze, 1992) such as economic freedom, effective competition laws, societal perceptions and legitimacy (Gilligan & Richardson, 2005). Morality has a significant influence on compliance since whenever tax evasion has been assumed as unethical, tax compliance is likely to increase (Morris & McDonald, 1995). Moreover, tax payers have responded to the tax authorities in a systematic manner while complying with their tax liabilities (Feld & Frey, 2002; Frey & Feld, 2002). Literature has concurred inasmuch as tax compliances and tax evasions have been by and large inversely related, taxation is considered as a social act and compliance decisions are influenced by the perceptions of honesty and social norms (Frey & Torgler, 2007), trust in government and pride in citizenship (Torgler, 2003). A strand of global studies have concurred multiple mechanisms such as shaming tax payers (Ricardo & Troiano, 2015), higher rates of penalty and prosecution (Park & Hyun, 2003), conducting audit (Slemrod, Blumenthal, & Christian, 2001) and reduction in tax rates (Takáts & Papp, 2008) have significantly improved tax compliances. In the Indian context, post demonetization, higher degree of tax compliances resulting substantial increase in income tax collections have been reported (Nataraj, 2017; Singh, 2018; Singh & Bagchi, 2018). Furthermore, key policy changes such as changes in tax rates, quantum of penalty and prosecution rates and the probability of audit have also significantly influenced the tax compliances and have minimized the tax evasion tendencies (Tandon & Rao, 2017). Hence, the study has framed the hypothesis as follows:
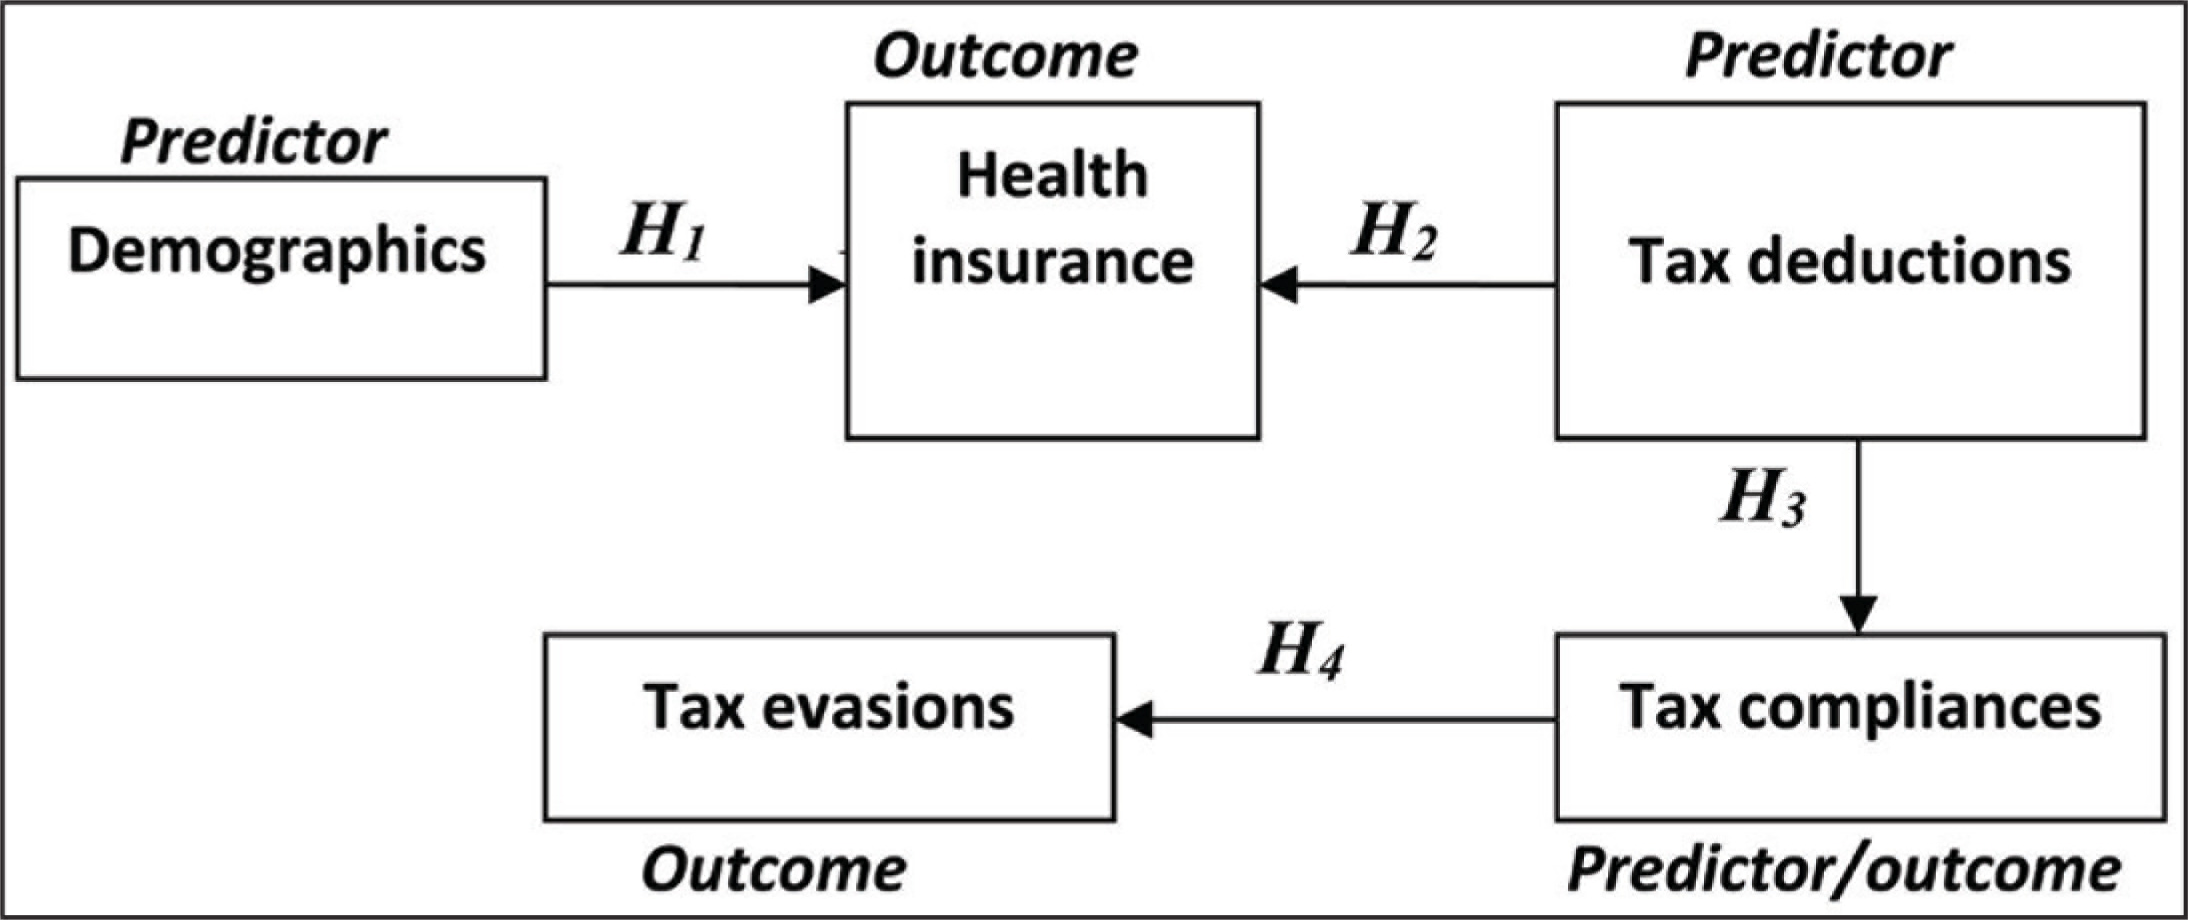
A conceptual model has been designed as exhibited in Figure 1 for carrying out the study. In the model, the respondents’ demographics (predictor) likely to influence the HI enrolment decision (outcome), which also is impacted by tax deductions (predictor). Moreover, tax deductions, being a predictor, are likely to have influence on tax compliances (outcome) and in turn, the latter act as a predictor probably to reduce tax evasions (outcome).
Methodology
Research Design
For picturing the holistic aspects of the research problem, it has adopted cross-sectional study design and for gathering primary data, the survey has been conducted.
Method
Designing the Interview Schedule
The preference for in-person interviews in social science studies for accessing the multiple benefits like flexibilities has been indicated in literature (Mack & Ryan, 2006). The study has set the interview schedule in four steps. First, applying few key words and accessing the digital library around 178 research papers with full text have been downloaded. Second, the revision of the papers has helped in framing the hypotheses and to build 25-item inventories (5-point in Likert scale) has been developed. In the third stage, a pre-test with 30 randomly chosen respondents has been conducted to judge the reliability of the items (Zikmund & Babin, 2012) and banking upon Cronbach’s alpha threshold scores exceeding 0.5 (Nunnally, 1978), 2 items are dropped. Finally, during March–April, 2018, the survey was completed.
Sampling Technique
The HI policy holders who have claimed tax benefits US$80 during the assessment year 2017–2018, especially the salaried class and individuals involved in trades and businesses of Agartala city have been assumed as the study population. For lack of contact details of the study population, the sampling frame could not be set. Stratified random sampling technique has been applied where the study population has been divided into few stratums containing homogeneous characteristics. Sampling units have been divided into strata containing four different stratums: central government employees, state government employees, traders and businessmen. The sample size (n) of the study has been fixed at 120, following the advices of scholars, which is adequate for conducting social science research (Isreal, 2013; Roscoe, 1975). Adopting disproportionate stratified sampling technique, eventually 30 sample respondents from each of the stratums have been chosen randomly.
Data Collection Procedure
Data Analysis Strategy
The statistical software has been used for data processing and analysis, and accordingly, it has accessed the 22nd version of the IBM’s Statistical Package for Social Science (SPSS).
Study Variables
From Table 1, the parameters of the study have been segregated into three types: the predictors, outcomes and extraneous. It has been assumed there likely that an association exists between the respondents’ demographics and their decisions for subscribing HI. Further, such decisions and the available income tax deductions on premium payments have been hypothesized. It has been expected that to avail the tax deductions on premium payments US$80, the enrolments are likely to be influenced. The tax deductions likely to establish an association with tax compliances and in turn, such compliance would reduce the tax evasions. To arrest the peer-group influences, it has conducted the interviews separately, as pointed out in the literature (O’Shaughnessy, 2014).
Variables

Significance Level
The significance level (α) for conducting statistical tests has been fixed at 5 per cent, which has implied the confidence level was at 95 per cent.
Statistical Tests
The study has summarized the rationale for applying the inferential statistics for testing the null hypotheses as cited in Tables 2 and 3, respectively.
Choice of Statistical Tests

Assumptions Hold for Selected Statistical Tests

Research Validities
Research validity has been referred to as a right measure, that is, the truthfulness of the findings (Altheide & Johnson, 1994) about the extent of the capability of a research instrument, which has intended to measure the research questions (Robson, 2011). It has achieved different research validities such as construct (schedule items), content (boundary of the schedule), instrument (use of uniform items in pre-test and in final survey), internal (the research findings have been confined based on statistical results), concurrent (the findings have been mostly correlated with literature) and conclusions (the significant statistical results have generalized to the studied population). Further, to arrest the internal validity threats, the stratums have been chosen judiciously and interviews have been carried out separately.
Limitations
In tune with the research objective, it has framed only four hypotheses, used selective variables and the related literature in English has only been considered. Due to parsimony and time constraint, selective respondents covering confined geographical areas have been considered. The data collection instrument has been self-designed in preference to any established questionnaire. Moreover, for data analysis convenience, it has used pre-coded close-ended schedule and no open-ended questions have been used. The adoption of 5-point Likert scale with an option ‘neutral’ instead a 4-point scale could have been applied, in line with scholarship (Losby & Wetmore, 2012). Factor names unlikely have accurately reflected the variables within the factor. Different inferential statistical tools applied have their specific limitations, which could have at least partial impacts on the findings (Bethlehem, 2008). Finally, the probability of social–desirability bias (Crowne & Marlow, 1960)—a tendency of the participants to put their responses as expected by the enumerator unlikely is completely ruled out.
Results
Descriptive Statistics
The sample statistics of the study have been presented by mode (for nominal data), mean and standard deviation (SD) (for interval data). It has been reported that 55.83 per cent participants are men, 40.83 per cent of them have been in the age group of 45–54 years, 81.67 per cent of the participants are married, 28.33 per cent are graduates, 40 per cent belong to general caste, 41.67 per cent have monthly income of ₹0.025–0.05 million, 94.17 per cent of them have enrolled in health insurance scheme, 60.83 per cent have included their dependents under the insurance coverage, 40 per cent of them have sum assured up to ₹0.1 million, 45.83 per cent have been paying annual premiums in the tune of ₹0.01–0.02 million, 90 per cent of them have accessed the knowledge about tax benefits US$80 for payment of premiums but only 65 per cent of the respondents have claimed the same.
Principal Component Analysis
The study has run the Principal Component Analysis (PCA) on the presumption that the total variance of the variables would be accounted for by means of its components (or factors), and hence that there would be no error variance (Field, 2000).
Reliability has been referred as the instrument likely to produce stable and consistent results, that is, in other words, a good measure. It has run Kaiser–Meyer–Olkin (KMO) test for assessing the sample adequacy and Bartlett’s test of sphericity to examine whether the matrix is an identity matrix or not. The significant KMO test results have supported the sample adequacy and the significant Chi-square results (p < 0.05) have affirmed that matrix is not an identity matrix (as presented in the Tables 4 and 5 respectively).
Reliability Statistics

Sample Adequacy Statistics

The communality—proportion of common variance present in a variable has been extracted by applying the PCA as presented in Table 6.
Communalities


Total Variance Explained

PCA technique has deduced four components, which have been labelled with appropriate titles as presented in Table 7 along with corresponding Eigen values—the total of squared values of factor loadings of a factor. Inasmuch as Eigen values have represented the amount of variation explained by a component and such Eigen value of 1 has represented a significant amount of variation (Kaiser, 1960). The deduced components have reorientation of around 81.65 per cent of the variables, a significant figure for inferring the conclusion (Pett, Lackey, & Sullivan, 2003). Component 1 has been assigned the title Health Insurance Uniqueness consisting of 7 items with the average mean = 3.78, SD = 1.070, where the mean scores have been oscillating between 3.67 and 3.92. Cronbach’s alpha scores of the components have been computed as 0.678, 0.702, 0.598, 0.515, 0.555, 0.571 and 0.580, respectively. Component 2 has been captioned as Health Insurance Perspectives incorporating 6 items with average mean = 3.79, S.D. = 1.115, mean scores have been oscillating between 3.76 and 3.81. Cronbach’s alpha scores of the components have been computed as 0.539, 0.561, 0.622, 0.673, 0.595 and 0.613, respectively. Component 3 has been named as Tax Compliance Perspectives, covering 4 items with average mean value = 3.63, SD = 1.211 and the mean scores have been distributed between 3.58 and 3.73. Cronbach’s alpha scores have been calculated as 0.581, 0.619, 0.601 and 0.609, respectively. Component 4 has assigned the name of Tax Evasion Perspectives, containing 6 items with average mean value = 3.75, SD = 1.187 and the mean score have been ranging between 3.57 and 3.96. Cronbach’s alpha scores have been computed as 0.633, 0.607, 0.584, 0.569, 0.597 and 0.605, respectively.
Inferential Statistics
Cross Tabulations
To assess the influence of selective demographics (predictors) on HI enrolment decision (outcome), that is, to test H01, cross tabulations have been applied; the significant outcomes are presented in Table 8.
In the results section of Table 8, the first column shows the Pearson’s Chi-square values, which are used for testing whether row and column variables are independent or not. The lower significance values present in the fourth column have evidence to nullify H01. The second column summarizes the corresponding Likelihood Ratios, which have also been explained in corollary with Pearson’s Chi-square values. Since the current study has been carried out with relatively lower sample size of 120, the Likelihood ratios would validate the findings as the findings likely been less affected by smaller samples, as literature indicated (Hays, 1963). The Linear-by-Linear Association test has been conducted for ordinal type data on the assumptions of equal and ordered intervals and the results have been summarized in the third column. The significant results of the Pearson’s correlation coefficient with an approximately chi-squared distribution on 1 df, ( p < 0.05) have supported to reject the H01.
Summary Results of Cross Tabulations

Pearson’s Correlation
Pearson’s correlation has been applied for assessing the associations between tax deductions and HI enrolment as well as the former’s associations with the tax compliances. The significant and positive associations between tax deductions with HI enrolments (r = 0.751, n = 120, p = 0.001) and with tax compliances (r = 0.770, n = 120, p = 0.003) have supported to nullify both H02 and H03. The findings as reported in Table 9 have supported the research hypotheses that due to enhanced tax deductions on payment of HI premium, the uninsured and under-insured are likely to enrol in different plans for accessing the tax benefits US$80. Such claiming of tax deductions would be tantamount to enhanced tax compliances. To sum up, it has drawn the conclusions that tax deduction has positive significant association with increased number of HI enrolments and increased tax compliances.
Correlations between Tax Deduction and Health Insurance Enrolment

Simple Regression
To investigate the effect of tax compliances in evading tax evasions (H04), the simple regression analysis has been applied.
The influence of tax compliances on tax evasions has been tested using simple regression, which has deduced significant result as evident in Table 10. The first column R exhibits the simple correlation between the variables scored 0.513, moderate relations between themselves. However, the direction of this relationship has not been reflected. The second column R2 shows a score of 0.482, which indicates 48.2 per cent variations of the tax evasions likely as explained by tax compliances, a moderate figure even though the higher the R2, the better the model fits the data (Frost, 2013). Moreover, it has been indicated that it is likely to have other variables which have influences on tax evasions. The next column, adjusted R2, is an adjustment of the R2, which has penalized the addition of extraneous predictors in the model (i.e., Model 1). To avoid a bias towards complex models, the adjusted R2 has been used. The model is unlikely to interpret the adjusted R2 as the percentage of explained variance in the sample used for regression analysis. The adjusted R2 has only been used as a measure of how much the model has been able to explain while controlling for model complexity. The fifth column presents the S.D. of the error term and the square root of the Mean Square (MS) for the residuals.
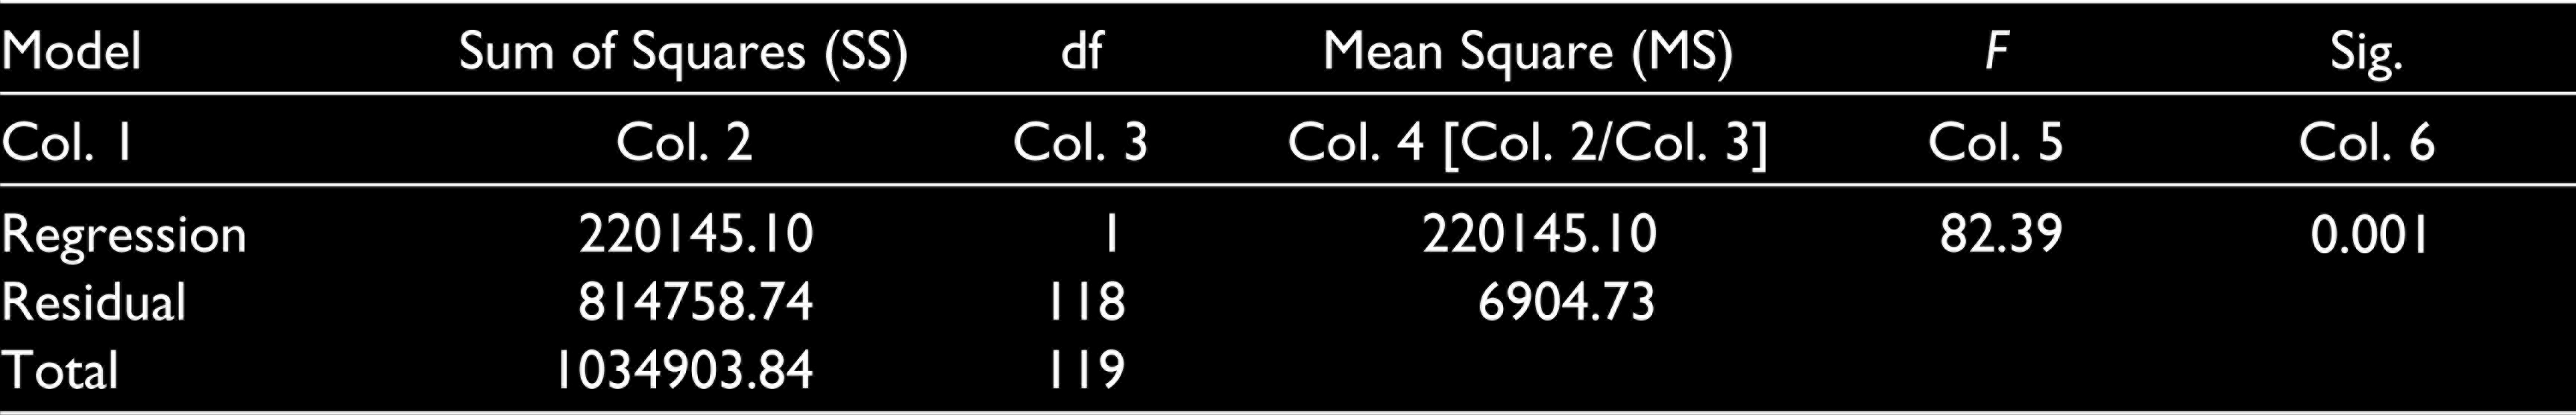
The result of Analysis of Variance (ANOVA), indicating whether the applied model has been significantly better in comparison to the mean value for predicting the outcome, is shown in Table 11. In the fourth column, the MS has been derived dividing the SS (col. 2) by the df (col. 3), and in the fifth column the associated F ratio has reported significant scores (p < 0.05) [F (1, 118) = 6904.73, p = 0.001]. The significant result has conceded that there has been less than 0.001 per cent chance that an F-ratio this large would happen if the H04 were be accepted. It is likely to conclude that the regression model findings are significantly better in predicting the tax evasions than if the mean value of tax compliance could have been used. Finally, the significant result has emphatically pointed to nullify the H04, hence the corresponding research hypothesis is likely be accepted.
Model Summary Resultsa

ANOVAa Results
Discussion
The study has run PCA, a set of techniques which has economically clubbed the underlying variables into fewer components. Furthermore, it has established the underlying dimensions between measured components and latent constructs (i.e., things that cannot directly be measured), thereby allowing the formation and refinement of theory. Moreover, the respondents have been chosen randomly and the variables measured have constituted the study population of variables, the core of the study. Notwithstanding, techniques are likely be developed to generalize the findings to the wider study population, but the constraint is that the results would hold true only for the set of variables measured. In Table 12, the extracted components with the number of items and their corresponding statistical values have been summarized.
The outcomes of cross tabulations have indicated a significant result and accordingly H01 could probably be rejected and the corresponding research is likely to be accepted. The relationship between tax deductions and HI enrolment decision has been tested by applying Pearson’s Correlation coefficient technique, and based on significant result H02 has likely been rejected. Further, the Pearson’s Correlation coefficient technique has been adopted to assay the relations between tax deductions and tax compliances and a significant result has also supported to reject H03. Banking upon those significant results, it has to be concluded that HI enrolment decision probably is significantly influenced by tax deduction quantum and such enhanced tax deduction, in turn, is likely to motivate increased tax compliances. Eventually, H04 has assessed whether enhanced tax compliance has reduced the instances of tax evasions, and to test the same simple regression analysis has been conducted. The significant finding has indicated to reject H04, that is, likely to conclude that tax evasions probably be reduced due to increased tax compliances.
The success of HI has largely depended on the individuals’ behavioural change. The Union Budget 2018 has replaced the erstwhile Rashtriya Swasthya Bima Yojana (RSBY) by National Health Protection Scheme (NHPS) which has a coverage of ₹0.5 million per family without any subscription fee. The scheme notwithstanding has been operating on the principle of ‘risk pooling’, but it, unlikely, has resembled a classical HI scheme where the individual subscribers or employers would pay for protections (Reddy, 2018). Further, HI schemes have different plans with varying premiums depending on the sum assured, which has indicated the NHPS as a government healthcare scheme rather purely a HI. The present study at this juncture has its unique relevance as poor people have preferred OPD and primary healthcare services instead of hospitalization for the fear of losing wages. The NHPS is likely to give indirect boost for the healthcare sector, for example, for service providers, medical and surgical instrument producers and HI companies along with other allied healthcare services. Accordingly, effective participation along with public policy promoting awareness about HI plans is the need of the hour. For accessing HI, aggressive awareness programmes along with drives for HI literacy campaigns need to be organized at a large scale. Media, especially social media, is likely to play a significant role in closing the gap. The HI coverage has the potential to significantly reduce the out-of-pocket expenditure, which currently constitutes 62 per cent of the total health expenditure for Indians (Kapoor, 2018). Adoption of HI probably extends twin benefits not only for subscribers but also for government since the individuals enter within the formal HI ambit and would claim tax deductions for the payment of premiums. Such voluntary enrolment would likely enhance the number of subscribers and claim of tax deductions US$80 would boost the revenue collections and tax compliances which, in turn, are likely to reduce the tax evasions.
Summary Results of PCA and Descriptive Statistics

Conclusion
With the objective of assessing the effects of income tax benefits on adoptions of HI and on tax compliances, the current research has been conducted. By adopting the cross-sectional study design and applying stratified random sampling technique, data have been gathered from four different stratums: central government employees, state government employees, traders and businessmen. A total of 30 respondents have been chosen from each of the four stratums using a self-designed interview schedule. The schedule has been divided into four sections to collect respondents’ basic information; a section designed in nominal scale has been applied to assay the relations between demographics and HI perception, and two sections have been incorporated in 5-point Likert scale for assessing HI aspects in particular as well as holistically. The null hypotheses have been tested and significant statistical results have documented to nullify all these and accordingly the corresponding research hypotheses are likely to be accepted.
Managerial Implications
The study has indicated how demographic variables impacted HI enrolments, which may be used by the potential customers while taking their HI enrolment decisions. The significant positive influence of increased deductions on HI enrolments is likely to motivate the insured to include their parents in the ambit of HI coverage for accessing the full benefits of the Section 80D. It is well settled that India’s tax challenges unlikely for exorbitant tax rates per se, rather due to the associated complex compliance. The Economic Survey 2018–2019 has shown the tax-to-GDP ratio has slipped to 10.9 per cent and the government has been under constrained fiscal space hence unlikely to cut the tax rates (Kale, 2019). Taking this into cognizance, the tax authority may access the report for chalking out strategies to increase the direct tax revenues by enhanced tax compliance. Furthermore, such compliance would likely reduce the tax evasions substantially inasmuch as the assessees would claim deductions US$80 while filing their returns. A welfare state government needed revenues for achieving the growth and development objectives, which has created choices between tax rate cuts and widening the tax base. Tax literature has shown high tax rates have adversely affected investments, hence policymakers may use the report for enhancing the narrow tax base by attracting the potential tax payers under the ambit of tax through extending tax deductions for payments of HI premiums. Finally, the HI providers may design their advertising strategies by focusing on the tax benefits which, in turn, would not only attract new customers but also retain the existing customers even with enhanced sum assured.
Future Research Roadmap
The role of media in understanding complexities of HI literature while taking HI coverage (Chakrabarti & Shankar, 2015) may be studied in NEI where multiple languages and dialects have been using by inhabitants. Future research may be directed to assess the potential insured’s level of health literacy in a comparative manner district-wise or inter-state as literature indicated (Kim et al., 2013) for chalking out policies for HI awareness. The HI companies’ performances in the light of the enhanced tax deductions US$80 may be studied through intra-firm and inter-firm comparisons. Future research agenda may be channelized to assess the impacts of excluded variables such as social, cultural and psychographic demographics on tax evasions (Bobek, Hageman, & Kelliher, 2013). Finally, the role of Third Party Administrators (TPAs) for accelerating the HI growth may be studied in an era of enhanced tax deductions US$80.
Footnotes
Declaration of Conflicting Interests
The authors declared no potential conflicts of interest with respect to the research, authorship and/or publication of this article.
Funding
The authors received no financial support for the research, authorship and/or publication of this article.