



Abstract
Many empirical studies have analysed the effect of good news and bad news on equity market return volatility using both developed and emerging markets data, with scant literature for frontier stock markets. This study evaluates how news affects stock market return volatility in a frontier market using Uganda data. It specifically analyses the reaction of stock return volatility to news filtering into a frontier market using the exponential generalized autoregressive conditional heteroscedasticity (GARCH) model on daily data ranging from 1 September 2011 to 31 December 2017. Estimates of the shape parameter from generalized error distribution indicate the existence of leptokurtic return distribution. Results from the exponential GARCH model show that the effect of bad news and good news on the frontier market return volatility differs, thus suggesting existence of leverage effect in the period studied. Overall results from the study suggest that positive news impacts stock market returns volatility more than negative news of the same magnitude. An important implication of our results is that investors, analysts, brokers and dealers should be conscious of the nature of news filtering into the stock market as such information might improve their expected volatility forecast.
Keywords
Introduction
It is not contentious that news causes volatility of stock market return. Numerous studies have established that the effect of good news and bad news on equity market return volatility differs. The contention, however, is the nature of effect of news on stock return volatility. One of the stylized facts of stock return volatility is that bad news typically increases volatility of stock market return than good news of similar magnitude. This stylized fact, known as leverage effect, thus implies that stock return volatility rises more following bad news than following good news (Black, 1976; Christie, 1982; Karolyi, 2001). In agreement with leverage effect, Ibbotson (2011) opines that a substantial driver of volatility is a decline in the market, and that following a decline in return, volatility customarily moves up for a period prior to going down again. In reality, the declines are associated with significant increases of uncertainty. However, empirical evidence from some frontier markets 1 has shown that asymmetric responses of volatility to news are diverse. While some studies document evidence of good news propelling volatility more than bad news, few other studies have shown absence of volatility asymmetry (see, for example, Ogum et al., 2005; Saleem, 2007; Oskooe & Shamsavari, 2011; Khan et al., 2016).
The reaction of stock return volatility to bad news and good news has been examined in extant literature using the generalized autoregressive conditional heteroscedasticity (GARCH) family model with an asymmetric coefficient. Asymmetric GARCH models followed the development of the autoregressive conditional heteroscedasticity (ARCH) model by Engle (1982), which was generalized by Bollerslev (1986). Asymmetric volatility models evolved because of the inability of symmetric GARCH models to capture some characteristics of financial time series observations. Asymmetric volatility models that capture the reaction of stock return volatility to good news and bad news include the threshold GARCH (TGARCH) model outlined in Zakoian (1994), the GJR-GARCH specification outlined in Glosten et al. (1993), exponential GARCH (E-GARCH) model introduced in Nelson (1991), and other variants of GARCH models.
Many evidence-based studies have focused on the reaction of return volatility to changes in stock market news across the globe (Amit & Bammi, 2016; Braun et al., 1995; Dzieliński et al., 2018; Jegajeevana, 2012). The motivation for these studies is the need to understand the response of stock return volatility to news filtering into the stock market in order to assess their implication on equity investment. A majority of the studies were conducted using emerging and developed stock markets data, with little literature for frontier markets. This scant of empirical studies on frontier markets blurs our understanding news–stock return volatility nexus in such markets. There is, therefore, a need for more empirical evidence on the reaction of return volatility to stock market news in frontier markets.
This paper offers an extension to the literature on the reaction of return volatility to news filtering into a frontier stock market using the E-GARCH model. The purpose is to document empirical evidence on the response of stock market return volatility to bad news and good news. Such evidence would be useful to stock market policy-making, stock pricing, portfolio management and equity risk management. If, for example, equity investors have evidence-based knowledge that the effect of good news and bad news differs, they would adjust their portfolio in response to the nature of news and expected volatility behaviour. More so, regulators could also make proactive policies to minimize negative consequences of volatility in the market in response to volatility expectations. This paper is organized into five sections. After Introduction in Section 1, Section 2 follows with a brief literature review. Section 3 outlines data, descriptive statistics and the method of analysis. Section 4 contains results and discussion, and Section 5 concludes the study.
Brief Literature Review
The theoretical framework for this study is leverage effect, which is one of the stylized facts of stock market volatility studies. The leverage effect holds that a fall in stock return causes volatility to increase more than the volatility caused by a rise in stock return. Black (1976), who puts forth the leverage effect theory, explained that a decrease in an entity’s stock value will result in a negative return on the entity’s stock. This negative return will in turn cause a rise in leverage of the stock which increases the debt–equity ratio. The rise in the debt–equity ratio increases credit risk in the firm as stakeholders perceive the stream of future cash flows as being more risky, hence resulting in increased volatility. Karolyi (2001) agreed that effect of good news and bad news on volatility of stock market differs, when he opines that stock return volatility rises more following bad news (stock price decline) than following good news (stock price increase). The existence of the leverage effect in a stock return signals a rise in financial risk, which negatively affects investment. Consequently, investors demand higher risk premium to contain the perceived increase in risk, which results in paying less for the relevant stock.
Many empirical studies have examined the impact of news on stock returns volatility across global stock markets. They were motivated by the need to understand the response of stock returns volatility to news filtering into the stock market in order to assess their implication on equity investment. The studies could be divided into three groups. The first group concentrates on evaluating the leverage effect in stock markets. Studies in this group include Ericsson et al. (2016), who investigated financial leverage and volatility asymmetry by employing dynamic panel vector autoregression using data at the firm level for all entities in the Centre for Research in Security Prices and Compustat database for the 1971 to 2013 period. They report evidence of a much larger leverage effect than reported in Christie (1982). They further show that a change in leverage has a prolonged effect on volatility and accumulates over time, with the leverage effect accumulating as much as five times in 12 quarters more than a static model would have predicted in one quarter. In a related study, Amit and Bammi (2016) investigated leverage effect for Bombay Stock Exchange 30 index by analysing the how good and bad news interact with volatility using a study period ranging from 1992 to 2014. The study period was divided into the following sub-periods: boom (May 1992–November 2007), recession (December 2007–30 June 2009) and the post-recession period (July 2009–30 April 2014). Estimates from asymmetric GARCH models show that the stock market in India reacts differently to good and bad news, thus establishing that leverage effect exits in all periods studied. The study concluded, however, that the leverage effect was more visible in recessive periods than in other periods, as shown by their results.
The second group of empirical studies concentrates on measuring the impact of news on volatility of equity return. Depken (2001) evaluated the effects of bad and good news on equity returns data using 10 companies that split their stock for a period ranging from 19 January 1987 to 14 November 1989. He divided the volume traded into categories for flows of bad news and good news filtering into the stock market and showed that good news flow increased stock price while bad news flow reduced the price. Further, many of the 10 split stocks indicate that the decomposition explains more of the conditional variance than the volume series. He concluded that volatility of returns for younger split stocks responds asymmetrically to good news filtering into the equity market, whereas volatility of older split stocks responds symmetrically to good news and bad news. A later study by Jegajeevana (2012) examined whether bad news and good news have the same effect on daily and monthly equity return volatility in the Colombo Stock Exchange (CSE) using the GARCH (1,1) model, E-GARCH (1,1) model and GARCH-in-mean model from January 1998 to June 2009. The results show the existence of non-normal distribution and ARCH effect in the daily return series. Conversely, the monthly return series are found to be normally distributed without ARCH effect. Estimates from the asymmetric E-GARCH model show the existence of volatility asymmetry, which indicates that CSE responds more to negative shock than to positive shock of similar size. In a more recent study, Mashamba and Magweva (2019) evaluated the existence of leverage effect and volatility persistence in some Southern African capital markets, including Malawi, Namibia, South Africa, Zambia and Zimbabwe, using the E-GARCH (1.1) model. The descriptive statistics show, amongst others, leptokurtosis and absence of normal distribution in all the markets’ return. The results from the E-GARCH model indicate evidence of volatility persistence for all markets except for Malawi. The results further show that negative news has more effect on the volatility of capital market return than positive news of similar weight for the Namibia, Zambia and South Africa markets, and that positive news has more effect on volatility than negative news of similar magnitude for Malawi and Zimbabwe, using the generalized error distribution (GED) and Student’s t-distributions.
The third group of literature was conducted to provide explanation for the existence of asymmetry in stock return volatility. Khan et al. (2016) analysed the role of firm age on leverage effect, amongst others, for firm returns using monthly data of 208 firms listed on the Pakistani stock market for the June 1998 to June 2012 period. Results from the asymmetric E-GARCH model show, amongst others, that for a majority of the young firms, the bad news causes significant increases in volatility of equity return more than good news of similar weight, and that leverage effect and asymmetric behaviour decrease as the firms increase in age. The study also shows that the function of good news in remarkably increasing equity return volatility more than bad news of similar weight increases with the rise in firm number of years from new to matured firms. In a recent study, Dzieliński et al. (2018) analysed how asymmetric attention affects volatility asymmetry using daily stock returns of 7,133 U.S. stocks with over 16.5 million observations collected from the database of Center for Research in Security Prices for a period ranging from 1989 to 2007. The estimates from the asymmetric power GARCH model show that volatility asymmetry has positive relationship with differences of opinion and investor attention. The study used dispersion in analysts’ forecasts to proxy differences in opinion, and list of market analysts studying a given entity to proxy attention, and find that the two effects complement each other. The results further show that the impact of attention is stronger in equities with low institutional investors and high idiosyncratic volatility. They conclude that asymmetry in volatility is propelled by asymmetric attention.
Data, Descriptive Statistics and Methodology
Data
We used the daily all-share index of the Ugandan Securities Exchange (USE) as a proxy for frontier market.
2
The time series data were obtained from investing.com and ranged from 1 September 2011 to 31 December 2017, totalling 1,512 time series observations. The study period was chosen due to availability of data. Talpsepp and Rieger (2010) note that eliminating outliers in time series data does not practically change the results. We removed outliers from the time series, and then converted to stock daily returns by extracting first difference of the natural logarithm series thus:

where Drt is the daily stock return, It is the closing price of the market index at time t, It–1 is the previous day closing price of the market index, and Ln is natural log.
Descriptive statistics of the stock return series
Figure 1 displays a graph of the log-level and return data for the study period. A visual inspection of the graph indicates that the level series of the frontier stock market data were not stationary, as there is a very glaring trending pattern. Comparatively, the line graph of the return data shows numerous fluctuations around the average value, albeit with very few spikes. Observe further that the return data series appear to have mean reverting tendencies, which can be noticed in the graph as the return series reverts to the mean after a deviation. Mean reversion suggests that the frontier market return series may be stationary.
Descriptive statistics for the frontier stock market returns are shown in Table 1. For the study period, the average annualized stock return is 8.53 per cent for the market. Observe that the wide gap between the minimum (–9.39) and maximum (9.10) percentage returns shows significant dispersion in the market returns. This wide dispersion in return suggests investment uncertainty, which is captured by the annualized standard deviation (18.36 per cent). In a symmetric distribution, skewness coefficient is zero. Thus, positive or negative skewness in stock return indicates deviation from normality. Accordingly, positively skewness signals higher probability of positive return than negative return, vice versa. As we can see from Table 1, skewness (–0.37) is significantly negative, which indicates evidence of return asymmetry. Normal distribution has zero excess kurtosis but notice from Table 1 that excess kurtosis is positive and high (10.00) and leptokurtic. This implies that stock investors can earn high investment returns as well as lose significant value of the invested funds (Emenike, 2016). The coefficient of Jarque–Bera statistic did not support normal distribution in the market daily returns. The results of leptokurtosis and non-normality agree with the findings of Namugaya et al. (2014).

Preliminary Statistics for a Frontier Equity Market Return

Methodology
To analyse the impact of news on a frontier market, we apply the exponential GARCH (1,1) model introduced in Nelson (1991). The E-GARCH (1,1) model brought some modification to the symmetric GARCH (1,1) model. One of these modifications was to model log of the variance instead of the level. In this way, estimates of the conditional variance are strictly positive, making the non-negativity restriction of the symmetric GARCH model unnecessary. The second modification is the introduction of an asymmetric (γ) parameter, which typically responds asymmetrically to good and bad news. In this method, asymmetric news effect was estimated using the following equation:
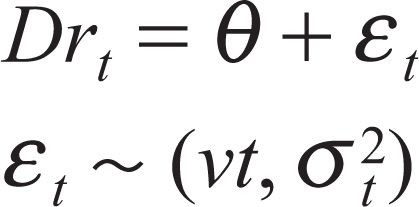

where Drt is the average return, θ is a intercept term, ε
t
is the error term and νt is a random variable that follows GED. In the third equation, logϬ
2
t is the conditional variance or volatility at time t, ω is constant variance, α
Results and Discussion
Preliminary data analysis
Panel A of Table 2 shows autocorrelation functions (ACF) for the frontier stock market return data and Ljung–Box Q-statistic (LBQ) conducted to examine statistical significance for the lag lengths of ACF selected by Bayesian information criterion (BIC). The ACF test was estimated to evaluate whether the return USE series were autocorrelated. Understanding time series properties of data, such as autocorrelation, is necessary in the specification and estimation of correct mean model (Emenike, 2016). Estimates from well-specified mean models are required for correct empirical analysis and statistical inference (Rachev et al., 2007). The estimates from LBQ indicate that the market return series were not autocorrelated at any conventional significance level, up to lags 77. This is also clear from the autocorrelation function of daily stock market returns displayed in Figure 2. Absence of autocorrelation in the stock return data implies that an autoregressive mean model is not suitable since there is serial independence in the return data.

To ascertain the stationarity property of the market series used in analysis, we investigate the existence of unit roots in levels and first differences of the data. As shown in Panel B of Table 2, the estimates from Phillips–Perron and augmented Dickey–Fuller unit root tests show that market log-level series require first differencing to become stationary (i.e. I (1)). The return series, however, are stationary (i.e. I (0)), as we can observe from the Phillips–Perron and augmented Dickey–Fuller unit root results.
Preliminary Statistics for USE Level and Return Series
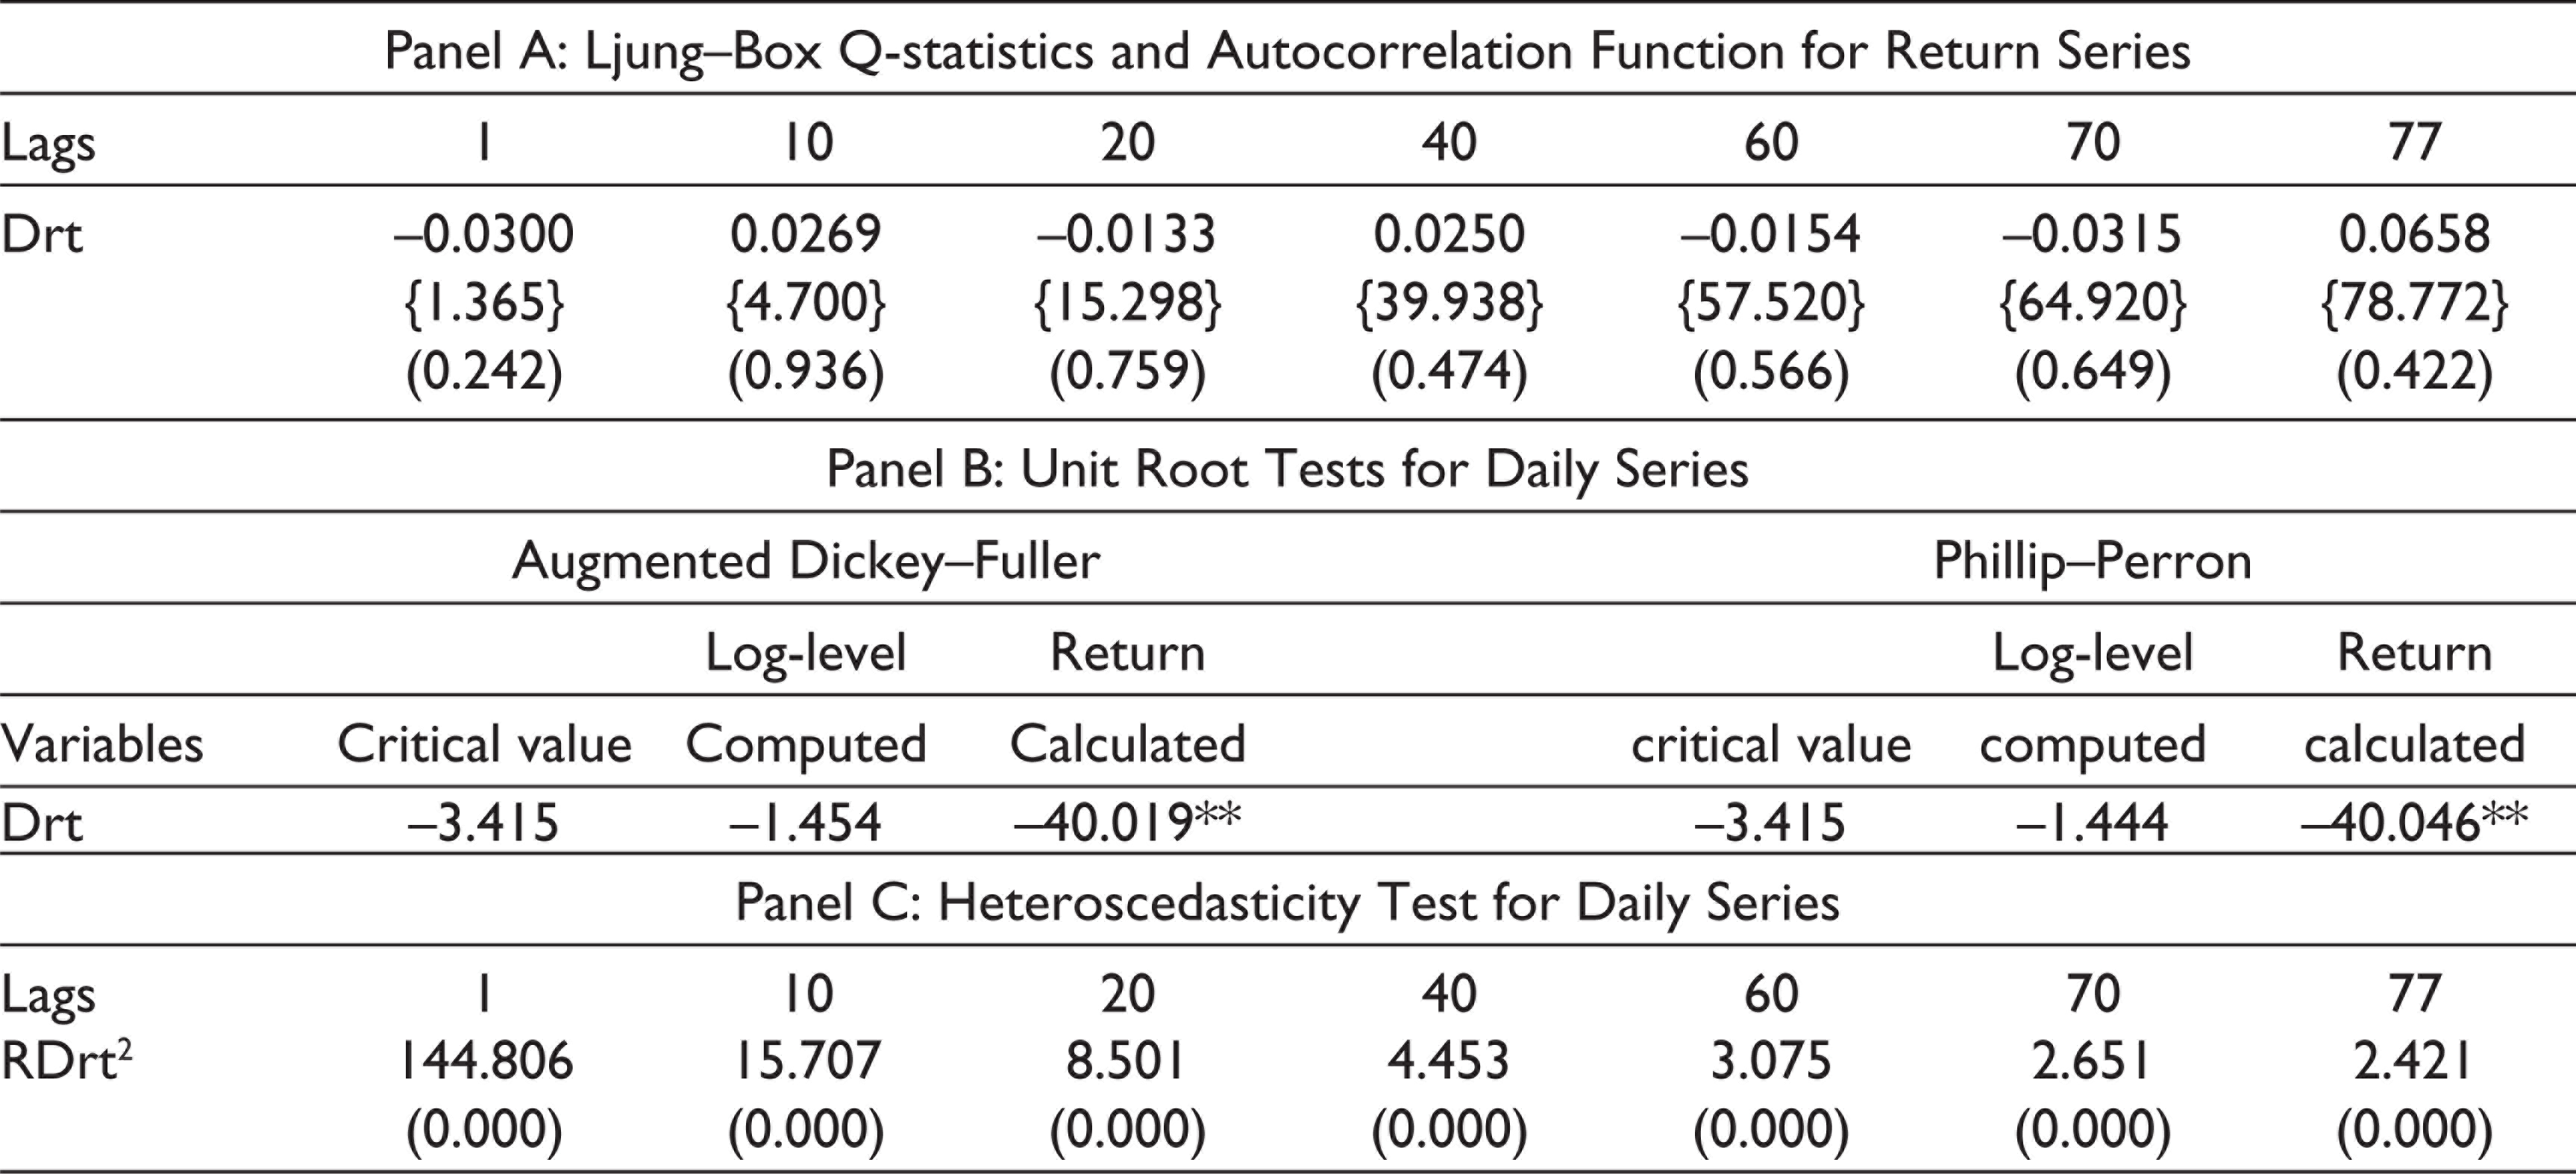
Existence of heteroscedasticity in the residual of the mean model is a condition for estimating GARCH family models. Panel C of Table 2 displays estimates from autoregressive conditional heteroscedasticity Lagrange multiplier (ARCH-LM) tests computed to check market return data for heteroscedasticity. Observe from Panel C that there is evidence of heteroscedasticity in the residual series at the 1 per cent significance level. This provides support for GARCH modelling. Evidence of heteroscedasticity has been reported in many earlier studies (see, for example, Emenike & Aleke, 2012; Mashamba & Magweva, 2019).
Measuring effect of news on stock return volatility using E-GARCH (1,1) model
This section presents the results of the asymmetric E-GARCH (1,1) model estimated to evaluate the effect of news on volatility of stock return in a frontier market. Notice from the estimates of E-GARCH (1,1) model in Table 3 that coefficients of the constant variance (0.003), ARCH (0.046) and GARCH (0.847) parameters are statistically significant at the 1 per cent level. These suggest that the three measures of volatility have explanatory power on stock market return. Notice also that volatility clustering parameter is statistically significant, at the 1 per cent level, suggesting existence of volatility clustering in the daily market return. Also notice from Table 3 that there is evidence of volatility shock persistence in the frontier stock market return data (0.925). This result is in agreement with the findings of Jegajeevana (2012) who document evidence of volatility with high persistence in the CSE. Mashamba and Magweva (2019) also reported similar findings. According to Rachev et al. (2007), volatility with high persistence indicates that average variance will remain high since increases in volatility due to shocks will decay gradually.
In the same vein, the E-GARCH (1,1) model results displayed in Table 3 show that the reaction of stock return volatility to bad news and good news differs. This is evident in the P-value (0.013), which is less than the 5 per cent significance level. The t-statistic of the asymmetry coefficient is also greater than theoretical t-statistic at the 5 per cent significance level. As outlined in Section 3.3, the effect of news on volatility is significant if the asymmetric coefficient is not zero. If the asymmetric coefficient is negative, then bad news tends to produce higher volatility in the immediate future than good news. If, on the contrary, the asymmetric coefficient is positive, it implies that good news induces higher stock return volatility in the following periods than bad news. Notice from Table 3 the asymmetry parameter is positive and significant at the 1 per cent significance level, suggesting that good news has tendency to create higher volatility in the following future periods than bad news of similar weight. In agreement with existing empirical studies, this result indicates that frontier stock market return reacts differently to bad news and good news. The result is also in line with Khan et al. (2016), who report that the role of good news is enhanced with the age of firms in Pakistani stock market in significantly amplifying stock return volatility more than bad news of similar weight.
Asymmetric E-GARCH (1,1) Model Estimate for a Frontier Stock Market Return
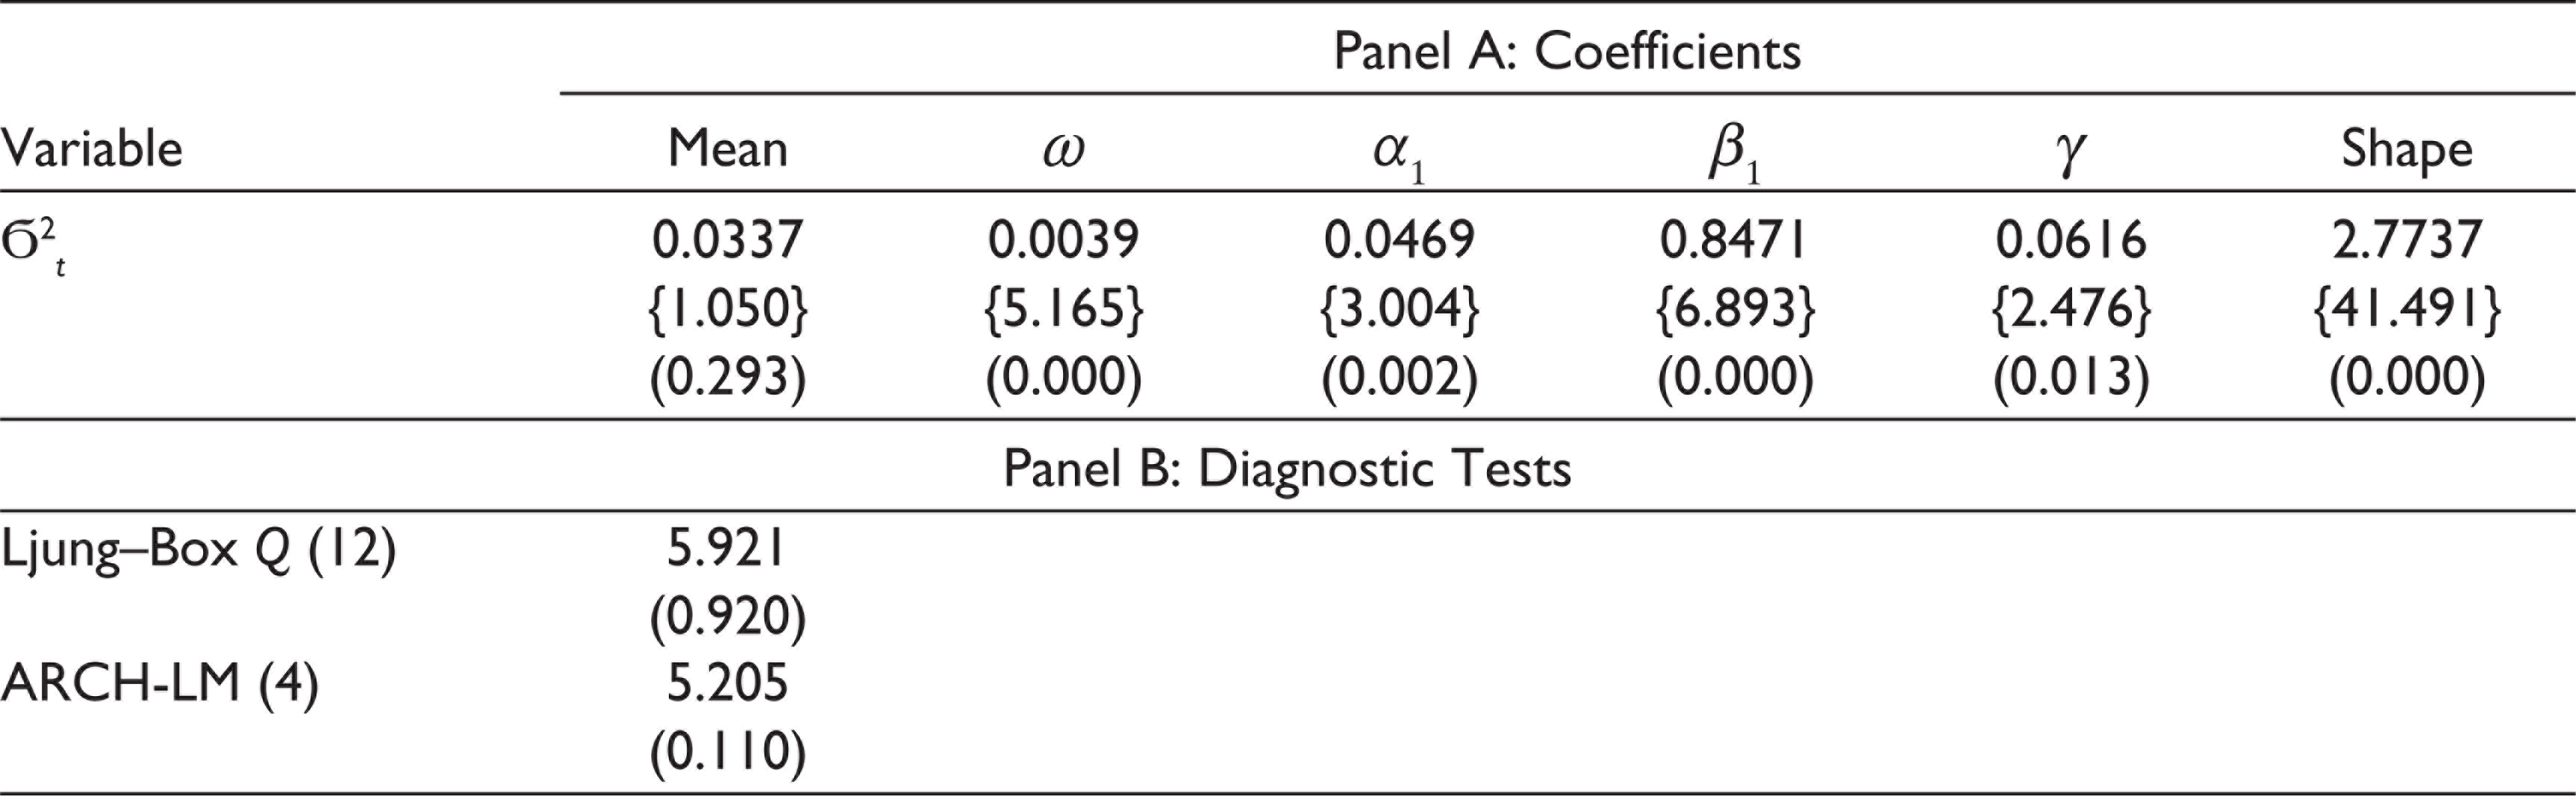
In addition, the coefficient of the shape parameter provides empirical support for the evidence of leptokurtosis displayed in Table 1. As highlighted in Section 3.3, shape parameter c greater than 1 suggests existence of fat-tailed distribution. Evidence of leptokurtosis in the frontier stock market is also similar with earlier studies.
Panel B of Table 3 contains the results of diagnostic tests estimated to evaluate robustness of the estimated E-GARCH model. As can be seen from panel B, the LBQ at lag 12 is Q(12) = 5.92 and corresponds to P value of 0.892 for the residuals of the mean model. This indicates evidence of insignificant Q-statistic for the residual series. Similarly, the univariate ARCH-LM estimates provide evidence of no heteroscedastic in the squared residual series of the asymmetric E-GARCH model. Consequently, both the mean and volatility models appear to be well specified.
Conclusions
In this study, we evaluated the effect of news on volatility of a frontier stock market returns using Uganda data from 1 September 2011 to 31 December 2017. Result of the shape parameter computed from the GED shows that the return distribution is leptokurtic. Estimates from the E-GARCH (1,1) model show the existence of volatility shock persistence in the stock market return data. Further, the results show that stock market return reacts differently to bad news and good news in the frontier market as well as provide supports for leverage effect in frontier stock market return. Overall results from the study suggest that good news impacts stock return volatility more than bad news of the similar weight. The results also suggest existence of stock return volatility clustering and leptokurtosis in the return distribution. These results provide basis for informed investment decision-making in frontier markets. An important implication of our results is that investors, analysts, brokers and dealers should be conscious of the nature of news filtering into the stock market as such information might improve their expected volatility forecast. More so, inclusion of asymmetric parameter to account for the effect of news in a volatility model would result in a better response to the impact of news on frontier market volatility than symmetric volatility models. In addition, frontier stock regulators could make effective policies to minimize negative consequences of volatility in the market by monitoring the nature of news filtering into the stock market.
Footnotes
Declaration of Conflicting Interests
The authors declared no potential conflicts of interest with respect to the research, authorship and/or publication of this article.
Funding
The authors received no financial support for the research, authorship and/or publication of this article.