



Abstract
This article examines the role of cognitive ability or intelligence on slave exports from Africa. We test a hypothesis that countries which were endowed with higher levels of cognitive ability were more likely to experience lower levels of slave exports from Africa probably due to comparatively better capacities to organize, co-operate, oversee and confront slave traders. The investigated hypothesis is valid from alternative specifications involving varying conditioning information sets. The findings are also robust to the control of outliers.
Keywords
Introduction
This study investigates the linkage between cognitive ability in terms of intelligence and slave export intensity 1 from Africa. It is premised on the hypothesis that nations with comparatively higher levels of cognitive ability are associated with lower levels of slave trade. The positioning of this inquiry is fundamentally motivated by gaps in the empirical literature.
The contemporary empirical literature on the consequences of slavery from Africa has to the best our knowledge seen renewed interest with the work of Nunn (2008a). 2 Other studies within the same framework include Bezemer, Bolt, and Lensink (2014), Nunn (2008b, 2010), Philippe (2010), Dell (2010), Nunn and Wantchekon (2011) and Whatley and Gillezeau (2010, 2011a, 2011b). Nunn (2008a) has investigated the concern of whether Africa’s current underdevelopment can be elucidated by the slave trade. The author has used data from historical documents reporting slave ethnicities and shipping records to estimate the numerical value of slaves exported from African countries during the slave trade era. He has established a negative nexus between the number of exported slaves and contemporary economic performance. Hence, slave trade has had a negative effect on Africa’s economic development.
In another study, Nunn (2008b) has positioned an inquiry by building on some well-established non-contemporary literature. It is important to note that a strand of literature on United States (US) slavery that has been conducted since Conrad and Meyer (1958, 1964) began their studies in the economics of US slavery. On the one hand, a nation’s past reliance on slave labour was a crucial determinant of its subsequent economic development among former New World colonies. On the other hand, plantation agriculture specialization with its use of slave labour led to economic inequality that resulted in a concentration of power among a small elite, therefore deteriorating economic institutions that were imperative for sustained economic development. After testing the underlying arguments across counties and states in the USA and former New World Economies, Nunn (2008b) has concluded that the use of slaves is negatively linked to subsequent economic development.
Dell (2010) has used regression discontinuity to assess the long-term effect of the ‘Mita’: a form of extensive forced labour system of mining in Bolivia and Peru between 1573 and 1812. The findings have shown that the Mita effect decreases consumption in households by about 25 per cent and positively influences stunted growth in children by about 6 per cent in subjected districts. The author has used data from various sources to trace mechanisms of institutional persistence in order to establish that the Mita’s influence has endured via its effects on public goods provision and land tenure. Accordingly, while historically Mita districts were characterized by lower educational attainment and low levels of ownership of large pieces of land, today the economic situation is still almost the same because residents are considerably more likely to be farmers of subsistence. Moreover, the concerned districts are less integrated into networks of roads.
Whatley and Gillezeau (2010, 2011a) have argued that trading of slaves emphasized the incentive to distinguish outsider from insider and constrained the geographic scope of political authority. They have established a positive nexus between the restricted geographic scope of twentieth-century ethnic groupings and the number of slaves leaving the African West coast. In a latter study, Whatley and Gillezeau (2011b) have investigated the evolutionary processes that were facilitated by encounters of the indigenous African population with colonial powers. They have examined the main effect of slave trade in African economies and argued that trade can be perceived as a perverse instance of the resource curse. The impact of slave trade on Africa is assessed by looking into the nexus between slave exports and slave demand. The line of inquiry also describes circumstances under which slave trade reduced state size and increased ethnic and social stratifications.
Bezemer et al. (2014) have assessed the long-run effect on politico-economic development from African indigenous slavery systems. Using data gathered from records of anthropology, the authors establish that indigenous slavery is negatively and robustly linked to contemporary income levels, but not to income levels in the period immediately following Independence. One channel via which non-contemporary indigenous slavery has impeded contemporary development is by deteriorating contemporary good governance in Africa.
Unfortunately, to the best our knowledge, the bulk of interesting literature has not sufficiently engaged the emergence and expansion of the phenomenon of slave exports (e.g., Nunn, 2008a; Nunn & Puga, 2012). This article contributes to the existing literature by examining the role of cognitive ability on slave exports. In essence, we postulate a hypothesis that countries that were endowed with higher levels of cognitive ability were more likely to experience lower levels of slave exports. The hypothesis draws from the argument that countries that enjoy higher levels of cognitive ability or intelligence are also associated with citizens that are more organized probably due to their comparatively better abilities to co-operate (Kodila-Tedika, 2011). Such an organization can easily monitor activities of slave vendors and confront them accordingly. Nunn and Puga (2012) have demonstrated that ruggedness of landscape facilitated escape from slavery by some victims of slave exports. Normally, such escapes should also be facilitated by some form of intelligence. Moreover, there is some consensus in the fact that intelligent individuals are endowed with capacities which enable them to easily compromise and find solutions (Kodila-Tedika, 2011). Hence, it may be postulated that cognitive ability or intelligence is associated with lower levels of slave exports.
Given that this is an article that builds on historical evidence, it is relevant to provide some historical perspective that describes the issue being investigated in a historical context. Moreover, such a historical view is necessary to further articulate the genuine exploration of an economic line of inquiry. There is historical evidence with which it is possible to substantiate the hypothesis underpinning this article. Accordingly, in the 1700s, North America experienced substantial social unrest owing to slave trade. A direct consequence was the deportation of emancipated slaves (see Aptheker, 1944; Genovese, 1979). It is within this framework that comparatively intelligent slaves were thought to be instigators of resistance against the slave trade. As substantiated by Malowist (1999), African slaves exported to Portugal and other Spanish territories were exclusively employed in towns as domestic workers or for less intellectually qualified jobs. According to the narrative, the importation of slaves was more contingent on the slave’s manpower or physical ability, than on his/her intellect.
The first Maroon war in Jamaica in 1725 is a good illustration of the relevance of intelligence in slave trade, because slaves that were intelligent enough to escape and live autonomously in the mountains did so essentially because they thought they could live independently without masters. There was a similar revolt in Maryland and Virginia of the USA in the eighteenth century (Harris, 1999). These historical perspectives point to the fact that comparatively more intelligent slaves who were exported could cause revolts and resist their status as slaves. Hence, it is logical to postulate that as time went by, slave traders were more interested in slaves with good manpower but with less intellectual emancipation needed for calculated and strategic resistance. A slave trader with an experience in trading slaves who had been sufficiently intelligent to escape from his/her masters with the passage of time would have preferred exclusively slaves that were likely to be less stubborn to their masters, once traded. More recently, intelligence has been established to affect economic diversification (Kodila-Tedika & Asongu, 2018).
Data and Methodology
Data
The dependent variable is slave exports. It consists of the estimated number of exported slaves from Africa between 1400 and 1900. It is obtained from Nunn (2008a, 2008b). The data are built by linking shipping data from a plethora of historic documents presenting the ethnicities of slaves that were shipped from Africa during the investigated periodicity. After combining them, the author is able to estimate country-specific numbers of slaves that were shipped from the African continent during the period between 1400 and 1900: a period covering Africa’s four slave trade episodes. As explained above, we proceed by normalizing export figures by the land surface area of a country. Since, a certain number of countries do not have slave exports, the natural logarithm of one, plus the number of exported slaves per thousand square kilometres, is used (Nunn, 2008a, 2008b).
The independent variable of interest or cognitive ability is measured with the historic intelligence quotient (IQ). This variable has been employed in recent intelligence literature, notably Lynn (2012) and Danielle (2013). It is measured as the ‘national average intelligence quotients of populations, including estimates of indigenous populations for the colonized countries’ (Danielle, 2013, p. 31). IQ within the framework of this study is a number that represents a person’s reasoning ability, computed using tests that are problem-solving oriented, as compared to the average age of the person or statistical norm. Danielle exclusively uses two intelligence measures, namely: the IQ and historic IQ. We use the latter or historic IQ because it is more consistent with non-contemporary phenomena (e.g., slave trade). Whereas there are different types of intelligence (naturalist, musical, logical-mathematical, existential, interpersonal, bodily kinesthetic, linguistic, intra-personal and spatial), this study assumes that most types of intelligences are captured by the IQ. The reasoning-orientation and ‘problem solving’ inclination underlying the IQ can be leveraged to avoid capture during slave trade.
The ‘population density in 1400’ variable is constructed using estimates of historic population from McEvedy and Jones (1978). For countries that are grouped with other nations in Mc Evedy and Jones, population is allocated to the nations according to the 1950 population distribution from the United Nations (2007). The total population in 1400 is normalized with each country’s land area and computed as described above. Given that the variables are considerably left skewed and because the area covered by a number of countries today was characterized with zero population density in 1400, a natural logarithm of one plus the population density, computed as people per square kilometre, is used.
‘Tech1500’ is an index denoting the adoption of military, agricultural and communications technologies, inter alia. It is borrowed from Easterly, Comin, and Gong (2010). ‘Year since Neolithic Transition’ refers to ‘the number of thousand years elapsed as of the year 2000’ since earliest date recorded of a region located within the national borders of a nation that underwent the transition to primary reliance on livestock and cultivated crops from primary reliance on hunting. This indicator compiled by Putterman (2008) was computed using a plethora of both country- and regional-specific archaeological studies, in addition to encyclopaedic works of more general nature on the Neolithic transition to agriculture from gathering and hunting. More information on methodological assumptions and data sources used in the construction of the variable is available on the website of the Agricultural Transition Data Set.
‘Biogeographic conditions’ refer to the first principal component of the number of prehistoric domesticable animal species and plant species, computed with the help of a methodology proposed by Olsson and Hibbs (2005). It is interesting to note that Angeles (2011) has insisted on the crucial role that technology and biogeography play in the elucidation of slavery.
‘Statehist’ is an index denoting the presence of supra-tribal governments between 1CE and 1500
‘Mean ruggedness’ is the mean value of an index on landscape ruggedness, relative to hundreds of meters above the sea level for a nation. It is calculated using geospatial surface undulation indicators based on a one degree resolution form the Geographically based Economic data (G-Econ) project (Nordhaus, 2006), which depends on more spatially disaggregated elevation variables from New, Lister, Hulme, and Makin (2002) at a 10 minutes resolution. The grid cell-level measurement of ruggedness is consolidated up to national level by averaging across the grid cells that are located within the borders of a country. More insights into the computation can be found on the website of the G-Econ project. This variable has been employed in the slave trade literature (see Nunn & Puga, 2012).
The landlock dummy measures whether a country is landlocked and it is determined by the Central Intelligence Agency (CIA) World Fact book using the coastline length of a country. This indicator has been substantially employed to control for the unobserved heterogeneity in African development literature (Asongu, 2012, 2015; Asongu, Tchamyou, Asongu, & Tchamyou, 2017; Asongu, Tchamyou, Minkoua, Asongu, & Tchamyou, 2018).
‘Absolute latitude’ represents the measurement of latitude in terms of degrees of a country’s approximate geodestic centroid as shown by the CIA World Fact book. Acemoglu, Johnson, and Robinson (2001) have articulated the role of geography in African development literature. It is notably for this underlying reason that we are also accounting for other geographic variables in this study. Table A1 provides the summary statistics. The correlation matrix is disclosed in Table A2. And the ‘list of countries’ is presented in Appendix.
It is important to note that there are two main measurement errors associated with Nunn’s slave trade data. First, there is a questionable assumption that slaves shipped from one coast within a country are either from countries directly in the interior or from the country that is opened to the sea. Unfortunately, some slaves shipped from the coast of one country could have been from neighbouring countries: either costal and/or landlocked countries. Second, another concern about measurement error is motivated by the fact that in the ethnicity samples, slaves from landlocked countries are likely to be underrepresented. This is essentially because the ethnicity samples used for the computation of the slave trade data encompass exclusively the slave population that survived the voyage journeys from the African continent. Accordingly, everything being equal, voyage survival is a negative function of the distance to the coast. Given the high rate of mortality during the slave trade, this second measurement error is also important. Whereas the two underlying measurements are relevant, Nunn (2008a) has demonstrated empirically that they do not significantly bias the slave trade data.
Methodology
Consistent with recent development (Asongu, 2013) and intelligence or cognitive ability (Kodila-Tedika & Asongu, 2015a, 2015b) literature, the specification in Equation (1) examines the correlation between cognitive ability and slave exports.

where, SEi (CAi) represents a slave exports (cognitive ability) indicator for country i,α1 is a constant, C is the vector of control variables, and εi the error term. CA is the cognitive ability variable while C entails: population density in 1400; Tech1500; biogeographic conditions; Statehist; mean ruggedness, landlock dummy, absolute latitude and ‘year since Neolithic transition’. In accordance with the underlying cognitive ability literature, the purpose of Equation (1) is to estimate if cognitive ability affects slave exports. The estimation process is by ordinary least squares (OLS) with standard errors that are corrected for heteroscedasticity.
Empirical Results
Table 1 presents the empirical results based on OLS. The following findings can be established. The investigated hypothesis is confirmed because historic IQ is negatively correlated with the dependent variable or slave exports. This negative nexus is robust to alternative specifications and the employment of varying conditioning information sets to control for a plethora of historical, cultural and geographic variables. Most of the significant control variables have the expected signs. Population density in 1400 is negatively correlated with the dependent variable. This is essentially because the area covered by a number of countries today was characterized with zero population density in 1400 (McEvedy & Jones, 1978; United Nations, 2007). The European descent variable is positively correlated with the slave exports because Europeans significantly contributed to slave trade (Acemoglu, Johnson, & Robinson, 2005). The Tech1500 index is intuitively supposed to be positively correlated with the slave exports because it denotes the adoption of military, education, agricultural and communication technologies that are most likely to positively influence openness and trade activities (Comin, Easterly, & Gong, 2010; Tchamyou, 2017, 2018; Tchamyou & Asongu, 2017).
Ordinary Least Squares (OLS) Estimations
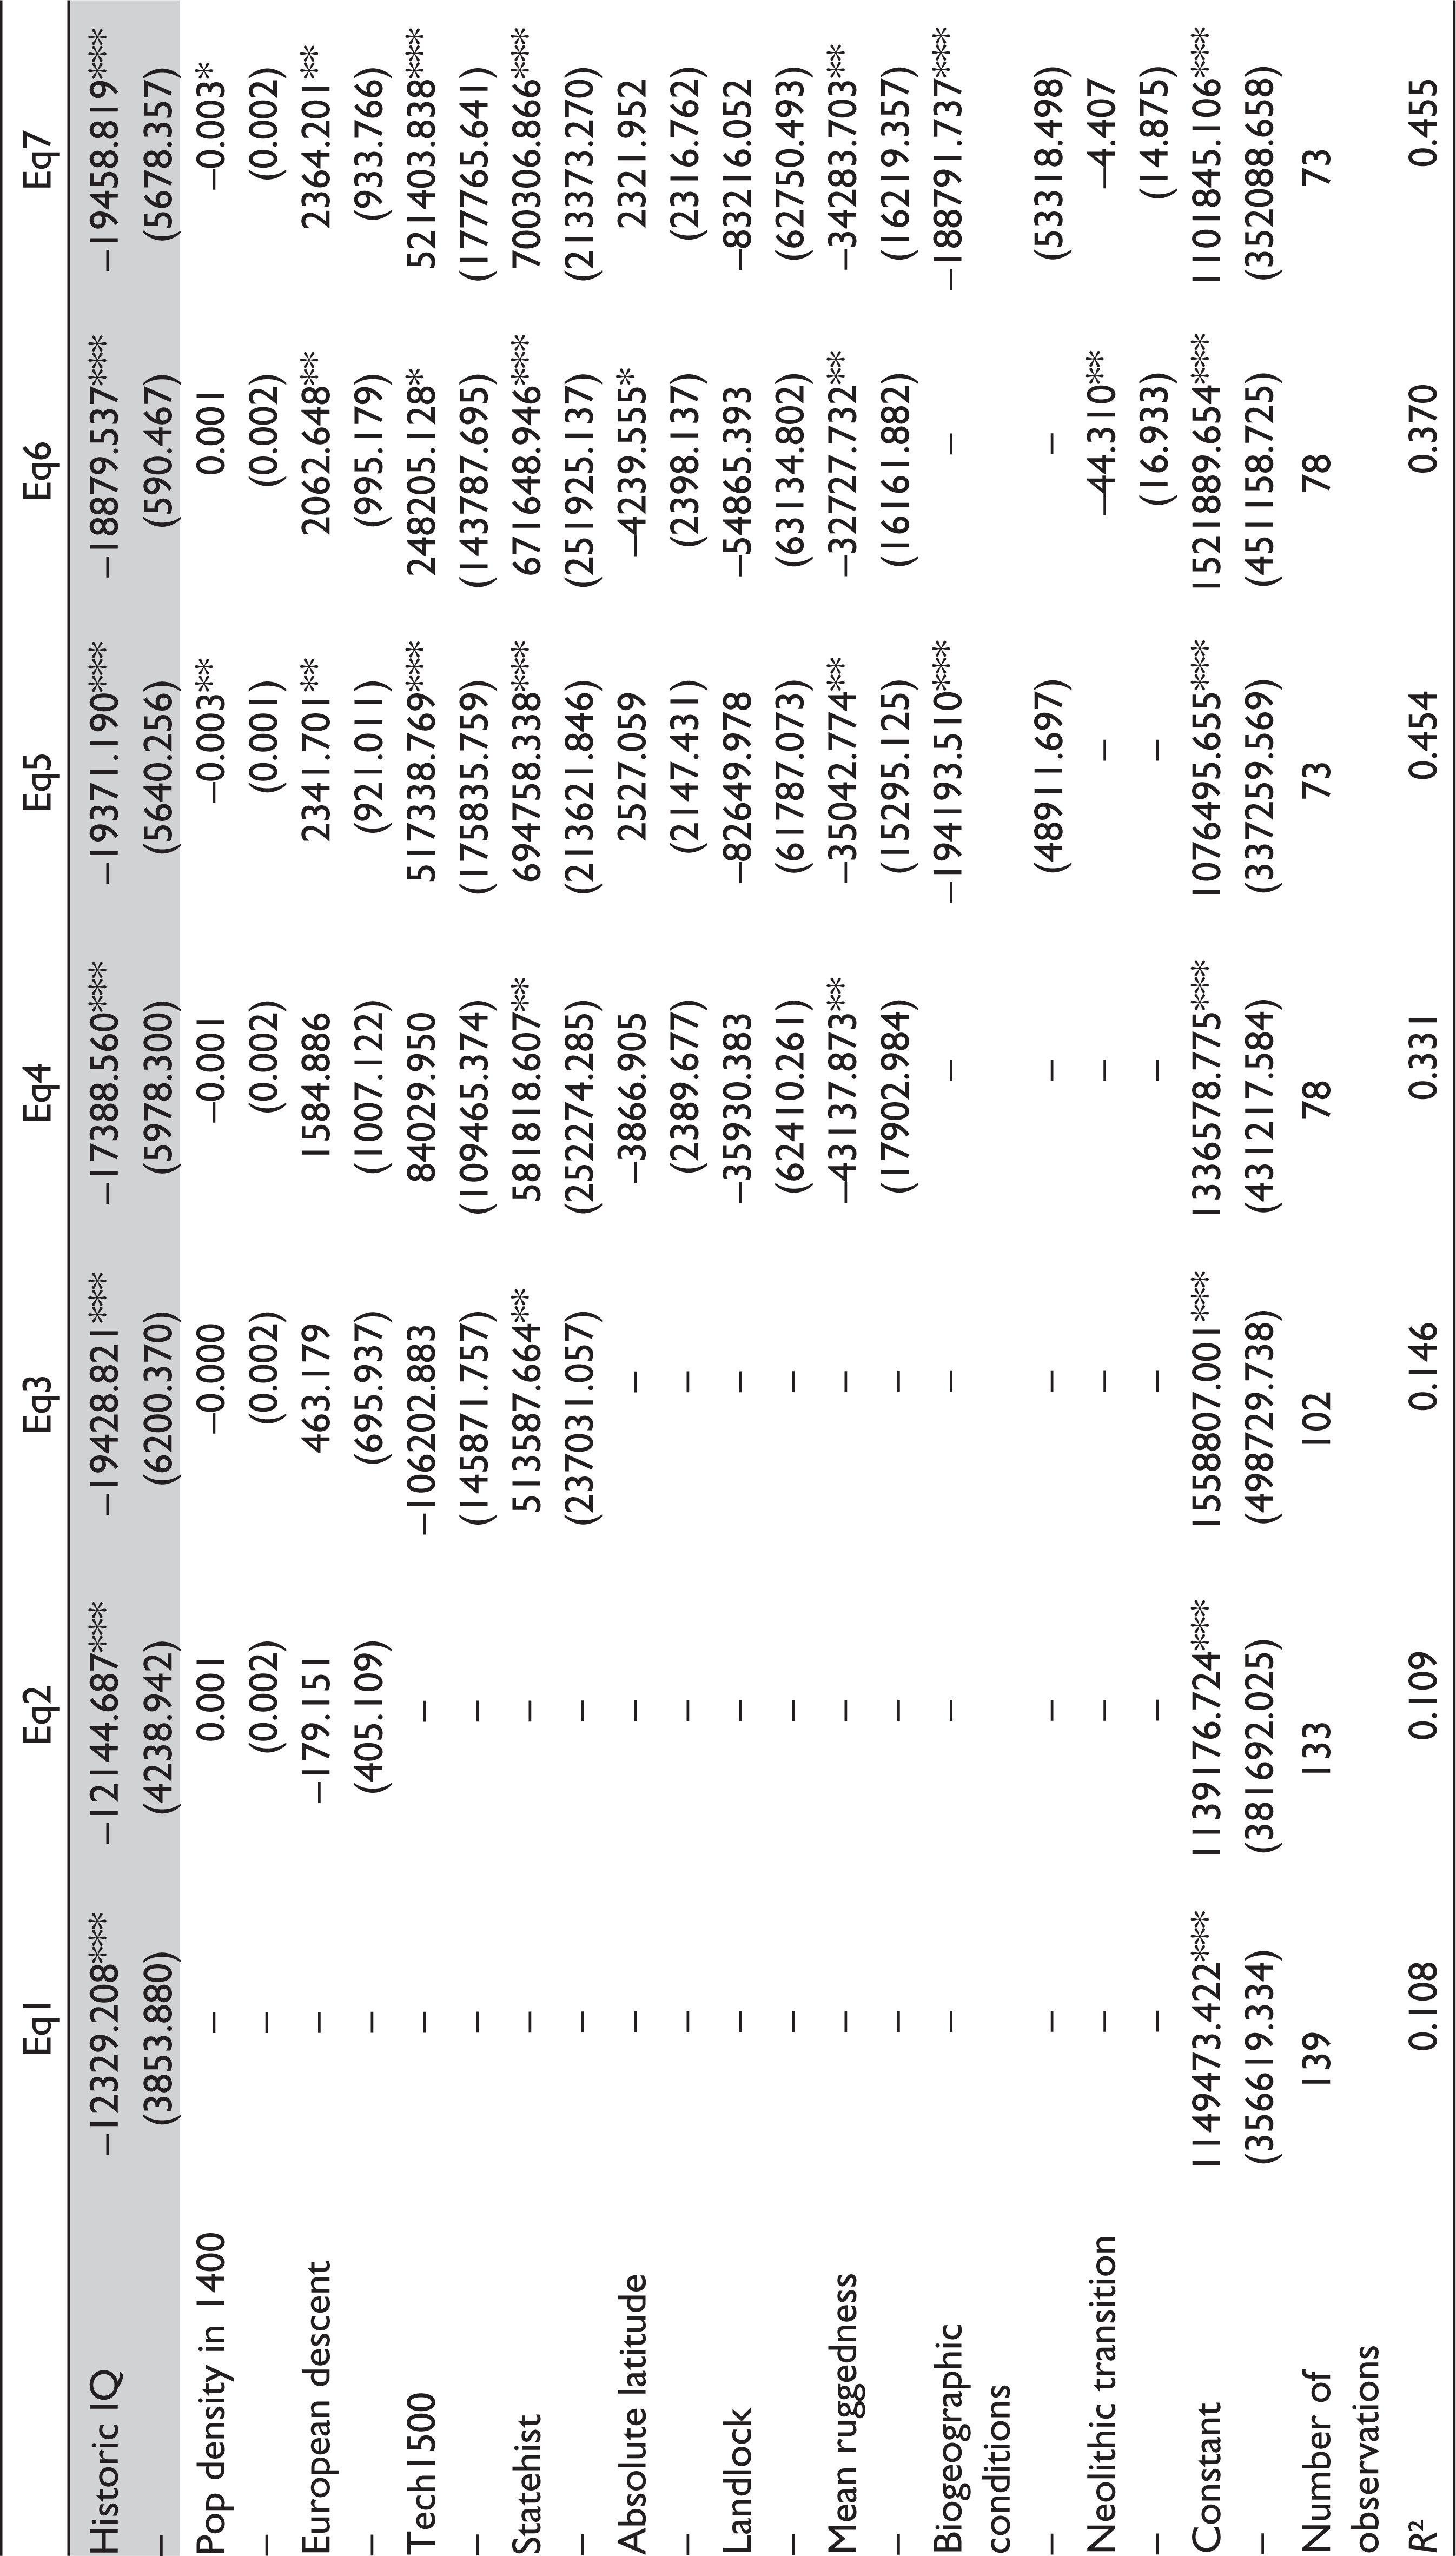
The variable ‘Statehist’ that denotes the presence of supra-tribal government is positive, most likely because chiefs and kings played a critical role in aiding slave exporters. Such assistance fundamentally consisted of capturing potential slaves and putting them at the disposal of slave exporters (Smith, 2009). Logically, the sign of latitude is expectedly negative because trading of slaves was largely centred on the Equator of Africa. Hence, export intensity decreases as one moves either North towards the Arctic Circle or South towards the Antarctic Circle. While landlocked countries were most likely to be negatively correlated with the dependent variable because the predominant means of transportation was shipping, the expected sign is not significant. 3
Consistent with Nunn and Wantchekon (2011), ‘terrain ruggedness’ was a negative factor in slave trade, since it facilitated escapes and local resistance. African biogeographic conditions have been documented to have severely handicapped its economic development (Angeles, 2011, p. 37). These include: trade, inter alia. The number of years since the ‘Neolithic transition’ is negatively related to slave trade probably because, with growing civilization, human beings become increasingly aware of the need to treat people equally, irrespective of the colour of their skin.
It is important to note that the estimated coefficients corresponding to the independent variable of interest change in terms of magnitude with variations in the conditioning information set or control variables. Such changes in size are traceable to the meaningfulness of the variables in the conditioning information set, to the effect of the independent variable of interest or Historic IQ on the dependent variable. Such meaningfulness is apparent because the additional variables in the conditioning information set influence the residual variance. When they reduce the residual variance, there is an improved power and precision. For example, when all variables except Historic IQ are omitted, the size of the IQ coefficient is 37 per cent higher relative to the unconstrained model in the first specification. Moreover, the coefficient of determination is also about four times higher in the last specification, compared to the first specification. It follows that historic and economic characteristics selected for the conditioning information set influence how intelligence affects slave export intensity. In other words, the negative responsiveness of slave export to intelligence is contingent on whether specific historic and economic factors are considered in the modelling exercise.
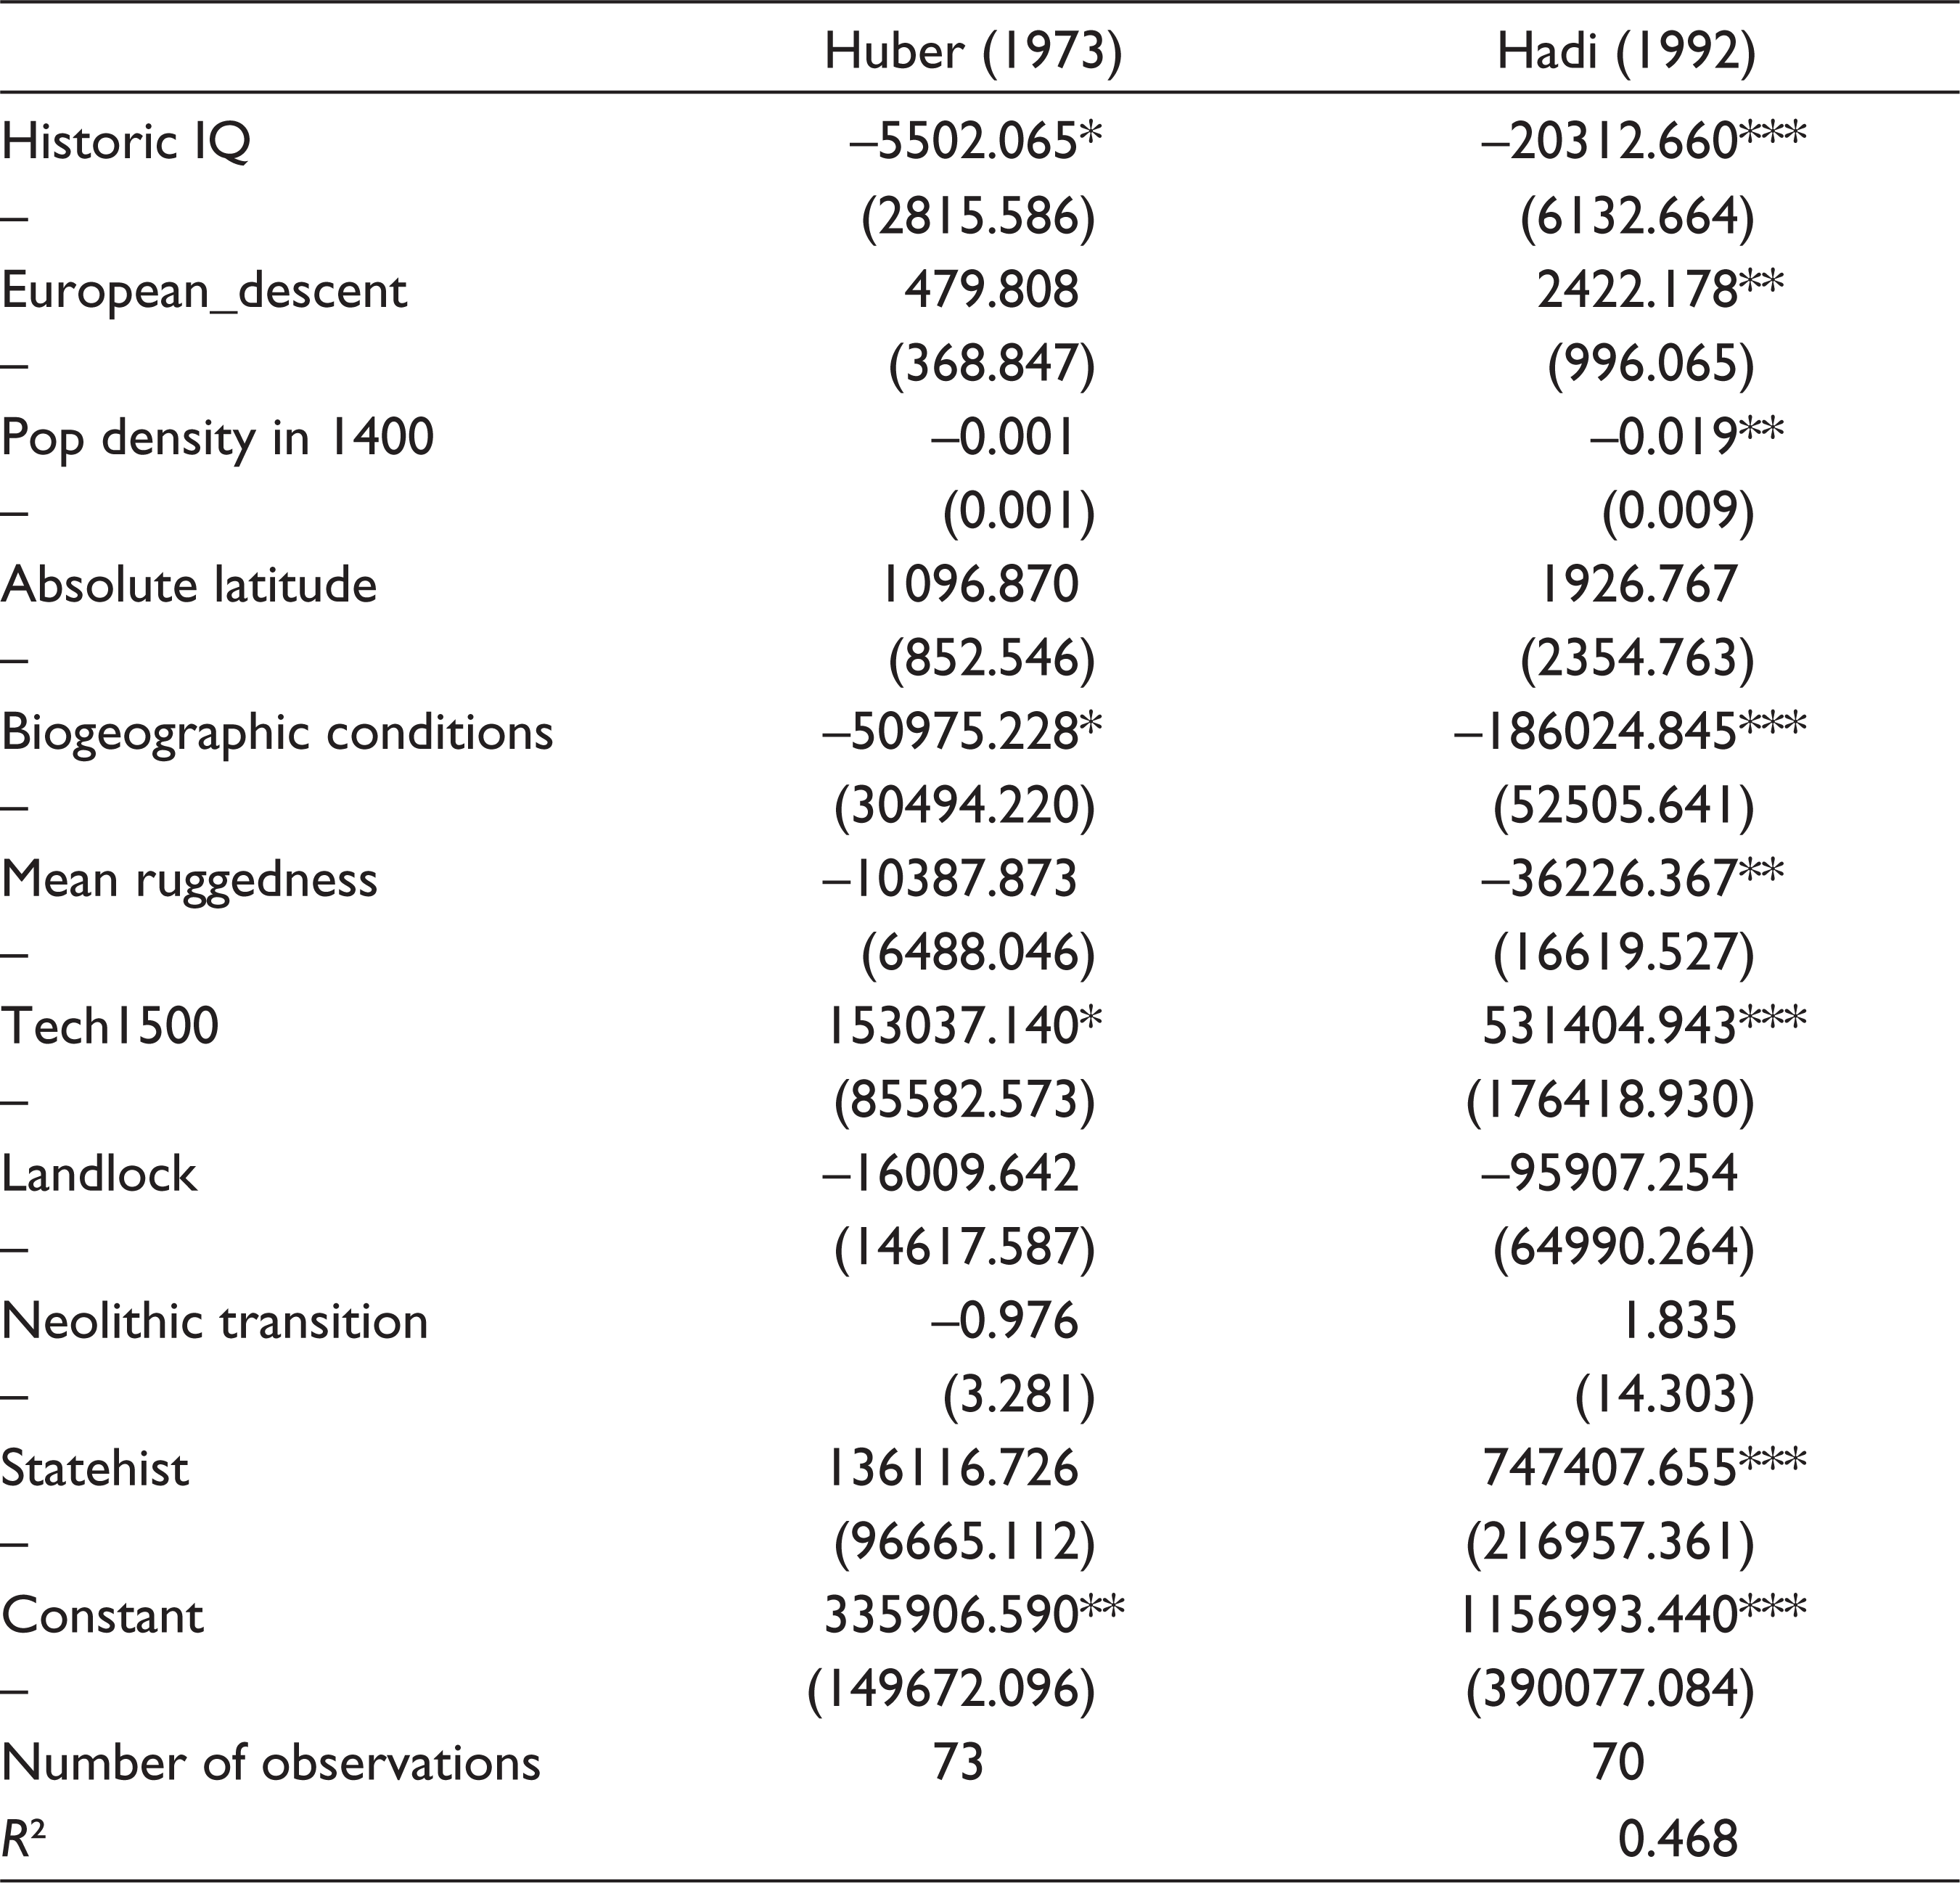
Consistent with Kodila-Tedika and Asongu (2015c), we check for the efficiency and robustness of our findings by controlling for outliers. To this end, two main empirical approaches are employed from Huber (1973) and Hadi (1992). The first empirical approach from Huber consists of using iteratively reweighted least squares. Midi and Talib (2008) have emphasized that compared to OLS, this estimation technique has the advantage of supplying robust estimators. This is essentially because it simultaneously resolves issues arising from the presence of outliers and heteroscedasticity or non-constant error variances. The findings are presented in the first column of Table 2. In the second column, the technique by Hadi is employed to detect outliers. Hence, outlier countries are detected and excluded accordingly, notably: China, India and Japan. The negative relationship between cognitive ability and slave exports is confirmed. Moreover, the significant control variables have the expected signs.
Controlling for Outliers
Conclusion
The contemporary literature has not comprehensively covered the emergence and expansion of the phenomenon of slave exports from Africa (e.g., Nunn, 2008a; Nunn & Puga, 2012). This article contributes to the existing stream by examining the role of cognitive ability on slave exports from Africa. We postulate and justify a hypothesis that countries that are endowed with higher cognitive ability are more likely to experience lower levels of slave exports probably due to relatively better abilities to organize, corporate, oversee and confront slave vendors. Our findings with alternative specifications involving varying conditioning information sets confirm the investigated hypothesis. The findings are also robust to the control of outliers.
The findings are broadly consistent with Kodila-Tedika (2011) on the postulation that countries enjoying higher cognitive ability levels in terms of intelligence are relatively more organized by virtue of their abilities to co-operate more effectively. According to the strand of studies, such an organization can: easily oversee and tackle the activities of slave vendors; find solutions and compromises; and facilitate escapes from slavery. Moreover, this study has assumed that most types of intelligences are captured by the IQ. Hence, the reasoning- orientation and ‘problem solving’ inclination underlying the IQ can be leveraged to avoid capture during slave trade. The extant literature on the subject can be improved by empirically investigating channels via which intelligence or cognitive ability reduces slave exports. These are beyond the scope the present inquiry and thus evidently ample room for future research.
A major caveat is this study is the issue of reverse causation that is not adequately addressed. Accordingly, it is conceivable that African cognitive ability led to slave exports, but it is also conceivable that current and lagged slave exports reflected cognitive ability. Clarifying this caveat could also be an interesting line of future inquiry.
Declaration of Conflicting Interests
The authors declared no potential conflicts of interest with respect to the research, authorship and/or publication of this article.
Funding
The authors received no financial support for the research, authorship and/or publication of this article.
List of Countries
Afghanistan; Angola; Albania; United Arab Emirates; Argentina; Australia; Austria; Belgium; Benin; Burkina Faso; Bangladesh; Bulgaria; Bosnia and Herzegovina; Belarus; Belize; Bolivia; Brazil; Bhutan; Botswana; Central African Republic; Canada; Switzerland; Chile; China; Cote d’Ivoire; Cameroon; Congo; Colombia; Costa Rica; Cuba; Czech Republic; Denmark; Algeria; Ecuador; Egypt; Spain; Estonia; Ethiopia; Finland; Fiji; France; Gabon; United Kingdom; Germany; Ghana; Guinea; Guinea-Bissau; Equatorial Guinea; Greece; Guatemala; Guyana; Hong Kong; Honduras; Croatia; Hungary; Indonesia; India; Ireland; Iran; Iraq; Israel; Italy; Jordan; Japan; Kazakhstan; Kenya; Cambodia; Republic of Korea; Laos; Lebanon; Liberia; Libya; Lesotho; Lithuania; Latvia; Morocco; Republic of Moldova; Madagascar; Mexico; Macedonia; Mali; Malta; Myanmar; Mongolia; Mozambique; Mauritania; Malawi; Malaysia; Namibia; Niger; Nigeria; Nicaragua; Netherlands; Norway; Nepal; New Zealand; Oman; Pakistan; Panama; Peru; Philippines; Papua New Guinea; Poland; Portugal; Paraguay; Romania; Russian Federation; Saudi Arabia; Sudan; Senegal; Sierra Leone; El Salvador; Somalia; Singapore; Serbia; Suriname; Slovakia; Sweden; Swaziland; Syria; Chad; Thailand; Tajikistan; Turkmenistan; Tonga; Tunisia; Turkey; United Republic of Tanzania; Uganda; Ukraine; Uruguay; United States; Uzbekistan; Venezuela; Vietnam; Yemen; South Africa; Congo Democratic Republic; Zambia and Zimbabwe.
Footnotes
Acknowledgements
The authors are indebted to the editor and reviewers for constructive comments.
Appendix
Correlation Matrix

| Absolute latitude | 1 | – | – | – | – | – | – | – | – | – | – |
| Statehist | 0.52 | 1 | – | – | – | – | – | – | – | – | – |
| Slave exportation | –0.28 | 0.01 | 1 | – | – | – | – | – | – | – | – |
| Historic IQ | 0.72 | 0.64 | –0.39 | 1 | – | – | – | – | – | – | – |
| Biogeographic Conditions | 0.84 | 0.65 | –0.30 | 0.70 | 1 | – | – | – | – | – | – |
| Mean ruggedness | 0.20 | 0.32 | –0.24 | 0.33 | 0.22 | 1 | – | – | – | – | – |
| Neolithic Transition | 0.50 | 0.66 | –0.19 | 0.55 | 0.75 | 0.27 | 1 | – | – | – | – |
| Landlocked | –0.04 | –0.15 | –0.02 | –0.21 | –0.15 | 0.11 | –0.20 | 1 | – | – | – |
| Tech1500 | 0.69 | 0.73 | –0.11 | 0.68 | 0.85 | 0.19 | 0.74 | –0.14 | 1 | – | – |
| European_descent | 0.73 | 0.24 | –0.28 | 0.68 | 0.62 | 0.16 | 0.32 | –0.10 | 0.43 | 1 | – |
| Pop density in 1,400 | 0.06 | 0.31 | –0.07 | 0.21 | 0.07 | 0.08 | 0.41 | –0.14 | 0.25 | –0.13 | 1 |