




Abstract
In this study, we examined the impact of crypto assets on the risk-return characteristics of portfolios consisting of traditional assets. First, we examined the optimal portfolio for maximising the Sharpe ratio and found that the Sharpe ratio improves when CMC Crypto 200 Index (CMC) are incorporated to a certain extent into a portfolio consisting of traditional stocks, bonds and commodity indices. In addition, we focused on individual assets comprising crypto assets instead of CMC and incorporated individual crypto assets into a portfolio of conventional traditional assets and found that the Sharpe ratio improved for the majority of individual crypto assets. This is an interesting result as it indicates that crypto assets may contribute to improving the risk-return characteristics of the portfolio. Second, we examined the optimal portfolio for minimising volatility and found that the percentage of crypto assets held was small. This may be due to the fact that the volatility of crypto assets is higher than that of other assets. In this sense, investing in cryptocurrencies is not suitable for investors who want to keep volatility low.
Introduction
Crypto assets have a short history, with numerous crypto assets having been created in less than 20 years since Nakamoto invented Blockchain in 2008. Central banks are also considering issuing their own digital currencies (CBDC, central bank digital currency), and this is becoming more active in many countries (Agur et al., 2019; Yanagawa & Yamaoka, 2019). Originally, central banks in various countries had been studying CBDC, but the announcement of the crypto asset libra initiative by Facebook in June 2019 triggered rapid progress in March 2022, US President Biden signed an executive order on crypto assets (virtual currencies). By doing so, crypto assets are becoming increasingly important as central banks begin to examine the challenges of issuing digital currencies (CBDCs) (so-called digital dollars).
In the research field, there have been numerous discussions on crypto assets, including their benefits and issues to consider, as many crypto assets, such as Bitcoin, have different characteristics than traditional assets (Chuen, 2015).
Among the discussions on crypto assets, one major debate is the optimal portfolio for investing in crypto assets. For example, Burniske and White (2017) point out that Bitcoin has unique asset class characteristics that differentiate it from other assets and make it a potential investment asset. When crypto assets are actually considered for investment, the usual approach is to incorporate crypto assets into a portfolio consisting of several traditional assets, rather than a portfolio consisting of only several crypto assets.
Ma et al. (2020) analysed the effect of adding crypto assets to traditional assets (stocks, bonds, etc.) using Markowitz’s (1952) Mean-Variance Framework for the period November 2015 to November 2019 and they reported that there has been an effect of incorporating crypto assets into portfolios consisting of traditional assets. As mentioned earlier, central banks began to actively engage in digital currency initiatives around 2019, and these initiatives may have contributed to increased confidence in crypto assets and the revaluation of crypto assets as an investment asset. However, no study has yet analysed the risk and return characteristics of adding crypto assets to a portfolio consisting of traditional assets, focusing only on the period after 2019.
Many digital currencies as well as Bitcoin have been developed for crypto assets, and some studies have reported results using crypto asset indices. For example, Simon (2018) reports that CRIX represents the crypto asset market movements as an index of crypto assets. Chen & Hafner (2019) similarly use the CRIX to conduct their analysis on speculative bubbles. Recently, other indices for crypto assets have been developed besides the CRIX. Ajeesh et al. (2022) conducted an analysis using the CMC Crypto 200 Index (CMC), but there are still few analyses using indices other than the CRIX.
With the US Securities and Exchange Commission’s approval of exchange-traded funds (ETFs) incorporating crypto assets in January 2024, an environment is now in place for institutional investors to invest in earnest in the future.
According to an article in Economic Times, the launch of ETFs for crypto assets has strengthened the liquidity and stability of the market and is attracting growing interest from institutional investors.
The study has two main objectives: one is to analyse the effect of adding crypto assets to a portfolio composed of traditional assets, focusing on the period after 2019, when central banks have begun to become more active in digital currencies. The second is to analyse the impact on portfolio characteristics when crypto assets are included in the investment universe using the CMC Crypto 200 Index (CMC), which has been the focus of attention for the past few years. This is the first article that satisfies those two points of focus, and our research contributes in those respects.
In this study, we examined the impact of crypto assets on the risk-return characteristics of portfolios consisting of traditional assets. First, we examined the optimal portfolio for maximising the Sharpe ratio and found that the Sharpe ratio improves when CMCs are incorporated to a certain extent into a portfolio consisting of traditional stocks, bonds and commodity indices. In addition, we focused on individual assets comprising crypto assets instead of CMCs and incorporated individual crypto assets into a portfolio of conventional traditional assets and found that the Sharpe ratio improved for the majority of individual crypto assets. This is an interesting result as it indicates that crypto assets may contribute to improving the risk-return characteristics of the portfolio. Second, we examined the optimal portfolio for minimising volatility and found that the percentage of crypto assets held was small. This may be due to the fact that the volatility of crypto assets is higher than that of other assets. In this sense, investing in cryptocurrencies is not suitable for investors who want to keep volatility low.
In the next section, we will discuss prior research, followed by a description of the analytical methodology, data and results. Finally, we provide a summary and future issues.
Thesis Statement
Institutional investors tend to diversify their investments across a wide range of assets (OECD, 2023). In this study, we analyse representative assets in asset management; Chuen et al. (2018) use S&P 500, PE (Private Equity), Real Estate Investment Trusts (REITs), Commodities (GSCI Index) and Gold as representative assets. However, bonds, the most common traditional asset, are not included in the investment universe. Therefore, we will analyse using representative indices for each of the six assets, S&P 500, PE, REITs, Commodities (GSCI Index) and Gold, plus a bond index (S&P 500 Bond), while referring to Chuen et al. (2018). The assets used in this analysis are listed in Table 1. Table 1 shows the assets used in this analysis. Data was obtained from Yahoo Finance except for PE, and for PE, the S&P Listed PE Index was obtained from S&P’s website.
Indices Used in this Analysis.
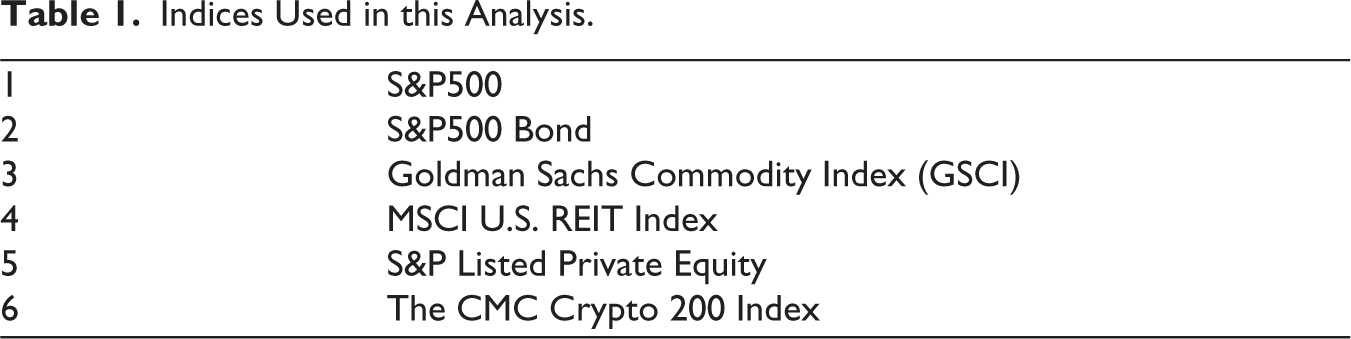
In this analysis, the CMC Crypto 200 Index (CMC) is used as an indicator of crypto assets. The index is one of the leading indices for crypto assets and is calculated as a market value-weighted average of the top 200 stocks by market capitalisation. The CMC data was obtained from Yahoo Finance. The CMC is provided by Solactive and was launched on 31 December 2018. The CMC will incorporate over 90% of the market capitalisation of the crypto asset market, making it an index that represents the movement of the crypto asset market 1 .
The period of analysis for this study is 1 January 2019 to 9 June 2022, and we use daily data of assets. As mentioned above, the reason for using data for the period after 2019 is that central banks began to actively engage in digital currency initiatives around 2019, and these initiatives may have contributed to an increase in confidence in crypto assets and a reevaluation of crypto assets as investment assets.
Also, we conducted our analysis using individual crypto assets and chose to use the five assets with the largest market capitalisation, which are BTC, BNB, ETH, ADA and XRP as of the end of June 2022. The data was obtained from Yahoo Finance.
The objective of this study is to identify the risk/return characteristics of portfolios that include crypto assets in three ways: indices, individual ones and combination or pairs of individual ones. Through portfolio analyses, such as 20,000 Monte Carlo simulations, CVaR analysis, we will examine the investment potential of crypto assets as an investment class, as well as the issues involved.
Previous Research
One of the important research topics on crypto assets is the discussion of optimal portfolios when investing in crypto assets. Past papers have divided the discussion into two main categories: one is to construct an optimal portfolio from crypto assets, and the other is to construct an optimal portfolio by incorporating crypto assets into traditional assets.
First, in a previous study of the former, Brauneis and Mestel (2019) applied the Markowitz mean-variance framework to evaluate portfolios of crypto assets, and found that market value over the period from 1 January 2015 to 31 December 2017. Using daily data for the top 500 crypto assets by total value, they analyse the risk and return of various mean-variance portfolio strategies and report the diversification benefits of incorporating multiple crypto assets into traditional assets.
Lorenzo and Arroyo (2023) used daily data from 1 January 2018 to 31 May 2021. They then used a clustering algorithm to reduce the number of crypto assets from over 500 crypto assets. The Markowitz mean-variance model was then refined and performance simulations were conducted for 17 months. The results show that the new proposal is effective and demonstrates the convenience of using machine learning methods.
There are several prior studies on the latter. Md et al. (2019) reported that the report analyses the relationship between Bitcoin and corporate bond indices and reports that the two have a low correlation, making Bitcoin an effective risk-hedging instrument. They also provide an analysis of the relationship between crypto assets and the stock market. Jana and Sahu (2023c) analysed the relationship between four global stock markets and six major cryptocurrencies. Specifically, they attempted an analysis using Asymmetric Dynamic Conditional Correlations Generalized Autoregressive Conditional Heteroskedasticity (ADCC-GARCH) and Wavelet Coherence Technique using daily data from 4 January 2017 to 28 February 2023. This study report that crypto assets (Bitcoin, Ethereum, Binance Coin and Dogecoin) act as hedges during periods of economic stability, but not during economic turmoil in the stock market. Jana et al. (2023) also analysed the relationship between major stock markets and cryptocurrencies using daily data from 25 July 2017 to 8 June 2022. Specifically, they conducted their analysis using ADCC-GARCH and Wavelet Coherence Technique, and then reported that most cryptocurrencies do not act as a hedge for stocks, and there does not seem to be a unified view on the existence of a relationship between crypto assets and stocks.
Some studies have also investigated the relationship between specific stock markets and crypto assets. Jana and Sahu (2023a) investigated the relationship between cryptocurrencies and the Indian stock market and conducted an empirical analysis using the wavelet approach on daily data from 6 October 2017 to 5 October 2022, and reported that in a healthy economic environment, cryptocurrencies are uncorrelated with the Indian stock market and that the dispersion effect should be functioning. Jana and Sahu (2023b) used daily data from 10 March 2015 to 26 August 2022. They analysed the relationship between cryptocurrencies and the Indian stock market before and during the financial crisis caused by COVID-19 and the Russia–Ukraine conflict using the DCC-GARCH model. The results show that there is a negative correlation between cryptocurrencies and Indian stocks before the financial crisis, indicating a dispersion effect. On the other hand, during the financial crisis period, they report a positive correlation between crypto assets and Indian stocks.
Since institutional investors basically diversify their investments across multiple assets, it would be meaningful to confirm the effect of adding crypto assets to stocks, bonds and other assets. For example, Andrianto and Diputra (2017) created an investment portfolio with foreign currencies, commodities, stocks, ETFs and crypto assets (Bitcoin, Ripple, Litecoin) using data from December 2013 to December 2016. The results report that cryptocurrencies improve the effectiveness of the portfolio.
Petukhina et al. (2021) investigated the effectiveness of adding crypto assets to a portfolio of traditional assets. Specifically, using data from 1 January 2015 to 31 December 2019 for 52 cryptocurrencies and 16 traditional assets, they constructed portfolios using rule-based investment methods (from classical Markowitz optimisation to more recent strategies that maximise portfolio diversification), measured performance and report on the potential diversification effects of adding crypto assets to a portfolio of traditional assets. In a recent study, Huang et al. (2023) investigated the effectiveness of adding crypto assets to portfolios of the S&P 500 and US bonds. Specifically, using weekly data through 25 December 2020, they added nine different categories of cryptocurrencies to a portfolio of S&P 500 and US 10-year government bonds. They analyse the results using the Bayes–Stein mode and report on the potential portfolio diversification benefits of adding crypto assets.
In terms of investment assets, Chuen et al. (2018) are close to our article. This article uses the S&P 500, PE, REITs, Commodities (GSCI Index) and Gold to analyse the effect of adding crypto assets. However, the difference with our study is that the data period in Chuen et al. (2018) is from 1 August 2014 to 27 March 2017 and does not include data for the period after 2019. Another major difference is that bonds are not included as investable assets.
Recently, some papers have analysed crypto asset indices. Trimborn et al. (2019) focuses on the relationship between crypto assets and the stock market, and uses CRIX as a proxy for crypto assets. Liu et al. (2021) conducted an analysis of the crypto asset index (CRIX) from July 2014 to April 2020, using both a mean-variance model and a CVaR approach. The results show that the inclusion of the crypto asset index CRIX in the portfolio of traditional assets can improve the effective frontier in the COVID-19 period. Ajeesh et al. (2022) conducted their analysis using the CMC Crypto 200 Index (CMC). However, there are few analyses using indices other than the CRIX 2 .
In summary, we find that while there are relatively many papers that examine the relationship between equities and crypto assets, there are few papers that examine the relationship between multiple traditional assets and crypto assets. Also, papers focusing on the period after 2019 are not found in prior studies. Furthermore, while there are several papers that use the CRIX as a crypto asset index, there are few papers that use the CMC index.
With these studies as background, the analysis in this study focuses on the impact of crypto assets on portfolio characteristics.
Analysis Method
First, daily returns were obtained for the crypto asset index (CMC Index) and the S&P 500, PE, REITs, Commodities (GSCI Index) and Gold, plus a bond index (S&P 500 Bond) for a total of six assets. Then, we check the return and risk characteristics, as well as the correlation between the CMC index and each asset.
Next, using Markowitz’s (1952) portfolio theory approach, we construct a portfolio consisting of traditional and crypto assets using a mean-variance and effective frontier approach. Markowitz’s method is a traditional approach and has been used in many prior studies that consider the inclusion of crypto assets in portfolios consisting of traditional assets. Although there have been some recent analyses using different approaches instead of Markowitz’s method due to issues such as liquidity of crypto assets, this study attempts to analyse crypto assets using the simplest method, Markowitz’s mean-variance and effective frontier approach.
The specific analysis method is to perform a Monte Carlo simulation to compare the investment ratio of each asset in the minimum variance portfolio and the portfolio with the maximum Sharpe ratio (Sharpe, 1966) when crypto assets are not included and when crypto assets are included. We analyse how the inclusion of crypto assets affects the risk-return performance of the portfolio.
Since the mean-variance model has an assumption that the data are in a standard normal distribution, but none of these financial assets have returns that meet the criteria, the risk is likely to be underestimated. Therefore, to improve the risk analysis results, this study will also use the Cornish–Fisher expansion method to obtain CVaR values and optimal portfolios at α = 0.05 confidence level.
Analysis Result
Statistical Analysis
Individual Stock Returns and Volatility.

We begin by reviewing the returns and risks (standard deviation) between the crypto asset index and the indices of the other assets. First, we obtain the historical daily returns for the Crypto Asset Index (CMC Index) and for each asset, and then we look at the annualised returns and risks: for the analysis period from 1 January 2019 to 9 June 2022, the Crypto Asset Index (CMC Index) has the highest return of 82.95%. This is followed by the GSCI, S&P 500, PE, REIT and S&P 500 Bond, which show the lowest returns in that order.
Next, the CMC has the highest volatility of 79.41%, followed by the REIT, PE, GSCI, S&P 500 and S&P 500 Bond, in that order. This analysis period included the COVID-19 Shock of March 2020, which caused prices in each market to fall sharply, resulting in most markets having a higher volatility than return, with CMC being the only market where return was higher than volatility. This suggests that crypto assets had higher returns relative to volatility than traditional assets such as stocks and bonds during the analysis period.
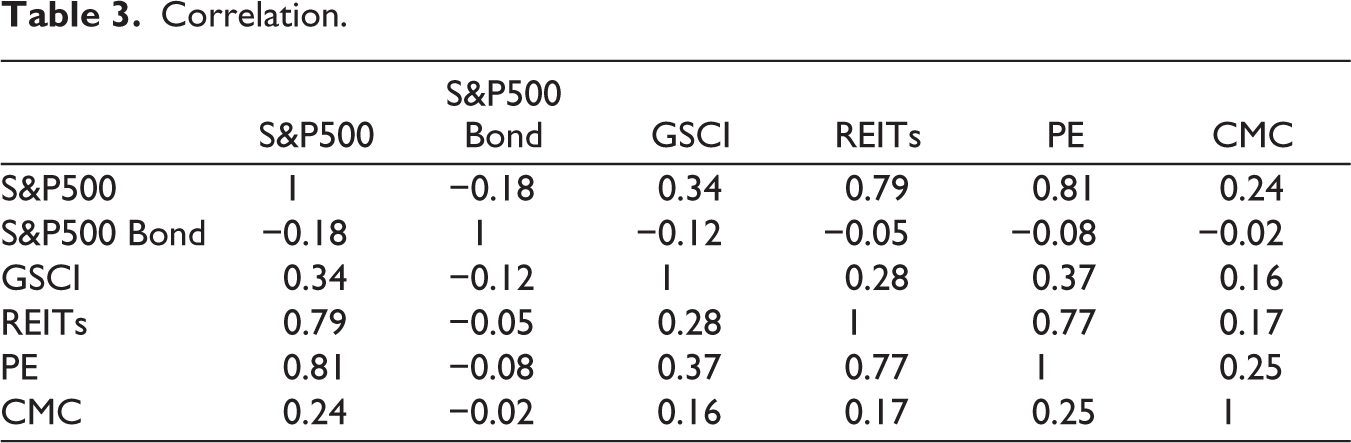
Next, we analyse the correlations between the crypto asset index and the indices of other assets. First, the highest correlation coefficient is between the PE and the crypto asset index (CMC index), which is low at 0.25, and then between S&P 500 and the crypto asset index (CMC index), which is also low at 0.24.
Next, looking at the correlation coefficients between the S&P 500 Bond, GSCI and REITs and the crypto asset index, the average values are −0.02, 0.16 and 0.17, respectively, indicating a low correlation. Therefore, it can be said that the inclusion of crypto asset indices as an alternative investment asset class indicates the possibility of increasing the risk diversification of the portfolio.
Correlation.
Portfolio Analysis
Analysis with the Crypto Asset Index
To see how the risk/return of the portfolio changes when a crypto asset index is included in portfolio.
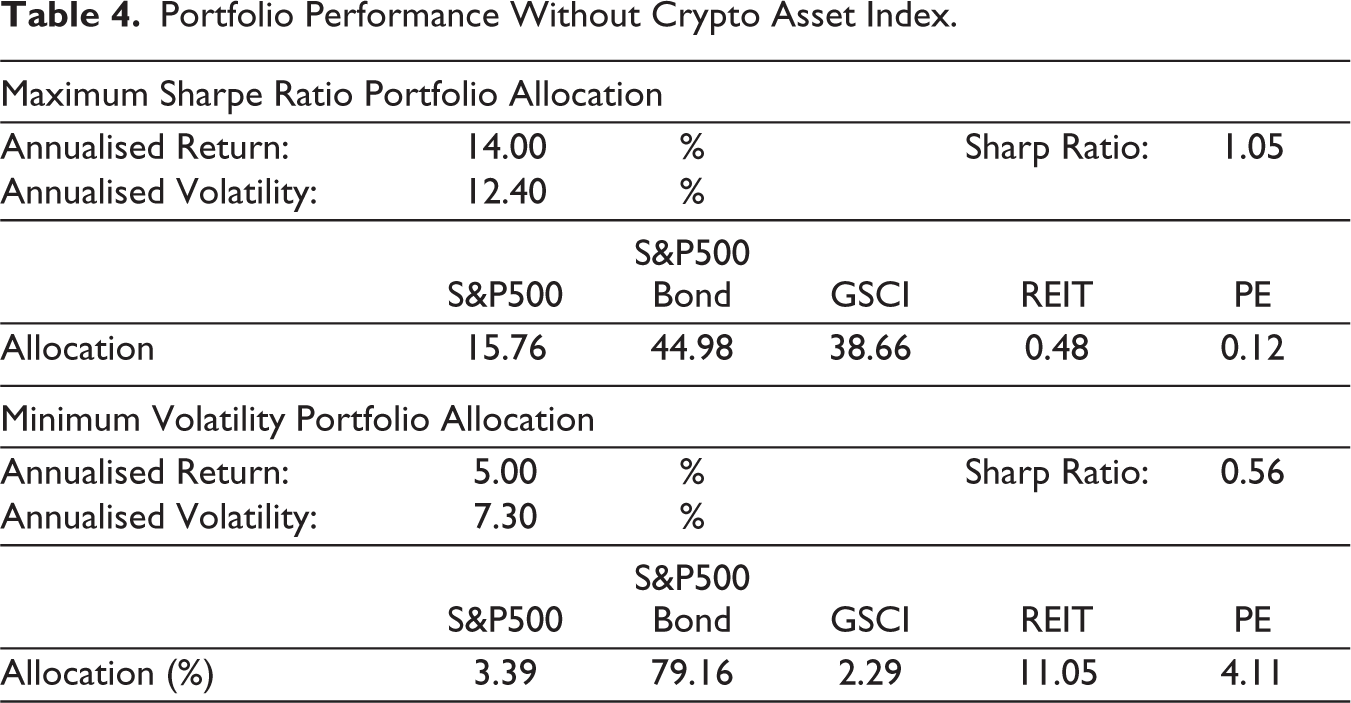
For this purpose, the analysis will be conducted in two patterns: one without crypto assets and one with crypto assets. Using the Markowitz portfolio theory approach, we constructed a portfolio consisting of each asset using the mean-variance and effective frontier approaches, and calculated the risk-return ratio when the Sharpe ratio is the maximum and when the annualised volatility is the minimum. The risk/return and the allocation weight of each asset shall be calculated.
First, Table 4 shows the portfolio without the crypto asset index. It can be seen when the Sharpe ratio is maximised, about half of the portfolio is composed of bonds (S&P 500 Bond), which have both low return and low volatility, and stocks (S&P 500) and commodities (GSCI), which have both high return and high volatility. When volatility is at a minimum, most holdings are in bonds (S&P 500 Bond), resulting return lower than volatility, which in this case, diversification does not affect.
Portfolio Performance Without Crypto Asset Index.
Next, Table 5 shows the portfolio performance with the crypto asset index. For optimal maximum sharp ratio portfolio, the Sharpe ratio is higher than when the crypto asset index is not incorporated. The portfolio asset allocation shows that the optimal portfolio has less than 20% of crypto assets and double the returns compared to the portfolio without crypto asset index.
Portfolio Performance with the Crypto Asset Index CMC.
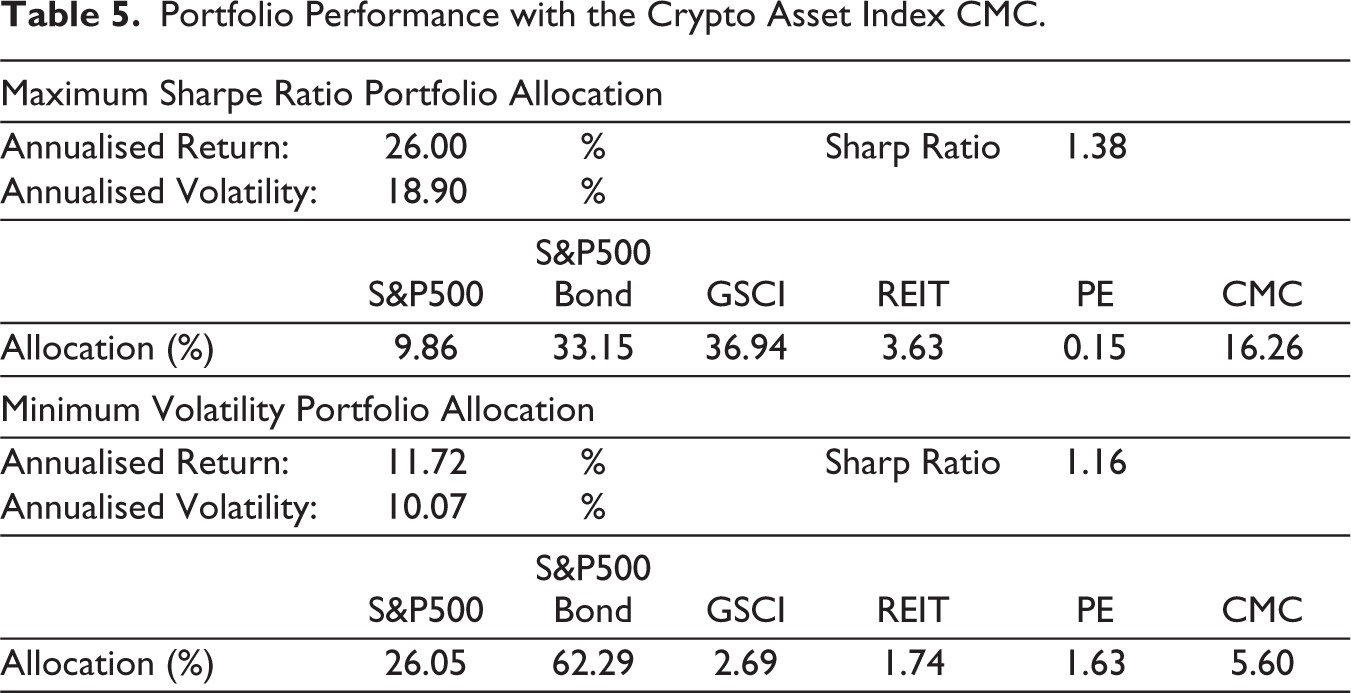
On the other hand, under the minimum volatility screening condition, the optimal portfolio with 5.6% of crypto assets index (CMC) can improve the risk diversification effect of the portfolio with a Sharpe ratio greater than 1.
Figure 1 shows the risk-return characteristics of a portfolio containing crypto assets. The horizontal axis of the table shows volatility and the vertical axis shows return.
Risk-return Characteristics of a Portfolio Containing CMC.
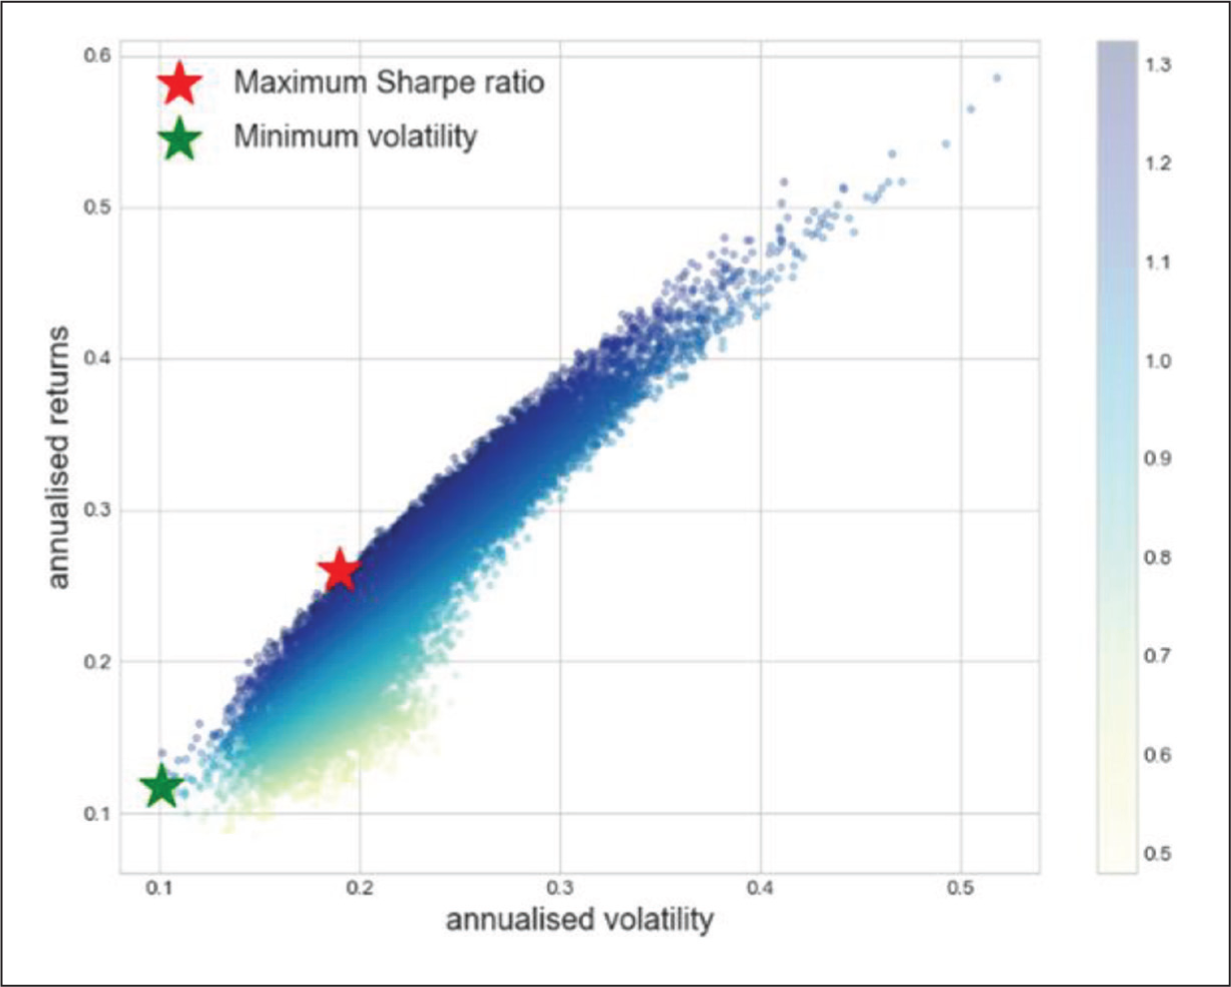
The red dots in the figure represent the portfolio with the highest Sharpe ratio. Within this portfolio, the weight of crypto assets (CMC index) is 16.26%.
These results indicate that crypto assets may contribute to improving the risk-return characteristics of the portfolio.
Portfolio Analysis with Individual Crypto Asset
The crypto asset index CMC, consists of 200 individual crypto assets and is calculated as a market value-weighted average of the market capitalisation. Therefore, the CMC Index is affected by changes in the prices of individual crypto assets, and susceptible to fluctuations due to asset movements.
Therefore, in order to confirm the impact of the individual crypto assets that make up the CMC Index on the portfolio, we need to analyse the effect of including crypto assets with a high market capitalisation.
Portfolio with Maximum Sharpe Ratio with One Crypto Asset.
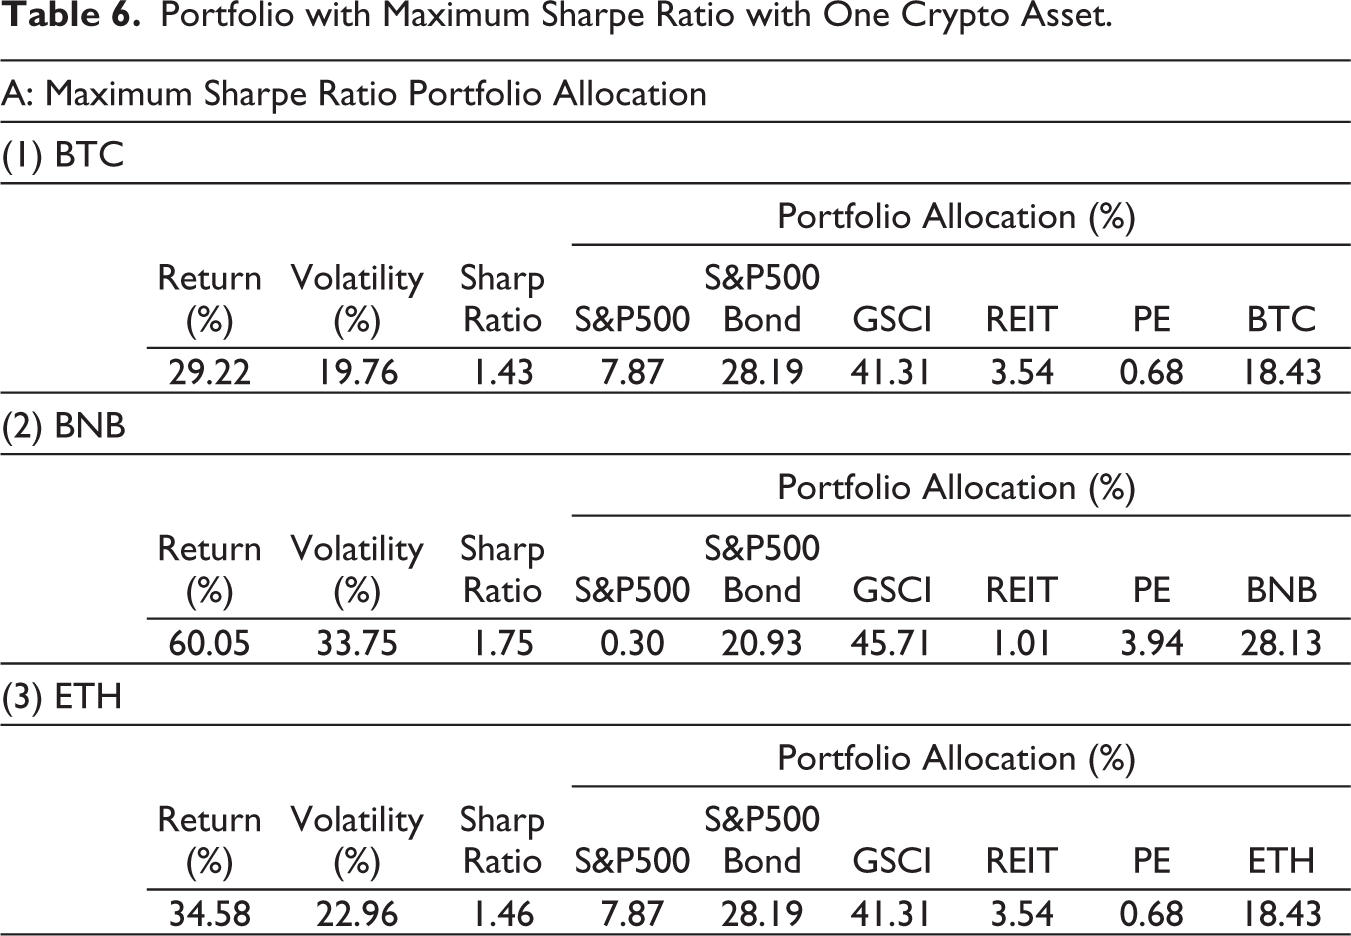
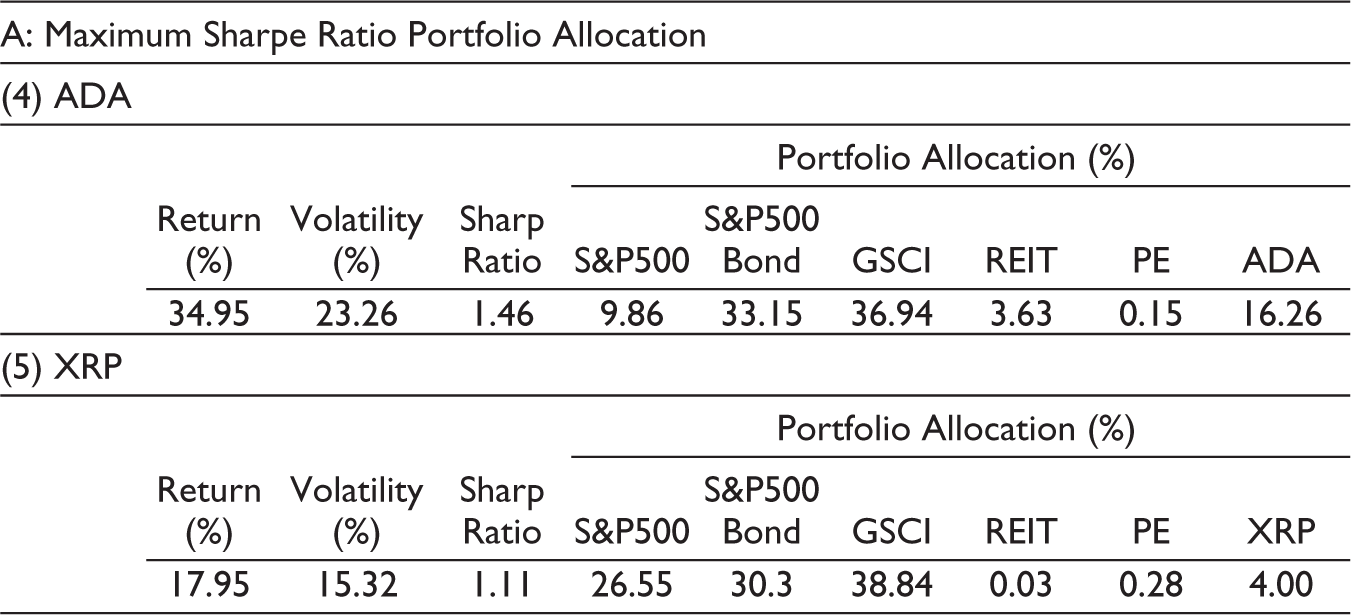
We investigate the risk/return of the portfolio when one individual crypto asset is added to the representative index for each of the five assets. The five individual crypto assets used are BTC, BNB, ETH, ADA and XRP, which have large market capitalisation as of the end of June 2022. However, stable coins are excluded from the analysis because their prices are stable.
First, in case that the Sharpe ratio is maximised, the Sharpe ratio is higher than when the crypto asset index is not incorporated. Also, except for XRP, the value of the Sharpe ratio improves more when individual stocks are added than when the CMC index is added. Next, looking at the optimal portfolio, except for XRP, the individual crypto-asset weights were equal to or larger than the CMC weight.
The ratio of individual crypto-asset holdings weight is as large as that of the S&P 500 Bond and GSCI, suggesting that investing in individual crypto assets may improve the maximisation of the Sharpe ratio. On the other hand, the investment ratio of XRP is 4.00%, which is smaller in value than other crypto assets. However, it can be said that investing a certain percentage in crypto assets has the potential to improve the Sharpe ratio maximisation of the portfolio.
Looking at the non-crypto asset allocation weight, the values for GSCI and S&P 500 Bond are larger than those for S&P 500. The GSCI has a higher holding weight than the S&P 500 because the annualised return for the analysis period is higher for the GSCI than for the S&P 500, and the S&P 500 Bond has a higher holding weight because its volatility is relatively lower than other assets and its return is more stable due to its characteristics as a bond.
Portfolio with Minimum Volatility with One Crypto Asset.
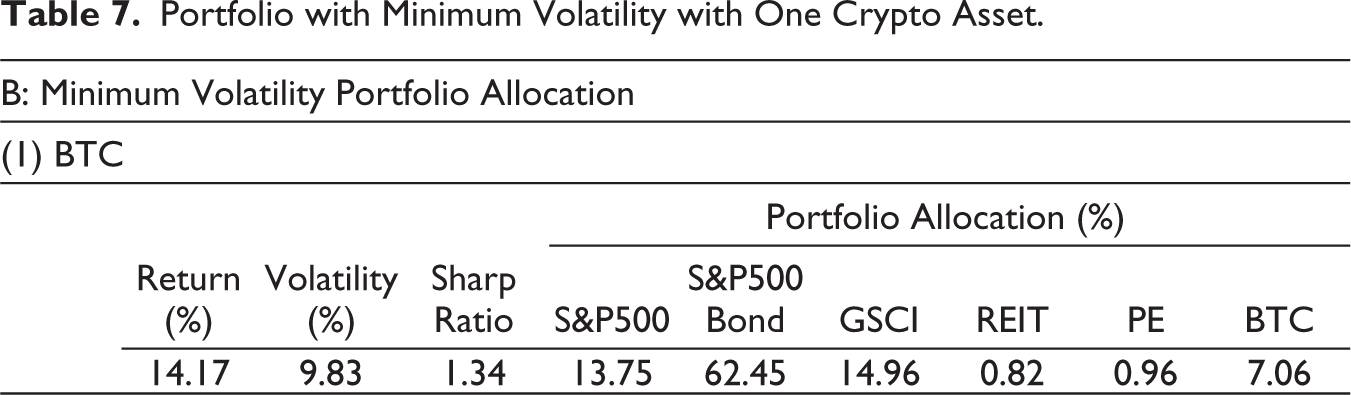
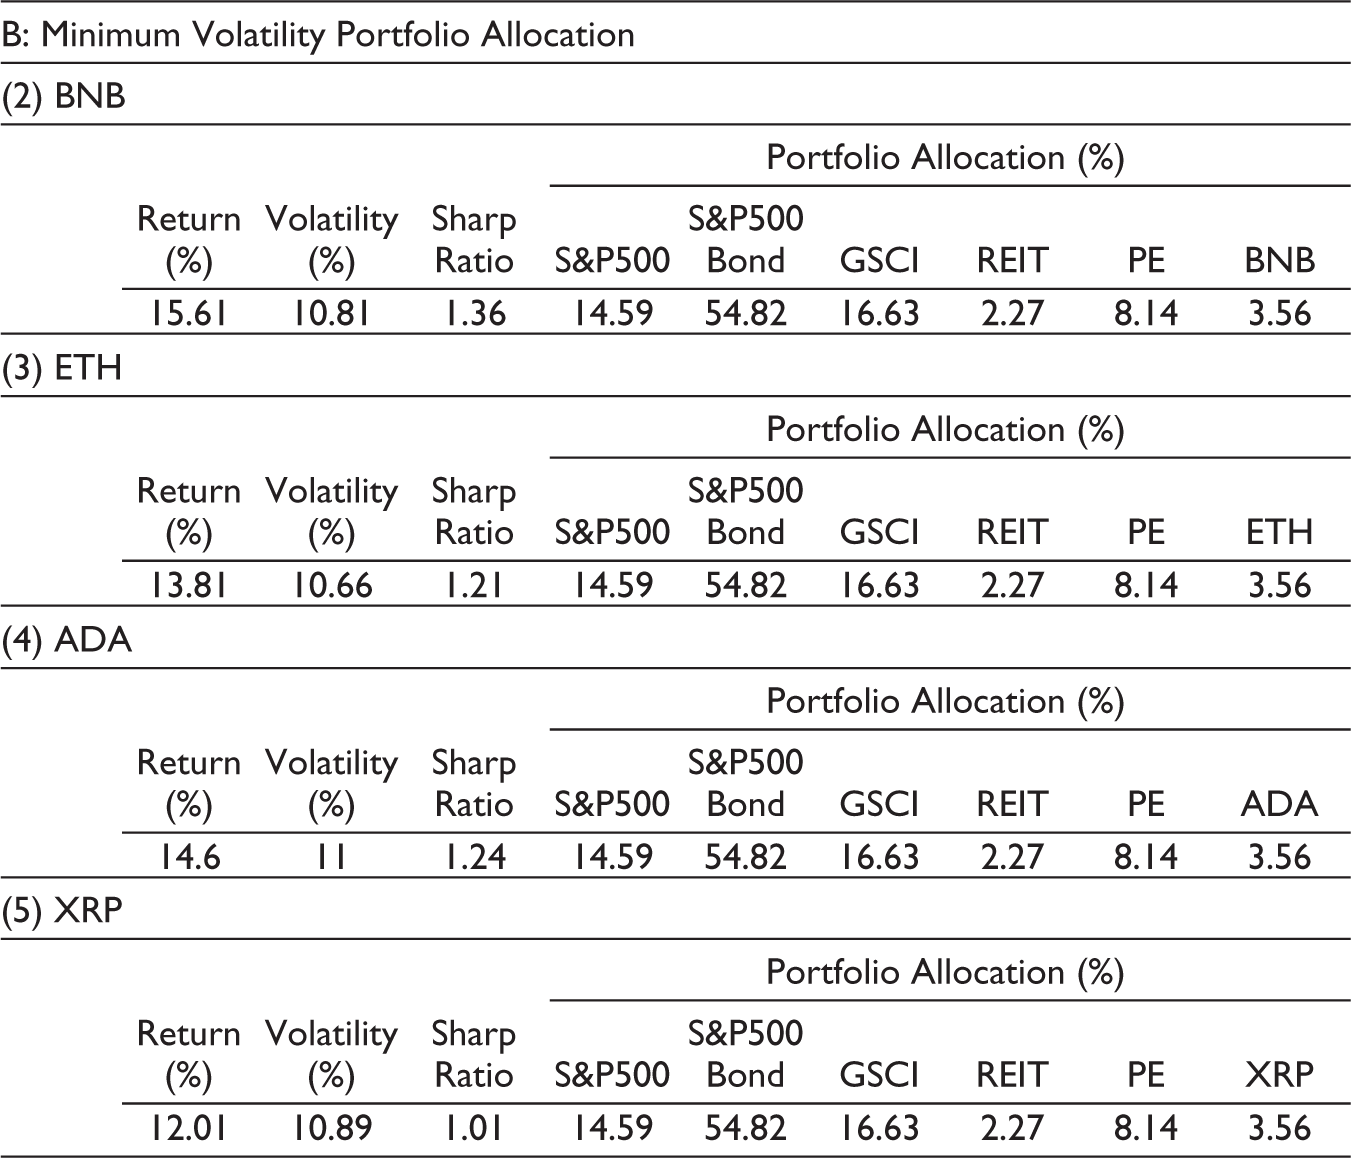
Next, we check the optimal portfolio when volatility is minimised. First, the Sharpe ratio is higher than when the crypto asset index is not incorporated. This suggests the possibility of improving the maximisation of the Sharpe ratio by investing in individual crypto assets.
However, the Sharpe ratio is larger in comparison to the CMC index, except for XRP. Looking at the weight of crypto assets held, the weight is 3.56%, except for BTC. This can be attributed to the relatively higher volatility of crypto assets than other assets.
Looking at the weight of non-crypto assets held, the S&P 500 Bond and the GSCI account for a high weight, totalling more than 70% of holdings. The GSCI’s high annualised return over the analysis period may have contributed to a certain level of high holdings.
Analysis of the Inclusion of Two Individual Crypto Assets
In ‘Portfolio Analysis with Individual Crypto Asset’ section, we analysed the case of incorporating one individual crypto assets. The results showed that the Sharpe ratio improves more when investing in crypto assets than not.
Portfolio with Maximum Sharpe Ratio with Two Crypto Assets.
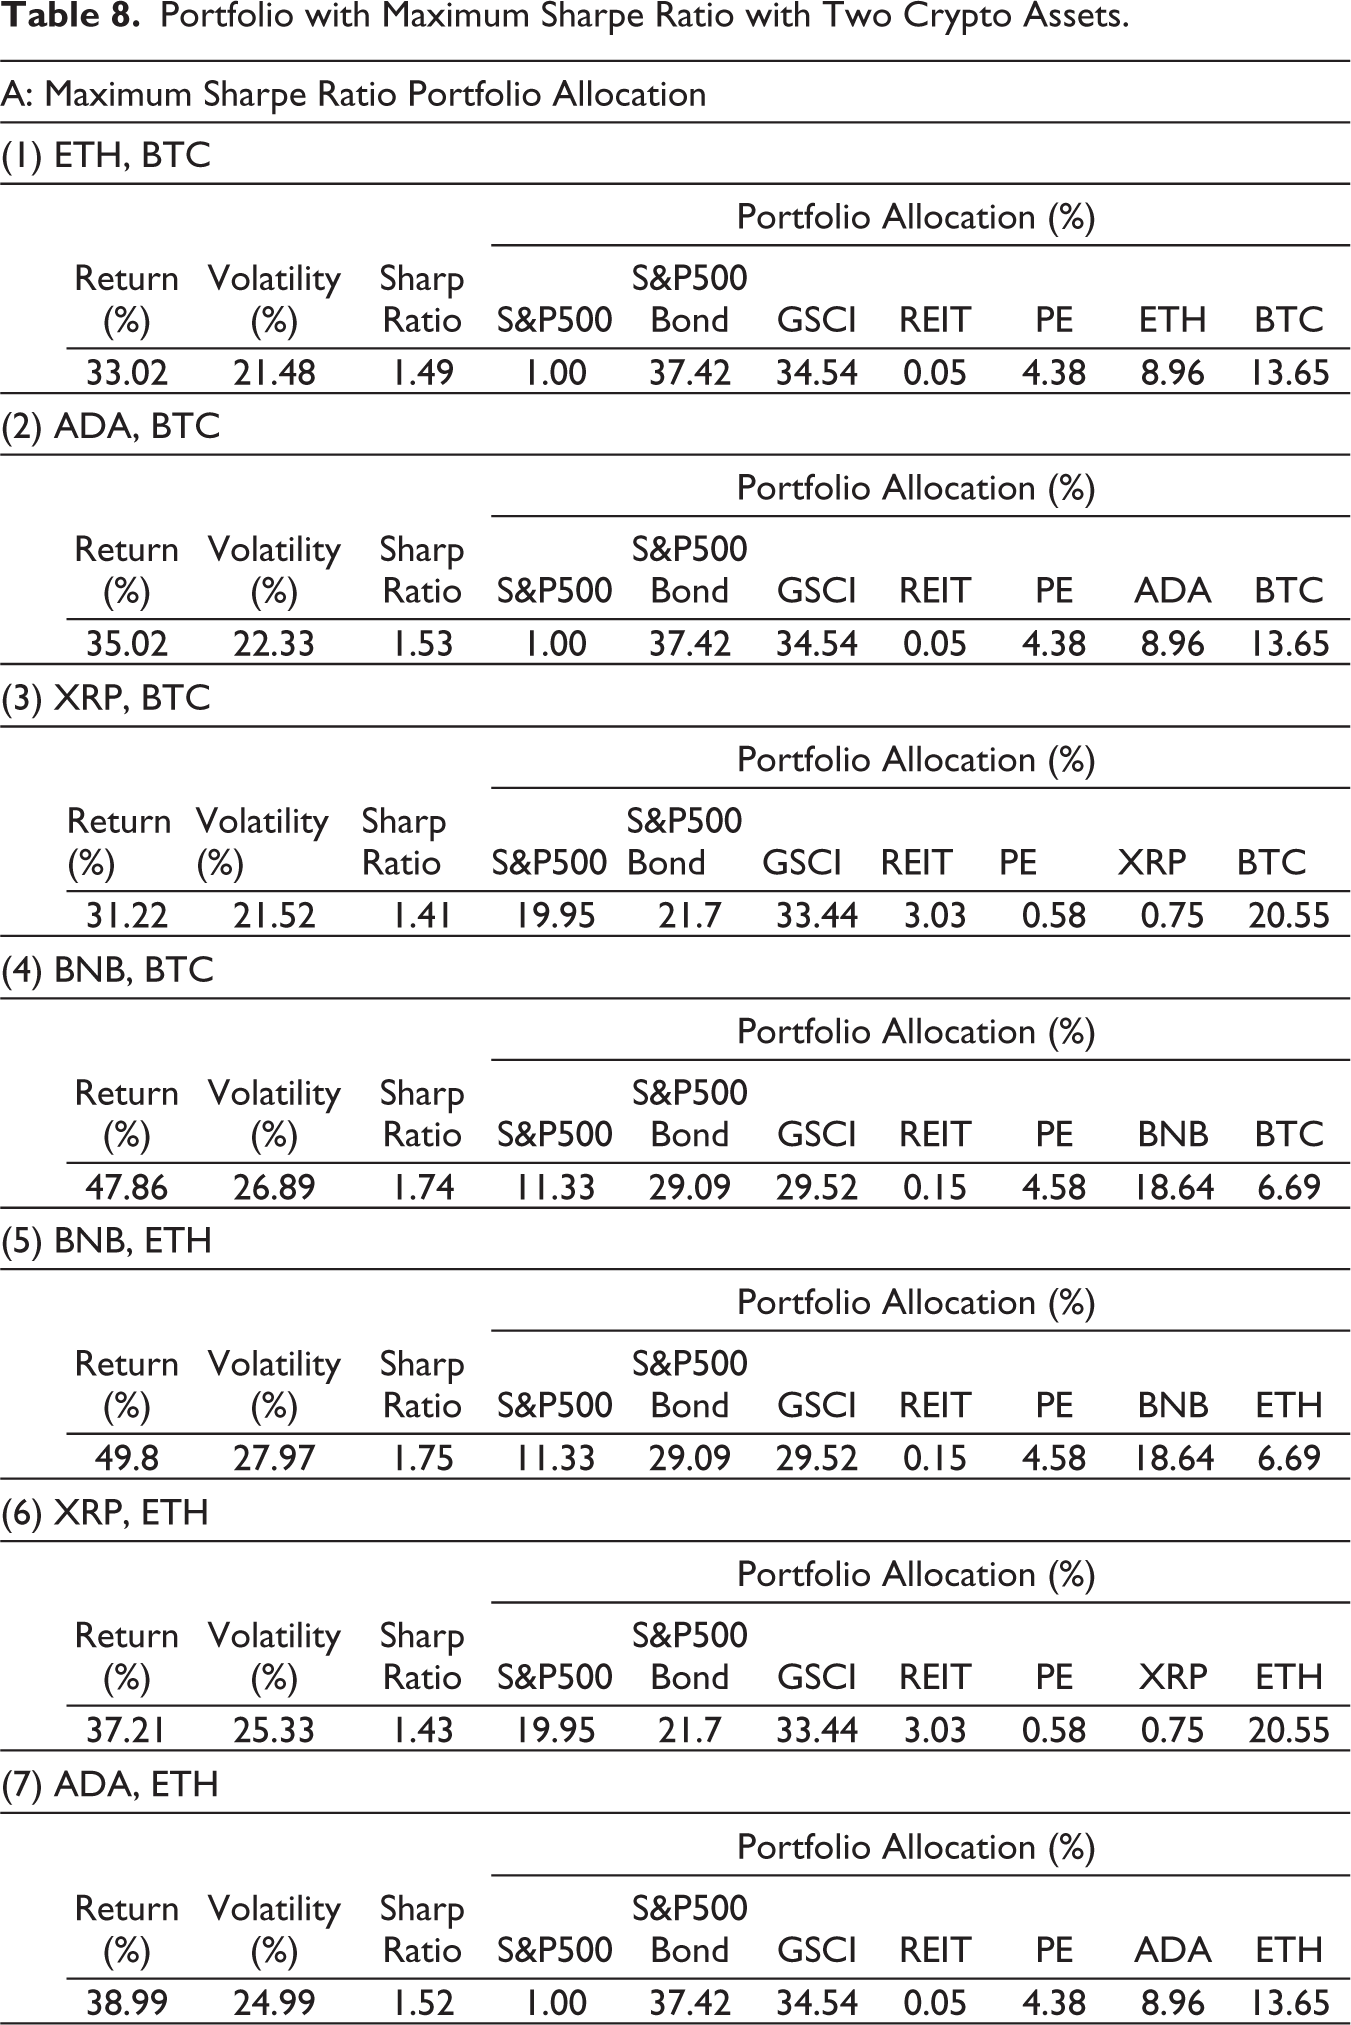
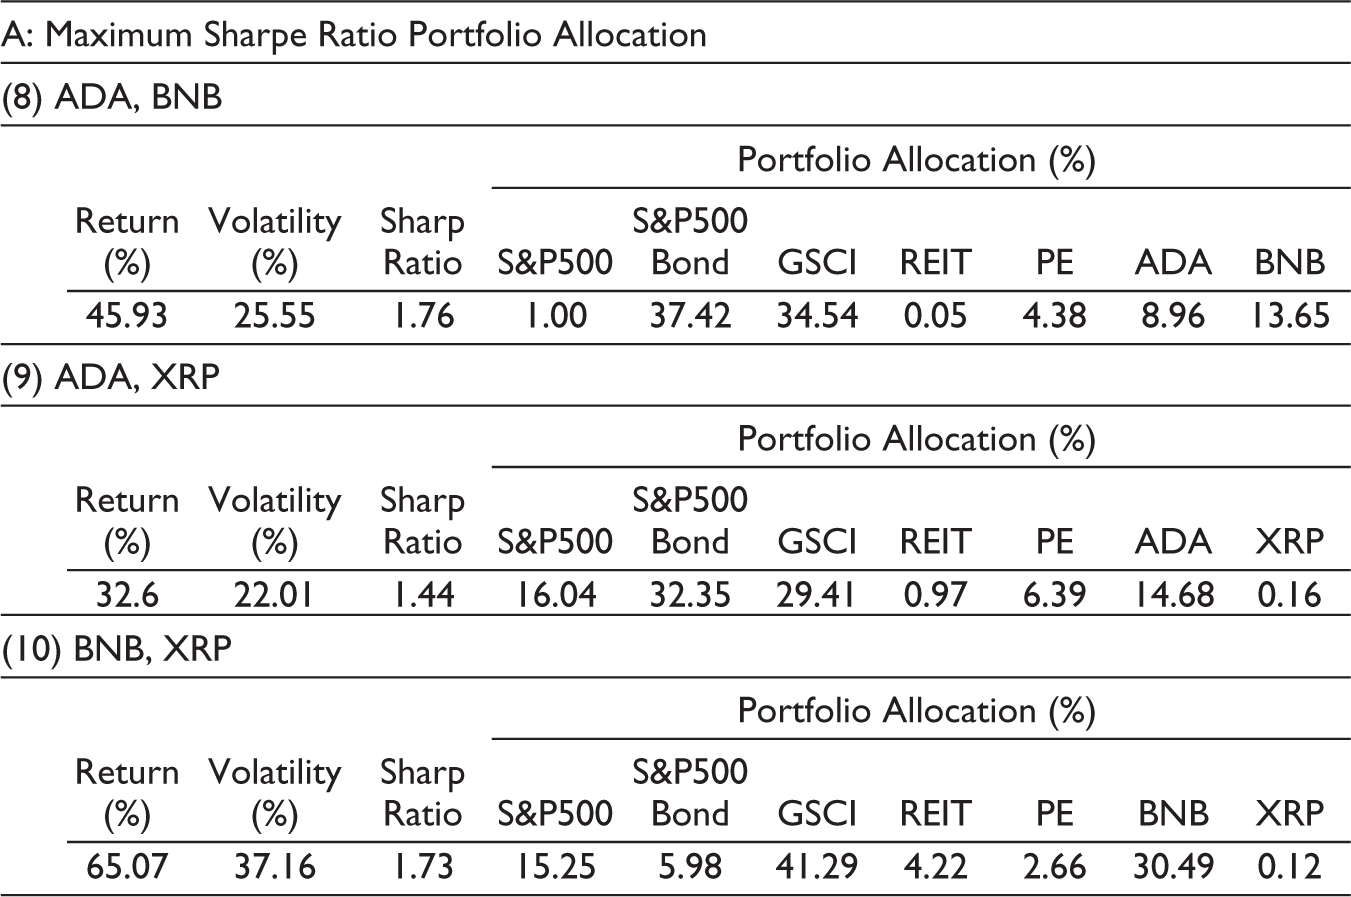
In this section, we attempt to analyse the case where two individual crypto assets are included. As in ‘Analysis of the Inclusion of Two Individual Crypto Assets’ section, we will analyse the effect of incorporating two of the five individual crypto assets that comprise the CMC index with the highest market capitalisation (BTC, BNB, ETH, ADA and XRP) into the portfolio.
First, looking at the Sharpe ratio, we see that the value is improved compared to the case of investing in a single crypto asset. Next, looking at the optimal portfolio, although the holding weights of the two crypto assets varies depending on the combination, the total holding weight is approximately 20%–30%, indicating that a certain level of investment weight is required in the optimal portfolio. This indicates that the Sharpe ratio of the portfolio can be improved by incorporating multiple crypto assets.
Looking at assets other than crypto assets, we see that the S&P 500 has a very low holding ratio, while the S&P 500 Bond and GSCI have large holdings. This is the same trend as when one crypto asset is included. In other words, the ratio of GSCI holding weight is high because the annualised return of GSCI is higher than that of S&P 500, and the weight of S&P 500 Bond is high because its volatility is relatively lower than that of other assets and its return is more stable due to its characteristics as a bond.
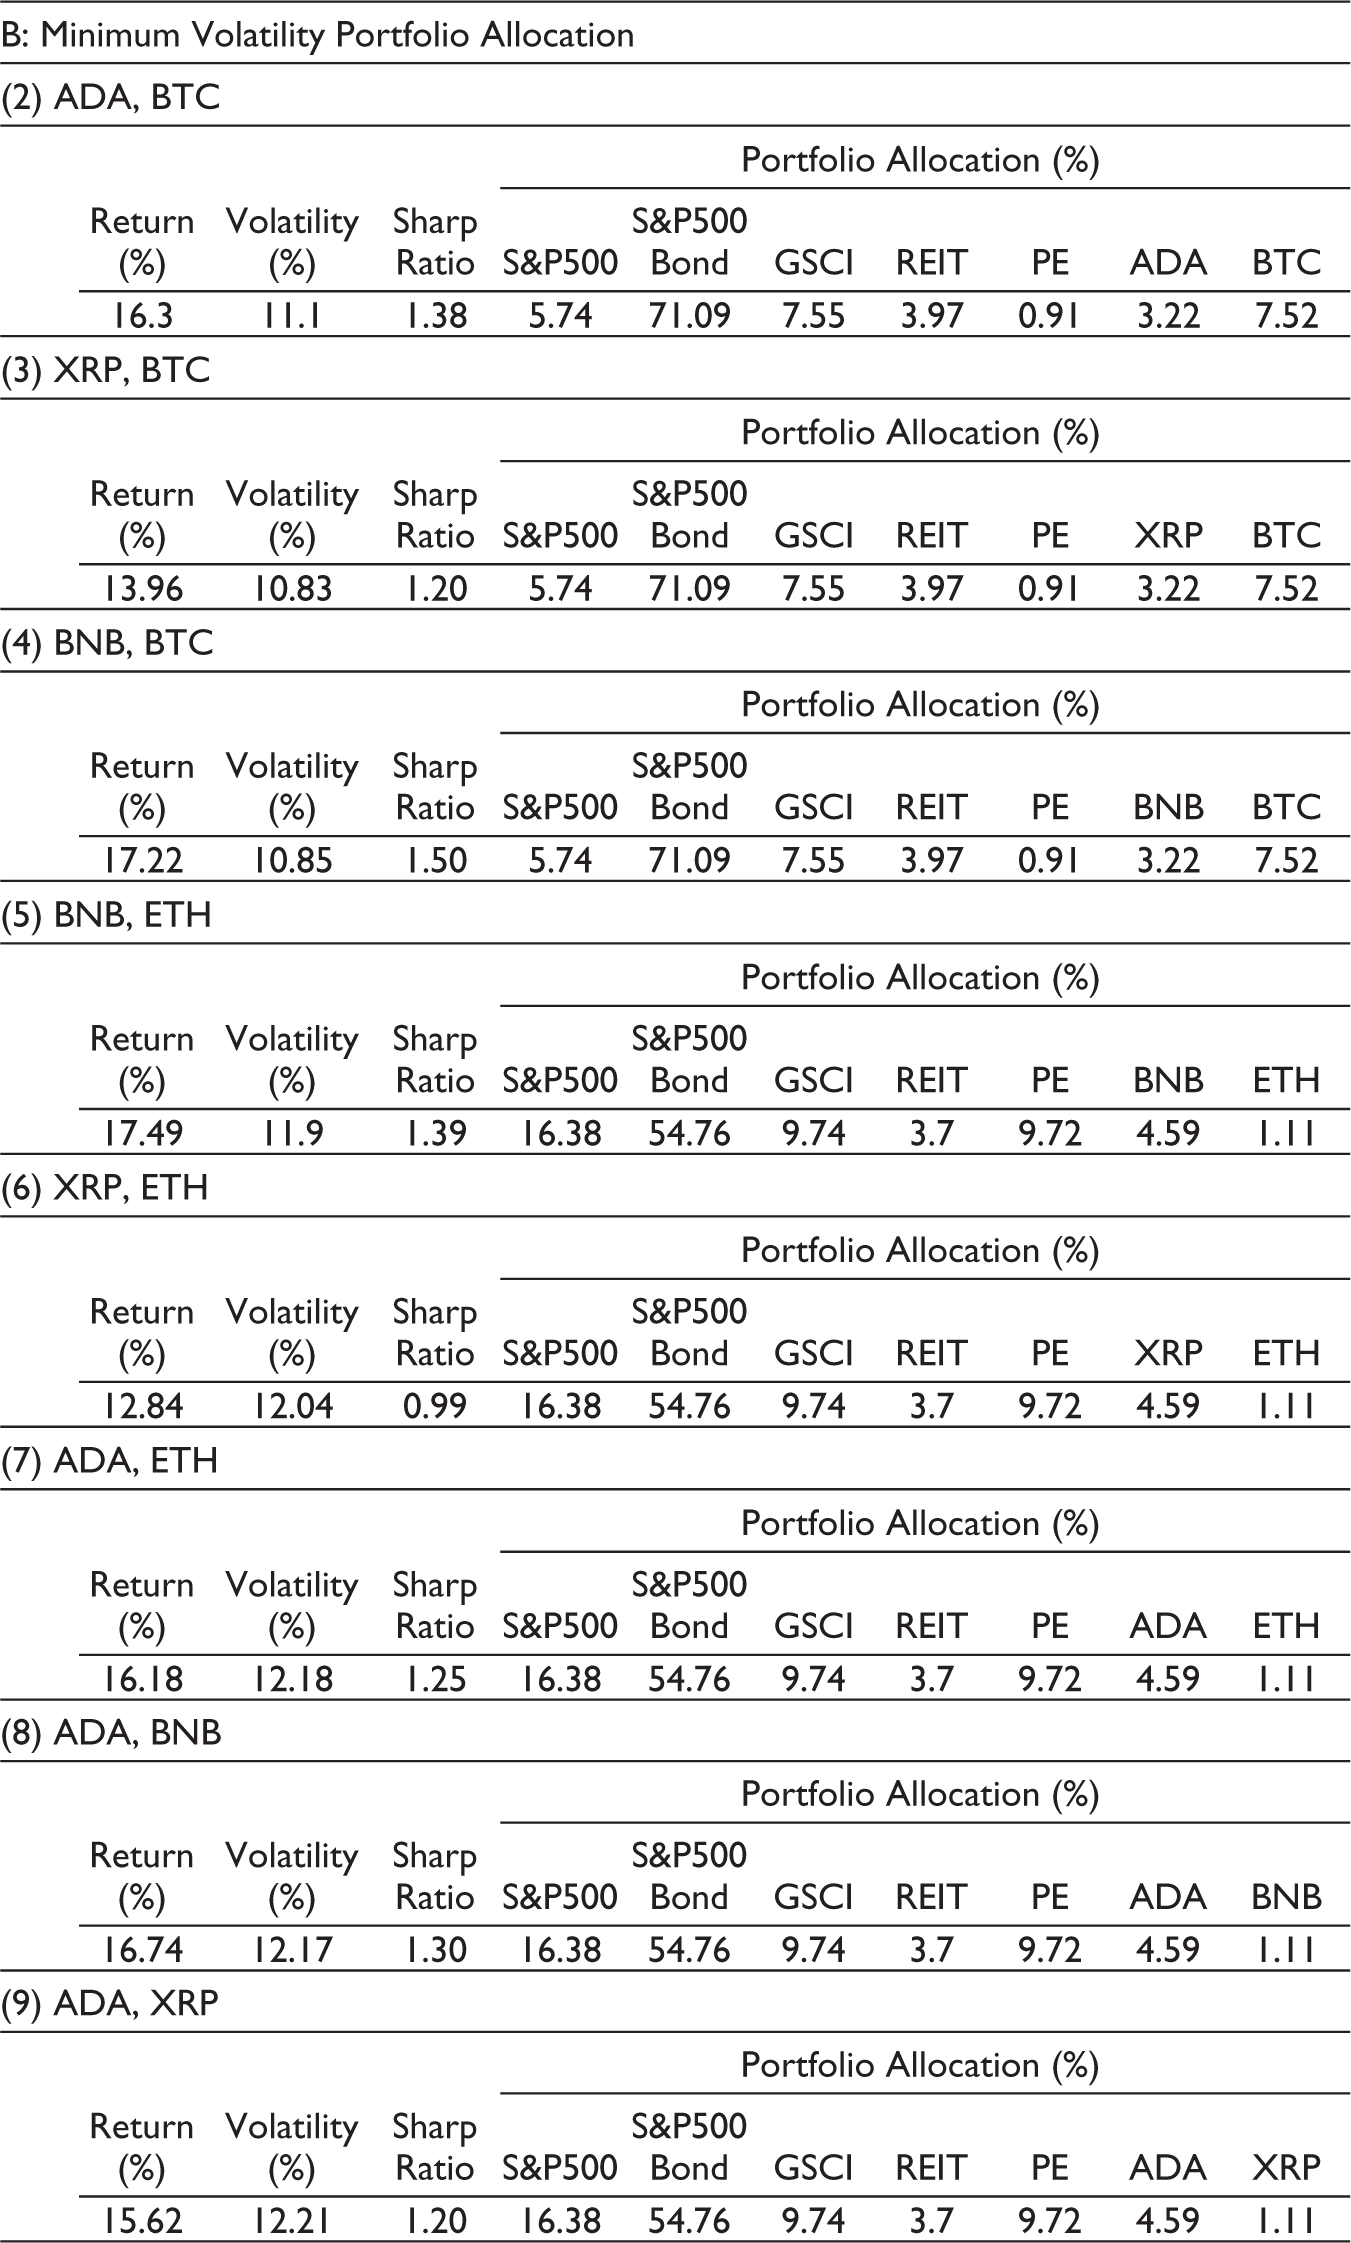
Portfolio with Minimum Volatility with Two Crypto Assets.

CVaR Analysis Results with BNB.
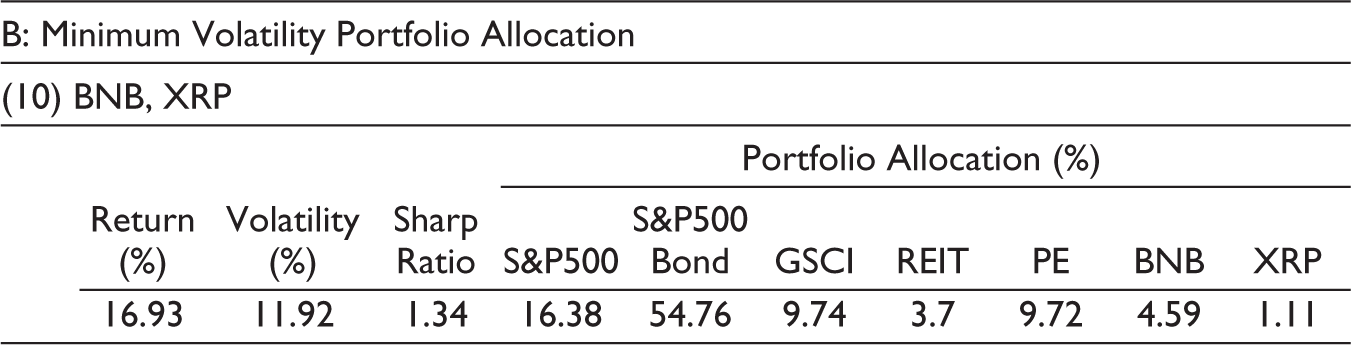
Next, we review the optimal portfolio when volatility is minimised.
Although the Sharpe ratio improves compared to the case where crypto asset is not included, there is no significant improvement compared to the case where one crypto asset is included, and we can see that some of the ratios improve slightly while others worsen. In addition, the weight of holdings of two crypto assets is not large, totalling less than 11% for any combination of crypto assets. This can be attributed to the relatively higher volatility of crypto assets than other assets.
Next, looking at the weight of assets other than crypto assets held, the weight of S&P 500 Bonds is high, at more than 50%. This is thought to be due to the relatively lower volatility of bonds compared to other assets. When one individual crypto asset was included, the GSCI had the second-highest weight of holdings, while the S&P 500 had the second-highest weight of holdings when two individual crypto assets other than BTC were included. Although the risk and return values of the optimal portfolio were not significantly different from those of the case with one crypto asset, the inclusion of two crypto assets increased the volatility of the overall portfolio, which may be the reason why the weight of non-crypto asset holdings was adjusted.
Risk Analysis Using CVaR
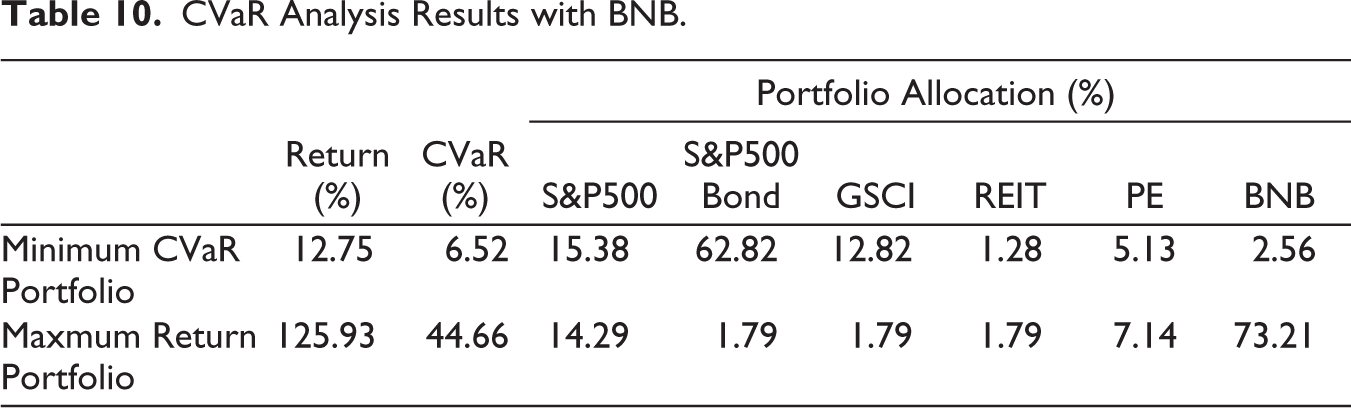
Since crypto assets are known to have large price movements, this study performs a CVaR analysis with Cornish–Fisher expansion, the confidential level of CVaR is 95% and the simulation is 50,000 times. We also set a target 10% annualised return to find the minimum CVaR portfolio. In this section, we analyse the case of incorporating BNB, which had the highest Sharpe ratio among the portfolios in the case of maximising the Sharpe ratio in the case of incorporating individual stocks of crypto assets in the ‘Portfolio Analysis with Individual Crypto Asset’ section.
CVaR Analysis Results for the Inclusion of BNB.
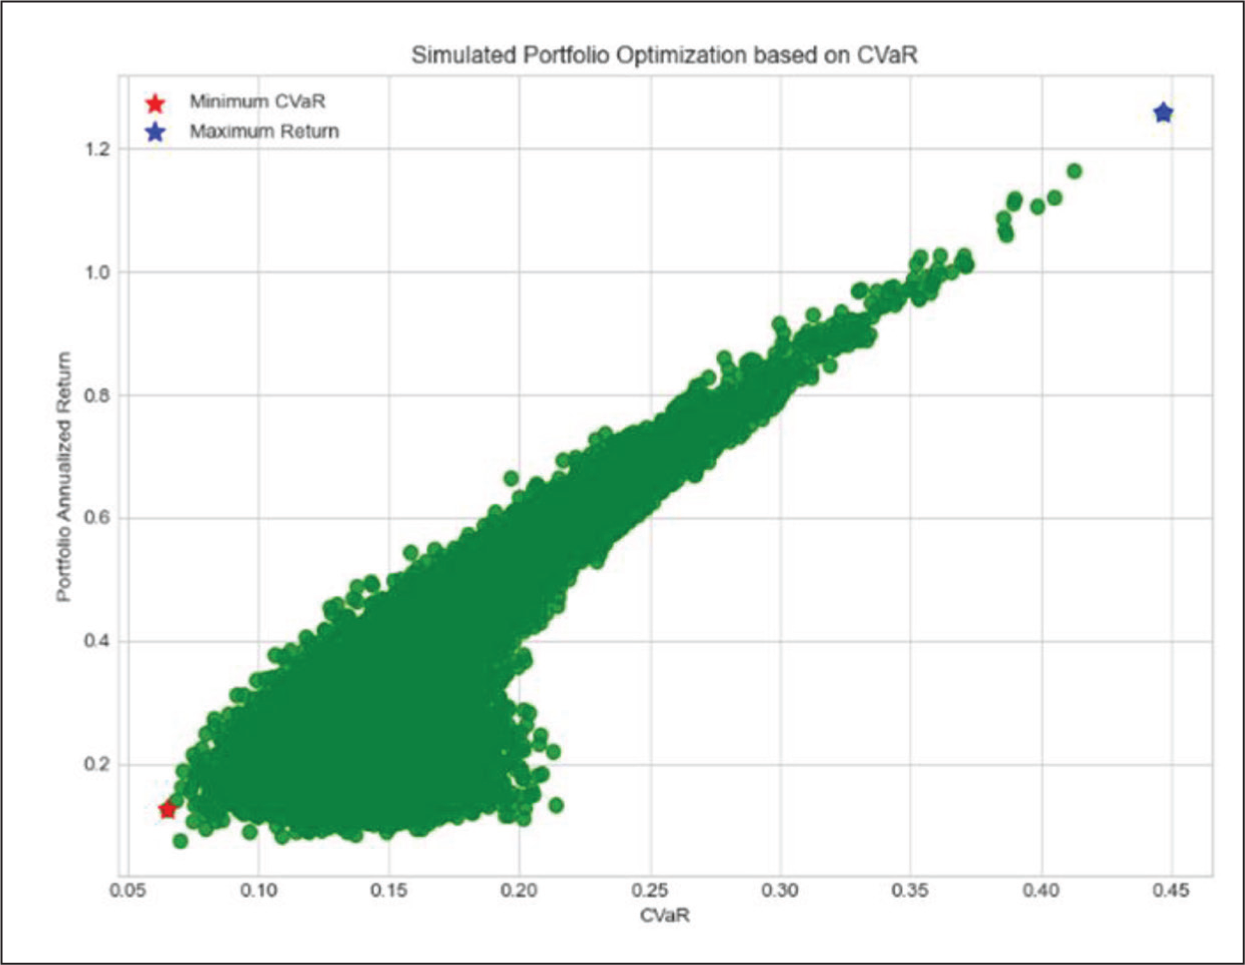
The portfolio with the lowest CVaR had a CVaR value of 6.52% and an annualised return of 12.75%. In this case, probability weighted average of losses occurring in the worst 5% of cases is −6.52%. For a portfolio with an annualised return of 12.75%, a CVaR value of 6.52%, the BNB’s allocation weight is smaller at 2.56%. On the other hand, the portfolio with the highest return had a CVaR value of 44.66% and an annualised return of +125.93. In this case, BNB has the highest value of 73.21%, and the S&P 500 has the next highest value of 14.29%, suggesting that the high potential for investors with high-risk tolerance.
We also checked scenario with XRP alone, scenario with BTC and XRP, the results are nearly the same. The minimum CVaR value optimal portfolio with a CVaR value around 6%–7%, with an annualised return around 10%–13%. The analysis without considering the assumption of normal distribution still leads to a consistent conclusion. Namely, crypto assets can contribute to a portfolio’s return while diversifying risk.
Conclusion
In this study, we examined the impact of crypto assets on the risk-return characteristics of portfolios composed of traditional assets using data for the period after 2019.
First, we examined the optimal portfolio for maximising the Sharpe ratio, and found that the Sharpe ratio improves by incorporating a certain weight of crypto asset indices into the traditional portfolios of stocks, bonds, commodity indices and so on. Furthermore, the analysis of individual assets comprising crypto assets instead of the crypto-asset index showed that the Sharpe ratio improved for most of the individual stocks in one stock. When the next two individual stocks were included in the traditional assets, the Sharpe ratio was found to improve further and the crypto asset weighting was also found to increase.
This indicates that for institutional investors and portfolio managers who can take active risk, adding crypto assets to a portfolio consisting of traditional assets can improve risk-return characteristics. In this sense, there is significance for institutional investors and portfolio managers to invest in crypto assets.
Second, the analysis of the optimal portfolio that minimises volatility shows that the weight of crypto assets held remains small. This may be due to the fact that the volatility of crypto assets is higher than that of other assets. In this sense, investments in crypto assets are not suitable for risk-averse institutional investors and portfolio managers.
From a policymaker’s perspective, the results of this study indicate that crypto assets may play a part in investors’ asset portfolios, and it should be recognised that crypto assets are having a significant impact on investors’ portfolios.
Future issues to be analysed include data period extension. Due to the still relatively short history of crypto assets and the difficulty of obtaining continuous index data, extending the time period of the data will be an issue in the future. It is expected that the expansion of the crypto asset market will lead to the development of research fields using crypto assets in the future.
Footnotes
Declaration of Conflicting Interests
The authors declared no potential conflicts of interest with respect to the research, authorship and/or publication of this article.
Funding
The authors received no financial support for the research, authorship and/or publication of this article.