
Abstract
Based on social identity theory, this study tests whether individuals demonstrate out-group rejection by rating jokes targeting the opposite gender funnier and more gender typical than jokes targeting their gender. Prior research is extended by examining individuals’ level of gender identification and propensity to discriminate against a hypothetical man or woman after exposure to sexist jokes. Results indicated that women exhibited in-group rejection, whereas men showed bias toward women only in the 1-joke (vs. 5- and 10-joke) condition. Men and women with low gender identification rated jokes about their gender funnier and more gender typical than those about the opposite gender, and highly identified women also rated jokes about women as gender typical. The findings did not support the basic assumptions of social identity theory; however, the theory remained useful in interpreting the results, which undoubtedly reflect the intergroup dynamics inherent in gender relations.
Guided by social identity theory (Tajfel & Turner, 1986), this study examines how disparaging jokes affect intergroup perceptions and behaviors. According to prejudiced norm theory (Ford & Ferguson, 2004), disparaging jokes communicate prejudice by triggering a lighthearted, noncritical mind-set. Disparaging jokes that express superiority or denigration toward social groups are particularly important to investigate because they underscore intergroup relationships. Gender has long been recognized as a relevant social identity to explore intergroup relations (e.g., Williams & Giles, 1978). With this mind, we extend our prior work (Abrams & Bippus, 2011) by considering the influence of individuals’ gender identity in their reactions to sexist jokes and assessing whether those reactions lead to discrimination.
Social identity theory was developed by Tajfel and Turner (1986) to acknowledge the importance of social groups to individuals’ self-concepts. The theory suggests that because individuals want to feel positive about their social group membership, they will show an in-group bias by favorably differentiating their group from relevant out-groups. Disparaging jokes that denigrate out-groups provide an outlet for individuals to express their superiority by laughing at the expense of out-groups (e.g., Hodson, Rush, & MacInnis, 2010). In the case of gender, some research on disparaging jokes has supported the in-group bias and other research has not (see Cantor, 1976; Jackson & Jackson, 1997). For example, we (Abrams & Bippus, 2011) recently found that women rated jokes about men funnier than jokes about themselves, but men did not. Relying on the concept of prototypes from self-categorization theory (Hogg, 2001; Turner, 1987), we also found that women rated the jokes as more gender typical of men than women.
The present study continues to pursue men’s and women’s reactions to sexist jokes that address men’s and women’s intellectual superiority/inferiority by assessing joke funniness and gender typicality ratings, but extends existing research in three important ways. First, the present study offers control of the joke content by focusing on sexist jokes that conceal the gender of the joke teller (Ford, 2000) rather than existing research, which sometimes includes jokes that reveal and conceal the gender of the joke teller without testing for differences between joke types. Second, the present study examines the moderating role of gender identification because according to Tajfel and Turner (1986) in-group biases are more likely to occur with people who highly identify with their social group. With this in mind, the importance of individuals’ gender identity should influence the degree to which they find jokes funny and typical of their gender and the out-group gender (e.g., Gallois & Callan, 1985). The third contribution of the present study is that it examines the link between exposure to disparaging jokes and discrimination by asking participants to evaluate the résumé of an in-group or out-group member following exposure to the jokes. Although social identity theory was developed to offer an explanation for intergroup behavior, particularly discrimination, investigations are lacking into whether disparaging jokes cause discrimination (for an exception see Ford, Boxer, Armstrong, & Edel, 2008). If disparaging jokes inoculate against critical thought (Ford & Ferguson, 2004), then jokes should provide an outlet to express prejudice, and the attitudes reflected in the jokes may carry over to discriminatory behavior. Therefore, the following hypotheses and research questions are advanced:
Method
Stimulus Jokes
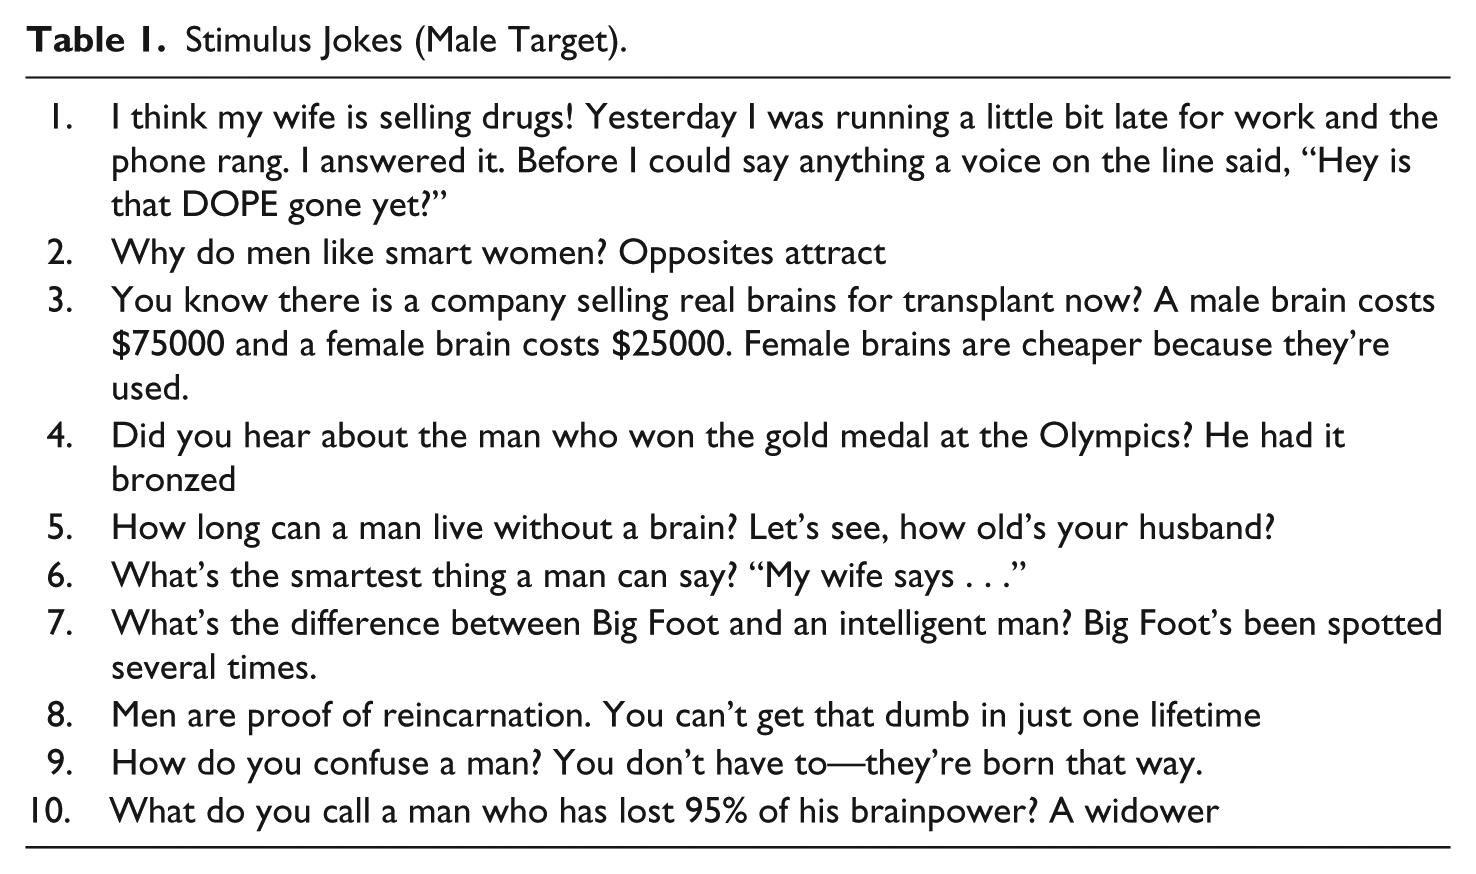
Twenty jokes from our previous work (Abrams & Bippus, 2011) were pilot tested for inclusion in the main study. In an online pilot survey, participants (38 men, 73 women) read 20 jokes targeting one gender’s intelligence and rated the funniness of each joke. The 10 jokes with the highest combined funniness ratings across both versions (male and female) and smallest rated difference in funniness between versions were included. In all but 3 cases, male-targeted jokes received slightly higher ratings of funniness (mean difference = 0.08 on a 5-point scale). Three of the 10 jokes were drawn from previous research (Cantor, 1976; Jackson & Jackson, 1997; Thomas & Esses, 2004); the remaining seven were selected from websites (see Table 1 for jokes used).
Stimulus Jokes (Male Target).
Participants
The main study participants (315 men, 509 women) were of varied ethnicities: White/Caucasian (n = 269), Hispanic/Latino/a (n = 254), Black/African American (n = 37), Asian/Asian American (n = 209), Native American (n = 4), and “Other” (n = 48). The average age was 19.52 (SD = 3.32).
Measures
All measures were assessed with 5-point Likert-type scales. Joke funniness (M = 2.99; SD = 1.08, α = .91) and gender typicality (M = 3.72; SD = 0.94, α = .85) were assessed with items used in previous research (Abrams & Bippus, 2011), and gender identity was measured with four items adapted from Luhtanen and Crocker’s (1992) collective self-esteem identity subscale (e.g., “Being a man is an important reflection of who I am”). The scale mean was 2.32 (SD = 0.74, α = .68). Men (M = 2.50, SD = 0.76) reported significantly higher gender identity, t(789) = 5.6, p < .001, than women (M = 2.20, SD = 0.71). Discrimination was measured by the reported likelihood of voting for a fictitious candidate for student government following exposure to each candidate’s supposed résumé (e.g., “I would vote for this candidate in a student government election”). The mean for the 3-item scale was 2.49 (SD = 0.70, α = .89).
Design and Procedure
The study was conducted via an online research survey provider. Participants first completed demographic items and the in-group identification measure. Then, they rated the funniness of 10 jokes on various topics included to obscure the focus of the study (e.g., “Why don’t you see Penguins in Britain? Because they’re afraid of Wales.”)
Our prior work (Abrams & Bippus, 2011), indicated that the number of sexist jokes participants were exposed to influenced their perceptions of joke funniness and gender typicality. Therefore, in this study participants were randomly presented with 1, 5, or 10 jokes targeting either men or women, and they completed the funniness and gender typicality measures about the jokes. Equivalency across the joke conditions on the dependent variables was tested. There was a difference for gender typicality F(2, 731) = 11.51, p < .001, η2 = .04: The 10-joke condition was rated as most typical of both genders (M = 3.89, SD = 0.97), followed by the 5-joke condition (M = 3.73, SD = 0.95) and 1-joke condition (M = 3.45, SD = 0.83). There was a significant effect on funniness F(2, 731) = 11.07, p < .001, η2 = .03: The 1-joke condition was rated as funniest (M = 3.25, SD = 1.01), followed by the 10-joke (M = 2.81, SD = 1.12) and 5-joke condition (M = 2.81, SD = 1.09). Thus, the number of jokes was included in subsequent analyses involving funniness and gender typicality.
After completing the joke study, participants were invited to complete another study on the topic of résumés, ostensibly being conducted by a different instructor. They were routed to one of two résumés from student government candidates, identical except for the candidate’s apparent gender (James vs. Jennifer) and whether an award was received from the Boy Scouts or Girl Scouts. Participants answered several dummy items about the résumé before reporting their likelihood of voting for the candidate.
Results
A 2 (participant gender) × 2 (joke target gender) × 3 (joke number) factorial ANOVA (analysis of variance) for funniness revealed main effects for respondent gender, joke target gender, and number of jokes. Females (M = 3.06, SD = 1.09) rated jokes funnier than did males (M = 2.87, SD = 1.07), F(1, 774) = 3.92, p = .05, η2 = .00, and jokes about females (M = 3.16, SD = 1.11) were rated funnier than jokes targeting males (M = 2.77, SD = 1.01), F(1, 774) = 14.46, p < .001, η2 = .02. However, there was also a participant gender by joke target gender interaction, F(1, 774) = 16.45, p < .001, η2 = .02, such that women found jokes about women funnier than jokes about men (see Table 2). Additionally, there was a joke gender by number of jokes interaction F(2, 774) = 3.20, p = .04, η2 = .01; although there were no differences among jokes targeting men, jokes targeting women were rated funnier in the 1-joke condition (M = 3.44, SD = 0.96) than in the 10-joke (M = 3.17, SD = 1.14, p = .02) or 5-joke condition (M = 2.86, SD = 1.11, p < .001), and the 10- and 5-joke conditions also differed significantly (p = .03). Finally, there was a three-way interaction among participant gender, target joke gender, and number of jokes, F(2, 774) = 4.05, p = .02, η2 = .01. When examining men and women separately, analysis of the pairwise comparisons for joke number indicated that in the 1-joke condition, men rated jokes about women funnier than jokes about men, but this pattern was reversed when they were exposed to 5 jokes (see Table 2). There was no difference in men’s funniness ratings of male- and female-targeted jokes in the 10-joke condition. Women rated jokes about women funnier than jokes about men in the 1-, 5-, and 10-joke conditions. Therefore, Hypothesis 1 was partially supported.
Funniness Ratings by Participant Gender, Joke Target Gender, and Number of Jokes.

Values in row are significantly different at the .001 level.
Values in row are significantly different at the .01 level.
Values in row are significantly different at the .05 level.
A 2 (participant gender) × 2 (joke target gender) × 3 (joke number) factorial ANOVA for gender typicality revealed main effects for joke target and number of jokes. Jokes about females (M = 3.94, SD = 0.91) were rated as more gender typical than jokes targeting males (M = 3.44, SD = 0.90), F(1, 774) = 33.16, p < .001, η2 = .04. However, there was a participant gender by target gender interaction, F(1, 774) = 39.41, p < .001, η2 = .04, such that women found jokes about women more gender typical than jokes about men (see Table 3). Therefore, Hypothesis 2 was not supported. There was also a target gender by joke number interaction F(2, 774) = 6.38, p = .002, η2 = .01; although there were no differences among jokes targeting men, jokes targeting women were seen as significantly less gender typical in the 1-joke condition (M = 3.49, SD = 0.79) than in the 10-joke condition (M = 4.21, SD = 0.87, p < .001) or 5-joke condition (M = 4.01, SD = 0.93, p < .001).
Gender Typicality Ratings by Participant Gender and Joke Target Gender.
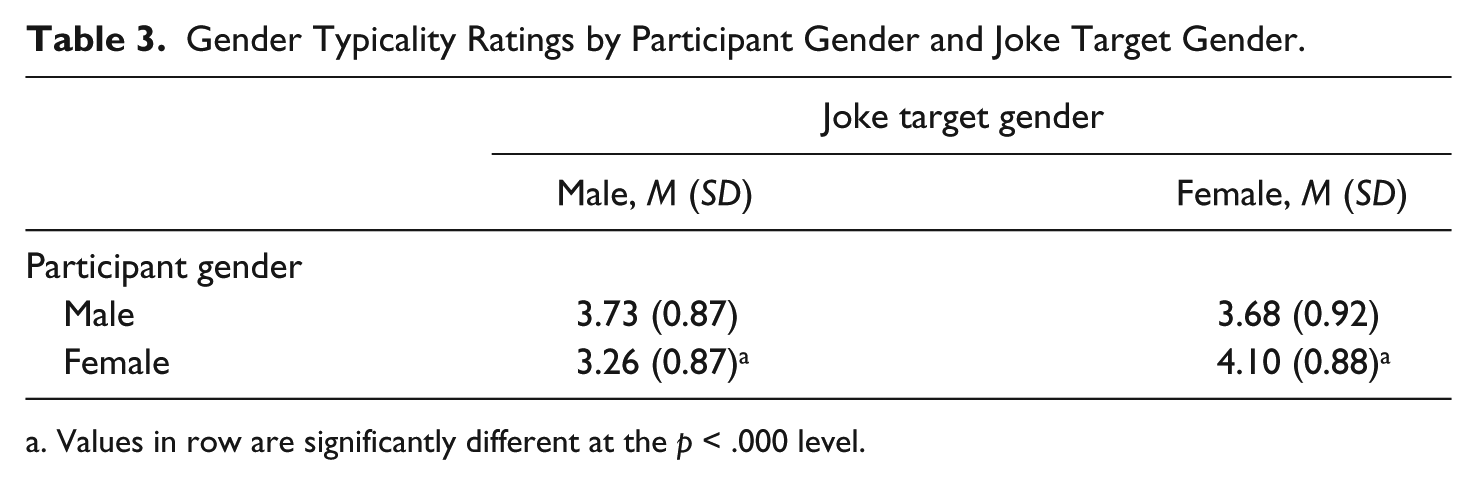
Values in row are significantly different at the p < .000 level.
For analyses addressing Hypotheses 3 and 4 and Research Questions 1 and 2, individuals were selected based on their gender identity scores: Scores >1 SD below the mean on this variable were considered as low gender identity (n = 100); those >1 SD above the mean were considered high gender identity (n = 131). A 2 (participant gender) × 2 (joke target gender) × 2 (high/low gender identity) × 3 (joke number) ANOVA yielded a significant three-way interaction among participant gender, identification level, and joke target gender F(1, 196) = 10.52, p = .001, η2 = .04. Pairwise comparisons showed neither males nor females with high gender identification differed in their ratings of joke funniness based on joke target gender (see Table 4). Therefore Hypothesis 3 was not supported. However, analyses for Research Question 1 revealed that males with low gender identification rated jokes targeting males significantly funnier than those targeting females. Similarly, female participants with low gender identification rated jokes significantly funnier when they targeted women versus men.
Funniness Ratings by Participant Gender, Joke Target Gender, and Level of Gender Identification (ID).
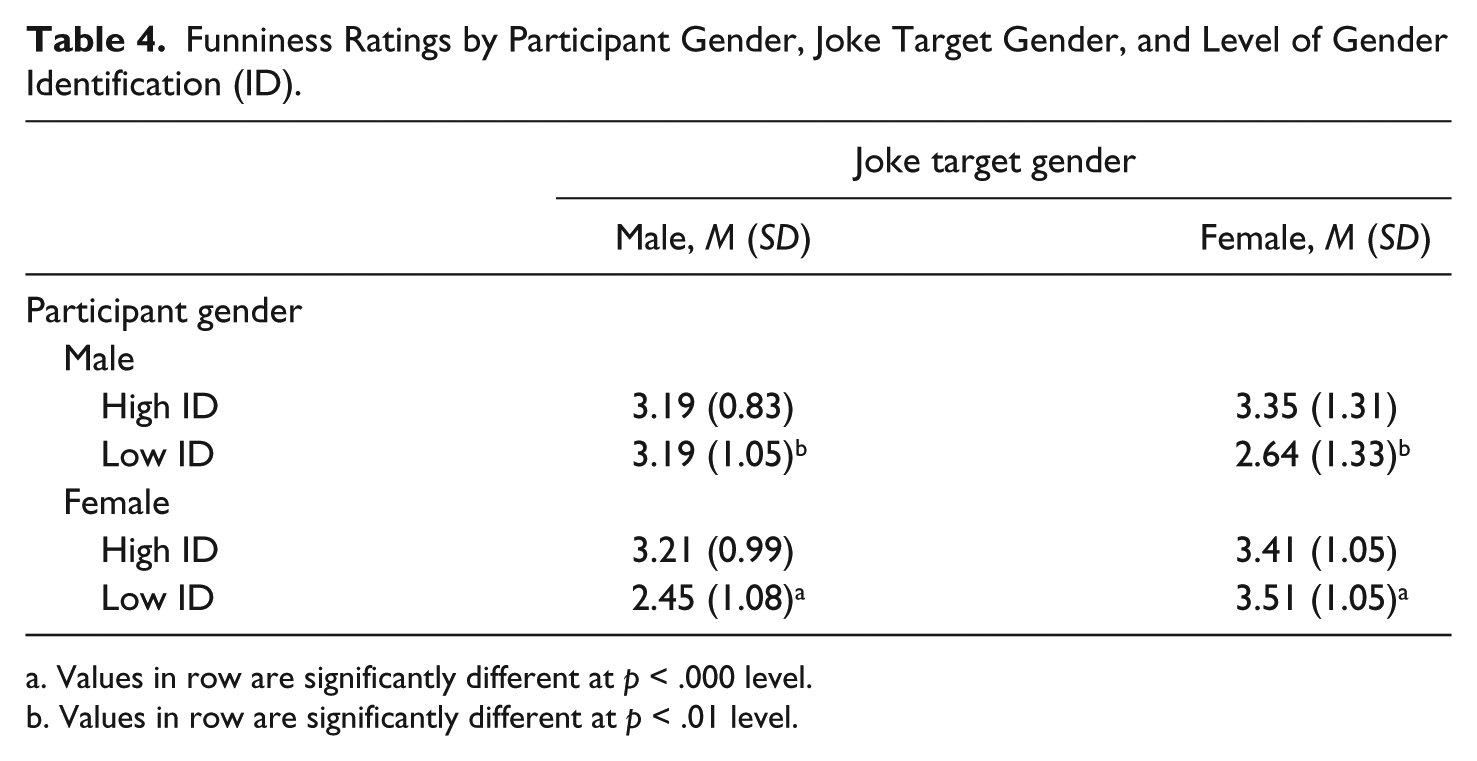
Values in row are significantly different at p < .000 level.
Values in row are significantly different at p < .01 level.
There was a significant three-way interaction between participant gender, joke target gender, and level of identity, F(1, 201) = 5.93, p = .02, η2 = .02 on ratings of gender typicality. Simple main effect showed no differences in ratings of gender typicality for males with high gender identity. However, male participants with low gender identification rated jokes targeting males (M = 3.98, SD = 0.84) significantly more gender typical (p = .003) than those with female targets (M = 3.42, SD = 1.33). In the same vein, low female gender identifiers (M = 3.91, SD = 0.94) rated jokes targeting women significantly more gender typical (p = .006) than male-targeted jokes (M = 3.32, SD =1.03). This same pattern emerged for the gender typicality ratings of females with high gender identity (p < .001; male-targeted joke M = 3.35, SD = 0.87; female-targeted joke M = 4.15, SD = 0.93). There was also a four-way interaction among participant gender, gender identity, joke target gender, and number of jokes, F(1, 201) = 4.17, p = .02, η2 = .03, but cell sizes were inadequate and the findings should be disregarded (see Table 5). There were no significant differences in the 1- or 10-joke conditions. Female participants with low gender identification rated the 5- and 10-jokes conditions with female targets significantly more gender typical than those with male targets. Females with high gender identity rated female-targeted jokes more gender typical than male-targeted jokes in the 1-joke and 10-joke conditions. Therefore, Hypothesis 4 was not supported, but results for Research Question 2 show the influence of the level of group identity.
Gender Typicality Ratings by Participant Gender, Joke Target Gender, Number of Jokes, and Level of Gender Identification.

Values in the same row are significantly different at p < .000 level.
Values in the same row are significantly different at p < .05 level.
Cell n = 1.
Given the prior findings regarding gender identity, level of gender identity was also included in testing the final hypothesis. There was one significant main effect: Individuals who identified highly with their gender (M = 2.41, SD = 0.82) reported more likelihood of voting for the candidate whose résumé they had read, F(1, 187) = 6.75, p = .05, η2 = .03, than those with low gender identification (M = 2.63, SD = 0.74). There were no other significant main or interaction effects. Thus, this hypothesis was not supported.
Discussion
Our findings indicated that women tended to show bias against their group on both of the outcome variables, and men showed out-group bias on the funniness variable only in the 1-joke condition. Both men and women who reported low gender identification found jokes about their gender funnier and more gender typical than those about the opposite gender, and highly identified women showed the similar pattern of in-group rejection when rating joke gender typicality. Although contrary to our hypotheses and prior work (Abrams & Bippus, 2011), the results mirror those reported in some early investigations into disparaging jokes targeting gender where women demonstrate in-group rejection (Cantor, 1976; Zillman & Cantor, 1976). Because men serve as a relative comparison group for women, when women engage in social comparison with men, they may be aware of their subordinate status. In turn, they may experience a more negative social identity, and as a result, endorse their own intellectual inferiority communicated via the joke. Jost and Banaji (1994) refer to this idea as false consciousness, or the acceptance of negative stereotypes about one’s group. The concept is derived from social dominance theory (Sidanius & Pratto, 1999), which contends that social hierarchies are maintained through ideologies that promote or sustain group-based inequities that are necessary to minimize intergroup conflict. Social dominance theory suggests that women laugh at their own expense and think the jokes are typical of themselves because they have accepted the myth, or belief, that they are intellectually weaker than men.
High gender identifiers did not demonstrate greater in-group favoritism than low gender identifiers. Although the results are contrary to our predictions, they are consistent with Hinkle and Brown’s (1990) observation that empirical support for the proposition that in-group identification is related to in-group bias is mixed. Interestingly, low identifiers of both genders found jokes funnier and more gender typical about their group than of the out-group. Low identifiers, who are not ego involved or threatened, can perhaps “take a joke” and laugh at their own expense, whereas high gender identifiers may not have been sufficiently threatened, or our individualist-autonomous sample may represent a population in which the relationship between in-group identification and in-group bias may be weak.
In an attempt to test whether jokes would induce out-group bias that is manifested in discriminatory behavior, we proposed that individuals would be less likely to vote for an out-group member following exposure to sexist jokes about the out-group. This prediction was not supported; however, the gender of the candidate may not have been made sufficiently salient to participants. In an attempt to create a realistic résumé, the gender of the candidate may not have been emphasized enough for participants to notice. If participants did not attend to the gender of the candidate when reviewing the résumé, significant effects for the likelihood of voting for the candidate would not be expected. Future research should take steps to employ a manipulation check to ensure candidate gender saliency. Also, assessing participants’ perceptions of what made the jokes funny may further illuminate the influence of sexism on their judgments. Future investigations should attempt to create a more ecologically valid joke-telling context because reading five or ten successive jokes does not replicate a realistic joke-telling environment, And, although in-group identity was the only individual difference variable examined, the literature is rife with other individual difference variables known to influence reactions to jokes, such as sex role attitudes (e.g., Butland & Ivy, 1990), sexism (e.g., Ford, 2000), cavalier humor beliefs (e.g., Hodson et al., 2010), and social dominance orientation (e.g., Thomas & Esses, 2004). Such individual difference variables may also be considered in the future. Finally, the present study examined two groups that generally like and need each other. Groups with a history of hostile intergroup conflict might show greater prejudice and discrimination than groups that enjoy a relatively peaceful coexistence, like men and women.
Footnotes
Acknowledgements
Special thanks to Howard Giles and the two reviewers who provided thoughtful evaluations of the article.
Authors’ Note
A version of this article was presented at the 2012 International Communication Association annual conference held during May 24-28, 2012 in Phoenix, Arizona, USA.
Declaration of Conflicting Interests
The author(s) declared no potential conflicts of interests with respect to the authorship and/or publication of this article.
Funding
The author(s) received no financial support for the research and/or authorship of this article.