



Abstract
The main purpose of this study was to investigate the effects on the molecular structure and the properties of soybean proteins isolate (SPI) after two modifications: (1) peracetic acid oxidative cleavage of its disulfide bonds and (2) the subsequent addition of covalently bonded glucose to the SPI containing the cleaved disulfide bonds. An appropriate amount of peracetic acid will be capable of enhancing the surface properties of SPI significantly; however, excessive oxidation can obtain undesirable results. When the concentration of peracetic acid was 0.4%, following by 35.5% of the disulfide bond cleavage, compared with those of natural SPI, the foaming capacity (FC), foaming stability (FS), emulsifying capacity (EC), and emulsifying stability (ES) of oxidized-SPI were increased by 82.0%, 65.8%, 58.5%, and 41.5%, respectively. The surface activity of oxidized-SPI could be promoted by glucose modification, and the FC, FS, EC, and ES of oxidized-SPI have further risen to 146.8%, 96.0%, 131.4%, and 40.3%, respectively, after the further glucose modification. Particle size measurements showed bimodality for the SPI that was modified with glucose with a portion of smaller sizes seen. Fluorescence spectroscopy and circular dichroism measurements demonstrate that extensibility increases; flexibility is enhanced; and glycosylation occurs more readily due to the oxidation of SPI. When grafted with glucose, these oxidized soybean protein products produce more ideal foaming and display better emulsification properties.
Introduction
From a structural point of view, the protein is composed of hydrophobic and hydrophilic amino acids. Therefore, in theory, it has a good potential to act as a surfactant. However, this potential has not been fully realized. This might be due to the fact that the disulfide bonds cause the hydrophobic areas to be generally constrained to the interior of the molecule, effectively preventing their contact with hydrophilic media like water and other solvents. This phenomenon reduces the surface activity of proteins. The disulfide bonds play a very important role in maintaining protein structure and conformational stability. This factor, however, results in the protein having poor surface activity. Therefore, to improve the surface activity of the protein, cleaving the disulfide bonds can be one advisable option. The disruption of disulfide bonds can cause the structures of proteins to become loose and can allow for exposure of the internal structures. This may lead to an improvement in the surface activity of the protein. 1 It was reported that disulfide bonds can be broken to sulfonic acid by oxidation using peroxyformic acid without any significant damage to the protein structure because cystine reacts with five atoms of oxygen and forms cysteic acid. 2 Hirs also found that when chloride-free ribonuclease is oxidized with peroxyformic acid, cystine is transformed to cysteic acid and methionine to the sulfone, but no other amino acids are significantly affected. 3 In a study of bovine serum albumin (BSA), it was found that the emulsifying stability of natural BSA was poor. The emulsion stability of BSA was improved with an increase of disulfide bond cleavage. As the disulfide bonds in BSA were cleaved, the protein structure expanded. This caused the protein to unfold to be better adsorbed in the oil–water interface, greatly improving the emulsifying activity of BSA. Klemaszewski also found that the surface activity of whey protein increased with an increase in disulfide bond cleavage. 4
Soybeans are one of the main raw materials for producing oil, and they also are one of the main sources of plant proteins. 5 Because soybeans are cheap and readily available, researchers are beginning to focus on different ways to develop and utilize soy proteins. Soybean proteins isolate (SPI) is a mixture of various proteins, the main ingredients are classified into 2S, 7S, 11S, and 15S according to their sedimentation coefficients, and 7S (β-conglycinin) and 11S (glycinin) represent more than 80% of them. 6 7S molecule has 0 –SH radical and 2 disulfide bonds per molecule, respectively; in contrast, 11S molecule has 2 –SH radicals and 20 disulfide bonds per molecule, respectively. 7 Disulfide bonds play an important role both in maintaining the structure of soybean proteins and in determining some of their physicochemical properties. Reduction of these bonds may improve the functional properties, leading according to the protein species to an increase in solubility; this, in turn affects properties such as gelation, foaming, and emulsification. 8 Natural glycinin (11S) is known to have a compact structure stabilized by disulfide bonds and thus its emulsifying and foaming ability is lower than that of β-conglycinin (7S) which lacks disulfide bonds. 5 However, natural SPI as a surface active molecule is generally recognized to be less efficient when compared with many other proteins or modified proteins, such as casein and whey proteins. 9,10 In addition, it was reported that the glycation could facilitate unfolding and intermolecular bond formation in the adsorbed protein molecules onto an oil–water interface, which could strengthen the emulsifying activity of proteins. 11,12 Our previous results showed that chitosan could stabilize the molecular structure of oxidized-SPI and improve its surface activity. 13 Therefore, we try to modify SPI with peracetic acid and glucose to expose the nonpolar groups wrapped inside the molecule to the surface of SPI to improve its surface activity and to provide a novel and environmentally friendly way of improving the surface properties of soybean proteins.
Materials and methods
Materials
Defatted soybean meal was purchased from Henan Kunhua Biotechnology Co., Ltd (Henan, China); ortho-phthaldaldehyde (OPA) and glutathione were purchased from Sigma Company (Shanghai, China); peracetic acid, 5′,5′-dithiobis-(2-nitrobenzoic acid) (DTNB), disodium 2-nitro-5-thiosulfobenzoate (NTSB), sodium dodecyl sulfate (SDS), and the other chemicals were purchased from Guangzhou Xilong Chemical Co. Ltd (Guangzhou, China).
Preparation of samples
Preparation of natural SPI
The method developed by Samoto, somewhat revised, was used to prepare SPI. 14 Defatted soybean meal was ground through an 80-mesh sieve and mixed with water at a 1:10 mass-to-volume ratio. The pH was adjusted to 8.0 with 2.0 M NaOH solution. After stirring for 2 h, the resulting suspension was centrifuged at 8000 × g for 20 min at 4°C to remove the insoluble material. Then, the pH of the supernatant was adjusted to pH 4.5 with 2.0 M HCl, and the precipitate was collected by centrifugation at 5000 × g, for10 min at 4°C. The precipitate was then redissolved in five-fold deionized water and the pH was adjusted to 7.0 with 2.0 M NaOH. The nautral SPI solution was frozen at −18°C and then freeze-dried using a freeze drier. The freeze-dried samples were then stored at 4°C until use.
Preparation of oxidized-SPI with different concentration of peracetic acid
An SPI solution (25 mg/L, 50 mL) was prepared by dissolving SPI in 0.1 M phosphate-citric acid buffer (pH = 2.4). Then, peracetic acid was added to each SPI solution to make the concentration of peracetic acid reach 0%, 0.2%, 0.4%, 0.6%, 0.8%, 1%, 1.2%, 1.4%, 1.6%, and 1.8% (v/v), respectively. The mixtures were agitated at −4°C in the dark for 12 h. The obtained samples are to be tested or freeze-dried.
Glycation of the oxidized-SPI based on different oxidization
The oxidized-SPI solutions (derived from SPI treated with 0%, 0.2%, 0.4%, 1%, 1.4%, and 1.8% peracetic acid, respectively.) were mixed with glucose (oxidized-SPI: glucose = 1:2, w/w). The mixtures were agitated for 10 min and then were added into a 50 mL stoppered tube at 90°C for 1 h. Once the reactions are finished, these samples were put in ice water bath for cooling immediately to be measured.
Determination of the disulfide bond content
The method developed by Ellman et al., somewhat revised, was used for the spectrophotometric analysis. 15 The method was used for generating the standard curve: 0.1% DTNB reagent, 0.1% NTSB reagent and 2 mg/mL glutathione standard solution were prepared. The glutathione concentration was determined using the standard curve of absorbance. The standard curve was generated and yielded the following formula (1)

Thiol concentration in oxidized-SPI was calculated according to equation (2)

where 307.32 is the molecular weight of glutathione
Disulfide bond cleaving rate of oxidized-SPI was calculated according to equation (3)

where ∂ is the disulfide bond cleaving rate, x 1 is the disulfide bond content before modification, and x 2 is the disulfide bond content after modification.
Determination of free amino content and the degree of glucose grafting
OPA 16 method, somewhat revised, was used to determine the content of free amino groups. The OPA reagent was prepared by mixing OPA (40 mg) in 1 mL of methanol, 2.5 mL of 20% (m/v) of SDS in methanol, 25 mL of 0.1 M sodium borate in methanol and 100 µL β-mercaptoethanol. The resulting mixture was diluted to 50 mL with deionized water and samples of the protein solution (200 µL) were added to 4 mL portions of the OPA reagent, respectively, in water bath at 35°C, and the absorbency was measured at 340 nm. The degree of glucose grafting was calculated according to equation (4)

where σ is the degree of glucose grafting, ε1 is the free amino content before modification, and ε2 is the free amino content after modification
Foaming capacity and foaming stability
The method developed by Hu et al., somewhat revised, was used to measure Foaming capacity (FC) and foaming stability (FS). 17 The oxidized-SPI or glycose-oxidized-SPI solutions (10 mL) were diluted to 50 mL with deionized water and were subjected to a high-speed shear mixer at 10,000 revolutions/min for 1 min. The above solutions were rapidly transferred into a 100-mL graduated cylinder, and the initial bubble volume (V 0) was recorded. After standing at room temperature (25°C), the bubble volume was recorded again at 30 min (V 30). FC and FS were calculated using formulas (5) and (6)


Emulsifying capacity and emulsifying stability
The method developed by Molina et al., somewhat revised, was used to measure emulsifying capacity (EC) and emulsifying stability (ES). 18 The oxidized-SPI or glycose-oxidized-SPI solutions (15 mL) were mixed with 5 mL of soybean oil and 25 mL of deionized water. The mixture was emulsified with a high-speed shear mixer at 10,000 revolutions/min for 1 min. A 20-µL aliquot of the solution was taken at 0 min and at 30 min after the emulsification. Then, 20 µL of the SPI was mixed with 5 mL of 0.1% SDS (m/v) dissolved in tube. A Cary-60 UV-Vis spectrophotometer was used to measure the absorbance of the resulting solutions at 500 nm. The EC and ES were calculated using formulas (7) and (8)


where T = 2.303, N is the dilution factor of 250, c is the protein concentration before mixing (g/mL), ϕ is the volume fraction of the oil phase in the emulsion (0.25), A 0 is the absorbance value at 0 min and A 30 is the absorbance value at 30 min.
Fluorescence spectrum
The intrinsic fluorescence of different samples was determined at an excitation wavelength of 290 nm. The excitation slit was set at 5 nm, and the emission slit was at 3 nm. Scanning range: 300–420 nm; scanning speed: middle.
Particle size distribution
The method developed by Huang, somewhat revised, was used to research the particle size distribution of SPI. 19 A Malvin nanoparticle size distribution meter was used to measure particle size distribution of each sample at room temperature using a wavelength of 623 nm and a scattering angle of 90°.
Circular dichroism spectra
The circular dichroism (CD) spectrum of the sample solution was performed at 25°C in a 1-mm colorimetric dish. The following conditions were used: wavelength scanning range 180–260 nm, scanning speed 100 nm/min, response time 0.25 s, bandwidth 0.1 nm, and sensitivity 10 mdeg/cm. The relative content of secondary structural conformation for natural and modified SPI were obtained from the CDpro software (Version 2.1).
Statistical analysis
The results were expressed as mean ± SD of at least three independent observations. Analysis and graphic presentations were prepared using Origin software (version 8.0, OriginLab, Northampton, USA). Statistical analysis was performed using SPSS (version 22.0, New York, USA) using analysis of variance (ANOVA) with significant differences determined by the least significant difference (LSD) test. Significance was assumed at p < 0.05.
Results and discussion
Controlled oxidation using peracetic acid to disconnect disulfide bonds
Although our previous work has shown that peroxyformic acid can oxidize the disulfide bond of soybean protein very well, 13 peroxyformic acid is not safe enough because peroxyformic acid may further decompose into toxic formic acid. Peracetic acid also has stronger oxidation capacity and more moderate reaction compared with hydrogen peroxide. 20 Thus, we try to modify SPI with peracetic acid to change the molecular structure of SPI and improve its surface activity. Peracetic acid can oxidize the disulfide bonds and lead to the cleavage of disulfide bonds in protein. As shown in Figure 1, it is clear that the percentage of disulfide bonds decreases with the increase of the peracetic acid concentration. However, only when the concentration of peracetic acid is 0.2%, 0.4%, 1%, 1.4%, and 1.8%, respectively, does the disulfide bond cleavage change significantly. This may be related to the distribution of disulfide bonds in globular proteins. The disulfide bonds distributed in the shallow layer of the molecule are easy to be oxidized, while the disulfide bonds distributed in the deep layer of the molecule are not easy to be oxidized. For a protein disulfide bond, the cleaving reaction may occur only when peracetic acid reaches a certain concentration. This may make the disulfide bond cleavage of protein not obvious at a certain peracetic acid concentration. Therefore, we selected the oxidized-SPI treated with 0.2%, 0.4%, 1%, 1.4%, and 1.8% peracetic acid as samples for further study in this article.

Percentage of disulfide bond cleavage of SPI. Different letters on the top of the symbol of the line indicate significant (p < 0.05) differences among samples treated under different conditions.
Determination of free amino content and the degree of glucose grafting
As shown in Figure 2, with the increase of peracetic acid concentration, the content of free amino group in the oxidized-SPI increased gradually, but the content of free amino group decreased when the content of peracetic acid exceed 1.4%. The disulfide bond cleavage increased gradually, and the new free amino groups of SPI also increased gradually along with the increase of peracetic acid concentration from 0 to 1.4%. However, under a high peracetic acid concentration of 1.8%, free amino groups may decrease due to a deamination 21 or a spontaneous amino–carbonyl reaction between a free amino group and a carbonyl group of SPI. 22 As shown also in Figure 2, the amino–carbonyl reaction between glucose and free amino group results in a rapid decrease in the free amino group of oxidized-SPI. These results also indicate that oxidized-SPI is more suitable for glucose to react with free amino group than natural SPI, because disulfide bond cleavage makes SPI’s molecular structure become looser and more free amino groups be exposed.

Free amino groups content changes of oxidized-SPI contained in the absence and presence of glucose. According to the free amino group content changes, the glucose grafting degree of corresponding oxidized-SPI was calculated as follows: 5.19%, 19.26%, 20.11%, 19.32%, 18.97%, and 18.33%, respectively. Different letters on the top of the symbol of the line indicate significant (p < 0.05) differences among samples treated under different conditions.
FC and FS
As shown in Table 1, with the increase of oxidation degree, the FC of oxidized-SPI and glucose-oxidized-SPI increased first until the concentration of peracetic acid reached 0.4% and the percentage of disulfide bond cleavage reached 35.5% and then decreased gradually. However, the FS of oxidized-SPI increased slightly until the peracetic acid concentration reached 0.4%. On the contrary, excessive oxidation led to a decrease in FC of SPI, but it had no obvious influence on FS of SPI. When the concentration of peracetic acid was 0.4%, following by 35.5% of the disulfide bond cleavage, the FC and FS of the oxidized-SPI increased by 82.0% and 65.8%, respectively, compared with those of the natural SPI. Glucose grafting modification can further improve FC and FS of oxidized-SPI. These results indicated that both of the oxidized-SPI and glucose-oxidized-SPI have been improved in FC and FS in some extent actually due to the structure and amphiprotic group distribution changes in molecular induced by the disulfide bond cleavage. On the one hand, the loosen structure and the more internal hydrophobic groups exposed to the molecular surface induced by oxidization of peracetic acid led to an improvement on surface activity. On the other hand, the introduction of glucose that possesses lots of hydroxyl groups can make it more balanced between hydrophobic groups and hydrophilic groups, which led to good surface properties. With 20.11% of the glucose grafting degree, the FC and FS of the glucose-oxidized-SPI increased by 146.8% and 96.0%, respectively, compared with those of natural SPI.
FC, FS, EC, and ES of oxidized-SPI and glucose-oxidized-SPI with different peracetic acid concentration.a

ES: emulsifying stability; EC: emulsifying capacity; FS: foaming stability; FC: foaming capacity; SPI: soybean proteins isolate.
aEach value represents the mean standard deviation (n = 3). Different letters indicate significant (p < 0.05) differences among samples treated under different conditions.
EC and ES
As also shown in Table 1, the EC and ES of oxidized-SPI or glucose-oxidized-SPI increased first and then decreased gradually with the increase of oxidation degree similar to the changes of FC. The emulsifying properties of SPI gradually increased when the concentration of peracetic acid was under 0.4%. When the concentration of peracetic acid was 0.4%, EC and ES of oxidized-SPI were the highest and increased by 58.5%, 41.5%, respectively, compared with those of natural SPI. While excessive oxidation led to a decrease in emulsifying properties of SPI. Glucose grafting modification can further improve emulsifying properties of oxidized-SPI. As previously stated, the peptide chain in the protein molecule increases with increasing the extent of oxidation and the structure becomes loose. 23 Due to the loosen structure of oxidized-SPI, it is easier for glucose to get into the interior of SPI and react with the reactive groups there and cause the hydrophobic groups in the molecule to be exposed to the polar environment, reducing the surface tension of the solution. Therefore, the protein molecules are more readily dispersed in the oil phase which increases the water/oil interface area and improves its EC and ES. However, if the disulfide bonds are over-cleaved and more lipophilic amino acids are exposed, this would lead to a decrease in conformational stability of the protein molecule and a significant change in water–oil interface surface area. Therefore, EC and ES of oxidized-SPI are weakened due to excessive oxidation. Under the condition of 20.11% of the glucose grafting degree, EC and ES of the glucose-oxidized-SPI increased by 131.4% and 40.3%, respectively, compared with those of natural SPI.
Determination of fluorescence spectra
Intrinsic fluorescence of proteins is caused by aromatic amino acids like tryptophan (Trp). And since Trp is highly sensitive to local environment, fluorescence emission of Trp is commonly used as an indicator of conformational changes of protein. Therefore, the average of exposed Trp residues in the aqueous phase effects maximum emission of protein. 24
Glycinin can exhibit a fluorescence emission spectrum with a maximum at 330 nm. 25 Figure 3 showed that all samples had a maximum emission at around 330 nm and a similar spectral change. However, only the fluorescence intensity of samples derived from SPI treated with peracetic acid from 0.2% to 0.4% was stronger than that of natural SPI, while the fluorescence intensity of samples derived from SPI treated with peracetic acid from 1.0% to 1.8% was weaker than that of natural SPI. These results indicated that the molecular structures of SPI did have changed dramatically due to the oxidative destruction of disulfide bonds, which caused more tryptophan residues in the molecule to be exposed and led the fluorescence intensity of samples derived from SPI treated with peracetic acid from 0.2% to 0.4% increase. However, over-oxidation can cause unfolded polypeptide chains to refold or form insoluble aggregation. 25,26 This will make the exposed tryptophan be buried inside molecule again, resulting in the weakening of the fluorescence intensity of samples derived from SPI treated with peracetic acid from 1.0% to 1.8%. In addition, the covalently bonded glucose shields residues such as tryptophan and can reduce the fluorescence intensity. In some cases, it even causes the fluorescence to disappear. Moreover, we can conclude that, according to the previous researches, 27,28 a higher grafting degree leads to stronger shielding effects and a greater degree of fluorescence quenching.

Fluorescence spectra of the oxidized-SPI with different percentage of disulfide bond cleavage and the corresponding oxidized-SPI with different glucose grafting degree.
Determination of CD spectra
CD spectrum is an excellent tool for rapid determination of the secondary structure and folding properties of proteins. 29 For example, α-helical proteins have the characteristics of negative bands at 222 nm and 208 nm and a positive band at 193 nm, 30 while proteins with well-defined antiparallel β-pleated sheets (β-sheets) have negative bands at 218 nm and positive bands at 195 nm, 31 and disordered proteins have very low ellipticity above 210 nm and negative bands near 195 nm. 32 The observed protein CD spectrum is an average of CD signals from all conformations and reflects the geometric variability in the secondary structure. 33 The changes in the relative content of secondary structural conformation (α–helix, β-sheet, β-turn, and random curling) in protein molecule can reflect changes in the tertiary structure of the protein molecule. The far-UV CD can be used to determine the trends for the secondary structures of SPI. As shown in Figure 4(a) and Table 2, the natural SPI showed a strong positive peak at 194 nm and a negative double peak at 208 and 222 nm, indicating that the natural SPI has a typical α-helical structure. With the increase of peracetic acid concentration, the negative peak appeared at 205 nm to 215 nm, the positive peak appears at 193 nm, and both the positive peak and negative peak showed an increase in intensity. This phenomenon indicated that the α-helix increases first and then decreases gradually, and the β-sheet increases gradually with increasing the extent of oxidation. It can be observed from Figure 4(b) and Table 2, a positive peak appears at 190 nm after the addition of glucose. In addition, there were peaks at 198 nm and weak negative peaks at 230–240 nm, indicating that the molecular structure of oxidized-SPI modified by glucose became more disordered. All showed that the content of α-helical structure decreases by varied degrees. The amount of β-sheets also increase by varying degrees, indicating that the flexibility of the protein has been further enhanced and the adsorption at the oil–water interface becomes more favorable. The relative content of secondary structural conformation for natural and modified SPI was listed in Table 2, respectively.

(a) CD spectra of the SPI with different concentration of peracetic acid (1-6: 0.0%, 0.2%, 0.4%, 1%, 1.4%, and 1.8%, v/v). (b) CD spectra of the corresponding oxidized-SPI with glucose grafting (glucose grafting degree a–f: 5.19%, 19.26%, 20.11%, 19.32%, 18.97%, and 18.33%).
The content of secondary structural conformation of oxidized-SPI and glucose-oxidized-SPI with different peracetic acid concentration.

SPI: soybean proteins isolate.
Measurements of particle size distribution
The experimental results (Figure 5) showed that peracetic acid has changed the protein structure of SPI. Natural SPI particle sizes are distributed between 0 and 600 nm. With the addition of 0.2% and 0.4% peracetic acid, the particle sizes of SPI were mainly distributed between 90 and 230 nm, and the particle size becomes obviously smaller. This was due to the peracetic acid oxidation that caused the cleavage of the disulfide bonds in the protein molecule, resulting in the depolymerization of the protein molecules. The particle sizes seen in oxidized-SPI with the addition of 1%, 1.4%, and 1.8% peracetic acid were mainly distributed between 200 and 500 nm, indicating that the excessive oxidation can cause the unfolded polypeptide chains to fold again into larger aggregates due to the refolding and assembly induced by the protein interactions and electrostatic interactions without enough disulfide bond support. As also shown in Figure 5, a few new small particles and a bimodal map emerge in all samples after reacting with glucose. These results showed that all SPI can graft with glucose, but the graft degree of different protein samples varies with the molecular structure. Glucose grafting modification could prevent the unfolded polypeptide chains caused by peracetic acid oxidation to fold again to form larger particles. The appropriate degree of disulfide bond cleavage is beneficial for protein to graft with glucose.
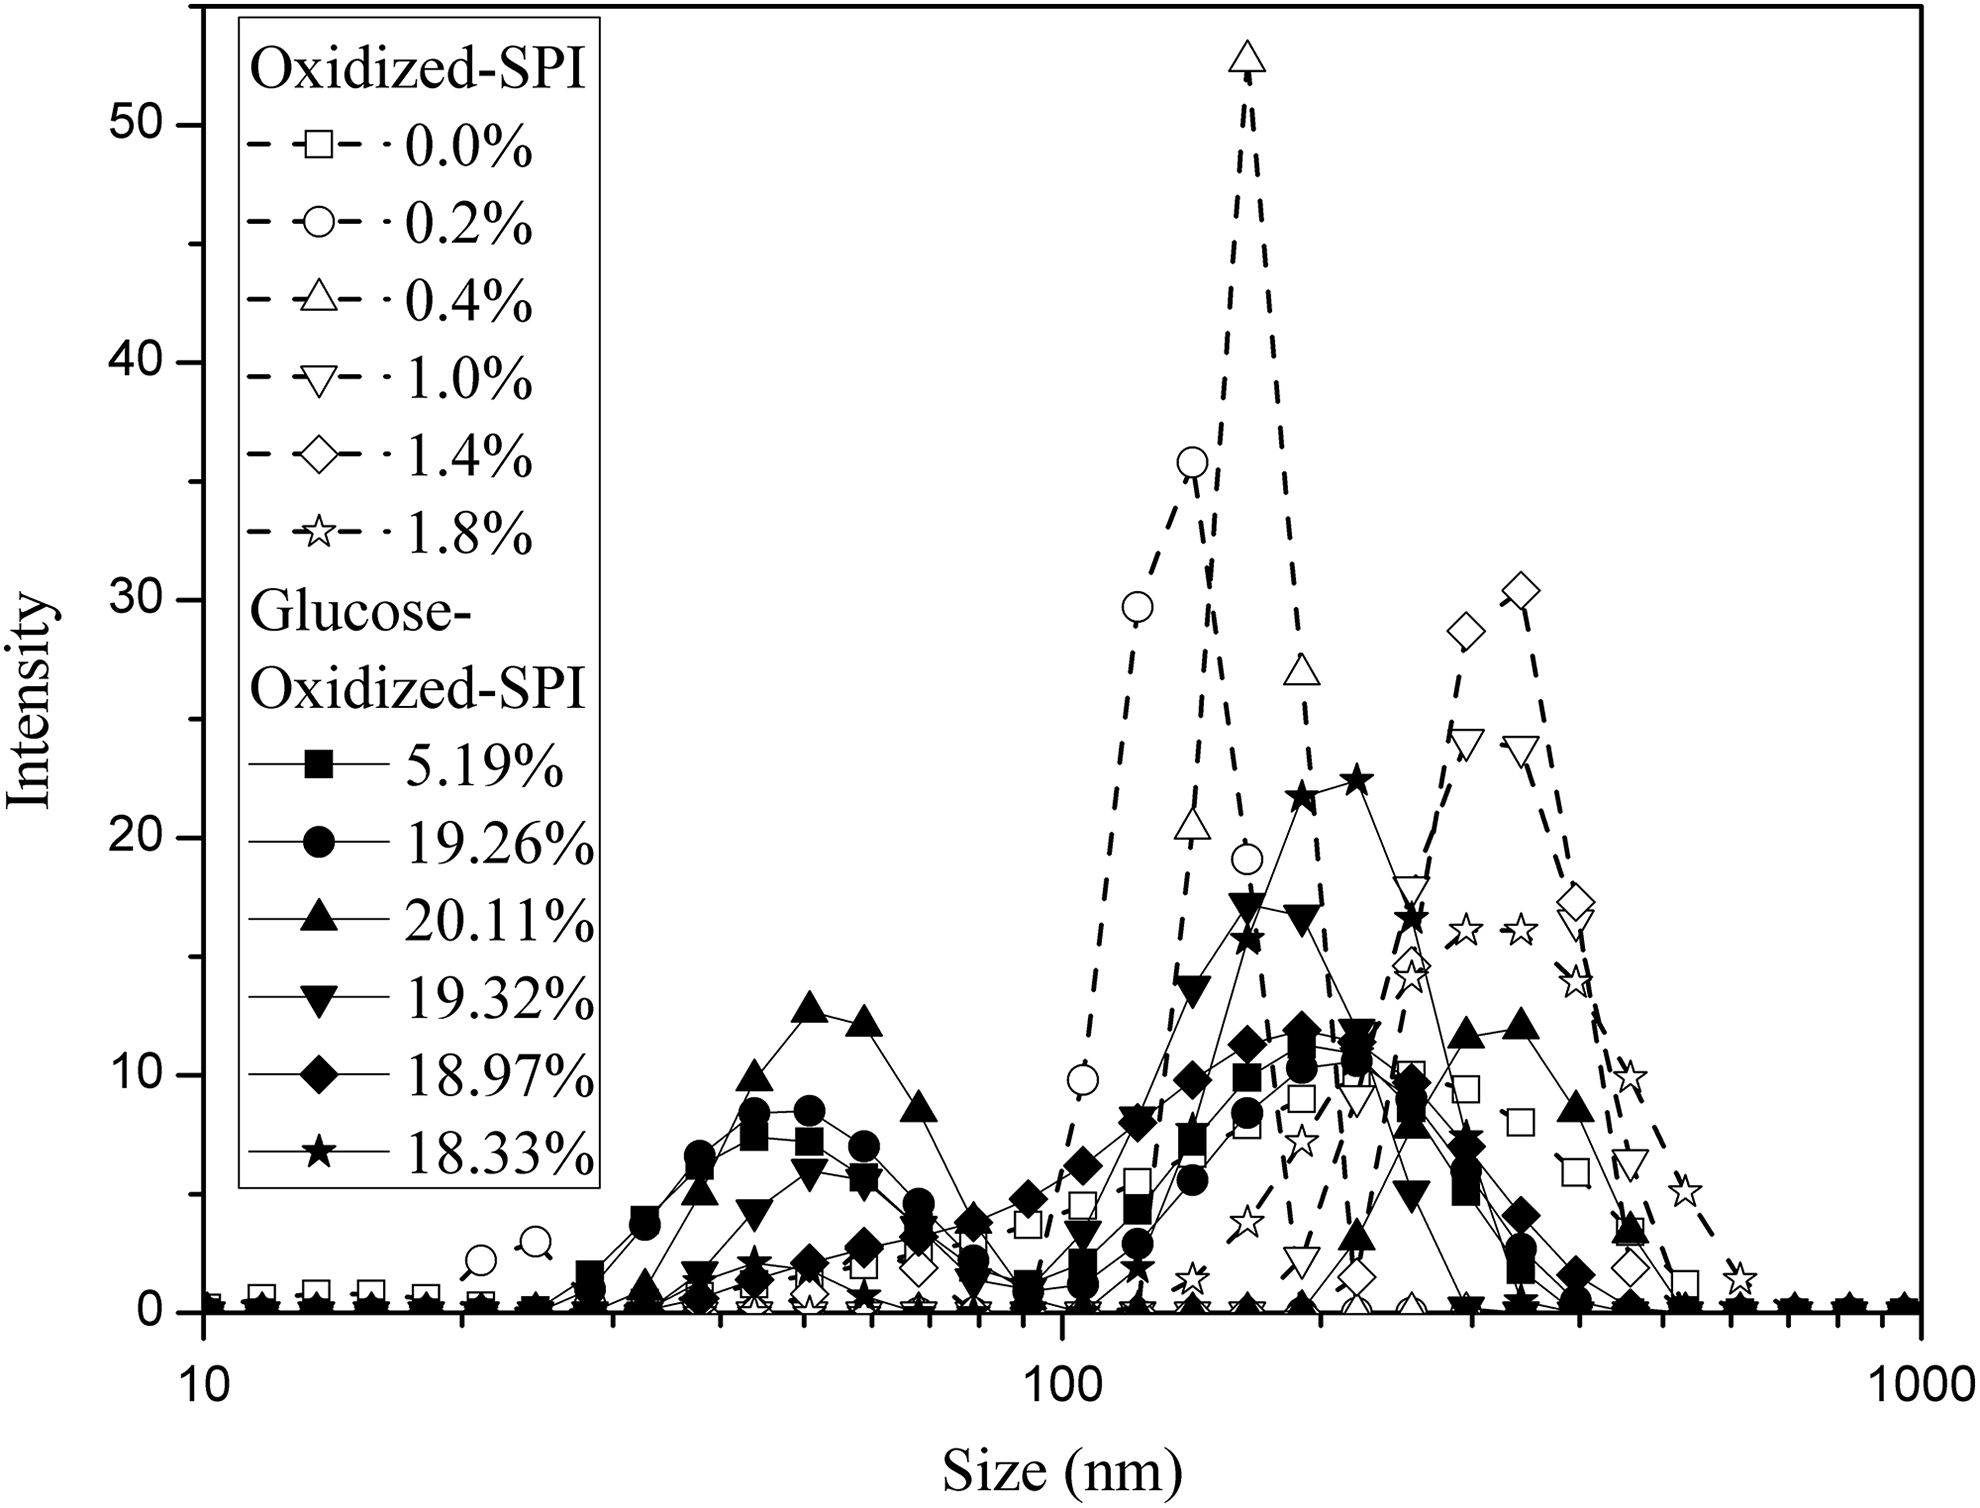
Particle size distribution of the SPI with different concentration of peracetic acid (0.0%, 0.2%, 0.4%, 1%, 1.4%, and 1.8%, v/v) and particle size distribution of the corresponding oxidized-SPI with glucose grafting (glucose grafting degree: 5.19%, 19.26%, 20.11%, 19.32%, 18.97%, and 18.33%).
Conclusions
Different concentrations of peracetic acid were used to oxidize the SPI and then reacted with glucose, which changed the structures and surface properties of SPI. It was found that the covalent bonds, disulfide bonds, were cleaved by peracetic acid, which loosened the structures of the peptide chains and made it easy for glucose to undergo a glycosylation reaction with the oxidized-SPI. Therefore, appropriate amount of peracetic acid will be capable of enhancing the surface properties of SPI significantly; however, excessive oxidation can obtain undesirable results. Above all, glucose should be an excellent adjuvant to improve the surface properties of SPI. Moreover, the fluorescence spectra indicated that the SPI structure was changed due to the oxidation, which led to more tryptophan residues in SPI exposed. The CD measurements also demonstrated that the α-helix decreased, and the β-sheet increased due to the oxidation, which might lead to an increase of SPI’s extensibility and flexibility. The determinations of particle size showed that the oxidation did make difference in the particle size. Peracetic acid is a safe processing agent, since peracetic acid is easily decomposed into oxygen and acetic acid, and no harmful components are produced after the reaction. This research provided a novel and environmentally friendly way of improving the surface properties of soybean proteins.
Footnotes
Declaration of conflicting interests
The author(s) declared no potential conflicts of interest with respect to the research, authorship, and/or publication of this article.
Funding
The author(s) disclosed receipt of following financial support for the research, authorship, and/or publication of this article: This research was financially supported by the National Natural Science Foundation of China (grant number 21466006, grant number 31660473).
