



Abstract
Polypropylene/carbon black (PP/CB) and PP/CB/multiwalled carbon nanotube (PP/CB/MWCNT) composites were fabricated by solid and foam injection molding, with the goal of enhancing the electrical conductivity of the composites while decreasing the cost of the final product. The foaming behavior and through-plane (T-P) electrical conductivity of the composites were characterized and analyzed. Cell growth increased the interconnection of the conductive fillers, changed the filler orientation, and enhanced the T-P electrical conductivity of the composites. Under appropriate processing conditions (200°C melt temperature, 70 cm3/s injection flow rate, and 5% void fraction), the T-P electrical conductivity of the foam PP/CB composites was 5 orders of magnitude higher than that of the solid composites (from 5.877 × 10⁻¹² S/m to 1.010 × 10⁻⁷ S/m). Moreover, the T-P electrical conductivity values of the PP/CB and PP/CB/MWCNT were compared at the same conductive fillers content (15 wt%). The results showed that the T-P electrical conductivity of the PP/CB/MWCNT composites was far higher than that of the PP/CB composites by almost five orders of magnitude because the MWCNT acted as a bridge between CB particles, and a unique geometric shape was formed in the system. The T-P electrical conductivity of the foam PP/CB/MWCNT composites with 15 wt% carbon fillers was higher than that of the solid PP/CB composites with 20 wt% carbon fillers. This study reveals that the effect of foaming and the addition of hybrid fillers can improve the T-P electrical conductivity of plastic products, which is very important for the development of lightweight conductive plastics.
Keywords
Introduction
In recent years, conductive polymer composites (CPCs) have been considered an important type of polymer material. In laboratory studies, CPCs have been used in sensors, electromagnetic interference shielding, and antistatic equipment. 1 -4 Moreover, they are commonly used to replace traditional metal-based conductive materials due to their extraordinary performance, including easy processing, extreme corrosion resistance, good flexibility, and lightweight. 5,6 The rapid development of fuel-based plastics in recent decades has led to increased pollution and potential environmental and ecological problems. 7,8 Thus, there is an urgent need in industry for lightweight composites with a high electrical conductivity, although their preparation is significantly challenging.
Large amounts of materials are being investigated for use as conductive fillers, such as carbon fiber (CF), 9,10 carbon black (CB), 11,12 stainless steel fibers, multiwalled carbon nanotube (MWCNT), 13,14 and graphene. 15 Conventional conductive fillers include low aspect ratio powders, such as CB. To achieve excellent electrical conductivity, 25–50 wt% CB content has been added to the composites. A high filler content leads to poor mechanical properties, high cost, and processing difficulties. 16 Nanofillers, such as carbon nanotubes (CNTs) and MWCNT, that act as conductive fillers offer important advantages over CB, namely a high aspect ratio and superior electrical conductivity, which implies that a low content of CNTs or MWCNT has been added to the composites. 17,18 Thus, they establish efficient conductive paths in composites. For instance, the electrical conductivity of composites with 0.5 wt% CB was approximately 1 × 10⁻¹² S/cm. For the same range of filler content, the electrical conductivity of composites with CNTs was approximately 1 × 10⁻⁸ S/cm, which is an increase of approximately five orders of magnitude. 19 However, their high price and easy agglomeration have a negative impact on their application.
Many studies have been performed to improve the final electrical properties of CPCs with low filler content. Some authors presented the double percolation technique, 20 -22 in which a two-phase (immiscible) polymer blend was used in composites. In this case, conductive fillers were alternatively distributed in one continuous phase or at the interface of the immiscible blend, which enhanced the formation of conductive paths. 23 For example, Pan et al. reported a double percolation structure of poly(methyl methacrylate)/polystyrene/CB (PMMA/PS/CB). A co-continuous structure of the CB particles located in the PS phase was obtained by changing the PS/PMMA ratios; the lowest electrical percolation threshold was shown to occur at 1.26 vol% CB. 24 Other authors proposed a grape-cluster-like structure conductive network containing hybrid fillers (Figure 1). 25 For example, Wu et al. introduced MWCNTs into CB-based polymer matrices to significantly enhance the electrical conductivity, in which the MWCNT acts as a “bridge,” linking CB particles and forming an excellent conductive network. 26 Alternatively, cell structures have been implemented in composites (Figure 2). 27 -29 Park et al. prepared microcellular foam polypropylene/CF (PP/CF) composites using supercritical nitrogen gas. The foaming enhanced the electrical conductivity by approximately six orders of magnitude. 30 However, it has been used in a research laboratory for batch foaming systems and is difficult to scale-up to industrial production. 8,31 -33
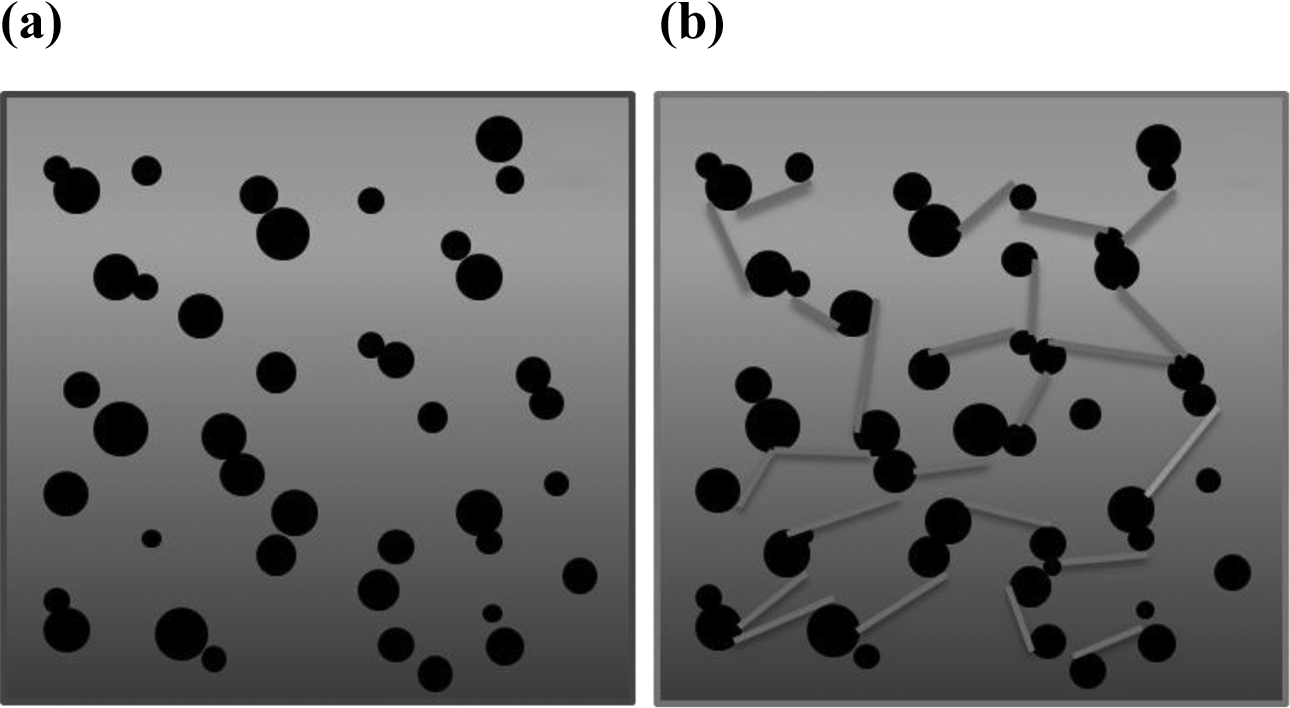
Schematics of conducting networks in composites containing hybrid fillers of CB and MWCNTs: (a) CB only and (b) hybrid fillers of CB and MWCNT. The black dots and the solid curves represent CB and MWCNT, respectively.

Schematic showing the CB alignment: (a) and (b) solid and foam samples, respectively, are represented.
Injection molding is a widely used processing method in the plastics industry due to its cost-effective and short molding cycle and the ability to form complex parts. 34 However, one of the great challenges for injection-molded conductive composites is the anisotropic electrical conductivity due to the orientation of conductive fillers in the flow direction. Based on previous research outcomes, we selected foam injection molding to enhance the through-plane (T-P) electrical conductivity. Foaming can enable the CPCs to exhibit additional unique properties, such as thermal and sound insulation and a lightweight. 35 -37 Importantly, foaming can enable CPCs to exhibit excellent electrical conductivity. 15,5,38 This is because the growth of the cell can significantly increase the filler-to-filler connectivity and effectively disturb the orientation of the filler in the flow direction, resulting in the formation of conductive networks in the thickness direction. 39 Furthermore, conductive fillers, such as CNTs and MWCNT, can provide additional nucleation sites during foaming injection molding; thus, the gas also prevents filler clustering and improves the dispersion and distribution of the filler. 40,41
To fabricate lightweight and high conductivity composites, foam injection molding was applied in this work. We conducted an experimental study to investigate the relationship between the microstructure and electrical conductivity. First, foam samples with different microstructures were obtained by adjusting process parameters (injection flow rate, melt temperature, and void fraction), and the relationship between the electrical conductivity and microstructure was studied. Furthermore, we investigated the effect of hybrid fillers on the T-P electrical conductivity of the composites, and the correlation between the microstructure and T-P electrical conductivity was also determined.
Materials and methods
Materials
PP (K8003) was supplied by Dushanzi Petrochemical Company (Xinjiang, China) and had a specific gravity of 0.9 g/cm3 and a melt flow index of 2.5 g/10 min (230°C and 2.16 kg). The chemical blowing agent (CBA) used was azodicarbonamide. Its decomposition temperature was in the range of 180–210°C. The gases released during decomposition were N2 (65%), CO (25%), CO2 (5%), and NH3 (5%). In this study, the CBA content in the composites was 4 wt%. The PP-MWCNT masterbatch used in this study was supplied by the Institute of Organic Chemistry at the Chinese Academy of Sciences, China. The PP-MWCNT masterbatch contained 25 wt% MWCNT. The diameter and length ranged between 5 nm and 15 nm and between 10 µm and 30 µm, respectively. The special surface area is 500–700 m2/g. The PP-CB masterbatch supplied by Donghe New Material Technology Co. Ltd (Dongguan, China) has 50 wt% CB. The average particle size is about 25 nm.
Experimental methods
The PP/CB composites were prepared through the blending of masterbatch with PP resin using twin-screw extruder (Nanjing Jie Ente Mechanical and Electrical Co., Ltd, China). First of all, the PP-CB masterbatch was crushing by a plastic crushing machine (YongkangAizela Electric Co. Ltd, China). Secondly, prior to compounding, both PP resin and masterbatch were dried at 80°C for 4 h to remove all of the moisture. Thirdly, compounding was conducted at a rotational speed of 120 r/min and a feeding rate of 1.6 kg/h. The temperature profiles of the barrel from the hopper zone to the die were 150°C, 160°C, 170°C, 180°C, and 190°C, respectively. For comparison purposes, PP/CB/MWCNT was also processed under the same conditions.
Then, a J110AD-2 M injection molding machine (JSW, Japan) was employed to conduct the foam injection molding. An injection mold with a rectangular mold cavity was used to prepare all samples. The cavity shape is shown in Figure 3. To clarify the foaming behavior, the processing parameters (melt temperature, injection flow rate, and void fraction) were varied in the experiments. During the examination of one variable, the others were set to the base values (an injection flow rate of 70 cm3/s, a melt temperature of 200°C, and a void fraction of 5%). Table 1 summarizes the fixed and varied processing parameters, respectively, used in the injection molding of solid and foam samples.

Sample shape and electrical conductivity test area.
The processing parameters for both solid injection molding and foam injection molding samples.

N/A = not applicable.
a Base value: used when other parameters were varied.
Microstructure characterization
The microstructure of the foam samples was examined using scanning electron microscopy (SEM) on a Quanta 200 system (Japan Electronics Corporation). The cell size, cell density, and solid layer thickness of the foam sample were measured by Image-Pro plus software 6.0 (Media Cybernetics, Inc.) using the SEM images. Note that all cell densities, cell sizes, and solid layer thicknesses were calculated from at least four pictures.
The cell density was calculated using the following equation: 15

where NC is the cell density, n is the counted cell number in the area of A (cm3), and ρf and ρs are solid and foam densities, respectively. ρf was determined by water displacement method according to ASTM D854-02.
Electrical conductivity measurement
The electrical conductivity of the CPCs was determined by the volume resistivity method with an appropriate apparatus (ZC36, Shanghai Precision & Scientific Co. Ltd, People’s Republic of China). The solid and foam composites were cut into samples with dimensions of 10 × 10 × 4 mm3. A silver conductive adhesive was then coated on the surface of the samples to ensure sufficient contact between the samples and the copper electrode, as shown in Figure 4.

Schematic of the electrical conductivity measurement. (a) Test method used to measure the through-plane electrical conductivity in the thickness direction. (b) Test method used to measure the electrical conductivity in the flow direction.
The electrical conductivity was calculated as follows: 42

where δv is the electrical conductivity of the samples, R is the electrical resistance of the samples, S is the area of contact between the samples and the copper electrode, and L is the distance between the two electrodes. To obtain an accurate electrical conductivity, at least six solid or foam samples were measured.
Results and discussion
Microstructure effect on T-P electrical conductivity
The study of the electrical conductivity of foam systems is essential to understand the relationship between microstructure and electrical conductivity, and it provides an effective tool for prepared lightweight conductivity composites. Previous studies have shown that foam not only reduced the weight of samples but also improved its electrical conductivity.
Solid and foam PP/CB composites with different CB contents were prepared. Figure 5 illustrates the T-P electrical conductivity of the solid and foam samples with different CB contents. At low CB contents, the CB is far apart from each other and the electrical conductivity is restrained by the insulated matrix, resulting in a poor electrical conductivity. As the CB content is gradually increased, composite undergoes a transition from the insulative to conductive behavior near the electrical percolation threshold due to several charge transport mechanisms, namely conduction, hopping, and tunneling. As shown in Figure 5, The T-P electrical conductivity increased with increasing CB content in the solid and foam samples. Moreover, an electrical percolation zone was observed in the CB content range of 15–20 wt% for the solid samples. The electrical percolation zone was observed in the CB content range of 10–15 wt% for the foam samples. Compared with the solid samples, the T-P electrical conductivity of the foam samples was significantly improved. This clearly demonstrated that electrical conductivity improved significantly through foam injection molding. Figure 5 shows that the T-P electrical conductivity increased by approximately four to five orders of magnitude (from 5.9 × 10⁻¹² S/m to 1.0 × 10⁻⁷ S/m) with the introduction of foaming. The results are consistent with other studies. For instance, Ameli et al. reported that the final percolation threshold of foam PP/MWCNT composites was 0.09 vol%, compared with 0.5 vol% for solid composites. 18
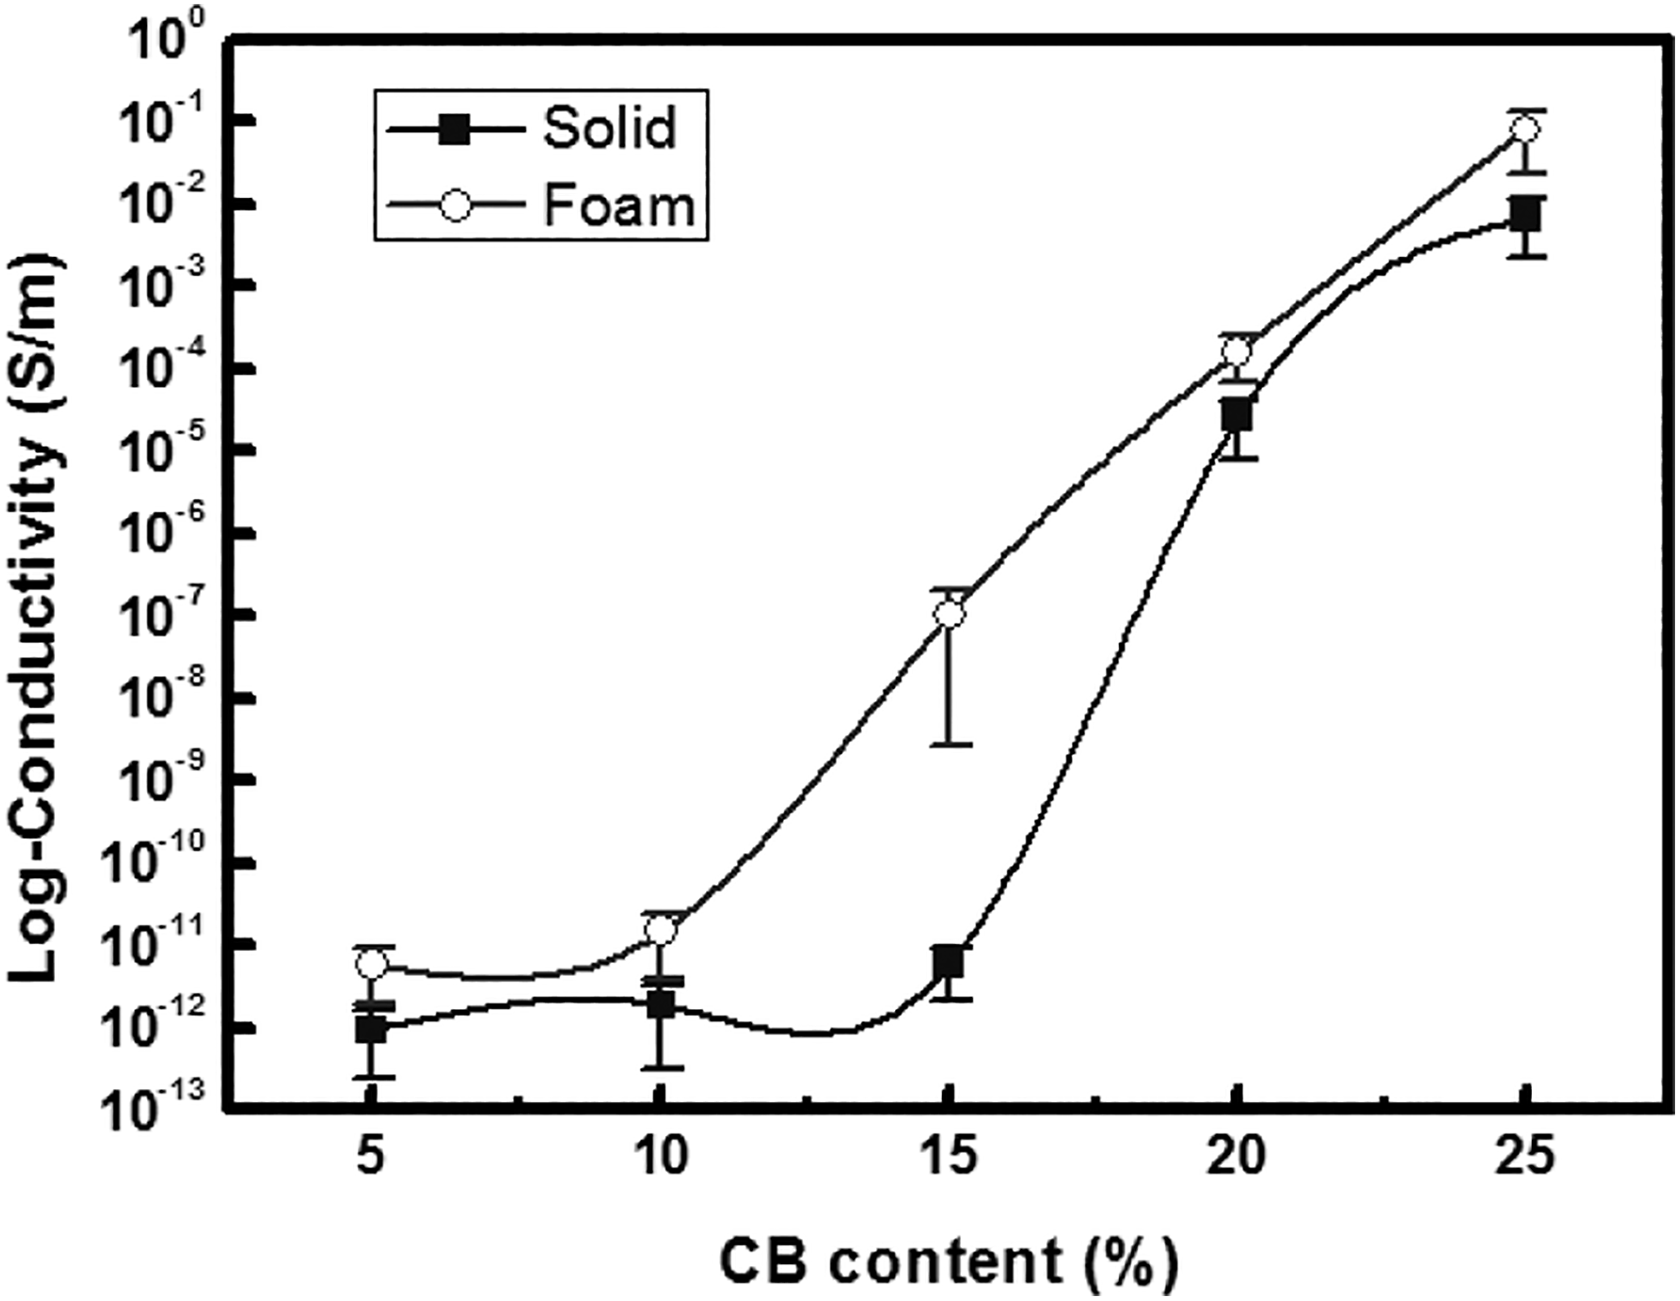
The T-P electrical conductivity of solid and foam PP/CB samples was measured at the middle location of the injection-molded part as a function of CB content. Error bars show the standard deviation for six repetitions of each sample.
The increase in the T-P electrical conductivity of the foam samples was attributed to three factors. (a) As shown in Figure 6(b), the CB particles were loosely arranged in the solid samples. However, for the foam samples, the CB particles were pushed into the cell walls when the cell structure was introduced, which enhanced the interconnected particle structure and promoted the formation of additional conductive paths (Figure 6(d)). (b) The gas released by the chemical foaming agent was dissolved in the matrix, which decreased the viscosity of the system and shear stress during filling. This result led to a reduction in the preferential orientation of the filler in the flow direction. (c) The foam generated three-dimensional growth of the cells after they were nucleated and before they reached their final size, which produced conductive fillers oriented in the thickness direction. 31,43
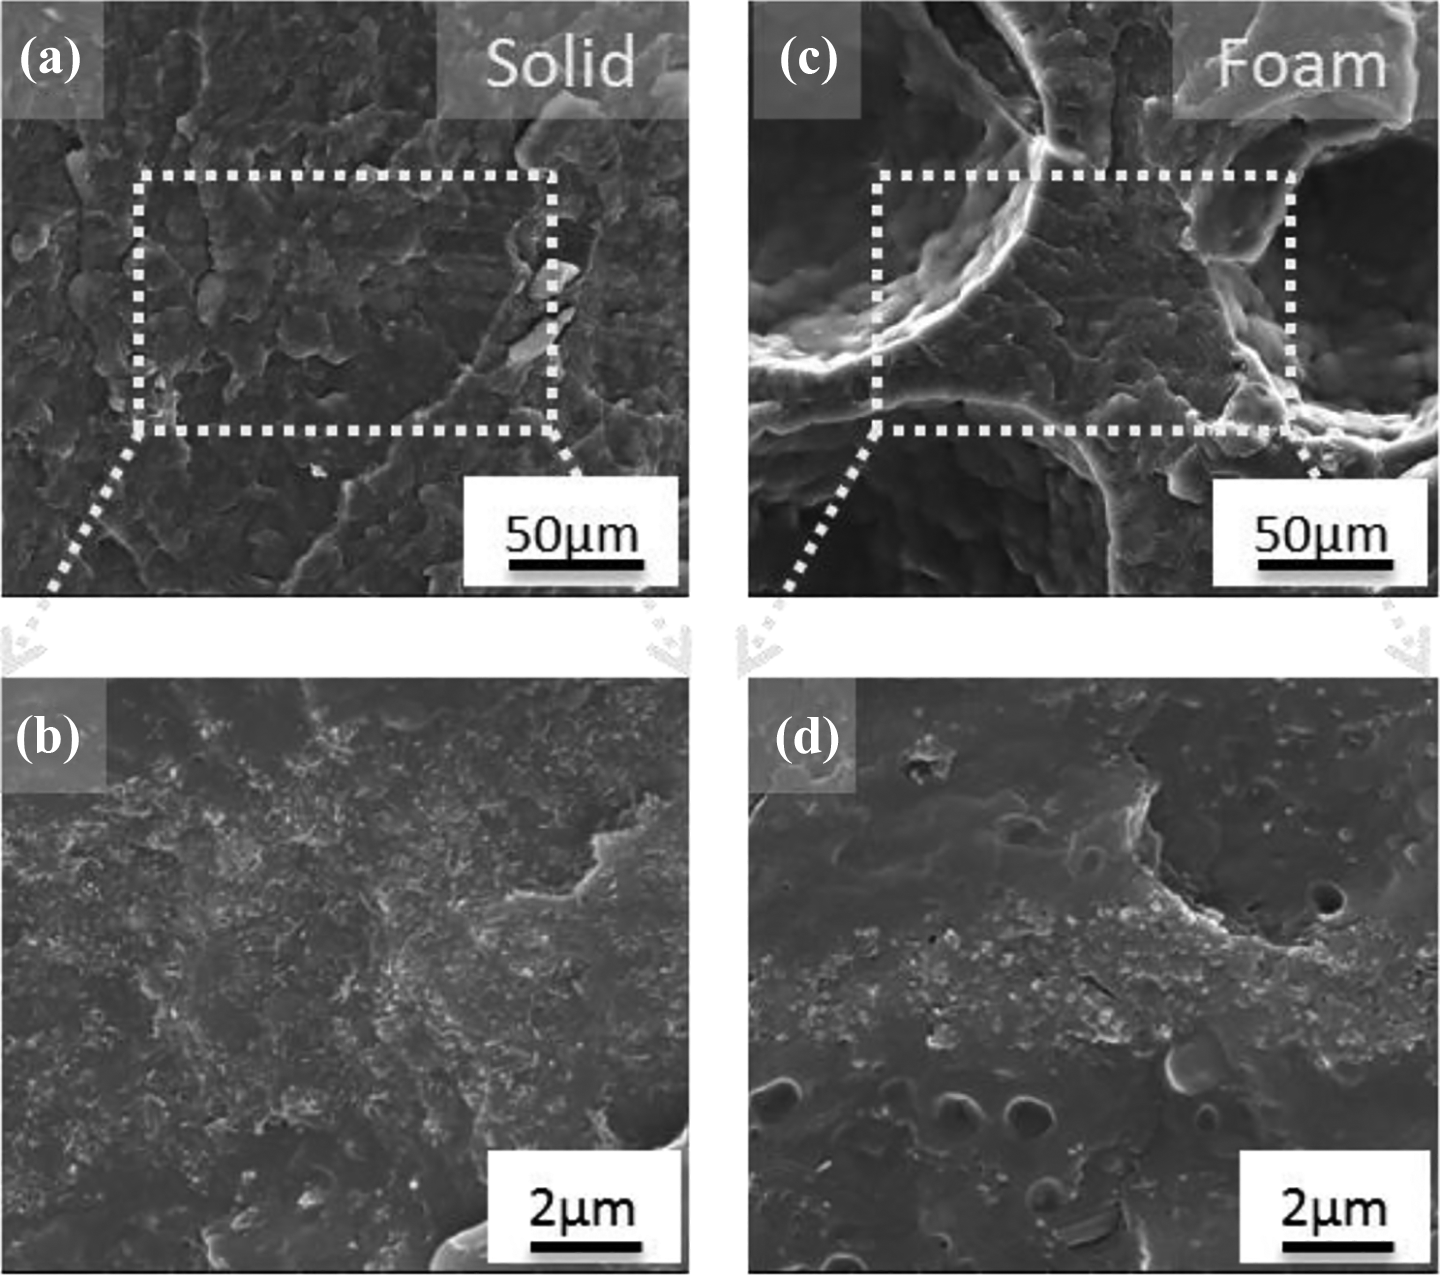
The volume exclusion effect of the cell resulted in the close contact of CB particles. (a) Measurement from a solid sample. (c) Measurement at the cell wall of three cells in foam sample. (b) and (d) Enlargement of the dotted lines in panels (a) and (c), respectively.
Cavity location, microstructure, and T-P electrical conductivity relationship
The location of cavity is particularly important for the electrical conductivity. In injection molding, cavity location indicates the distance that melt travels inside the cavity during the injection and filling, before it reaches its stationary point. For the near location, the effects of shear flow and packing pressure were greater compared to the middle and end locations, and, consequently, a more severe orientation along the flow direction formed in near location and thus resulted in the lower electrical conductivity at the near location. Similarly, for foam injection molding, the higher cavity pressure at the near location hinders the cell growth, resulting in the difference of cell morphology along the flow direction.
To investigate the T-P electrical conductivity of foam samples at different cavity locations, experiments were carried out for solid and foam PP/CB-15 wt% composites (for PP/carbon filler-X, where X represents the mass ratio of carbon filler). Figure 7 illustrates that the T-P electrical conductivity of the foam samples increased by five to seven orders of magnitude compared with that of the solid samples at all locations. Moreover, for the foam samples, the most obvious change was obtained at the far location, where the T-P electrical conductivity (1.876 × 10⁻⁵ S/m) increased by approximately two orders of magnitude compared to that at the middle location (1.010 × 10⁻⁷ S/m) and the near location (7.887 × 10⁻⁸ S/m). This result may be explained by the thickness of the foam layer and cellular morphology.
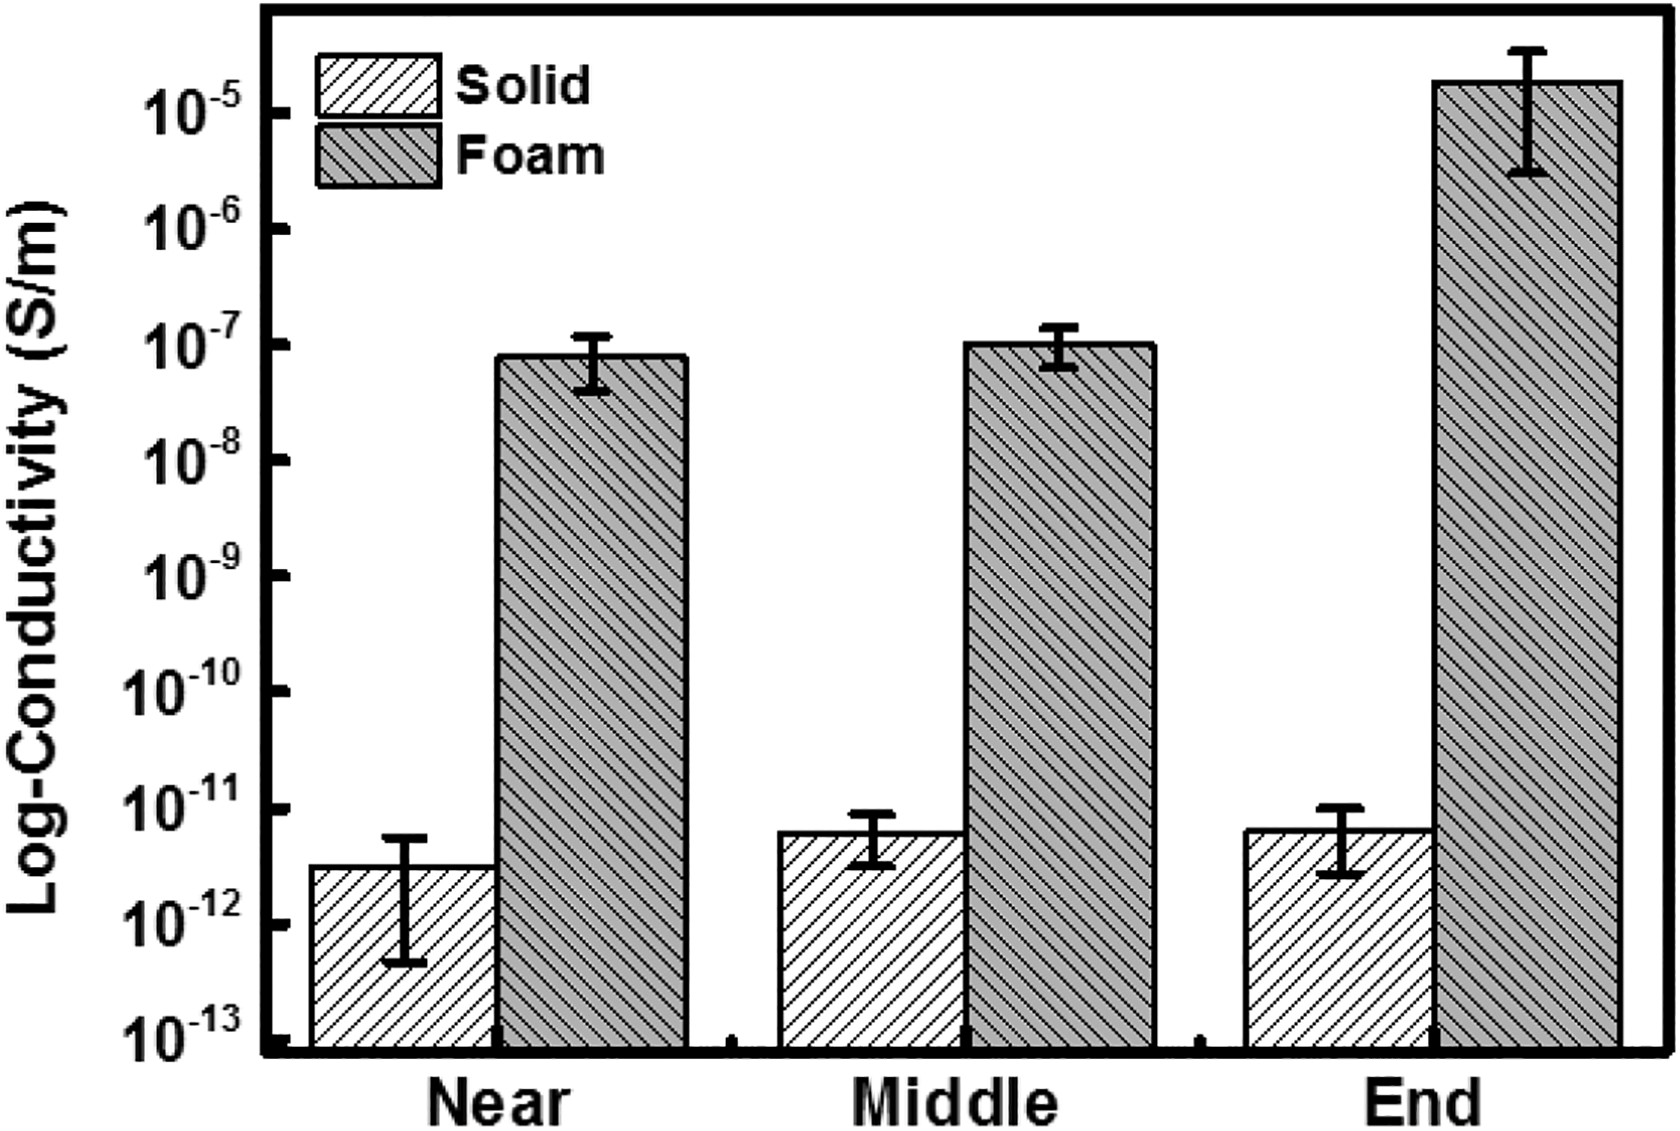
The T-P electrical conductivity of solid and foam PP/CB-15 wt% composites was measured at different locations. Error bars show the standard deviation for six repetitions of the injection-molded sample.
It is known that conductive fillers of a shear layer are oriented along the flow direction in injection molding. Hence, for the shear layer, conductive paths in the flow direction are more easily formed than those in the thickness direction, resulting in a lower T-P electrical conductivity. Furthermore, the near location has a thicker shear layer compared to other locations, because the melt at the near location experiences a longer shear time than the far location. Therefore, the T-P electrical conductivity of near location is lower than that of far location for solid samples. 12,44
In general, all foam samples exhibited a characteristic sandwich structure with a central foam layer covered with a solid layer (Figure 8). In the solid layer, more conductive paths were formed in the flow direction than in the thickness direction. In the foam layer, the growth of the cells rearranged the CB particles oriented in the flow direction, leading to a random distribution of CB particles and increasing conductive paths in the thickness on the direction. Therefore, the T-P electrical conductivity of the foam samples mainly depended on change in the conductive paths of the foam layer in the thickness direction. It has been shown that the T-P electrical conductivity of solid skin layer is substantially lower than that of the corresponding foamed core layer. Hence, increasing the foam layer thickness is the main factor that enhanced the T-P electrical conductivity. 45
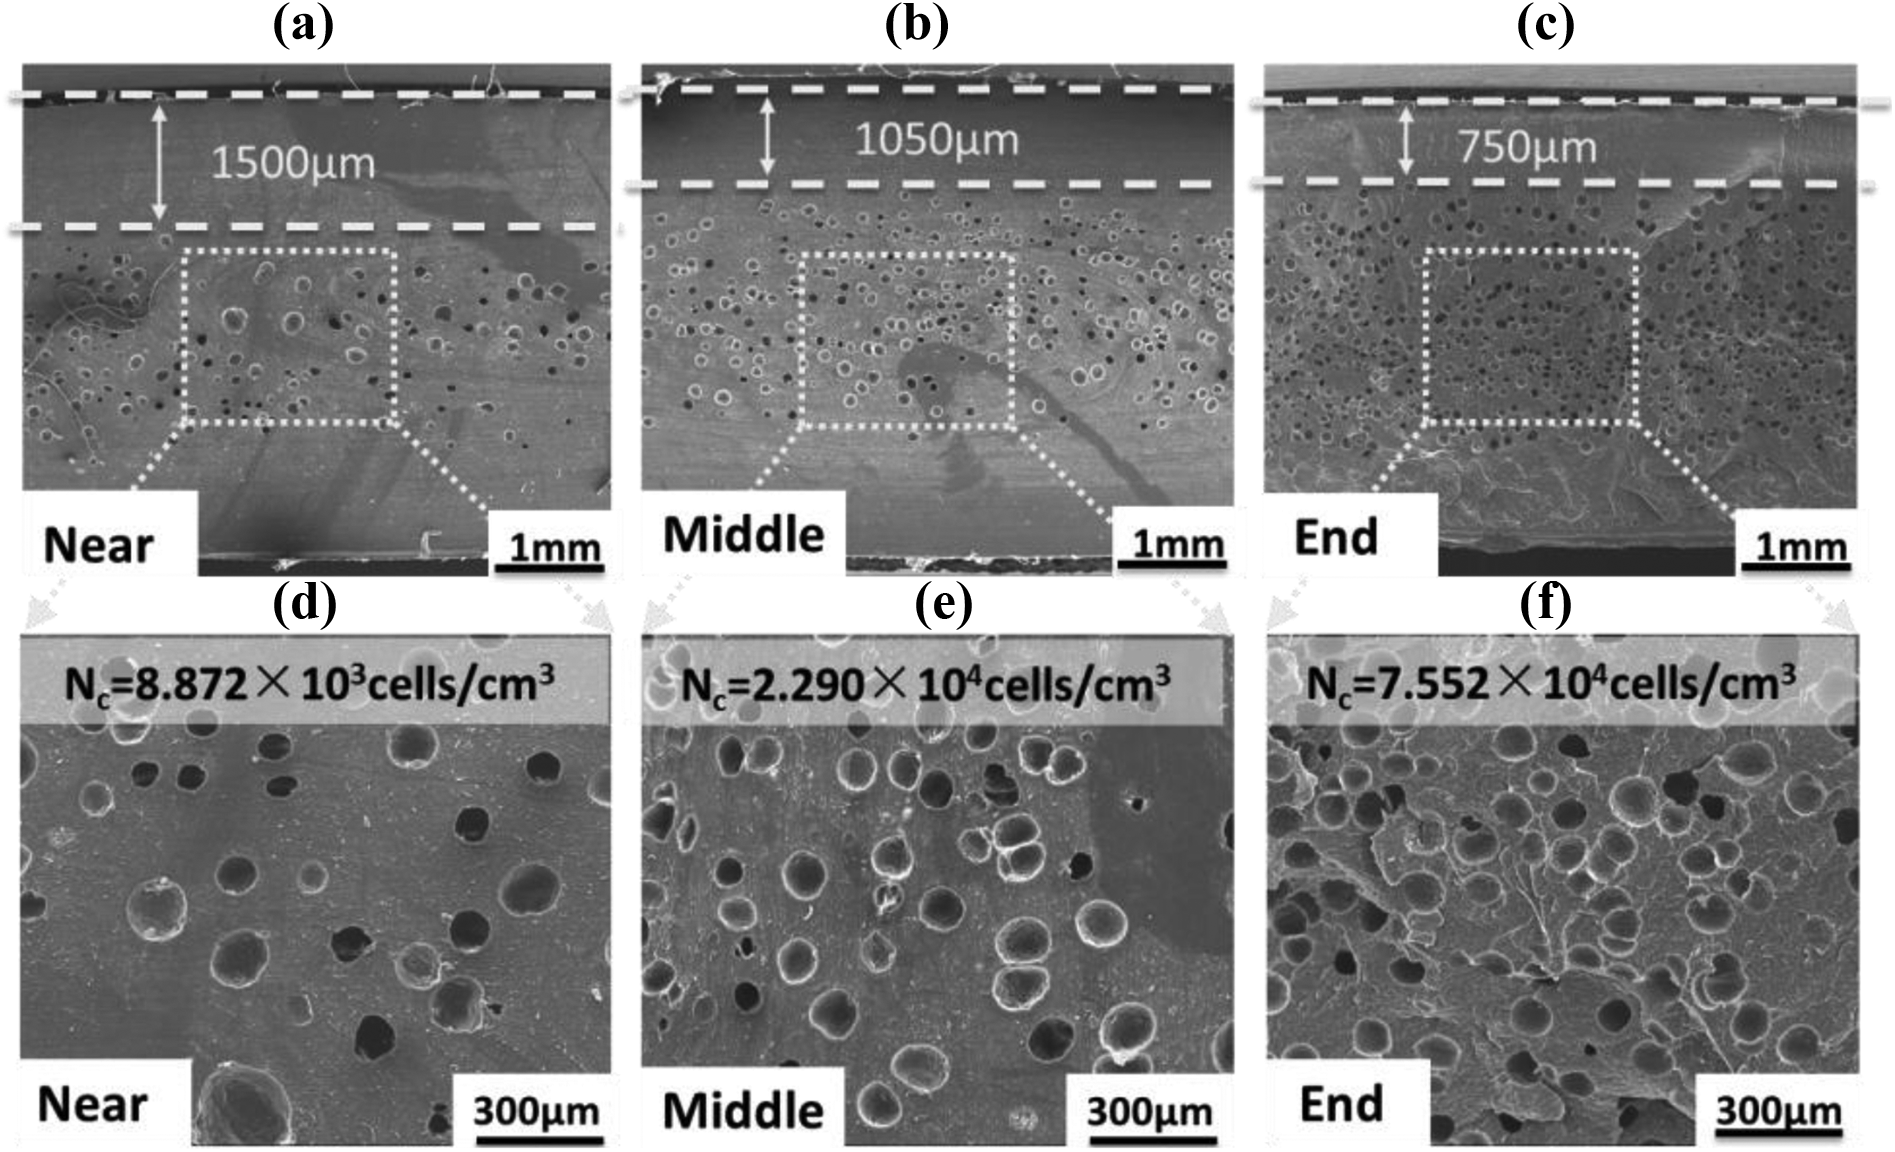
SEM images of foam samples at different locations: (a) near location, (b) middle location, and (c) far location. (d)–(f) The enlargements of (a)–(c), respectively.
In Figure 8(a) to (c), the solid layer thickness was 1500 µm at the near location and reached 1050 µm at the middle location and 750 µm at the end location. Increasing numbers of flow-induced conductive fillers were reoriented upon a decrease in the solid layer thickness with an increase in the foam layer thickness, which promoted the formation of conductive paths in the thickness direction. Furthermore, an increased thickness in the foam layer made it easier to enhance the T-P electrical conductivity. Figure 8(d) to (f) shows that the cell density at the end location was approximately nine times higher than the cell density at the near the location; in contrast, the cell size at the end location was lower than the average cell size at the near the location. The maximum cell density and minimum cell size were observed at the end location.
Process parameters, microstructure, and T-P electrical conductivity relationship
Injection flow rate effect on the T-P electrical conductivity
The reduction in the T-P electrical conductivity from injection molding was mainly attributed to the fact that the conductive fillers were oriented in the flow direction, which destroyed the formation of effective conductive paths in the thickness direction. During foaming injection molding, cells subjected to three-dimensional biaxial stretching in a polymer matrix lead to a reduction in the one-dimensional orientation of CB particles in the flow direction. This is a reason the T-P electrical conductivity of foam samples is higher than that of solid samples. The introduction of cell structures can enhance the electrical conductivity of composites. However, the question is as follows: How does the cell structure affect the electrical conductivity of composites? To study this problem, various process parameters were varied to prepare foam samples with different microstructures for electrical conductivity testing.
It is well-known that the pressure drop rate is the most important parameter that contributes to nucleation. In general, an increase in the pressure drop rate leads to an increase in the nucleation rate as well. 46 In fact, the injection flow rate is a direct parameter to be controlled and directly impacts the pressure drop rate. Figure 9 shows that the T-P electrical conductivity of the samples at an injection flow rate of 70 cm3/s was the highest. As mentioned above, a change in the T-P electrical conductivity was caused by the foam layer thickness and cellular morphology. Figure 10 shows that the solid layer thickness was reduced from 1500 µm to 550 µm when the injection flow rate was increased from 30cm3/s to 90 cm3/s. There were two main reasons for this phenomenon. (a) At the 30 cm3/s injection flow rate, the melt moved slowly through the middle location and the melt was given more time to solidify, which resulted in a decreased melt temperature and increased melt strength at this moment, which hindered the growth of the cell. (b) At the 90 cm3/s injection flow rate, an increased pressure drop rate was obtained during filling, resulting in a large amount of cell nucleation and growth. The decrease in the solid layer thickness indicated a decreased orientation of conductive fillers in the flow direction. However, as shown in Figure 9, when the injection flow rate was increased from 70 cm3/s to 90 cm3/s (the solid layer thickness from 850 µm to 550 µm), the T-P electrical conductivity decreased from 4.942 × 10⁻⁵ S/m to 1.355 × 10⁻⁵ S/m, respectively. Another phenomenon can explain this result: cell merging to form large cells (as shown in the yellow box in Figure 10(d)) when the injection flow rate reached 90 cm3/s. The viscosity of the melt decreased at the high injection speed and led to a decreased melt strength and the formation of large cells because the cells collapsed and merged, which formed a thin cell wall. The thin cell wall prevented the formation of a conductive network. 21,45,47
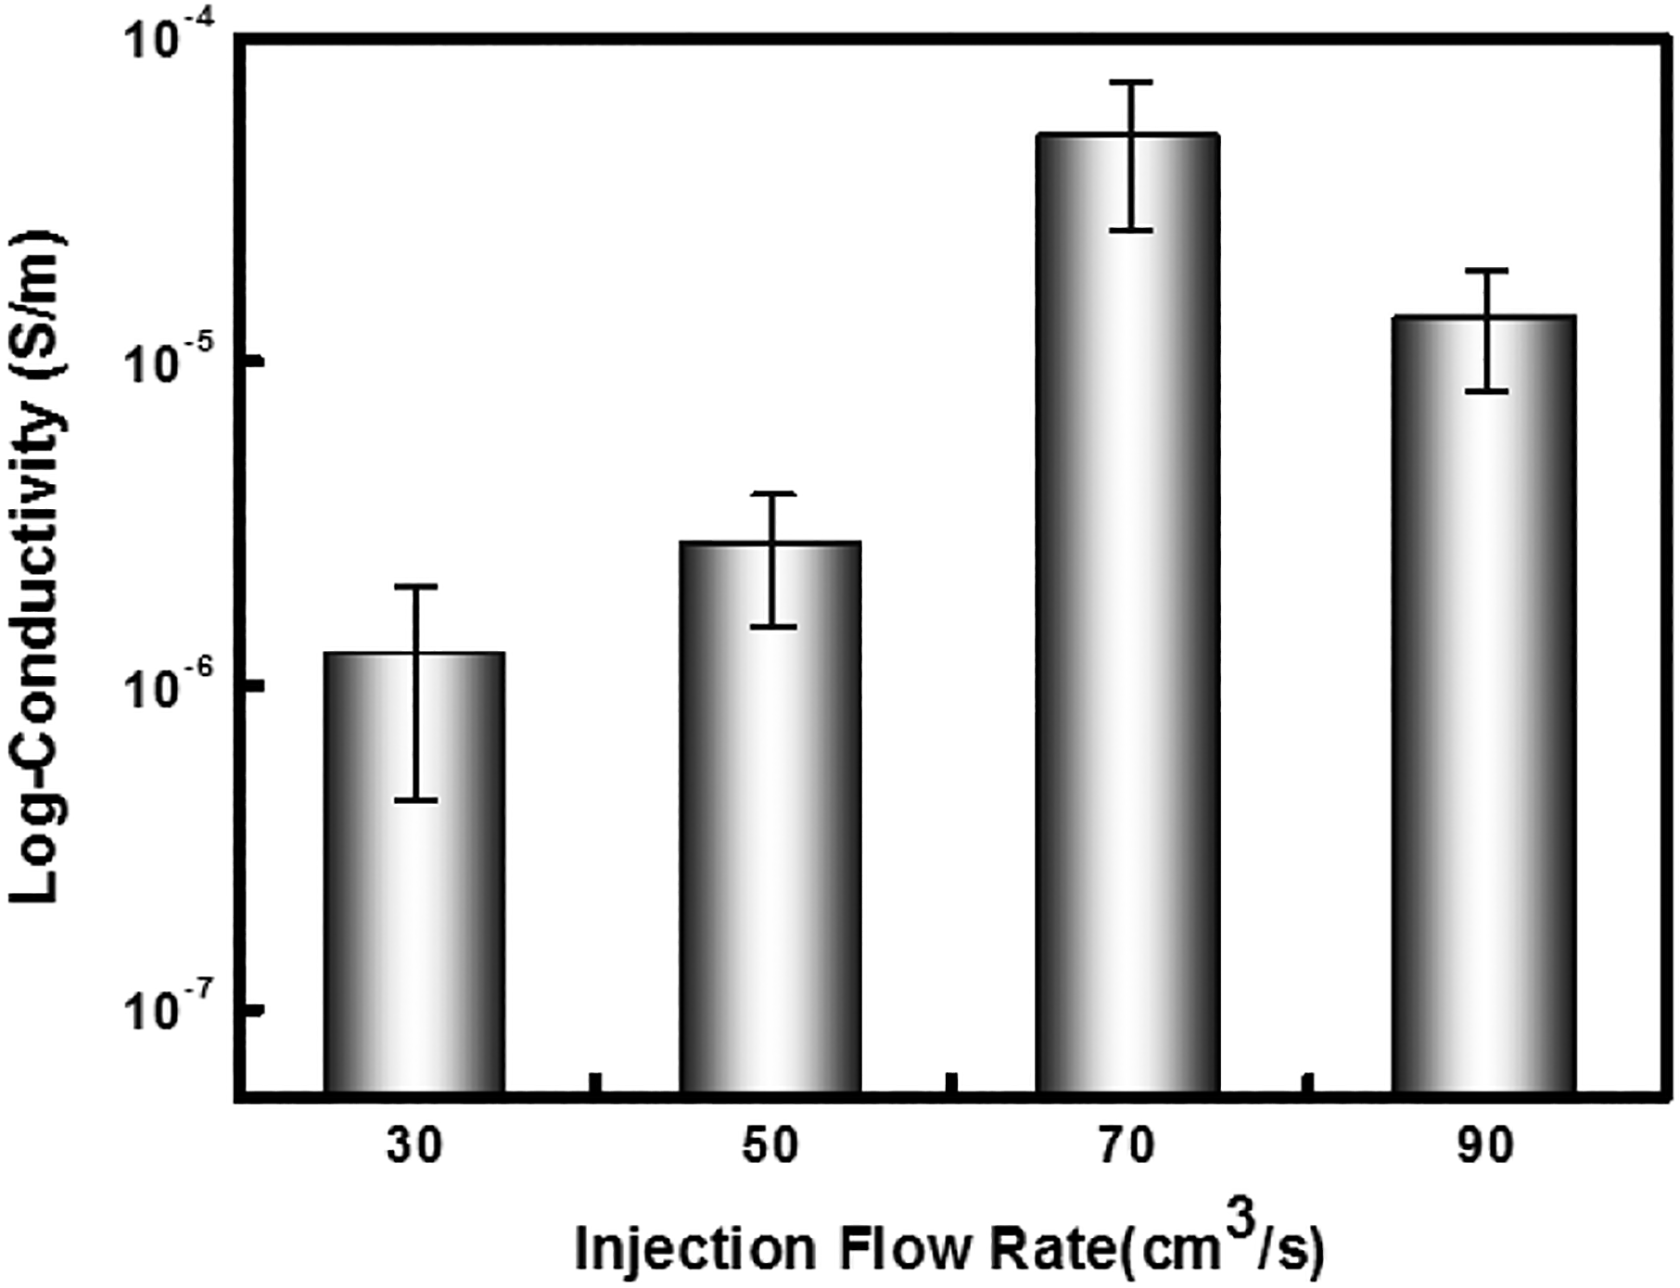
Conductive behavior of PP/CB-20 wt% composites at four different injection flow rates. The T-P electrical conductivity of the samples was measured at the middle location. Error bars show the standard deviation for six repetitions of the foam sample.
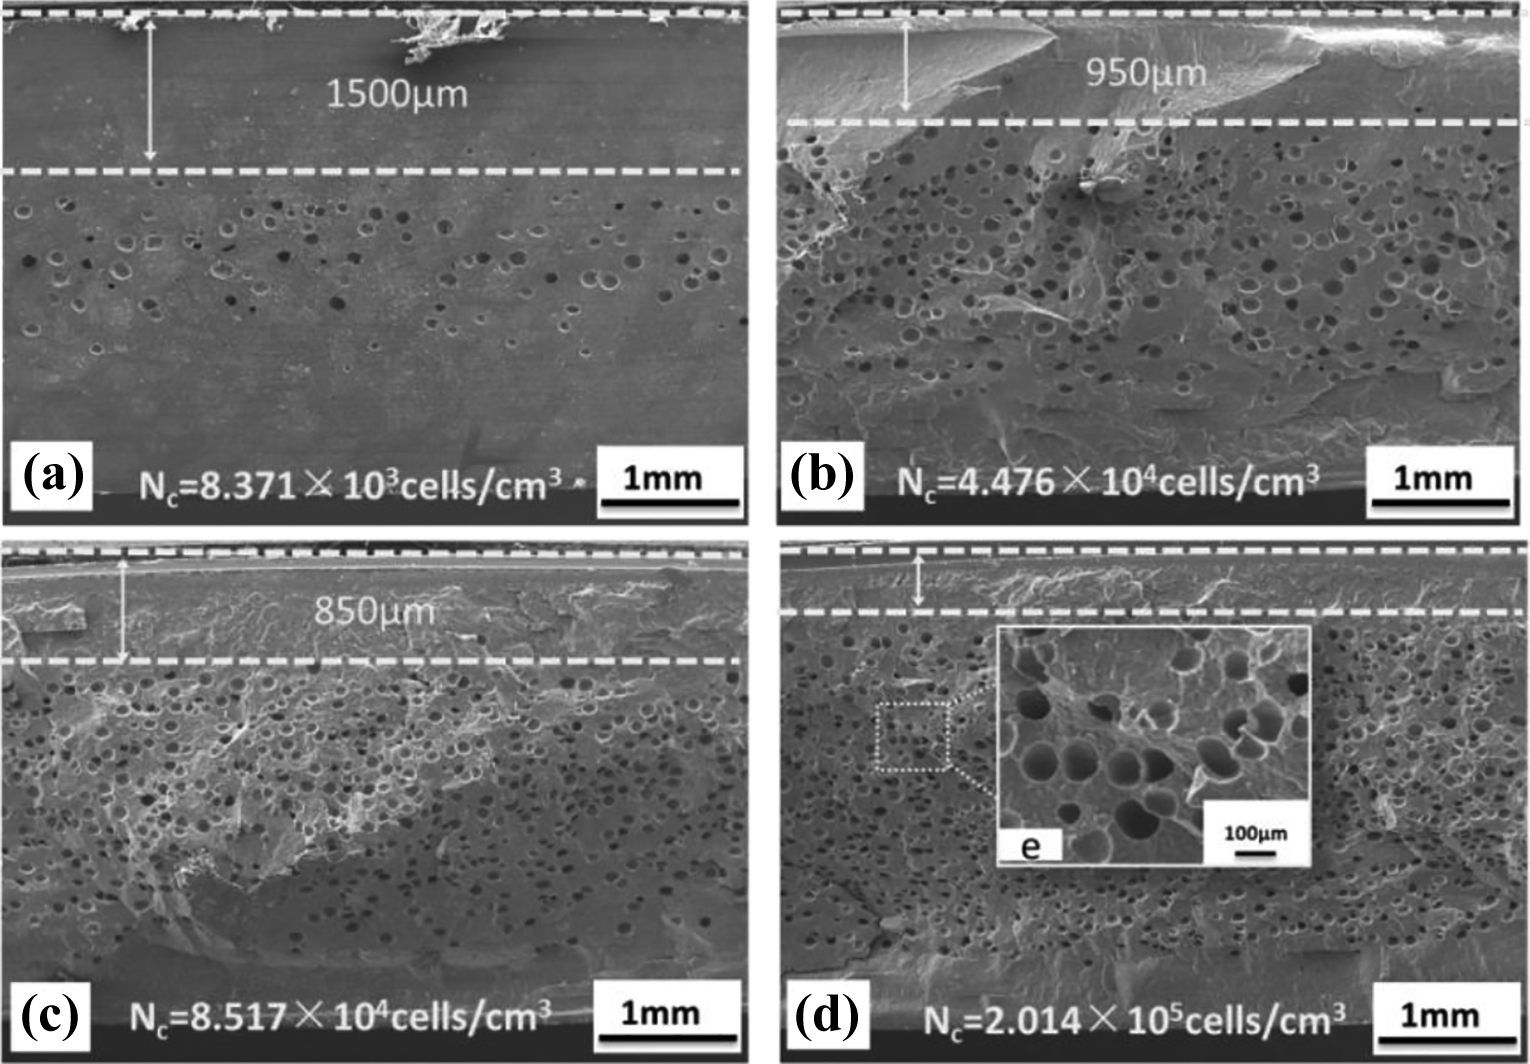
SEM micrographs show the cellular morphology of the middle location under different injection flow rates. (a) 30 cm3/s, (b) 50 cm3/s, (c) 70 cm3/s, (d) 90 cm3/s, and (e) the enlargement of the dotted line in (d).
This study shows that an increased number of small-sized cells led to an increased level of moderate double-shaft stretching in the composites and caused an effective CB particle cluster rotation, eventually increasing the T-P electrical conductivity. Therefore, an increased cell density and decreased cell size promote the formation of conductive networks in the thickness direction.
Melt temperature effect on the T-P electrical conductivity
Based on the results of the above study, we examined the effect of the melt temperature on the T-P electrical conductivity. The samples were fabricated via foaming injection molding under different melt temperatures (180°C, 190°C, and 200°C). Figure 11 shows that T-P electrical conductivity rapidly increased with increasing melt temperature. The lowest T-P electrical conductivity (2.610 × 10⁻⁶ S/m) was observed in the sample at 180°C, which had a small number of cells and a low foam layer thickness (Figure 12). The highest T-P electrical conductivity (7.936 × 10⁻⁵ S/m) was observed in the sample at 200°C, which had a number of cells and high foam layer thicknesses (Figure 12). The melt temperature directly affected the melt strength during filling, and it further affected the cellular morphology of the foam samples. According to the classical cell growth theory, 48,49 a low melt strength decreases the resistance of cell growth, thus leading to an increase in the cell density and foam layer thickness (Figure 12). As discussed previously, the growth of cells caused rotational and translational displacements of conductive fillers; hence, an increase in the foam layer thickness and cell density increased the electrical conductivity. It should be noted that an optimum melt temperature significantly enhanced the T-P electrical conductivity of foam samples.
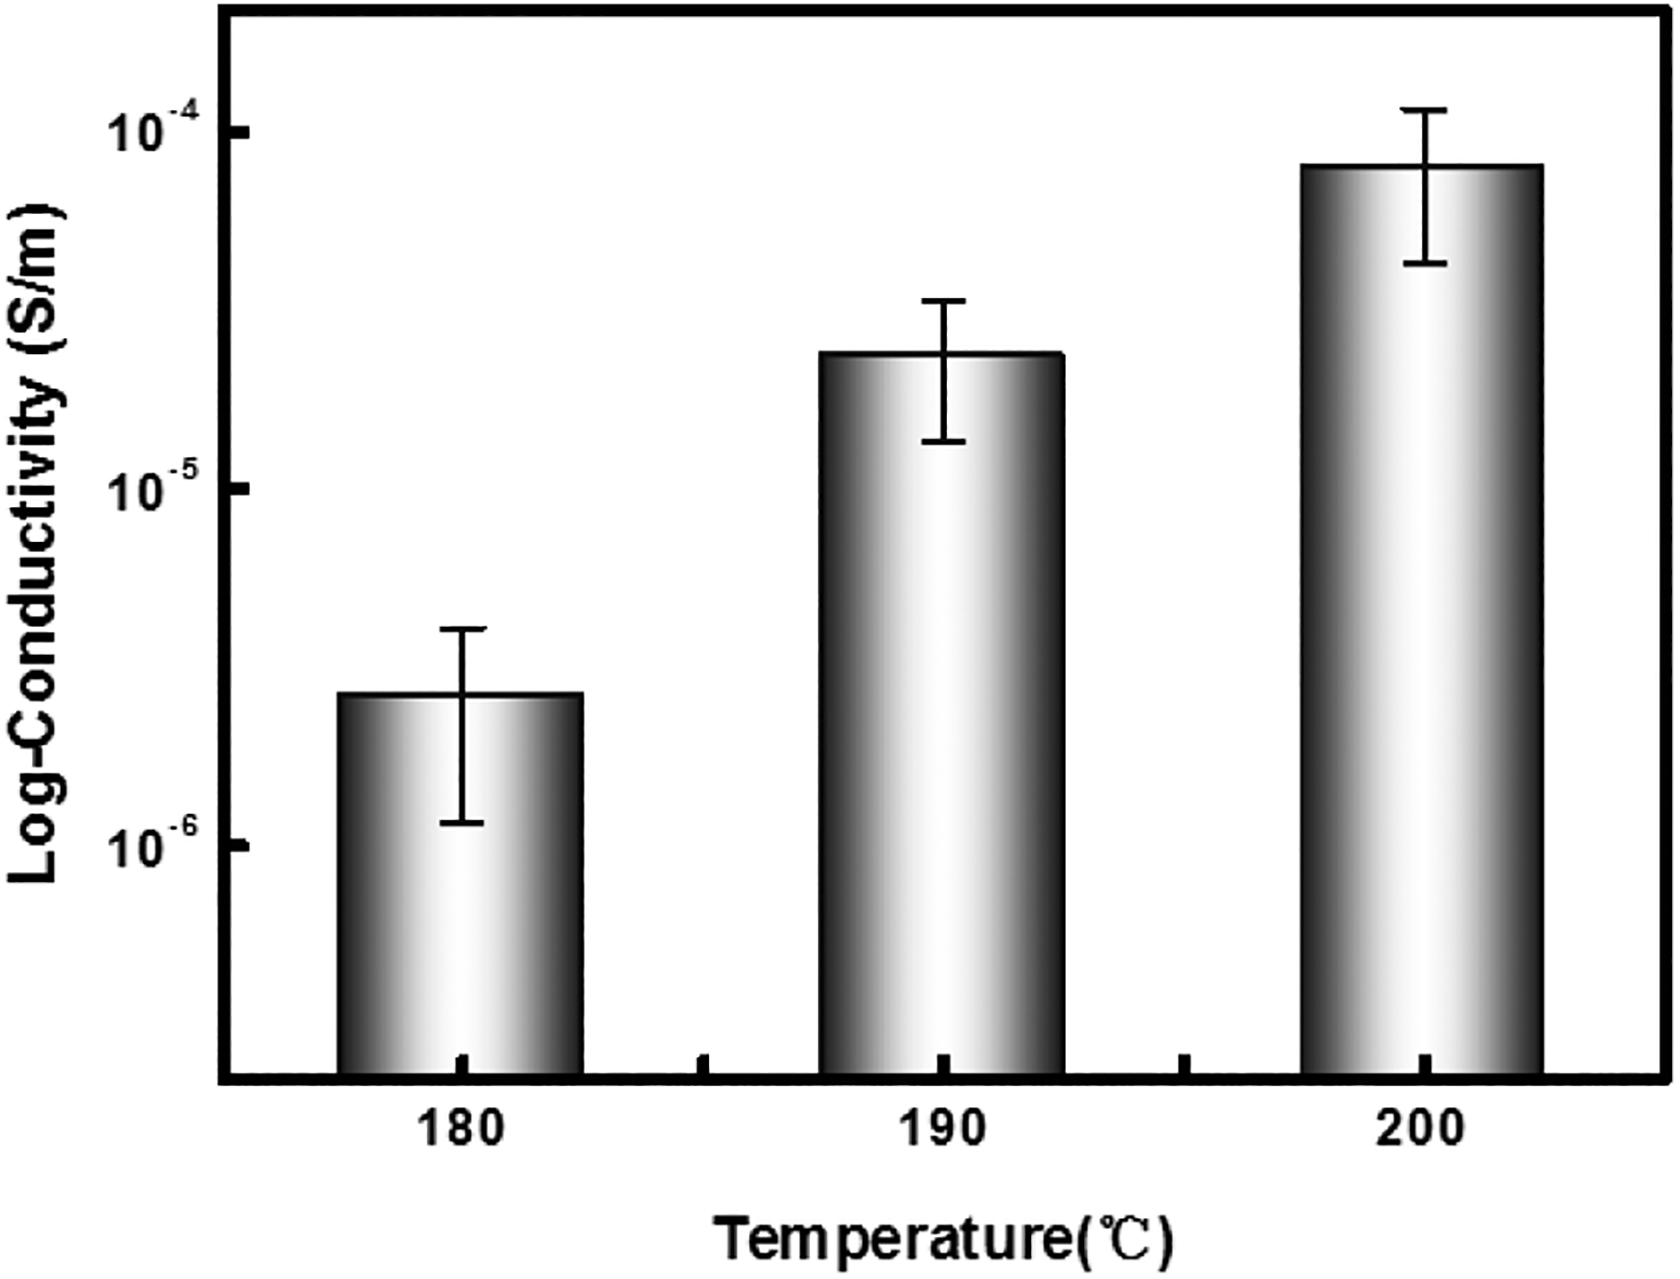
Conductive behavior of PP/CB-20 wt% samples at three different melt temperatures. The T-P electrical conductivity of the samples was measured at the middle location. Error bars show the standard deviation for six repetitions of the foam sample.
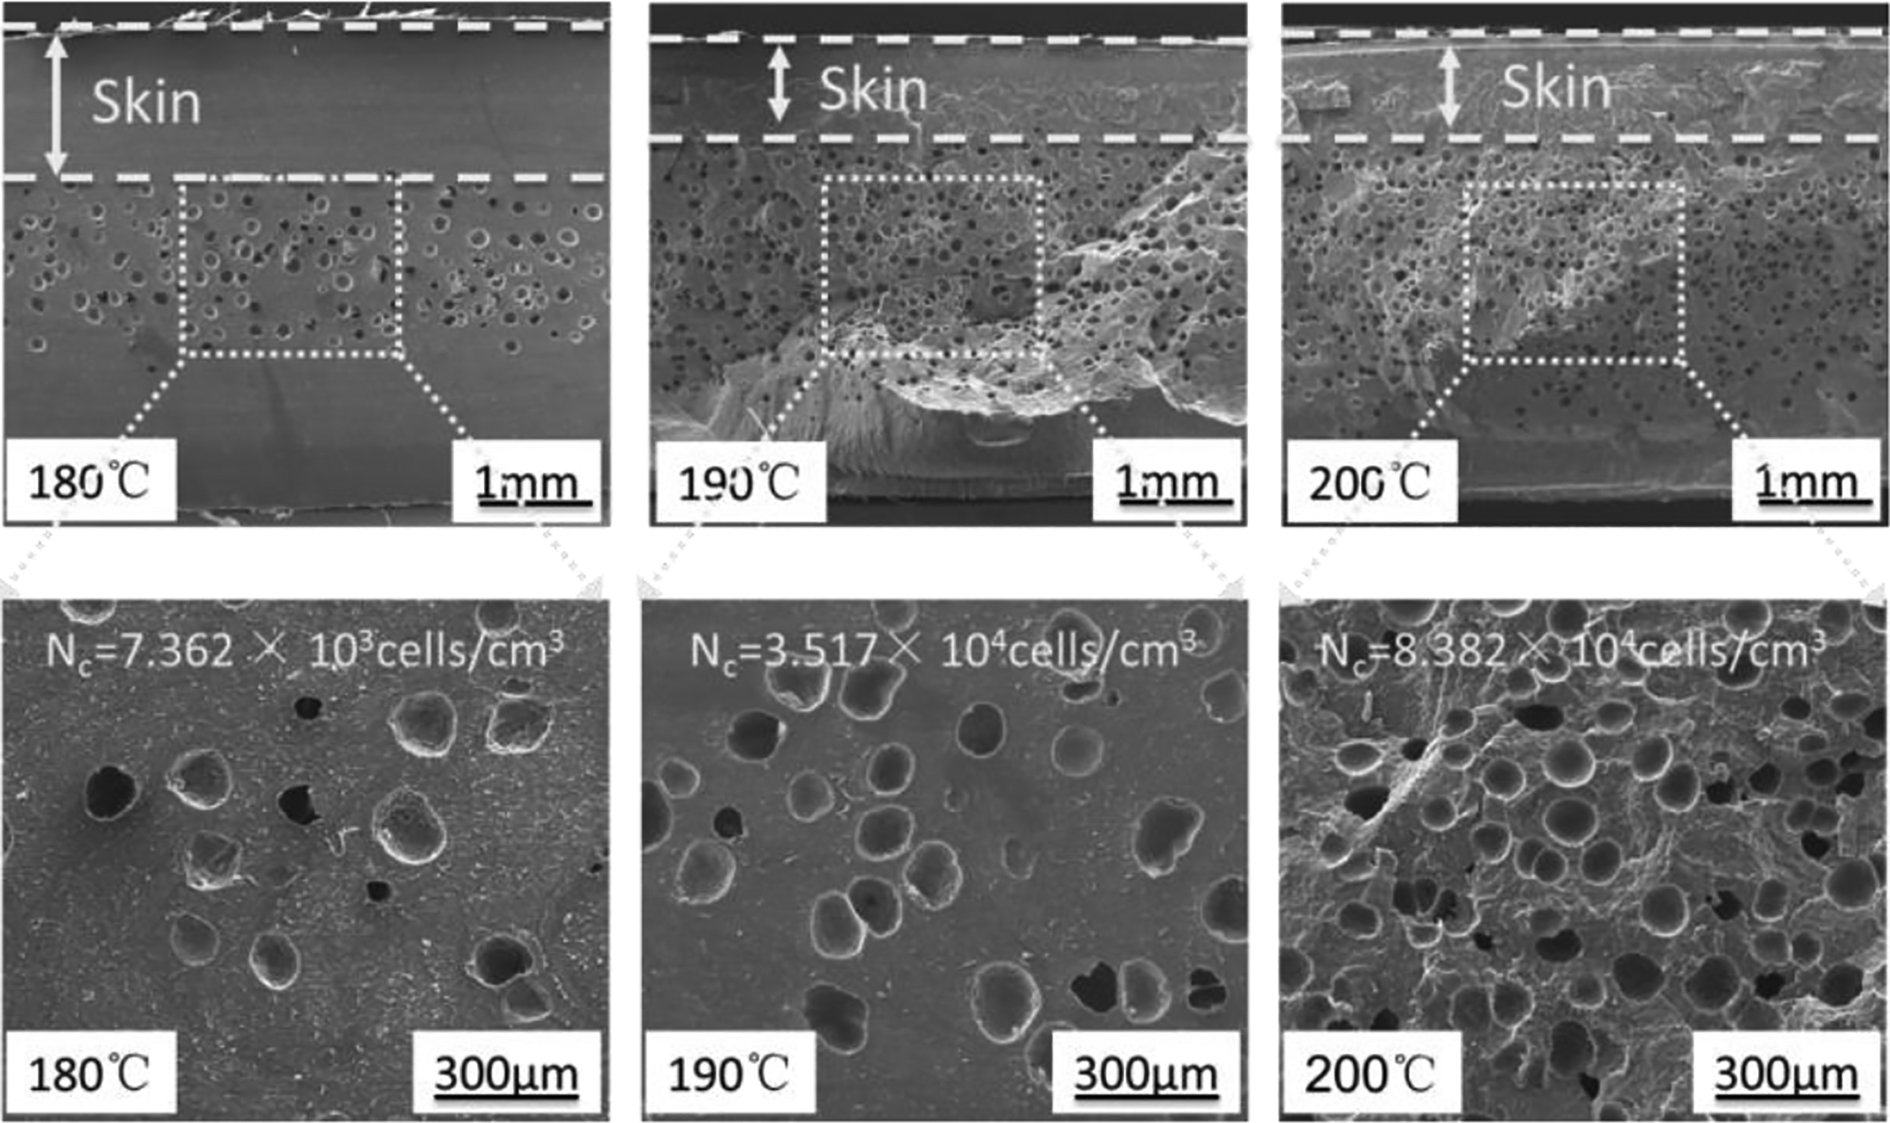
SEM micrographs show the cellular morphology of the middle location under different melt temperatures.
Void fraction effect on the T-P electrical conductivity
To study the effect of the void fraction on the T-P electrical conductivity, void fractions of foam PP/CB-20 wt% composites were set at 0%, 5%, 10%, and 15%. Figure 13 shows the T-P electrical conductivity of foam samples at different void fractions. In comparison with the solid samples, the T-P electrical conductivity of the foam samples significantly increased (from 2.082 × 10⁻⁷ S/m to 7.936 × 10⁻⁵ S/m). Once foaming was introduced, the oriented conductive fillers were redistributed toward a more stochastic state. Hence, the interconnections of the conductive fillers were enhanced in the thickness direction. Moreover, the T-P electrical conductivity slightly decreased with increasing void fraction from 5% to 10%. When the void fraction was 15%, the T-P electrical conductivity rapidly decreased. This result can be attributed to a change in the CB content in the sample of the same size and a change in the cellular morphology of the samples.
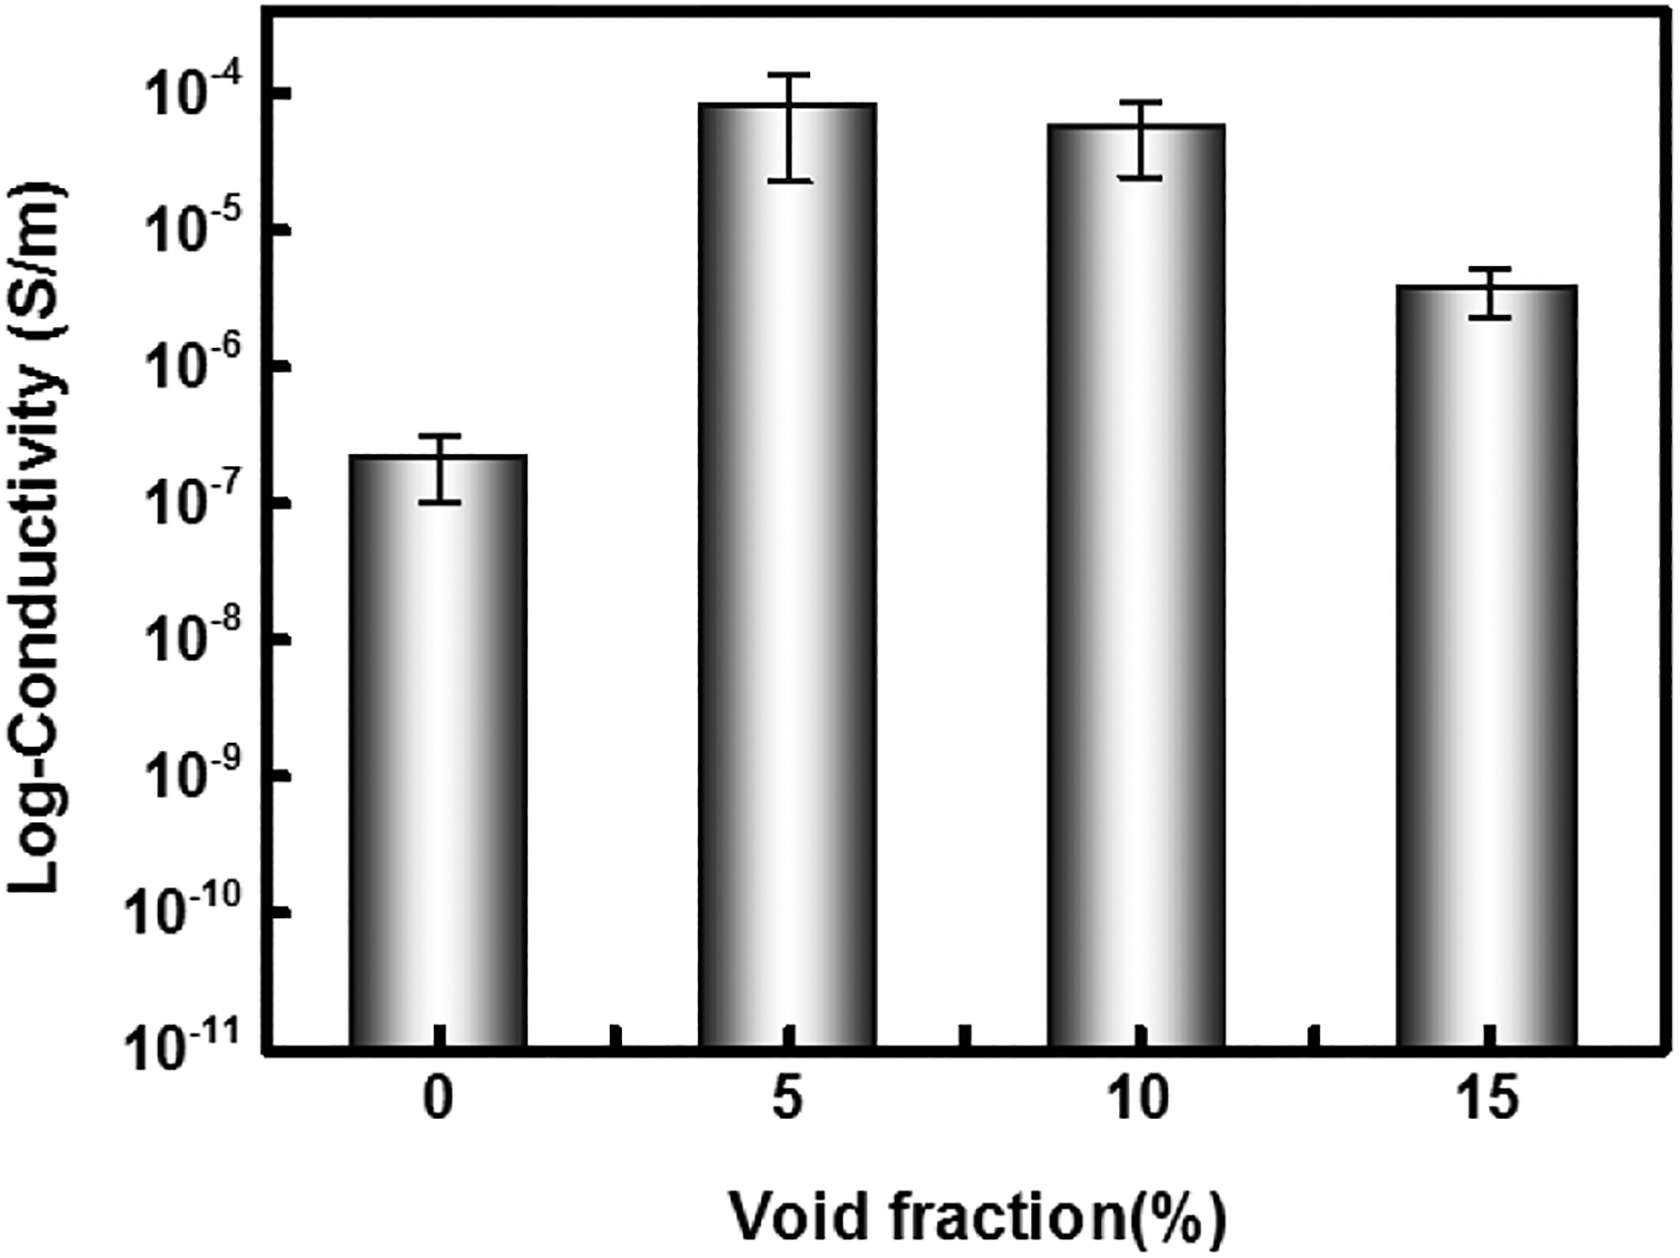
Conductive behavior of PP/CB-20 wt% samples at three different void fractions. The T-P electrical conductivity of the samples was measured at the middle location. Error bars show the standard deviation for six repetitions of the foam sample.
At 10% and 15% void fraction, decreased amounts of conductive fillers were dispersed in samples of the same size, but the T-P electrical conductivity was higher than that of solid samples, as shown in Table 2. This result proves that the introduction of foaming enhanced the T-P electrical conductivity of samples at a low content of conductive fillers, further making it possible to manufacture lightweight products with a high electrical conductivity. Figure 14 depicts the cellular morphology of the PP/CB-20 wt% composites at different void fractions. The cell density increased with increasing void fraction (5–10%), but cell merging and collapse occurred at the 15% void fraction. At an excessive void fraction (15% in this case), the limited number of nucleated cells underwent a substantial degree of growth to fully fill the cavity. The cell merging decreased the cell wall thickness, which negatively impacted the formation of conductive networks. Consequently, there was an obvious decrease in the T-P electrical conductivity of the foam samples at the 15% void fraction compared to that of the 5% and 10% void fractions. In other words, an optimum void fraction can both reduce product weight and improve the electrical conductivity of samples. This result makes it possible to produce lightweight CPCs.
The change of CB content in samples of the same size under different void fraction.

CB: carbon black.
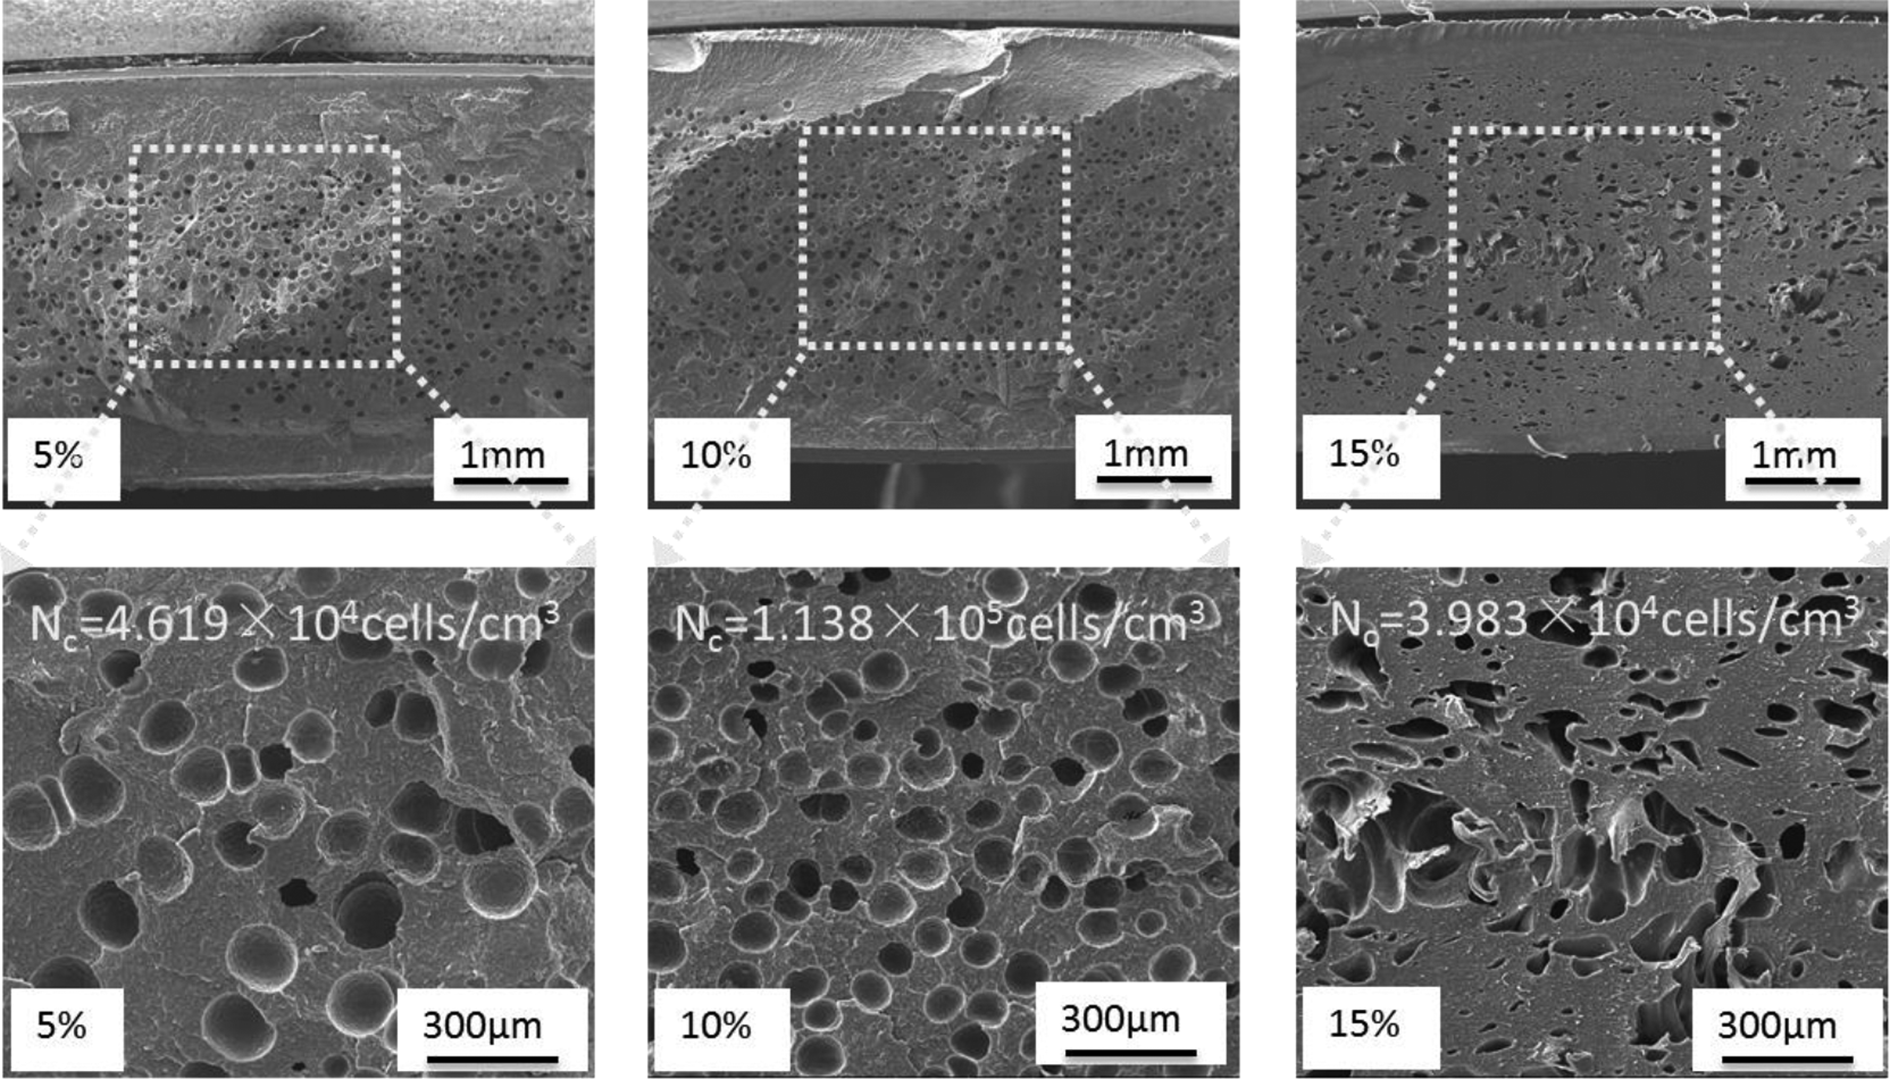
SEM micrographs show the cellular morphology of the middle location under different void fractions.
Hybrid fillers effect on the T-P electrical conductivity
To further reduce the content of conductive fillers in composites, another strategy was used to obtain a grape-cluster-like structure to enhance the T-P electrical conductivity. Hybrid composites were prepared by changing the content of CB and MWCNTs at a constant amount (15 wt%) of the conductive filler. As shown in Figure 15, the T-P electrical conductivity at the near location was approximately one to two orders of magnitude lower than the corresponding values in the middle and end locations. This result was mainly because of the longest exposure to the shear flow and the highest speed of the flow at the near location, which resulted in the separation of the MWCNT mass at the near location and the orientation of the conductive filler in the flow direction. 42 The T-P electrical conductivity of the hybrid composites with both fillers was far higher than that of the composites with only CB by approximately five to six orders of magnitude at three locations; moreover, the T-P electrical conductivity of the hybrid composites continued to increase when the MWCNT content was increased from 2 wt% to 4 wt% (Figure 15). It is believed that the presence of small amounts of MWCNTs may improve the T-P electrical conductivity of the samples.
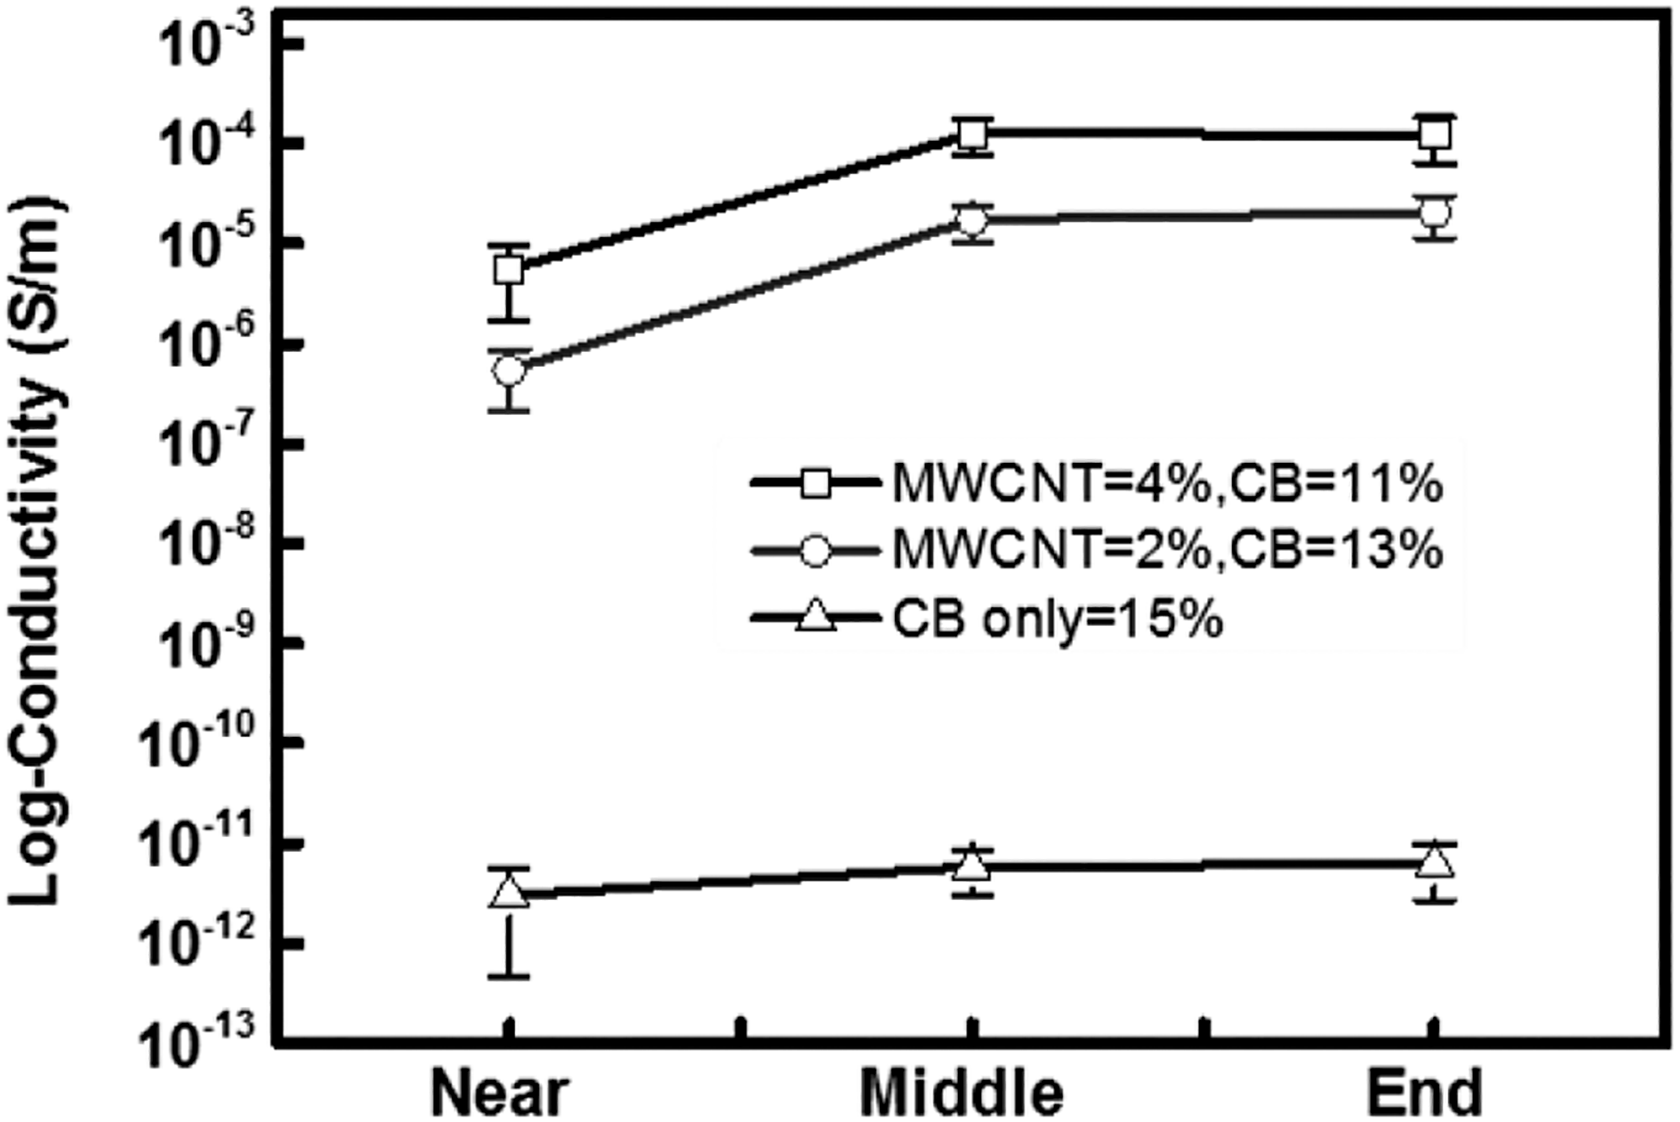
T-P electrical conductivity of the solid composites containing MWCNT and CB measured at three different locations (for fixed MWCNT contents of 0, 2, and 4 wt%). Error bars show the standard deviation for six repetitions of the foam sample.
This result was attributed to the synergistic effect of the fillers: composites with only CB had a decreased electrical conductivity due to the poor contact of the CB particles with a spherical shape, whereas the corresponding MWCNTs with a high aspect ratio were more likely to form effective links between the fillers and yield a well-formed conductive network. Therefore, the MWCNTs acted as a bridge and effectively linked the gaps between the unconnected CB particles and formed a stable conductive network, as shown in Figure 16. In summary, the hybrid fillers’ system with CB and MWCNTs significantly improved the T-P electrical conductivity of composites compared to a system with only CB. 50
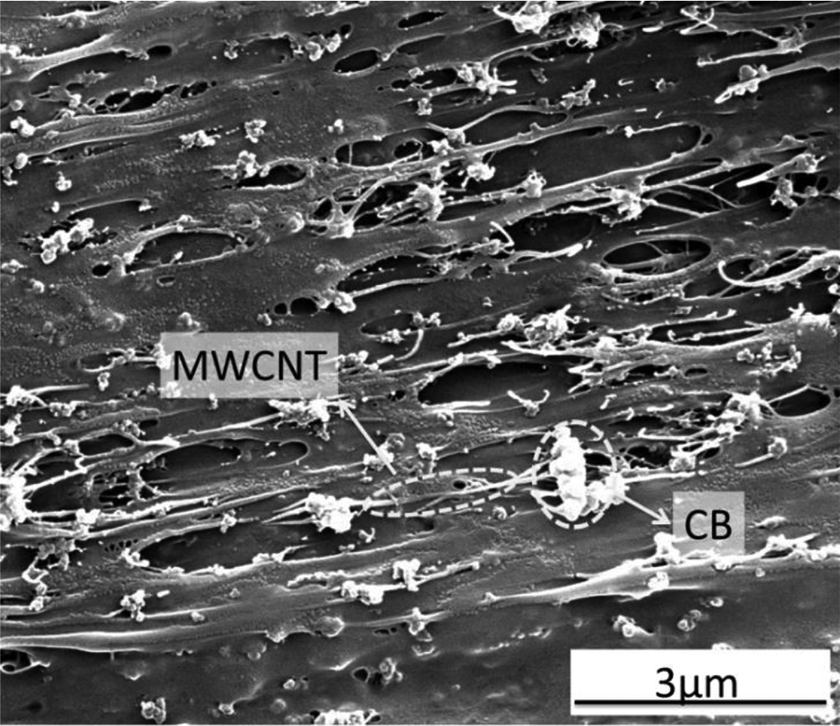
SEM micrographs show that CB agglomerates were connected by MWCNT in the composites.
Effect of foam on the T-P electrical conductivity of hybrid composites
Foam composites with 2 wt% MWCNT and 4 wt% MWCNT were prepared under the processing conditions from the results above (injection speed of 70 cm3/s, melt temperature of 200°C, and void fraction of 5%). As shown in Figure 17, when foaming was introduced into the composites, the foam samples showed a better T-P electrical conductivity than the solid samples because the oriented conductive fillers were randomly distributed.
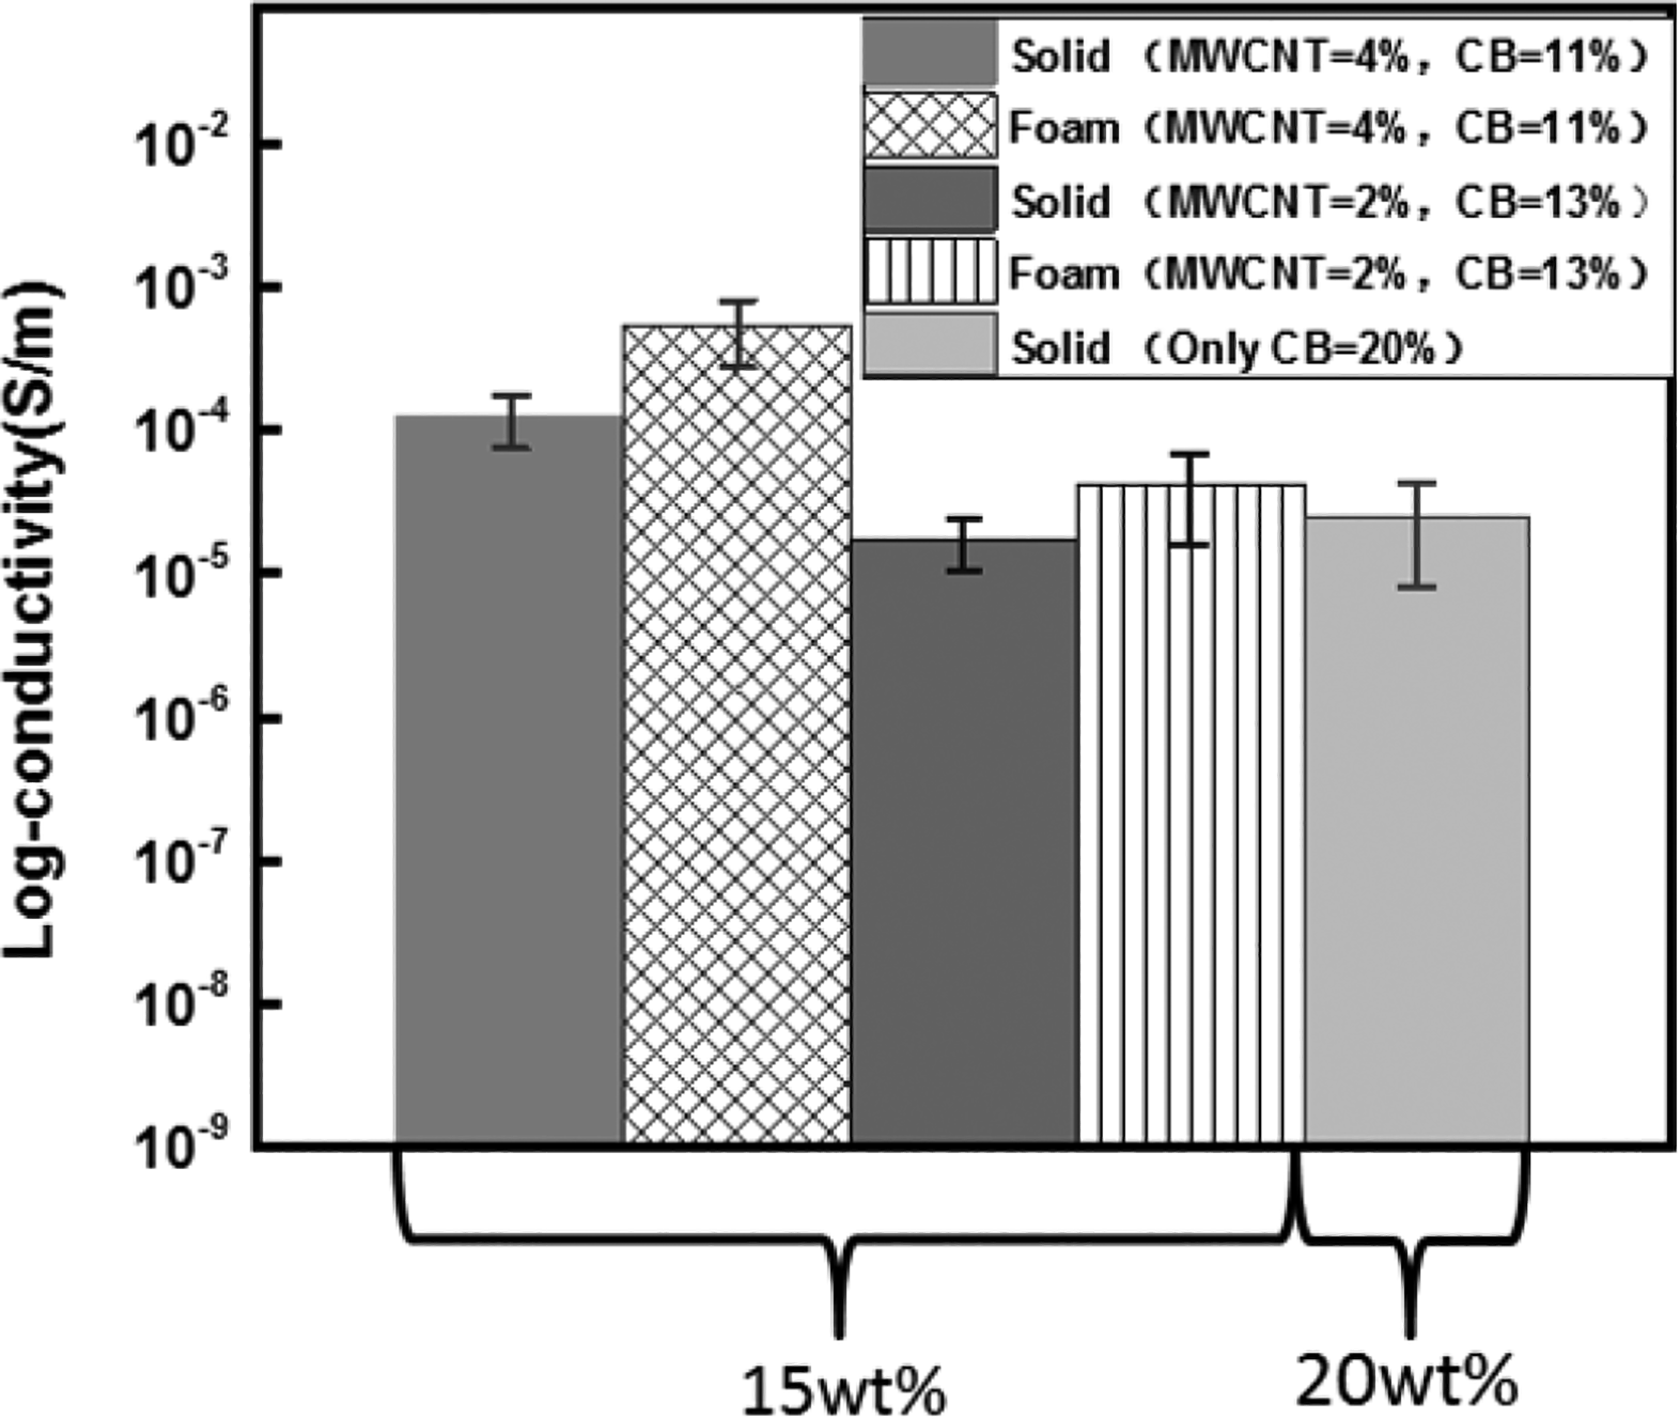
The T-P electrical conductivity of the solid and foam PP/CB-20 wt% and PP/CB/MWCNT-15% composites measured at the middle location. Error bars show the standard deviation for six repetitions of the foam sample.
The purpose of this article was to enhance the T-P electrical conductivity via foaming and a synergistic effect of fillers. The T-P electrical conductivity of the foam composites (PP/CB/MWCNT—15 wt%) was greater than that of the solid composites (PP/CB—20 wt%). In particular, the T-P electrical conductivity increased almost one order of magnitude for the foam hybrid composites with 4 wt% MWCNT. This result proves that foam injection molding and the synergistic effect of hybrid fillers can obviously enhance the T-P electrical conductivity at low filler contents.
Conclusion
In this work, the foam injection molding was used for the preparation of CPCs. The T-P electrical conductivity of the solid and foam PP/CB composites with various CB contents was investigated. The most obvious change was that the T-P electrical conductivity increased by approximately four to five orders of magnitude when foaming was introduced into the composites.
The first purpose of this article was to discover the appropriate processing conditions for the preparation of foam samples with various microstructures and then investigate their effect on the electrical conductivity. The foam composites were prepared under different processing conditions. The injection flow rate, melt temperature, and void fraction were selected as the variables for this study. The microstructure, cellular morphology, and electrical conductivity of composites were then investigated to understand the relationships between process, microstructure, and electrical conductivity. It was found that the T-P electrical conductivity of the foam samples increased up to two orders of magnitude under optimal processing conditions. The foam layer thickness and cellular morphology were identified as the most critical factors affecting the T-P electrical conductivity of samples.
The second purpose of this article was to further reduce the content of the conductive fillers in the composites. The solid and foam PP/CB/MWCNT composites were prepared under the processing conditions (injection flow rate of 70 cm3/s, melt temperature of 200°C, and void fraction of 5%.). The effect of hybrid filler with different aspect ratios on the T-P electrical conductivity was investigated. In this experiment, the T-P electrical conductivity of composites with hybrid fillers increased by five orders of magnitude compared to composites with only CB. The results of this work reveal that the synergistic effect between fillers can greatly enhance the T-P electrical conductivity of composites.
The results in this work provide a method for preparing lightweight conductive products at a low filler content and reveal the potential application of foaming injection molding to prepare high-conductivity products.
Footnotes
Author contributions
The conceptualization for the present study was performed by the authors ST and BD; methodology by BD, ST and MX; investigation by ST and MZ; data curation by YG and CZ; writing-original draft preparation by ST; writing-review and editing by BD; and funding acquisition by BD. All authors analyzed the data and contributed to scientific discussion.
Declaration of conflicting interests
The author(s) declared no potential conflicts of interest with respect to the research, authorship, and/or publication of this article.
Funding
The author(s) disclosed receipt of the following financial support for the research, authorship, and/or publication of this article: This work was supported by the Education Department of Henan Provincial (grant number 14A430008) and National Natural Science Foundation Item (grant numbers 11572290 and 11432003).
