
Abstract
Public secrets are the information the public chooses to keep from itself. Architecture is required to both house and operate these secrets. Community sanctions are arguably a public secret. This study analyses the most visible aspects of community sanctions, probation and parole offices, to understand whether and how their architectural features help keep the system hidden. By analysing photographs of such offices, I argue that not only do the building features help maintain community corrections as a public secret, but they also keep the systems secret from the public. I also argue that keeping the offices intentionally obscured may also impact how those under supervision are viewed by the general public.
Secrets are the information we do not know. Public secrets, on the other hand, are more insidious. Public secrets are the ‘secrets the public chooses to keep safe from itself…’ (Daniel, 2006), or, put more bluntly, knowledge that is known ‘but cannot be spoken’ (Taussig, 1999: 51). Public secrets are maintained through a community that knows what not to know. In other words, public secrecy is not simply ignorance; rather, it is the way secrecy operates in the everyday, such that the secret becomes banal (Taussig, 1999; see also Radcliffe, 2008).
Public secrets allow institutions to maintain their power and position. As Taussig (1999: 6) argues, ‘knowing what not to know lies at the heart of a vast range of social powers and knowledges intertwined with these powers…it being not that knowledge is power but rather that active not-knowing makes it so’. Without public secrecy, social systems and structures would fall apart. This maintenance of power operates at a variety of levels. For instance, in Brazil, public secrecy helps maintain the power of drug traffickers (Penglase, 2009). In government auditing of public schools in Chicago, the pragmatic approach utilized upholds structural inequalities in public school funding rather than challenging public secrets about assumed winners and losers (Radcliffe, 2008).
In the US criminal justice system, the expansion of the prison system is a clear example of a public secret: while the public knows prisons exist, they choose not to know the impact incarceration has on individuals and communities (Daniel, 2006), thus providing more power to the prison industrial complex to operate as it chooses. As Alison Young (2011: 59) notes, ‘public secrecy requires an architecture to house its operations and personnel to carry out its activities’. For many correctional systems, the architecture of prisons plays a key role in maintaining its secrecy. The very nature of prison architecture requires closedness and secrecy to some extent (Wilkinson, 2018) and suggests an out of sight, out of mind mentality (Jewkes, 2017). The prison’s architecture helps ensure ‘the public secrets of economic and political power are kept safe’ (Daniel, 2006). In other words, architecture helps maintain prisons as a public secret by purposefully keeping the prisons a secret from the public.
Prisons, however, may not be the only criminal justice institution that are a public secret. One could argue that community sanctions, too, are public secrets: the public is generally aware that individuals are sentenced to community supervision but, as with prisons, agrees not to know the impact of community corrections on individuals and their communities. Community sanctions as a public secret may be furthered by the systems’ (in)visibility. As Robinson (2016: 104) argues, community sanctions have no obvious physical architecture or structural locus (beyond probation and parole offices and supervisees’ homes) and those who administer them tend not to wear uniforms, such that both sanctions and those who enact them fail to generate ready images or occupy any significant space in the public imagination.
Even when there is physical architecture, the buildings themselves raise questions as to whether community sanctions are a public secret or if, on the other hand, the buildings help maintain the sanctions a secret from the public. Two studies on the architectures of probation and parole buildings highlight this duality.
In a study analysing the look and feel of a US parole office, I (Shah, 2015) argue the location and design of the building suggests parole in general and parolees specifically are not a part of the larger community and purposefully hidden from the general public. I also found the majority of signage was either directed at parolees or only visible when standing in front of the building, suggesting the building was not intended to be a public space. In a study of probation offices across Europe, Carr and colleagues found the signage of the buildings studied ranged from clear and visible to virtually invisible (Carr et al., 2015; Worrall et al., 2017). As they note, their data raised questions ‘about the role of exterior signage in the creation and communication of messages about stigma and/or reintegration, and in promoting the visibility of probation to the general public’ (Worrall et al., 2017: 274).
In terms of the impact of exterior architectural design, I (Shah, 2015) argue the design may have both helpful and harmful impacts. The way in which the building design hides the office may protect the identity of parolees but may also pose a challenge to parolee/parole agent relationships as the inconspicuous nature of the building may make it difficult to find, which could cause a parolee to be late for a meeting or miss it altogether. On the other hand, focus groups with probation officers suggest the high visibility of a probation office may help probationers and the probation system feel they are a part of the community (Worrall et al., 2017).
These two studies find the exteriors and architectures of probation and parole offices raise questions about social inclusion and exclusion, the very purpose of community corrections, and the relationship of mass supervision to the community. These findings also suggest a more in-depth study of the messages communicated by the architectures of community corrections will help discern whether the design of probation and parole offices maintain community corrections as a public secret, a system hidden from the public, or both.
The current study seeks to address some of these questions. This study focuses on the most visible aspects of community sanctions, probation and parole offices, and builds on Young’s (2011) argument that public secrecy requires architecture. The goal of this project is to study the exterior architecture of probation and parole offices to determine whether and how the features of the offices invite the public in or keeps them at arm’s length. As such, this project asks the following questions: In what ways do probation and parole offices display architectural elements of openness? In what ways do they not display these elements? The objective is to understand whether and how the exterior architectural features help keep the system hidden and limit access to the community.
Methods
Case selection
This study draws on an analysis of probation and parole offices throughout Michigan (MI) and California (CA). These states were chosen because of the different ways in which their probation and parole offices are organized, offering the ability to study whether administrative organization impacts the public appearance of these offices. There are 94 offices in MI and 104 in CA for a total of 198 offices. The offices studied were randomly selected; however, because of the way offices are organized in each state, the selection process was slightly different.
In MI, all probation and parole offices are organized through the state’s Department of Corrections, with probation offices administered by county officials and parole offices administered by state officials. The offices are divided into 10 regions. All of the regions, except for Region 10, are divided on the county level. Counties with smaller populations had one office, which held both a county probation office and a state parole office. Larger counties had two, one each for probation and parole. Region 10 is divided into districts with both probation and parole offices. In order to select the offices, I visited the Department of Corrections’ website that includes a list of all probation and parole offices in MI. The number of offices per region/subregion ranged from 2 to 13. The offices were numbered and two offices from each region and subregion were randomly selected using a random number generator. This resulted in 27 total offices (see Figure 1(a)) – 12 combined offices, 8 parole only, and 7 probation only – representing 28% of the population.
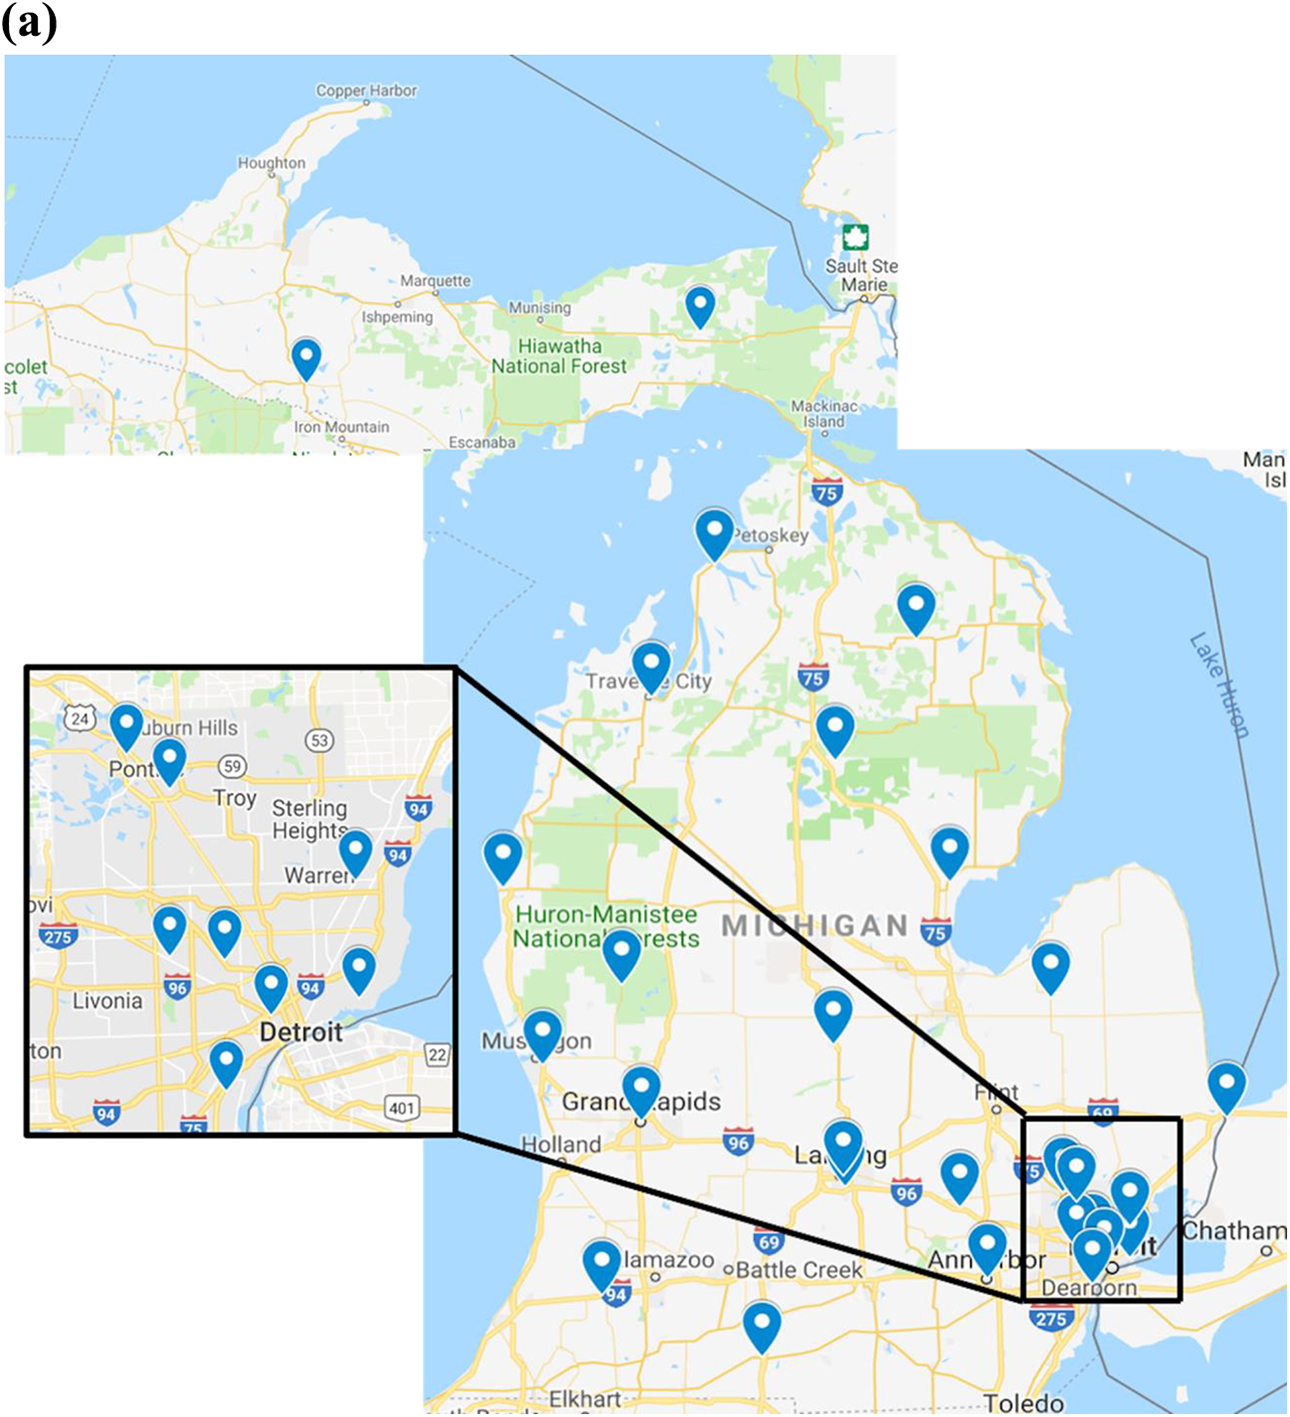
(a) Map of community corrections offices documented in Michigan. (b) Map of community corrections offices documented in California.
In CA, probation and parole offices are divided between state and county governments. All parole offices are organized and administered through the state’s Department of Corrections and Rehabilitation. These offices are divided into two regions: Northern and Southern. Probation is run individually through each of the state’s 58 county governments. Offices were selected in two phases. First, I visited the Department of Corrections and Rehabilitation’s website to determine the location of parole offices. Each office was numbered, and a random number generator was used to select 28% of the offices in each region, resulting in 13 offices. Second, I obtained a list of CA counties in alphabetical order and divided them into the same two regions as the parole offices. These counties were then numbered and 28% were randomly selected using a random number generator, resulting in 16 offices. I then searched each county’s government website to determine the location of each probation office. In total, 29 probation and parole offices in CA were selected (see Figure 1(b)).
Data collection and analysis
Photo documentation served as a means of visually documenting the exterior of probation and parole offices. Similar to Carr and colleagues (2015: 181), a visual approach was chosen as ‘images would potentially bring the field of offender supervision into view’. Furthermore, visually documenting the offices allowed for a comparison across multiple offices and locations (see Figure 1(a) and (b)). I visited the offices on the weekends and after hours on weekdays. This allowed me to focus on the buildings themselves without capturing people. 1 Photographs focused on the exterior of the buildings and any visible signage.
Photographs were coded using Pati et al.’s (2007) six categories of architectural openness (Table 1). Openness was chosen as the analytical frame as it is ‘seen as reflecting the responsiveness, transparency, and accountability of government’ (Pati et al., 2007: 309). In other words, the more open the architecture, the less of a secret the building is from the public. While the age of the buildings varies and reflects different architectural time periods, they were coded using a modern sense of architectural openness to discern how the general public today perceives these buildings. Each office was coded on a scale from 0 to 2 for each category of openness: 0 when the office did not include an architectural feature; 1 when it somewhat included an architectural feature; and 2 when it did include an architectural feature (see Table 2). ‘Security mitigation’ was reverse coded. As indicated by Pati et al. (2007: 315), ‘obtrusiveness of security apparatus discourages people from entering’, so security devices should blend in with the surrounding area to increase accessibility. As such, security mitigation was coded as 0 when security devices were not visible, −1 when security features were somewhat visible, and −2 when security features where clearly visible. In this way, an ‘openness scale’ was developed with a highest total score possible of 22. The higher the total number of points an office received, the more open it is. The lower the total number of points received, the less open – or more hidden – the office is (see Figures 2 and 3 for examples).
Openness codes.

From: Pati et al. (2007).
* Coded based on exterior information.
** Not coded.
Openness average scores.

MI: Michigan; CA: California.

(a) Michigan office showing an articulated entry, visible entry, inviting entry, multiple entrances, easy accessibility to all, local and city scale, some clarity, and some inclusiveness. (b) California office showing a somewhat articulated entry, visible entry, inviting entry, multiple entrances (some of which are open to all), easy accessibility to all, and clarity of purpose.

(a) Michigan office with architectural features that keep the office hidden. (b) California office with architectural features that keep the office hidden.
That said, not all codes and subcodes applied. As analysis only focused on the exteriors, two subcodes (accessibility to spaces within the building and transparency from the inside out) and one main code (natural light as a source of illumination) did not apply. Organizational clarity was coded based on signage on and around the building. Finally, openness as inclusive was coded based on the ability to use the building grounds for public (non-judiciary) functions.
Three offices could not be fully coded. One office had a sign on the street but was not visible from the street. The second office was at the far end of a long street, was the only building at the end of the street, and was fairly secluded. As the goal of this project is to discern how the general public perceives these offices, photographs were taken of the street-level signs and surrounding area, but not the offices themselves. The third office had signs pointing in the direction of the office, but I could not find the building. As such, I again took photographs of the signage. These offices were coded for the categories related to the area surrounding the building, but not for the codes relating to the building itself.
Findings
Openness as accessibility
Accessibility to site
Accessibility to the site refers to ‘[e]asy accessibility to all people of the city and the suburbs and proximity to other important buildings in the downtown’ area (Pati et al., 2007: 312). Offices that are fairly rural, lacked public transportation, and are the only office for the county were coded as 0. As these offices were located in small towns, the lack of public transportation makes it difficult for those without their own transportation to visit the offices. These offices did have free parking, however, so that is not a concern for those with private transportation. As the only office for the county, individuals may have to travel an hour or more to visit the office, raising questions as to how accessible the office is for both those under supervision and those employed in the offices.
Offices that are in suburban or urban areas, are centrally or semi-centrally located, and have free parking were coded as 1. Signs of public transportation (i.e. bus stops or subway stops within a mile walk) were coded an additional 0.5. Given the studies that find access to reliable transportation, including public transportation, is a challenge for low-income populations (e.g. Denmark, 1998; Fletcher et al., 2010; Garrett and Taylor, 1999) – populations similar to individuals on probation and parole – and research highlighting the numerous challenges women under supervision face accessing reliable transportation (Bohmert, 2016; Bohmert and DeMaris, 2018), it is likely that some individuals will still struggle to access the offices. As such, no office was coded as 2 (fully accessible). Two offices (both parole), however, were not coded with the additional 0.5. While there was a bus stop within a few blocks, free public parking was not available. The only available parking was either paid parking garages or metered street parking, which limits accessibility to those who are able to afford to go to the office and potentially creates financial hardships for those who must go to the office but have a lower socio-economic status.
Across all offices, the average score for access to the site was 1.14. Probation and parole offices had similar averages (1.24 and 1.21, respectively) with combined offices being the least accessible (average score 0.85). CA and MI had similarly accessible offices (average score for all offices 1.17 and 1.11, respectively), with MI probation offices (average score 1.5) and CA parole offices (average score 1.23) being the most accessible. Roughly 60% (n = 34) of the offices were centrally or semi-centrally located, had free parking, and had public transportation within a mile walk from the office. This number includes all of MI’s probation offices, the majority of MI’s parole offices, and the majority of all CA offices. Only MI’s combined offices seemed to be lacking in public transportation. Nine offices (four in MI; five in CA) were not at all accessible. All nine offices were located in rural areas and lacked public transportation.
Accessibility to building
Accessibility to the building refers to the interface between the street and the building. This accessibility is translated in six ways: (1) articulated entry; (2) visible entry; (3) inviting entry; (4) multiple entrances; (5) security mitigation; and (6) easy accessibility to all. Combined, these factors create openness by inviting interaction between the public and the building.
Articulated entry
Articulated entry refers to using architectural features to differentiate the entrance from the rest of the building. Across all offices, the average score was 1.39. Combined offices were the most likely to have articulated entrances (average score 1.69), followed by probation offices (1.48) and parole offices (1.10). MI offices were more likely to have articulated entrances largely because all combined offices and all but one probation office had semi- or fully-articulated entrances. Half of MI parole offices were semi- or fully-articulated. For CA, all but three probation offices and all parole offices had semi- or fully-articulated entrances; however, the offices with articulated offices were more likely to be somewhat differentiated from the rest of the building rather than fully differentiated. On the whole, though, entrances are distinguished from the rest of the building in some way.
Visible entry
Visible entry refers to entrances that are clearly visible by being located in a prominent location or being visible as one approaches the building. The average score across all buildings, 0.79, suggests the entrances are not very visible. Probation offices were the most visible (average score 0.96), followed by combined offices (0.85) and parole offices (0.57). CA offices (average score 0.93) were more likely to be visible than MI’s (0.85). Ten (62.5%) of CA’s probation offices and six (46.2%) parole offices were partially or clearly visible. Of those, however, only 10 offices (34.5% of all offices) had clearly visible entrances. For the MI offices, seven (53.4%) combined offices, two (25%) parole offices, and four (50%) probation offices had partially visible or clearly visible entrances. Of those, only five offices (17.9% of all offices) had clearly visible entrances.
Inviting entry
Inviting entry refers to the attractiveness of the entrance, or ‘infus[ing] seductiveness to enhance accessibility’ (Pati et al., 2007: 314). This can be accomplished by creating a procession from the street or parking lot to the entrance through landscaping. Entrances that included dedicated concrete pathways but did not incorporate landscaping (flowers, trees, etc.) along the path were coded 1. Entrances that also included landscaping were coded 2. Across all offices, the average score was 0.83. Combined offices were more likely to have inviting entrances (average score 1.08), followed by probation offices (0.81) and parole offices (0.70). In CA, roughly a quarter of all offices (24.1%; five parole and two probation offices) had entrances that included both a pathway and landscaping. On the other hand, almost half of the offices (48.2%; eight probation and six parole offices) did not even have a clear pathway from the street or parking lot to the entrance. In MI, almost a third of all offices (32.1%; six combined and three probation offices) had entrances that included both a pathway and landscaping. Similar to CA, half of the offices (50.0%; five combined, three probation, and five parole offices) did not have a clear pathway from the street or parking lot to the entrance. Thus, the majority of offices either did not have an inviting entry or had only a clear pathway, but no landscaping.
Multiple entrances
Multiple entrances refers to several public entrances, thus making it easier to enter the building near the desired office. Across all offices, the average score was 0.64, with the combined offices as the most likely to have multiple entrances (average score 0.92). The buildings with multiple entrances where all or some could be used by the public (20 buildings or 35%) were buildings that also held other government offices or businesses and not just probation or parole. All but two stand-alone offices (both in CA) had only one public entrance. In general, the buildings did not typically have multiple entrances and/or not all entrances were open to the public, suggesting most offices are not open.
Security mitigation
As noted above, security mitigation was reverse coded, so a lower average score indicates greater openness. Across all offices, the average score was −1.28, indicating offices were somewhat open. Combined offices (average score −1.85) were the least open and probation offices were more open than parole offices (average score −0.86 and −1.15, respectively). CA’s offices averaged −1.0 as security features ranged from not visible to somewhat visible to fully visible. MI’s offices, however, had little variation and were coded as either 0 or −2. All but one combined office, three parole offices, and three probation offices (25% of all offices) had fully visible security features. In terms of security mitigation, then, CA’s offices varied in openness while MI offices were generally not open.
Easy accessibility to all
Easy accessibility to all refers to accessibility for those with physical challenges. Nearly all offices were fully open (average score 1.93 or 91%), indicating compliance with the Americans with Disability Act’s (ADA) building accessibility requirements (ADA National Network, 2017). 2 Three offices could not be coded (see above) and two offices, both in MI, were coded 0. Although the entrance for both offices was street-level, they did not have any visible markings indicating they are handicap accessible and one office did not have a visible elevator, even though the building was two stories.
Overall openness as accessibility
On the whole, openness as accessibility is limited. Only two offices had total scores that were very open (scores between 9 and 12, the top third of possible scores). Both offices (total accessibility score 9 and 10.5) were in CA. These offices represent the opposite end of the offices. The probation office is located in a very rural area and was a stand-alone office, while the parole office is located in a heavily trafficked area and is located in a large office building. The majority of the offices (33 or 57.9%) were somewhat open, mostly due to higher scores on openness to the building rather than to the site.
Openness as transparency
While openness as transparency includes both the ability to see the interior public spaces from the street and the ability to see out from the interior, it was not possible to determine transparency as it relates to the inside looking out. Only the ability to see into the building and view the public spaces was coded. Across all offices, the average score for openness as transparency was 0.31, with probation offices having the highest level of openness (average score 0.62). CA offices were more likely to be transparent (average score 0.44) than MI offices (average score 0.19). In both states, probation offices (CA average score 0.62; MI average score 0.43) were more likely to be transparent than parole offices (CA average score 0.15; MI average score 0). Interestingly, MI offices that housed both probation and parole offices were in the middle, with an average score of 0.15.
Most of the offices (43 or 75.4%) had opaque, highly reflective glass in the windows and doors by the main entrance. In many cases, the glass in all windows also had opaque windows or were covered with blinds. This was the case even in older buildings and buildings that were not initially designed as probation or parole offices (e.g. a CA office, which was originally a private home), suggesting the windows were deliberately replaced to reduce inside-out transparency. Only three offices, all of which were CA probation offices, had windows and/or doors at the entrance that allowed individuals to see the lobby area from the street or parking lot. No parole offices in either CA or MI or combined offices in MI were fully transparent. As such, in the majority of the offices (94.7%), outside-in transparency is either limited or blocked completely.
Openness as exposure
Openness as exposure refers to ‘the visibility of a building to the public, potentially leading to greater interaction and engagement in the process’ (Pati et al., 2007: 317). There are two levels of exposure: (1) local scale (usually the downtown area) and (2) city scale (usually visibility from major highways). For city scale, offices were coded 1 if they are visible while approaching the local area and 2 when visible from a highway.
In terms of local scale, across all offices, the average score was 0.89, with MI’s combined offices having the highest level of local scale exposure (average score 1.54). Probation offices on the whole are more likely to have local scale exposure (average score 0.91) than parole offices (average score 0.43). In terms of city scale, across all offices, the average score was 0.21. MI’s probation offices (0.57) are the only offices with an average score above 0.5. Across the board, very few offices had any city scale exposure.
When considering the exposure of probation and parole offices on the whole, very few offices are fully exposed. Most offices (36 or 63.2%) had some local exposure and no city scale exposure. Only one combined office in MI, one probation office in MI, and one probation office in CA were fully exposed. Both probation offices are located in large county complexes. Although the combined office is located in a large courthouse in a rural area, it is the focal point for the town, is located at the intersection of two major state routes and can be seen when approaching the area. While 18 of the 57 offices (31.6%) were somewhat open, this is largely because of the offices’ local scale exposure. Only six have any city scale exposure. As such, the majority of the offices (94.7%) have little to some exposure.
Openness as organizational clarity
Openness as organizational clarity refers to the ability ‘to comprehend the functions and spaces within the building’ (Pati et al., 2007: 317). As this study focuses on building exteriors, organizational clarity was based on signage on and around the building that could be read without standing directly in front of doorways. Signs that clearly indicated the office is (or includes) a probation or parole office and could be read from the street or parking lot were coded 2. Signs that indicated the building was a government or county office were coded 1. Offices without any signage or signs that could only be read if one stood directly in front of the door were coded 0.
The average score across all offices was 0.72. While on the whole probation offices were more likely to be clear (average score 0.96) than parole or combined offices (average score 0.43 and 0.77, respectively), that is not the case on the state level. In CA, probation offices were the most open (average score 1.13), with parole offices generally lacked organizational clarity (average score 0.23). In MI, however, combined offices and parole offices were the most clear (average score 0.77 and 0.75, respectively), with probation offices less clear (0.57). On the whole, though, very few offices have exterior signage that clearly articulates their purpose or function. Only eight offices (14.0%) had signs that were legible from the street or parking lot and clearly labelled the office as probation and/or parole. Two of those offices were parole offices in MI and six were probation offices in CA. While 26 offices (45.6%) did include signage that the buildings held government offices, they did not specify what type of offices. Almost half (24 offices or 42.1%) had either no signage or no signage that was visible without standing directly in front of the entrance.
Openness as inclusiveness
Openness as inclusiveness refers to the ability to use the office for non-traditional functions such as civic events, graduations, exhibits, or ceremonies. For this study, inclusiveness focused on the ability to use the office grounds for non-traditional purposes. In general, the offices were not inclusive spaces. The overall average was 0.16. None of the parole offices had space for public events or interaction. Three of the combined offices and two probation offices (one each in CA and MI) had some green space that could be used as a picnic area or location for a public event, but the spaces were not very large. Only two probation offices, both in CA, were completely inclusive. One office is located in a large civic centre complex that also includes walking trails, a lake, and other park-like areas. The other is located in a rural area, but the building holds both the probation office and a social hall with a playground in front. The vast majority (50 offices or 87.7%) were not inclusive at all.
Overall openness
Across all offices, the average openness score is 7.6 out of 22 (see Table 3). The majority of offices (32 or 56.1%) were not open and the remaining offices (25 or 43.9%) were somewhat open. No offices ranked high enough to be considered very or fully open. Probation offices (average score 8.46) and combined offices (average score 8.62) were more open than parole offices (average score 6.02). MI and CA offices had essentially the same level of overall openness (overall average score 7.61 and 7.62, respectively). Interestingly, CA probation offices were more open than MI’s (average score 8.5 and 5.19, respectively) while the reverse is true for parole offices (CA average score 6.54; MI average score 8.5). MI’s combined offices were the most open with an overall average score of 8.62. This may be because most of the combined offices were also located in larger buildings that held numerous offices and did not target just the mass supervision community. Across all parole offices, only three (14.3%) were somewhat open. This pattern holds for CA and MI, respectively. On the whole, the offices are not very open.
Openness scales.

Note: Percentages may not equal 100% due to rounding. Offices that were unable to be coded were counted as ‘0’. MI: Michigan; CA: California.
Discussion and conclusion
While the majority of offices are somewhat open, this is only because of two main factors: overall accessibility and organizational clarity. These two categories were the only ones that had over 50% of all offices ranked as somewhat or very open. In the remaining three categories, the vast majority of offices were ranked as not open. That said, only 3 of the 12 subcategories had an average score above 1.0, suggesting that without these three subcategories, few if any offices would be somewhat or very visible.
Within overall accessibility, only three of the seven categories seem to be driving the overall score. On the whole, the location of the buildings is somewhat accessible, with all offices averaging a score over 1.0. The only offices to not meet this threshold are MI’s combined offices. This is not surprising, however, as these offices are more likely to be located in rural areas and are the only offices to serve the entire county. All offices, regardless of type or location, had somewhat of an articulated entry. Thus, once an individual found the office, there is a good likelihood the main entrance is somewhat distinct from other doorways. That said, all other aspects of entrances are not open and likely serve as a barrier to the visibility of the offices. Finally, all offices were accessible to all, but as this is a legal requirement, this score is also not surprising.
In terms of organizational clarity, the variety in level of signage is similar to other studies (Carr et al., 2015; Shah, 2015; Worrall et al., 2017). That said, while over 50% of offices were ranked as somewhat or very open, this rank is not consistent across offices. Indeed, the overall rank for organizational clarity is driven by probation offices in both states and combined offices in MI. MI parole offices were evenly split between not open and somewhat/very open, while the vast majority of CA parole offices were not open. Additionally, most of the organizational clarity centres on signage that notes the offices are government or county offices, with very few offices clearly indicating that a probation or parole office is housed within. That said, CA probation offices were the only ones with an average score above 1, suggesting these are the only offices in which signage is consistently legible from the street or parking lot and are most likely to be labelled as probation offices. In other words, organizational clarity is achieved not through transparency across offices, but in selective distribution of knowledge.
While the states for analysis were originally chosen for their differences in administrative organization, the data indicate such differences do not seem to impact office visibility and openness, with two exceptions. While few offices were clearly labelled as probation or parole, CA probation offices were the most likely to not only have signage, but to also have signage clearly labelling each building. This suggests that CA county governments, which independently administer probation, are more willing to not only label county and government offices, but also more willing to clearly indicate the purpose of the office. This in stark contrast to the state’s parole offices, administered as a whole through the California Department of Corrections and Rehabilitation, none of which had visible signage noting the purpose of the office and only three of which clearly noted it was a state office. In CA, at least, it seems it is more acceptable to advertise probation than to advertise parole. While MI’s offices were more likely to have some signage, only two offices were clearly labelled (both of which were parole offices), which also suggests that state-level administrative decision makers are not comfortable clearly marking the purpose of each building. While it is not possible to draw definitive conclusions, administrative organization does seem to impact what type of signage is included on each building. Further research is warranted, however, to determine why this division exists between county and state-level preference and whether such preference holds in the larger population of probation and parole offices.
Additionally, MI’s probation and combined offices were the only ones in which the majority of offices were somewhat or very open in terms of local scale exposure, meaning these offices were the most likely to be centrally located. As combined offices serve all individuals on supervision in the county, this is not surprising as a central location would arguably enable all county residents to find the building. Interestingly, all offices with clear local exposure are located in large county judicial complexes. Thus, while MI offices are likely to be centrally located, this is only because these offices are also located with other government offices and not located in stand-alone buildings. This finding again suggests there is something unique about probation offices, compared to just parole offices, that is worthy of more openness.
Ultimately, however, the lack of openness in these offices does suggest the architecture of community corrections buildings becomes a tool for maintaining a public secret. Specifically, the architecture exemplifies Van Veeren’s (2019: 196) notion of invisibility as a barrier: ‘practices that look to control what cannot and should not be seen alongside what can and should be seen’. The lack of accessibility, transparent windows (including altering older buildings so they become less visible), exposure, signage, and inclusiveness are all practices that control the visibility of community corrections. In this case, however, these practices maintain community corrections as that which is intentionally hidden. By designing offices of community corrections or embedding them in larger buildings, so that these offices are hidden in plain sight, government agents link offices of community corrections to systems ‘where knowledge exists independently and distinguishably from these barriers, making over, in the process, its own productive and contingent power’ (Van Veeren, 2019: 197). This closedness also echoes Millie’s (2012) finding that some police offices are also purposefully kept out of the public gaze. Like many of the probation and parole offices studied here, Mille found some of the police offices kept their blinds closed, which signalled a space that was inaccessible and unfriendly. In both cases, openness would imply opening up the power dynamics of supervision to scrutiny. Closedness, however, maintains these power dynamics as a public secret (Daniel, 2006; Taussig, 1999).
At the same time, the architecture also keeps these buildings – and thus these systems – secret from the public. To some extent, this hidden in plain sight design may be out of necessity as invisibility as barrier also maintains safety (Van Veeren, 2019). As I (Shah, 2015) argue, this form of invisibility could be a safety feature for probationers and parolees. Specifically, the lack of signage ‘could mean that passersby would not know who is entering the building or why. Additionally, the opaque glass doors means that it is difficult to know who is waiting in the lobby…’ (Shah, 2015: 330). As agents in Worrall et al.’s (2017) study argued, buildings that are not obvious or neutral could be welcoming for both agents and supervisees, such that those entering the office may be viewed as entering a doctor’s office or some other socially acceptable location. Thus, the exterior architecture may help maintain the anonymity of those who must visit the offices and reduce the stigmatization that may otherwise come with greater public knowledge.
This safety, however, is not without its problems. For example, Mille (2012) found that police buildings struggled with maintaining their presence as a public building and their need to maintain security. Like many of the probation and parole offices studied here, some police stations are located far from the town centre as doing so means greater options for parking of police and visitor vehicles. But this placement away from the centre of town, like the placement of many of the probation and parole offices, also creates isolation. This isolation, in turn, creates a situation where these offices are hidden – and kept secret – from the public.
Perhaps more importantly, the invisibility of these buildings also makes it difficult for the public to envision what these systems are and do (see also Robinson, 2016). As Fitzgibbon et al. (2017: 306) argue, ‘our difficulty in imagining these sanctions creates an important deficit in penal-political and democratic deliberation about them’. Openness, particularly if such openness comes with greater transparency, would thus make it difficult for the public to remain purposefully ignorant: if the systems are visible and open, the general public can no longer say they do not know what not to know and would, ideally, find it easier to engage in conversations about the very purpose and effectiveness of community sanctions. The public, then, is at once kept ignorant of these systems, but also helps maintain these systems as a public secret as the banality of the buildings allow them to be kept out of sight, out of mind.
As Van Veeren (2019: 198) also argues, invisibility can also be seen as culture in which those with marginalized identities are ‘rendered invisible as a form of violence’. We see this violence in the design of prisons, which conveys a message of prisoners as dangerous others who deserve to be placed in such terrible environments (Jewkes, 2018). This violence can also be seen in the ways in which probation creates what McNeill (2019: 19–20; see also Fitzgibbon et al., 2017) refers to as the ‘Malopticon’, in which penal subjects suffer not hyper- or super-visibility; rather, they suffer the pain of not being seen; at least not as they would recognize themselves…But not only is the subject of the Malopticon seen badly; he [or] she is seen as bad. If that badness is no longer cast primarily in terms of moral disapprobation, then it is cast as the risk-based calculation that he or she is, above all else, a bad bet (emphasis original).
This lack of visibility of community corrections offices not only disempowers those who are supervised, but also reinforces the notion that such individuals are inherently bad, thus making it more difficult to overcome these assumptions (Van Veeren, 2019). Given the disproportionate representation of those with a marginalized identity in correctional spaces, the invisibility of probation and parole offices – one of the aspects of community supervision that should be visible (Robinson, 2016) – only furthers racist, classist, gendered, and ableist assumptions (among others). The architecture of these offices, then, reinforces the power of government actors (Daniel, 2006; Young, 2011) while rendering those who are supervised as the Other (see also Worrall et al., 2017).
These findings thus raise questions about the role of community corrections both within the criminal legal system and society at large. In terms of the criminal legal system, the lack of transparency and openness of these buildings raises questions about how the hiddenness and invisibility impacts those who work in or are required to visit the offices. Given studies that find the interior design of probation offices (Carr et al., 2015; Harrison, 2015; Phillips, 2014) and the use of this design by staff members to interact with supervisees (Doggett, 2017; Irwin-Rogers, 2017) impacts the relationship between supervisors and supervisees, and other research on the impact of prison/jail architecture on behaviour (Beijersbergen et al., 2016; Morris and Worrall, 2014), it is likely the exterior architecture also has an impact. The division between signage and location of probation offices compared to parole offices suggests a need to understand how administrators view both and the impact of this view on building design and placement. These findings and prior studies suggest the need to better understand how community corrections buildings impact how supervisors view their positions and how supervisees view their place in society at large. Following the work of St. John and Blount-Hill’s (2019) call for a consideration of placial justice, these findings also raise questions as to whether it is possible to hold probation and parole in offices that ensures the well-being of those supervised, those doing the supervision, and those linked to such spaces (e.g., family members; service providers) as they currently exist. Finally, in terms of society broadly, these findings also suggest the need to understand how the lack of openness and transparency impacts the general publics’ perception of community corrections and the impact more transparency might have on both the general public and the role of community corrections broadly.
Footnotes
Acknowledgements
I acknowledge the traditional owners of the land on which the research presented in this article was conducted. I am thankful to Dr Kathryn Henne, the respondents at the 2018 ASC panel on public secrets and EMU Place/Performance/Identity Symposium, and the anonymous reviewers of Probation Journal for their feedback. I am especially grateful to Dr Kimberly Barrett for joining me for part of the data collection and being a sounding board throughout the data collection process.
Declaration of Conflicting Interests
The author(s) declared no potential conflicts of interest with respect to the research, authorship, and/or publication of this article.
Funding
The author(s) disclosed receipt of the following financial support for the research, authorship, and/or publication of this article: This work was supported by the EMU Faculty Research Fellowship and EMU Provost Research Support Award.