



Abstract
The Test of Perceived Motor Competence for children with visual impairments (TPMC-VI) is currently content validated. Further validation and reliability were needed to report the psychometric properties of the TPMC-VI; therefore, the purpose of this study was to examine the construct validity and the internal consistency for the TPMC-VI. Children aged 3–8 years with visual impairments completed the TPMC-VI with assistance from their parents or members of the research team. Results indicated that the TPMC-VI is a valid and reliable (α = .68) assessment. Researchers and practitioners can confidently use the TPMC-VI to evaluate children’s perceived motor competence.
Perceived motor competence (PMC), or one’s thoughts or beliefs in personal ability to perform gross motor skills (e.g. running, skipping, or hopping), may be one of the most powerful predictors of physical activity in children, adolescents, and youth (Babic et al., 2014). Participating in physical activity on a regular basis promotes health-related fitness and can combat negative effects associated with obesity and a sedentary lifestyle (Robinson et al., 2015). Unfortunately, many young children with visual impairments demonstrate low levels of physical activity (Haegele & Porretta, 2015). Children with visual impairments are almost twice as likely to be overweight or obese than peers who are sighted (Weil et al., 2002). As a mechanism to combat obesity, intervention strategies are needed to increase physical activity levels and decrease sedentary behaviors of children with visual impairments.
Frequently, physical activity interventions focus on improving acute participation in moderate-to-vigorous physical activity (MVPA; Haegele & Porretta, 2015) and/or developing gross motor skills (Haegele, Brian, & Goodway, 2015). To drive children’s future choices with regard to MVPA, interventions should promote PMC as well (Babic et al., 2014; Robinson et al., 2015; Stodden et al., 2008). Individuals with higher levels of PMC often persist with tasks that may be perceived as challenging (Harter, 1978), such as vigorous physical activity or games/sports that require gross motor skill competence. In addition, higher levels of PMC associate with an increased likelihood of choosing to participate in physical activity throughout the life span (Robinson et al., 2015).
Few interventions exist for promoting physical activity in youth with visual impairments (Haegele & Porretta, 2015) and most do not promote PMC (Brian, Haegele, & Bostick, 2016a; Brian, Haegele, Lieberman, & Bostick, 2016b). Regardless, assessing PMC levels of young children with visual impairments may be challenging due to a lack of available valid and reliable instruments (Brian et al., 2016a, 2016b). The Pictorial Scales for Perceived Competence and Social Acceptance Perceived Physical Competence (PPC) subscale (Harter & Pike, 1984) is consistently used as an assessment of PMC for young children who are sighted. The PPC is valid and reliable, but features pictorial plates as its mode of delivery (Harter & Pike, 1984), making it unsuitable for children with visual impairments. The PPC requires modification before assessing the PMC of young children with visual impairments.
In 2016, Brian and colleagues modified the PPC by developing and validating the Test of Perceived Motor Competence for children with visual impairments (TPMC-VI; Brian et al., 2016b). Reliability data were not obtained during the initial validation of the TPMC-VI. Obtaining reliability data is necessary to produce psychometric instruments of the highest quality (Ary, Jacobs, Sorenson, & Walker, 2013). Reliability refers to the extent to which an assessment tool generates results consistently either within a sample or across multiple data points (Ary et al., 2013). Instruments can be reliably good (producing accurate results over and over) or reliably bad (failing to produce accurate results over and over) (Ary et al., 2013). Reliability should only be determined after validity is established (Ary et al., 2013).
Validity refers to the extent to which an instrument measures what it originally intended to assess (Ary et al., 2013). Validity can be established in a wide variety of ways including face and content validity (e.g. does the assessment appear to address the constructs as intended) and also through construct validity. Construct validity provides an estimation evaluating the extent to which individual items load into one factor. For example, do the six items of the TPMC-VI load as one factor, PMC? Brian and colleagues provided an estimation of content validity for the TPMC-VI in 2016b. Further validity evidence is also needed to strengthen the psychometric properties for the TPMC-VI. Therefore, the purpose of this study was twofold: to establish the construct validity for the TPMC-VI and to assess the internal consistency of the TPMC-VI to provide an estimate for its reliability.
Methods
Participants and procedures
Prior to the start of this study, the University Review Board approved all procedures. Parents provided informed consent for their children (N = 32) to participate. We secured our convenience sample in one of two ways: email recruitment via online listserv for parents of children who are visually impaired (anonymized per institutional review board [IRB] request; n = 17) or through existing contacts of members of the research team (n = 15). Our sample (N = 32, girls = 19, boys = 13, Mage = 59.95 ± 16.11 months) included mostly Caucasian participants (Caucasian = 69%, Asian = 13%, African-American = 6%, Hispanic = 3%, and other = 8%). In all, 12 participants were co-morbid with other documented disabilities (autism spectrum disorders = 4, attention-deficit hyperactivity disorder [ADHD] = 4, epilepsy = 2, other health impairment = 2). The majority of the sample (n = 19; 60%) had a congenital visual impairment. A total of 26 participants attend public/private schools (81%), with two attending a home school and four a school for the deaf and blind. A total of 25 participants utilized a cane for orientation and mobility.
Participants’ levels of visual impairment were classified based on the United States Association of Blind Athletes (USABA) system. Within the USABA classification system, levels of visual impairment range from B1 to B4. B1 (n = 16) corresponds to little to no light perception, inability to recognize a hand; B2 (n = 6) is better than B1 up to 20/600, with a visual field less than 5 degrees with the best corrective lens); B3 (n = 6) is 20/600–20/200 with a visual field greater than 5 degrees and less than 20 with the best eye and corrective lens; and B4 (n = 4), is 20/200–20/70 with a visual field larger than 20 with the best eye and corrective lens.
Children recruited from the parent listserv filled out an online version of the TPMC-VI with their parents. We provided explicit instructions to the parents that identically matched all procedures on the TPMC-VI manual (Brian et al., 2016b). Parents then filled in all child responses along with demographic information online; the results were disseminated to the research team via SurveyMonkey. Participants recruited from personal contacts completed the TPMC-VI at a center for the blind in a quiet room with a member of the research team. Members of the research team obtained self-reported demographic information directly from all participants. All members of the research team possessed either a doctorate in Kinesiology with special emphasis in motor development and adapted physical education or were doctoral students studying motor development/adapted physical education at the time of data collection. According to SurveyMonkey records and in corroboration with records from the research team, the TPMC-VI required approximately 10–15 min for completion. Participants completed the TPMC-VI one time.
Instrumentation
All participants completed the TPMC-VI (Brian et al., 2016b). The TPMC-VI is a modification from the PPC (Harter & Pike, 1984). The PPC is valid and reliable for assessing PMC of young children. The PPC includes pictorial plates for six global measures of motor proficiency (shoe tying, climbing bars, swinging on a swingset, running, skipping, and hopping) upon which children gauge decisions. While looking at the plate, the test administrator says to the child, “This boy (girl) is very good at climbing, while this boy (girl) is not very good. Which one is like you?” The child points to a picture. The administrator next states, “Is that really true or sort of true for you?” If a child picks the plate that is not very good and then responds with that being really true, the child scores a “1” and with sort of true being a “2.” If the child picks the plate that is very good and corresponds with really true or sort of true, then the child scores a “4” or a “3,” respectively.
The six items within the TPMC-VI are identical to the items within the PPC. The TPMC-VI includes vignettes derived from the original picture plates found within the PPC and uses the same scoring structure. The administrator begins by asking whether the child is familiar with the skill. If the child says yes, then the administrator moves directly to the vignette. If the child says no, the administrator provides the scripted description of the skill content located within the TPMC-VI (Brian et al., 2016b). After the description of the skill, the administrator then reads the vignette. This procedure, which is different than the PPC (the child’s familiarity with the skill is not assessed in the PPC), repeats for all six items. For an extended description of the TPMC-VI, please refer to Brian et al., (2016b).
Data analyses
We conducted a principal component analysis (PCA) to provide a measure of construct validity. Within the PCA, we included a correlation matrix, Bartlett’s test of sphericity, anti-image correlation matrices, communalities, and factor loadings. The correlation matrix shows whether the data set satisfies the assumption of linearity. It is necessary that each variable is correlated at greater than .30 with at least one other variable to satisfy the assumption of linearity. Barlett’s test of sphericity provides an estimation of overall sampling adequacy and needs to be p < .05 in order for the sample to be appropriate for PCA. Anti-image correlation matrices (the diagonal) help to ensure sampling adequacy and should be greater than .5 (Ary et al., 2013).
We assessed normality via skewness and kurtosis of the distribution. In order for a sample to be deemed normally distributed, skewness and kurtosis values need to fall between −2 and 2 (Ary et al., 2013). Communalities represent the amount of variance each variable contributes to the PCA and is expressed as a percentage. Next, rotation procedures included non-rotation, varimax, and oblimin solutions. Data are rotated and decisions upon which structure to retain rely upon theoretical underpinnings and assistance with interpretability (Ary et al., 2013). Following the PCA, we calculated Cronbach’s alpha to address the internal consistency/reliability for the TPMC-VI. Internal consistency can be interpreted as >.5 = unacceptable, .6 = acceptable, .7 = moderate, .8 and above = strong (Ary et al., 2013). We conducted all statistical procedures using Statistical Procedures for Social Sciences (Version 24, Armonk, IL).
Results
We assessed the factorability of all six items within the TPMC-VI loading into one construct (PMC). First, we observed that six out of six items correlated at least .3 with at least one other item (Table 1), suggesting reasonable loadings. Next, Bartlett’s test of sphericity was significant (χ2(15) = 31.58, p = .007). The diagonals of the anti-image correlation matrix were also all above .5 except for shoe tying (.44; Table 2). Finally, communalities were all above .3 (see Table 3), further confirming that each item shared some common variance with other items. Given these overall indicators, factor analysis was deemed to be suitable with all six items.
Correlation matrix for six items from the TPMC-VI.
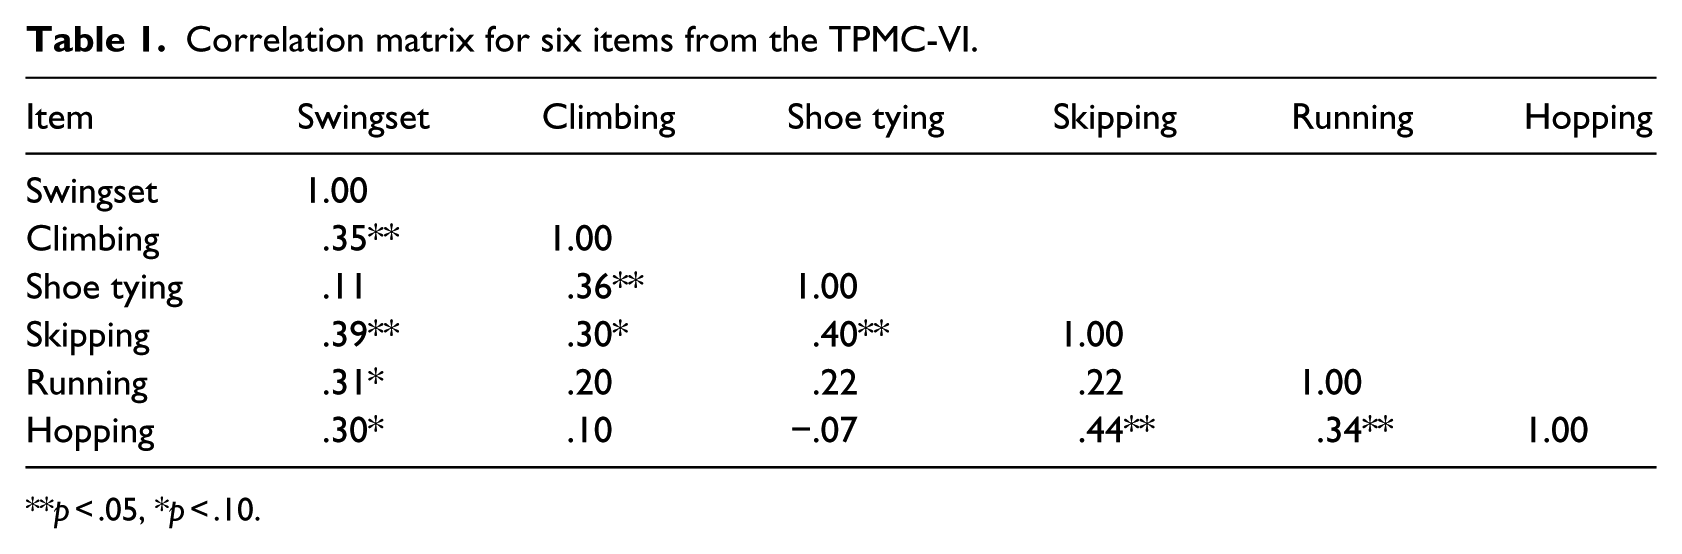
p < .05, *p < .10.
Anti-image matrices correlation diagonals.

p < .05, *p < .10.
Factor loadings and communalities based on a principal component analysis with no rotation for six items from the TPMC-VI.
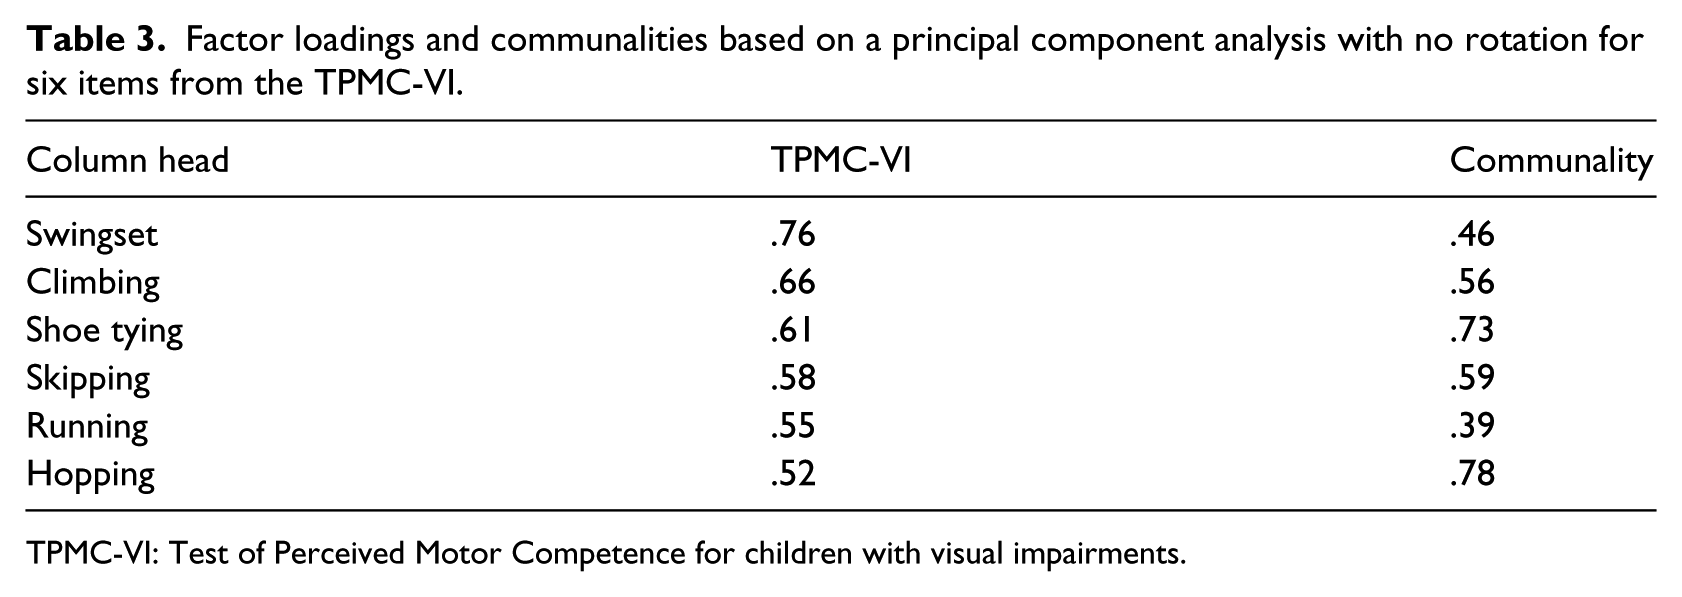
TPMC-VI: Test of Perceived Motor Competence for children with visual impairments.
PCA was used because the primary purpose was to identify and compute composite scores for the factors underlying the TPMC-VI. Initial eigenvalues indicated that the first five items explained 38%, 20%, 14%, 13%, and 10% of the variance, respectively. The sixth item explained 5% of the variance. Solutions for the six items in one factor were each examined using varimax and oblimin rotations of the factor loading matrix. The six-item, one-factor solution, which explained 100% of the variance, was preferred because of (a) its previous theoretical support and (b) the “leveling off” of eigenvalues on the scree plot after one factor. There was little difference between the six factor varimax or oblimin solutions and no rotation, thus all solutions were examined in subsequent analyses before deciding to use no rotation for the final solution. All items in this analysis had primary loadings over .5 (Table 3).
After we concluded the construct validity for the TPMC-VI, we examined reliability. For reliability, we examined the internal consistency for the six items via Cronbach’s alpha. Results show moderate internal consistency (α = .68; Table 4). No increases in alpha for any of the scales could have been achieved by eliminating more items. Moreover, item removal would have resulted in lower internal consistency (α = .57–.67). The skewness and kurtosis were well within a tolerable range (−2 to 2; Ary et al., 2013; Table 4) for assuming a normal distribution.
Internal consistency and normality for TPMC-VI.
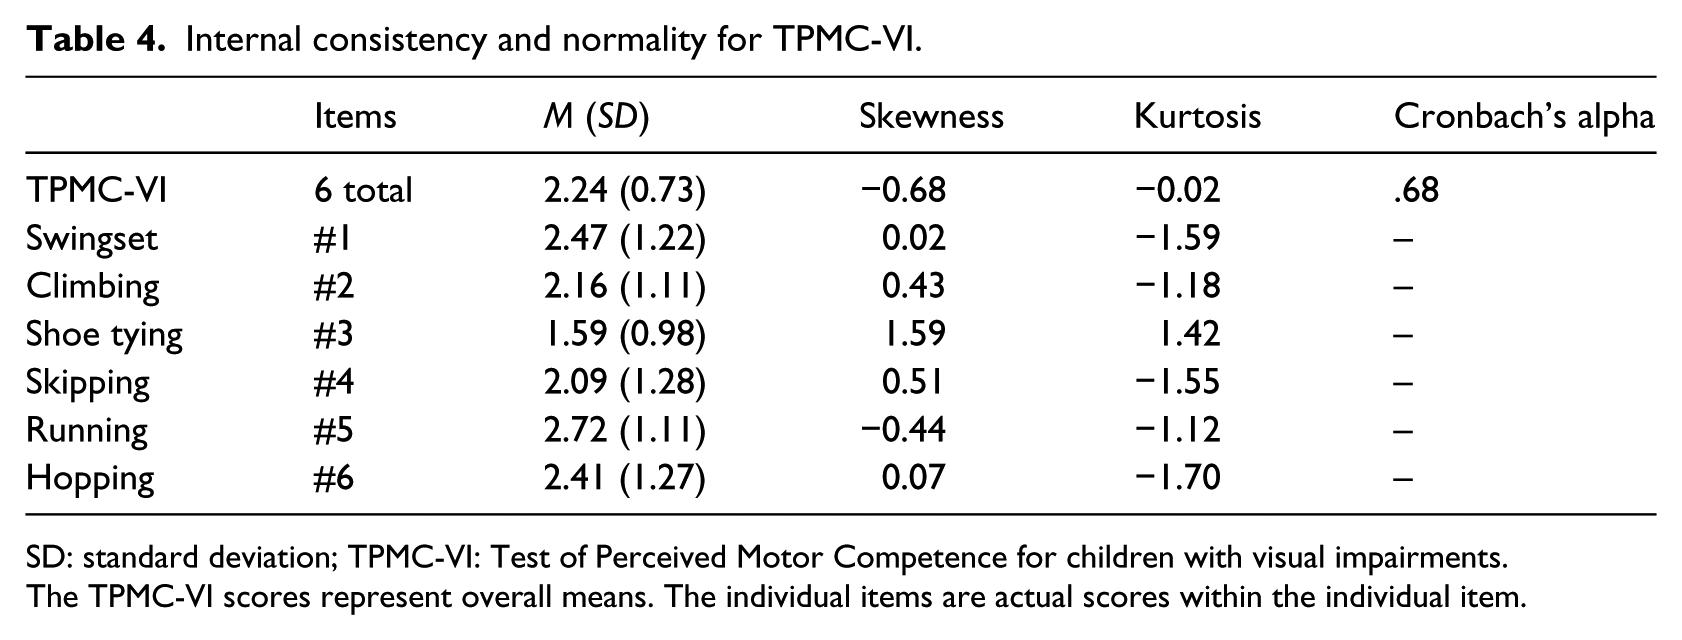
SD: standard deviation; TPMC-VI: Test of Perceived Motor Competence for children with visual impairments.
The TPMC-VI scores represent overall means. The individual items are actual scores within the individual item.
Discussion
The purpose of this study was to determine the validity and reliability for the TPMC-VI. The TPMC-VI is a modified version of Harter and Pike’s (1984) PPC subscale. The PPC is widely used and highly regarded as a valid and reliable psychometric tool for assessing PMC in young children (aged 3–7 years) who are sighted (Harter & Pike, 1984). However, the PPC features pictures and asks children to point to which picture they feel is most like them. The PPC needed to be modified and tested for children who are visually impaired. As a result, we developed the TPMC-VI following similar structures to that of the PPC but altering the pictures to story vignettes. We retained the same items and scoring structure as the PPC when developing the TPMC-VI. Therefore, we tested the TPMC-VI as a six-item, one-factor scale of PMC for children with visual impairments.
A one-factor structure for all six items of the TPMC-VI was evident, based on a principal component exploratory factor analysis with no rotation (.52–.76 factor loadings). The original PPC showed factor loadings considerably lower than the TPMC-VI (.19–.42), indicating strong evidence for the one-factor structure of the TPMC-VI. In addition, the TPMC-VI revealed moderate internal consistency (.68) (representing reliability) compared to acceptable internal consistency shown for the original PPC (.53). Finally, given skewness and kurtosis analyses place the TPMC-VI within normally distributed ranges, the TPMC-VI meets assumptions of normality warranting the use of parametric statistical analyses.
Limitations
Despite the strengths present within this study, many limitations emerge. Although the sample size was considered acceptable, larger sampling could help improve the psychometric property from moderate to strong. Next, future research should consider expanding the TPMC-VI to include ecologically valid items geared toward capturing motor tasks unique to children with visual impairments. Additional ecologically valid items that may be readily available and encourage physical activity participation within this population, such as swimming, running, and rolling a goal ball, are needed.
Conclusion
Children with visual impairments are more likely to be overweight or obese than same-aged peers who are sighted. Children with visual impairments are also more sedentary and participate in less physical activity than sighted peers. PMC is one of the most powerful predictors of physical activity participation, yet few physical activity interventions consider PMC as a variable of interest. Moreover, prior to the creation of the TPMC-VI, no other psychometrics existed to evaluate PMC for young children with visual impairments. The TPMC-VI has been shown to be a valid and reliable assessment of PMC for children (aged 3–7 years) with visual impairments. Researchers can now utilize the TPMC-VI to evaluate intervention effectiveness with regard to PMC, analyze PMC as a correlate, and/or feature PMC as a predictor variable. Practitioners could use the TPMC-VI to assess programmatic effectiveness with regard to this important construct. Moreover, PMC is now an operational construct that practitioners can include within Individualized Education Program goals for children with visual impairments representing the affective domain. For access to the TPMC-VI, please contact the authors of this article as the TPMC-VI is free to use for research purposes.
Footnotes
Declaration of Conflicting Interests
The author(s) declared no potential conflicts of interest with respect to the research, authorship, and/or publication of this article.
Funding
The author(s) received no financial support for the research, authorship, and/or publication of this article.