




Abstract
Individuals with disabilities highlight the importance of having career options, as these people are more likely to have narrowed occupational possibilities and to be employed in part-time and contingent jobs. This study explores (a) the range of occupational possibilities that according to Holland’s Self- Directed Search (SDS) Questionnaire most closely resemble the personality types of 55 young adults with visual impairments, b) the impact of individual characteristics on occupational possibilities, and c) the differences between sighted adults and adults with visual impairments regarding the SDS Questionnaire scores for the six personality types (Realistic, Investigative, Artistic, Social, Enterprising, Conventional). The research instrument was the SDS Questionnaire of Holland. The study results showed that the occupational possibilities for young adults with visual impairments relate mostly to social occupations. Individual characteristics also were found to be significant predictors of individual types according to the SDS Questionnaire. In addition, differences emerged from the comparison between adults with visual impairments and sighted adults in regard to the six personality types identified by Holland, based on the normative data. The study revealed that individual characteristics of young adults with visual impairments play an important role in their occupational possibilities.
Introduction
Work is accepted as being meaningful and important to individuals with disabilities (Saunders & Nedelec, 2014) and critical to their social integration (Houtenville, 2003). However, people with disabilities have fewer opportunities to reach their full employment potential than those without disabilities (Kaye, 2009), as they are more likely to be unemployed (Houtenville et al., 2016), be employed in part-time and contingent jobs, suffer wage discrimination (Baldwin & Choe, 2014; Myers & Sai, 2015; Schur, 2002), and have narrower occupational choices (Maroto & Pettinicchio, 2014; Schur et al., 2009; Taylor & Walter, 2003). It is widely accepted that they face workplace discriminations (Baldwin & Choe, 2014; Freedman & Fesko, 1996; Harris et al., 2013; Jones, 2008; Kaye, 2009), being in many cases characterized as “second-class” employees (Gustafsson et al., 2014).
A lack of career choices is the primary factor that makes them feel disabled rather than their inability to perform a duty (Rabiee & Glendinning, 2010). Confirmation of this can be seen in the fact that individuals with visual impairments appear to be employed at lower rates than sighted individuals (Kruse & Schur, 2003; Shaw et al., 2007), have narrower occupational choices (Sacks et al., 1998), and face workplace discrimination, which mainly consists of not being hired or being fired due to their impairment (Chan et al., 2005). Despite the obstacles, individuals with disabilities appear to want to have the choice of a dream job (Rabiee & Glendinning, 2010). At the same time, however, they are less likely to be optimistic about finding a job that suits them best, maybe because of the awareness that their impairment could be connected to less available suitable vocational choices (Ali et al., 2011).
There is limited research exploring the relationship between the individual characteristics of people with visual impairments with their occupational possibilities. Nevertheless, the literature suggests that vision status (blindness/low vision), gender, age, level of education, and ability of independent movement are factors that influence employment outcomes for adults with visual impairments. For example, gender, which has been found to be associated with employment differences for people with disabilities (Anthony, 1994; Mwachofi et al., 2009; Sevak et al., 2015), is also a significant individual predictor of competitive employment for individuals with visual impairments, with men having more chances to be employed and to gain competitive employment outcomes in comparison to women (Darensbourg, 2013). At the same time, for employees with visual impairments there is a significant difference with regard to their annual earnings, with men earning considerably more than women (Bell & Mino, 2015).
Moreover, another factor associated with employment for individuals with visual impairments is age. In particular, age and severity of vision loss are found to be significant individual predictors of competitive employment (Capella, 2001; Darensbourg, 2013). Αccording to Darensbourg (2013), people aged 36 or younger who have low vision rather than blindness seem to have more chances for competitive employment than older people with similar conditions, whereas Capella (2001) found age to be a significant individual predictor of earnings for individuals with visual impairments, as older employees receive less than younger ones. In general, younger age is linked to more competitive employment (Burke-Miller et al., 2006) and higher employment rates (Ipsen, 2006) for people with disabilities as their employment rates declines with age at a much earlier stage in comparison to people without disabilities (Sevak et al., 2015).
In addition, for individuals with visual impairments a higher educational level is also associated with significantly higher employment rates (Bell & Mino, 2015) and a difference in annual earnings (Bell & Mino, 2015; Capella, 2001). The same applies to people with disabilities in general, where a higher educational level is associated with higher employment rates and earnings (Hollenbeck & Kimmel, 2008), participation in competitive employment (Burke-Miller et al., 2006), and a decrease in the gap between the employment rates of individuals with and without disabilities (Sevak et al., 2015).
With regard to the ability for independent movement, effective orientation and mobility skills are predictors of employment for youth with visual impairments (Cmar, 2015). Adults with visual impairments who use a white cane for movement appear to have considerable higher employment rates and annual earnings in comparison to those who do not use one (Capella, 2001).
The nature of occupations that people with visual impairments and disabilities in general practice can also provide information about their occupational possibilities. Individuals with disabilities, especially sensory impairments, are found to be significantly underrepresented in occupations that require advanced communication skills, whereas those with physical impairments have not be found to be significantly underrepresented in occupations that require advanced physical skills (Kaye, 2009). In general, there is evidence to suggest that individuals with disabilities mostly work in low-skill jobs (Gustafsson et al., 2014). According to the U.S. Bureau of Labor Statistics (2016), employees with a disability are more likely to work in production, transportation, and material moving occupations or to be self-employed as compared to those with no disability, and they are less likely to work in management, professional, and related occupations. Indicative researches regarding the job status of people with visual impairments show that the majority of people with visual impairments work as teachers (Lamichhane, 2012), or hold jobs in sales or service, followed by jobs in managerial or professional positions, in clerical positions and in unskilled labor and they work in the private sector or are self-employed (La Grow, 2004a, 2004b).
People with low levels of compatibility tend to move to jobs more consistent with their personality (Holland, 1996). A key question that can be posed is the level of compatibility of occupational choices to personality for individuals with disabilities. In the case of people with visual impairments, diametrically opposed stereotypes still seem to dominate views about their professional choices, in that it is deemed either that they can perform only specific jobs, such as pianist or singer, or that they can perform all jobs without exceptions (Erin, 2010). The right professional choice for individuals with visual impairments seems to lie in the middle of these two opposite stereotypes (Erin, 2010).
Α leading theory in the field of career choice is the theory of Holland, which has dominated the field of occupational psychology for more than 30 years (Borgen, 1991; Levinson et al., 2002; Reardon & Lenz, 1999). Holland’s theory concerns the relation between the personality of individuals and their vocational choices (Seligman, 1994). According to Holland’s theory, people whose interests and personality are consistent with their jobs tend to be more satisfied and successful in their work (Gottfredson & Holland, 1990; Henry, 1989; Holland, 1985, 1996; Mount & Muchinsky, 1978), to stay longer in their jobs and to be more efficient (Holland, 1996; Robitschek & Woodson, 2006). Holland identified six areas of interest—the realistic, the investigative, the artistic, the social, the enterprising, and the conventional—describing the relevant work environments and personality types of the people concerned (Holland, 1985, 1997), that is collectively known as RIASEC (Holland, 1997).
Subsequently, Holland, based on his theory of career choice, developed the Self-Directed Search Questionnaire (SDS) to measure the six dimensions of the RIASEC (Holland, 1994a). The SDS is a varied assessment tool (Reardon & Lenz, 1999), appropriate for use by individuals with visual impairments once suitable accommodation is made to facilitate access to the tool that allows completion of the questionnaire under similar conditions as sighted individuals (Reid, 2000).
The SDS has already been applied to individuals with disabilities. For instance, it has been used in as study with students aged 13–18 with moderate to severe hearing impairment (Furlonger, 1998), with adolescents with visual impairment (Xiromeriti & Makris, 2000), and with adults with blindness, aged 21–60 (Winer et al., 1987). No study, however, has so far applied the SDS, Form R (Holland, Fritzsche, & Powell, 1994) to young adults with visual impairments. Neither has the SDS been used before to explore the influence of personal characteristics on the occupational possibilities for young adults with visual impairments.
The purpose of this study was to explore the range of occupational possibilities that according to the SDS most closely align with the personality types of young adults with visual impairments and to examine the influence of individual characteristics (vision status, gender, age, age at onset of visual impairment, level of education, ability of independent movement) on these occupational possibilities. The study is also designed to examine possible differences in SDS scores for the six types (RIASEC) between sighted adults and adults with visual impairments.
Method
Participants
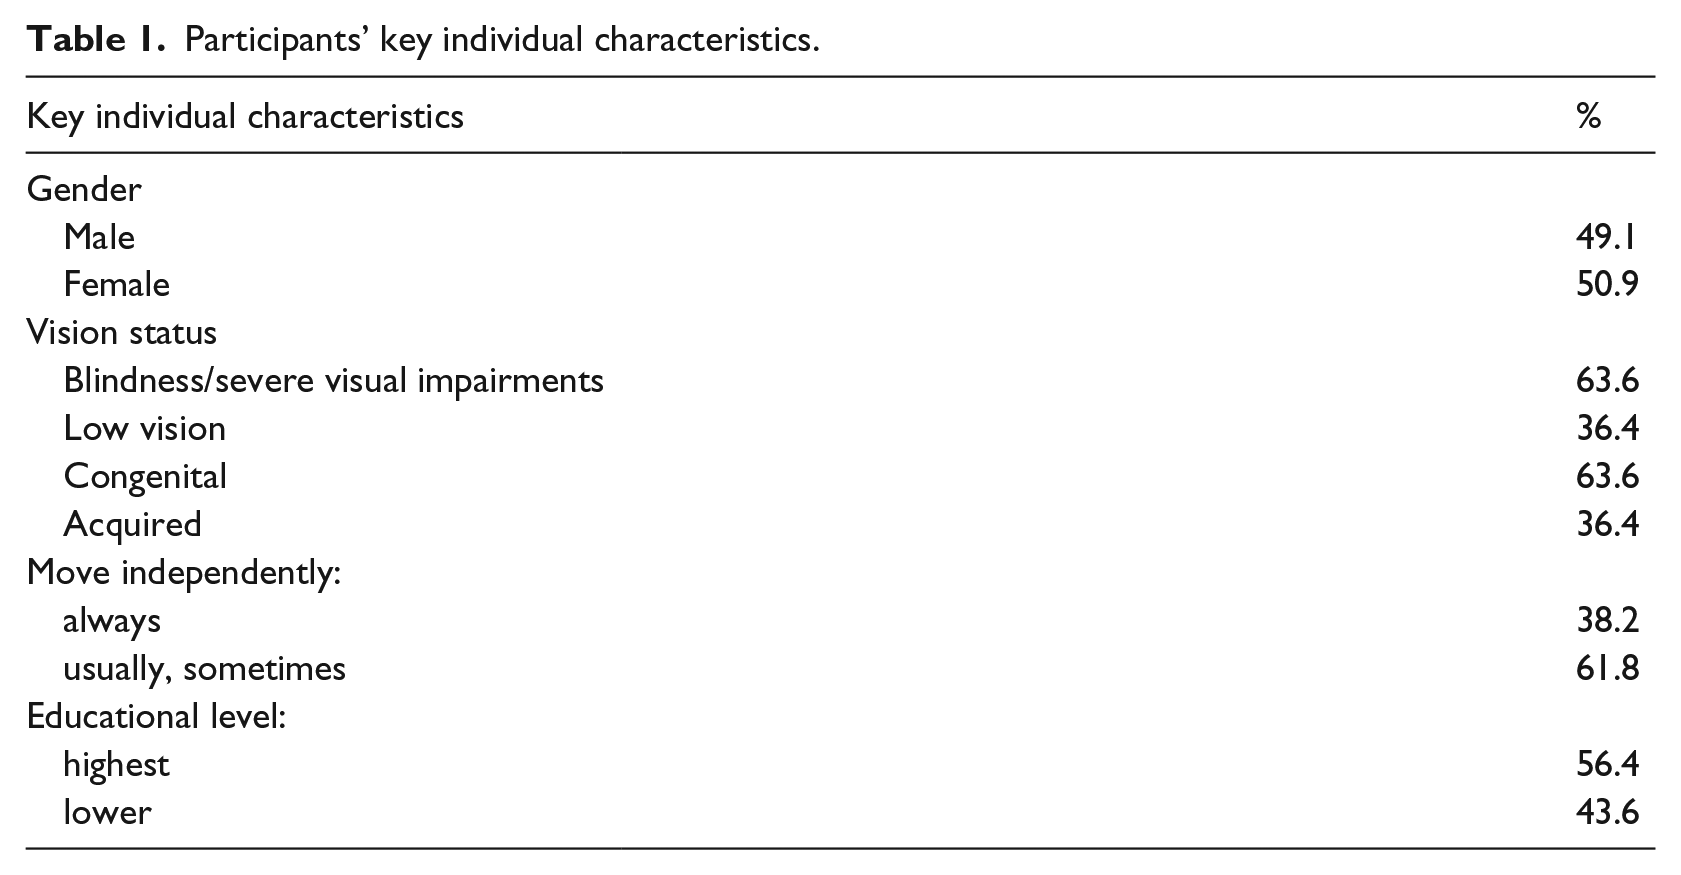
Fifty-five individuals with visual impairments took part in this study. The participants were in their early adulthood according to Erikson et al.’s (1959) theory of psychosocial development. The participants were recruited from the members of the Panhellenic Association of the Blind (Greece), which is the largest Organization of the Blind in Greece. Initially, a convenience sample, in terms of age, of 65 adults with visual impairments was contacted by phone, based on the contact information provided by the Panhellenic Association of the Blind, to invite them to participate in the study. From this group 55 (27 men and 28 women), young adults agreed to participate. The participants ranged in age from 24 to 40 (M = 32.98, SD = 4.585). Thirty-five participants (63.6%) had blindness or severe visual impairments (using Braille or text-to-speech systems) and 20 (36.4%) with low vision (using large-print and/or low-vision aids). The visual impairment was congenital for 35 (63.6%) participants and acquired for the remaining 20 (36.4%) participants.
In terms of education, 24 participants (43.6%) were high school graduates and 31 (56.4%) were higher education graduates. The participants were also asked to state the manner of their daily outdoor movements, by choosing one of the following: (a) with the assistance of a sighted guide, (b) sometimes myself and sometimes with the assistance of a sighted guide, and (c) myself, without any assistance.
In addition, the participants were asked to indicate the frequency of their independent movement using a 5-point Likert-type scale: always, usually, sometimes, seldom, or never. Twenty-one participants stated that they moved without the assistance of a sighted guide, and 34 said they moved sometimes with assistance, sometimes all by themselves. Moreover, 21 participants stated that they always move independently, 23 participants stated usually and 11 participants answered sometimes. It is noted that participants were asked at the beginning of the research process, before the completion of the research instrument, to report their individual/demographic characteristics. Participants key individual characteristics are shown in Table 1.
Participants’ key individual characteristics.
Procedures—instruments
The Researcher in this study followed the ethical principles of the Declaration of Helsinki. In addition, consent was obtained from the subjects, using the appropriate forms and according to the procedure suggested by the World Medical Association (2010).
The original form of the SDS Questionnaire, Form R, was used as the research instrument. Although the SDS was designed for high school students, college students, and adults (Holland, Fritzsche, & Powell, 1994), Holland, Powell, and Fritzsche (1994) found that adults were better able to interpret the results within the context of their life experiences. It is noted that self-knowledge, which is achieved through the coming of age, is more closely related than other abilities with the planning of individuals’ occupational future (Shearer, 2009).
The SDS was chosen over other measurement tools, as it can be completed, evaluated, and interpreted by the participants without assistance from an expert (Osborn, 2002), and it can be completed within 30–45 minutes (Furlonger, 1998; Osborn, 2002). The majority of SDS Questionnaire users are satisfied with the outcome, as they feel that it has high practical value (Reardon & Lenz, 1999). The SDS Form R is available in various forms, such as paper & pencil, electronic and online form (Lumsden et al., 2004; Osborn, 2002). In this study was chosen the written form of SDS Form R, 1994 and not the electronic version, as the electronic offers more limited career choices (Reardon & Lenz, 1999). In addition, the online form was not selected as there is no direct and personal contact with the participants, while at the same time the protection of the participants’ personal data is questionable when the SDS questionnaires are completed online (Sampson, 2000). It is reported, however, that according to surveys, the form of the SDS Form R to be used (written, electronic, and online) does not affect the overall result, so that the final three-letter code results independently of the chosen and used form (Lumsden et al., 2004). The factors that determine the choice of form of SDS Form R are the preference of the person concerned and the relative cost (Lumsden et al., 2004). The SDS Form R, Braille Edition (Holland, 1993) was not chosen as only 35 participants (63.6%) used Braille as means of reading.
The internal consistency reliability of the SDS-R is reported to range between .80 and .90, while the test–retest reliability between .70 and .80, according to studies that used the 1977 version of this tool (Daniels, 1994). For the paper-and-pencil version of the SDS-R, 1994 the KR-20 coefficients for scales in activities, skills and occupations ranged from .72 to .94 (Holland, Fritzsche, & Powell, 1994), while the correlations for test–retest reliability from .76 to .89 for a period of 4–12 weeks (Holland et al., 1997; Holland, Fritzsche, & Powell, 1994).
The SDS consists of four sections in which participants respond to items organized under each of the six letters of RIASEC. In Activities, individuals state whether specific activities interest them or not; in Competencies, whether or not they can perform specific activities satisfactorily; in Occupations, whether specific occupations interest them or not; and in Self- estimation, they rate themselves compared to other persons their own age on specific activities.
At the end of the SDS, individuals calculate the positive answers on each of the four sections separately for each of the six letters of RIASEC. Finally, a three-letter summary code is calculated from the highest SDS scores representing the Holland code (Holland, 1994a). Participants then search for their three-letter summary code in the Occupations Finder (Holland, 1994b), a list of occupations under all the combinations of the six letters of RIASEC, to find the type of RIASEC that represents them as well as the suitable occupations. For example, telephone operator and cashier are two occupations, among others, listed under the three-letter summary code CSE (Holland, 1994b).
The participants’ preference was to complete the questionnaire by phone, thereby eliminating travel time (as stated by them). The researcher administered the SDS for participants over the phone and calculated the three-letter summary code. The researcher also collected participants’ demographics including gender, age, age of onset of visual impairments, vision status, and the ability to move independently. The questionnaire took participants 30–40 minutes to complete.
Results
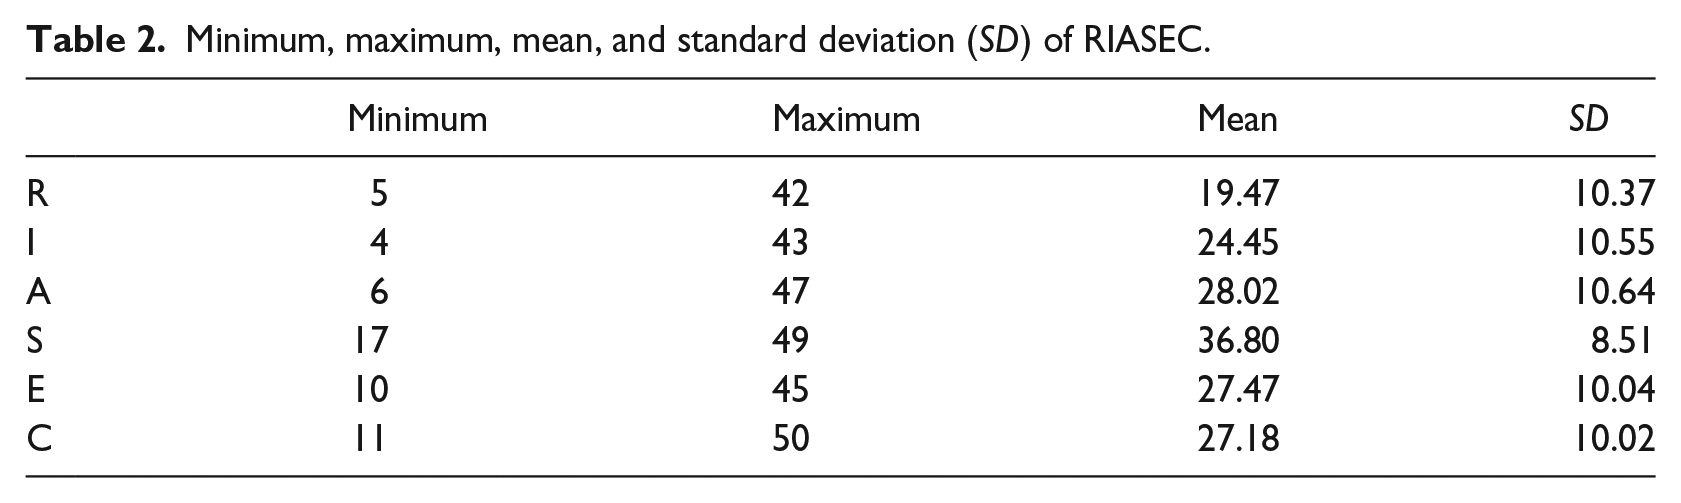
SDS results were calculated for each of the six types (RIASEC) (see Table 2), and the Holland three-letter summary code and corresponding occupational category were identified (see Table 3).
Minimum, maximum, mean, and standard deviation (SD) of RIASEC.
Holland codes and respective occupational categories.
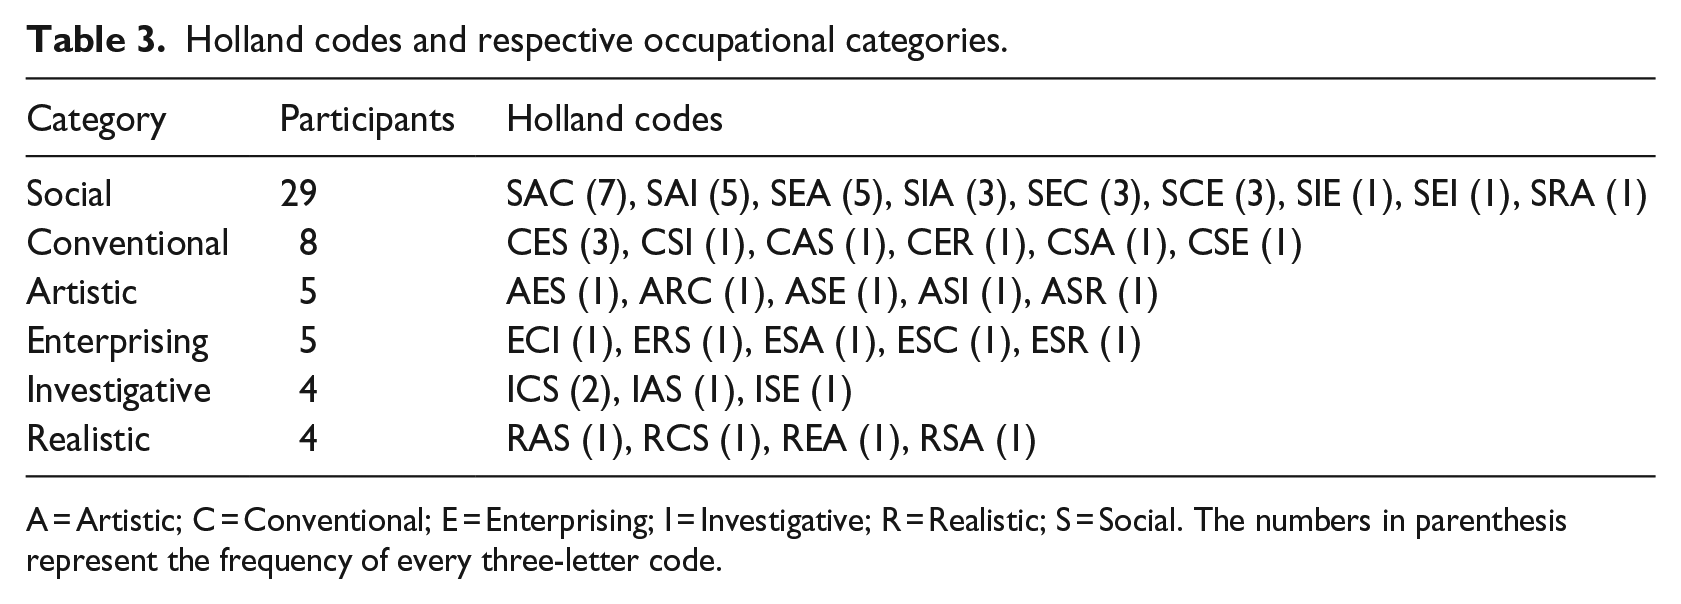
A = Artistic; C = Conventional; E = Enterprising; I = Investigative; R = Realistic; S = Social. The numbers in parenthesis represent the frequency of every three-letter code.
To determine the influence of individual characteristics on RIASEC, six linear multiple regression analyses were performed (see Tables 3 and 4), using vision status (blindness or severe visual impairments vs. low vision), gender (men vs. women), age, age at onset of visual impairments (congenital vs. acquired), frequency of independent movement, and level of education variables to predict RIASEC. Regression analysis was chosen to examine the relationship between more independent variables that was further applied to provide a detailed insight into the relationship of the above-mentioned individual characteristics on RIASEC.
Multiple regression for variables as predictors of R.
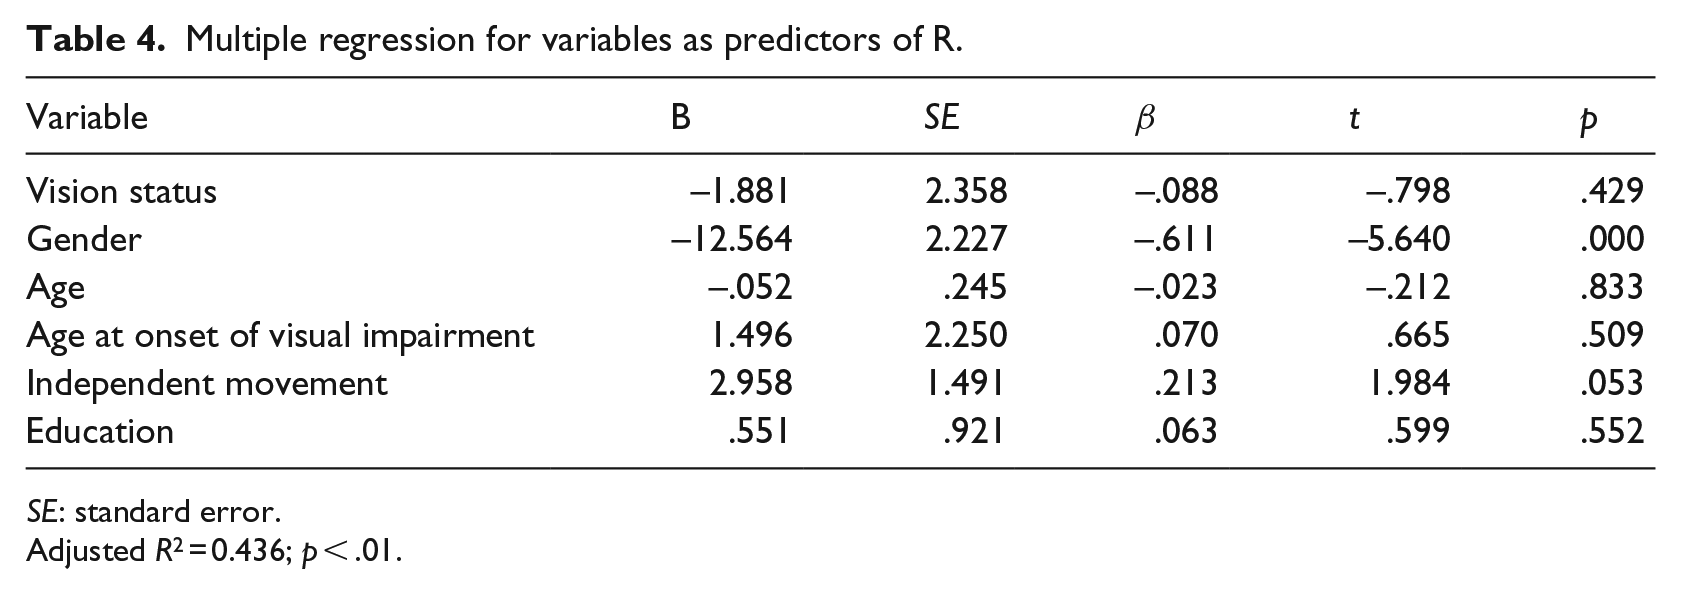
SE: standard error.
Adjusted R2 = 0.436; p < .01.
Multiple regression analysis of R (Realistic) characteristic yielded an adjusted R2 of .436 (F = 7.967, p < .01). Gender was a significant individual predictor of R (β = –.611, p < .01). Women scored lower on R in comparison to men. Results are shown in Table 4.
Analysis of I (Investigative) characteristic yielded an adjusted R2 of .438 (F = 8.027, p < .01). Significant individual predictors of I were vision status (β = –.284, p < .05), ability of independent movement (β = .257, p < .05), and level of education (β = .646, p < .01; see Table 5). Individuals who could move independently as well as those with a higher educational level demonstrated higher scores on I. Moreover, those with low vision demonstrated lower scores on I in comparison to individuals with blindness or severe visual impairments.
Multiple regression for variables as predictors of I.
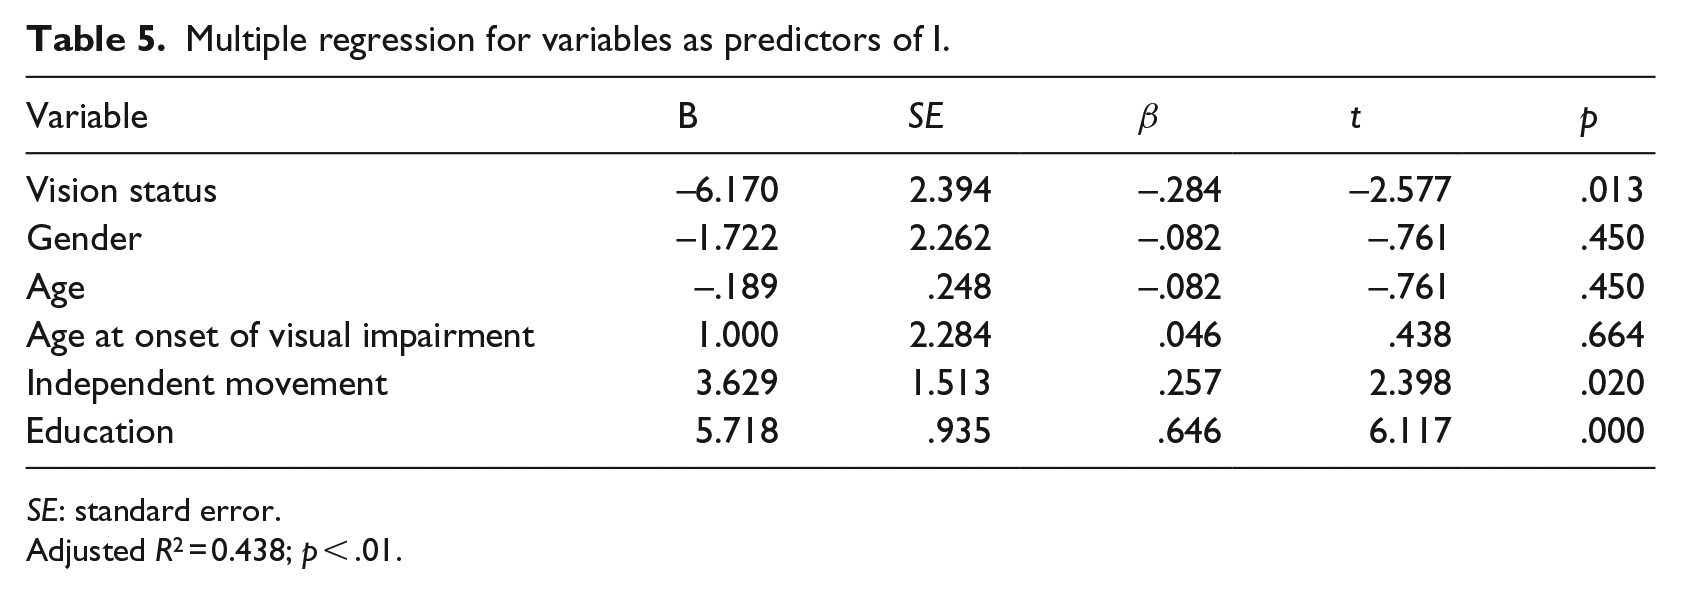
SE: standard error.
Adjusted R2 = 0.438; p < .01.
Analysis for the types A (Artistic), S (Social), E (Enterprising), and C (Conventional) revealed no significant individual predictors.
The researcher also calculated the distributions of high-point codes (first letter) according to the following variables: vision status (blindness or severe visual impairments vs. low vision), gender (men vs. women), age at onset of visual impairments (congenital vs. acquired), frequency of independent movement (always move independently vs. usually or sometimes), and level of education (higher education degree vs. lower level of education). From that comparison emerged differences between the different groups shown in Table 6. Moreover, from that comparison emerged differences between sighted adults and adults with visual impairments with regard to the six Holland categories, based on the normative data (Holland, Powell, & Fritzsche, 1994). Specifically, men with visual impairments showed higher percentages on A (Artistic), S (Social), and C (Conventional), and lower on R (Realistic), I (Investigative), and E (Enterprising) in comparison to sighted men. Women with visual impairments showed higher percentages on I and S and lower to the rest in comparison to sighted women. Table 6 presents the results.
Distributions (%) of high-point codes regarding the subjects of this study.
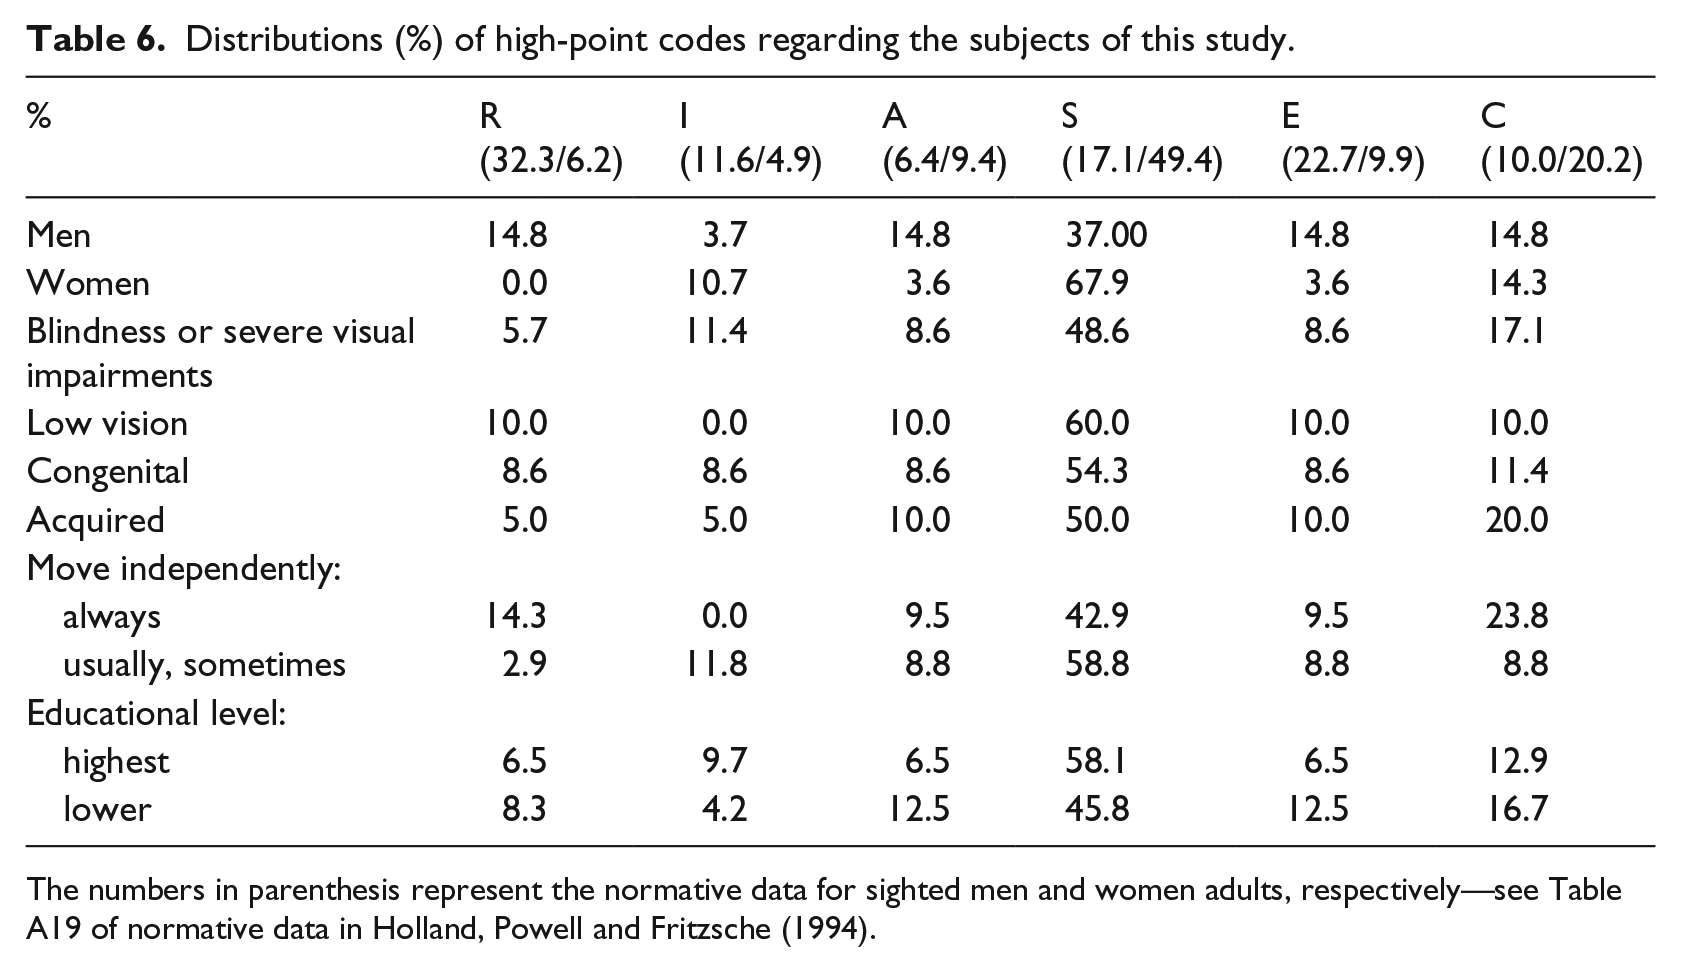
The numbers in parenthesis represent the normative data for sighted men and women adults, respectively—see Table A19 of normative data in Holland, Powell and Fritzsche (1994).
Discussion
This study examined the occupational possibilities that, according to the SDS, most closely align with the personality of adults between 24 and 40 years of age with visual impairments and the influence of individual characteristics (vision status, gender, age, age at onset of visual impairment, level of education, and ability of independent movement) on these occupational possibilities.
The findings are based on Holland’s model that includes the realistic, investigative, artistic, social, enterprising, and conventional types, collectively known as RIASEC (Holland, 1997). The realistic type is interested in realistic occupations such as helicopter pilot auto mechanic and electrician, the investigative type in investigative occupations such as biologist, chemist, and physicist, and the artistic type in artistic occupations such as playwright, actor, and musician. The social type is interested in social occupations such as social worker, career counselor, and high school teacher, the enterprising type in enterprising occupations such as sales person, business executive, and legislator, and the conventional type in conventional occupations such as bank teller, financial analyst, and computer operator (Holland, 1994a). There are a set of personality traits which relates to the six types. For example, the realistic type is characterized as practical and conforming, with manual but not social skills; the investigative type as analytical, methodical, and critical; the artistic type as creative, nonconforming, and impulsive; the social type as idealistic and responsible, with social but not manual skills; the enterprising type as extroverted, energetic, and adventurous; and the conventional type as practical and conforming, with technical but not artistic interests (Gottfredson & Holland, 1990; Holland, Powell, & Fritzsche, 1994).
The findings reveal the prevalence of S (Social) on the scores for each of Holland’s six types (Table 2). Also, the summary codes (Table 3) show that most of the codes relate to social occupations (n = 29, 52.7%), followed by conventional (n = 8, 14.5%), artistic (n = 5, 9.1%), enterprising (n = 5, 9.1%), investigative (n = 4, 7.3%), and realistic occupations (n = 4, 7.3%).
These results agree with the findings of Winer et al. (1987), in which the social type had the highest means among adults with blindness. The dominance of the social type was attributed to the discrimination of employers and to the lack of role models that ultimately lead blind adults to traditional employment choices in social fields (Winer et al., 1987).
These findings, however, are not consistent with other studies (Furlonger, 1998; Xiromeriti & Makris, 2000) applied to adolescents with hearing impairments (Furlonger, 1998) and to adolescents with visual impairments (Xiromeriti & Makris, 2000). Specifically, in the study by Furlonger (1998), individuals scored significantly lower than their hearing peers particularly on the social category of the questionnaire. This finding was mostly attributed to the increased communication capabilities required by social occupations compared to other categories of occupations (Furlonger, 1998). The difference between the findings of this study and the study by Furlonger (1998) in regard to the dominant occupational type of SDS is probably due to the different type of impairment of the two samples and the different obstacles and needs of each impairment.
In addition, in the research of Xiromeriti and Makris (2000) participants scored higher on the artistic category than on the social category. The differences regarding the dominant occupational type between this study and the aforementioned studies (Furlonger, 1998; Xiromeriti & Makris, 2000) can also be attributed to the different range of ages of the samples. This study is addressed to young adults, so their choices could be influenced by greater maturity and confidence, which according to Xu and Martz (2010) are implied for older individuals with impairments.
Regarding the influence of individual characteristics (vision status, gender, age, age at onset of visual impairments, frequency of independent movement, and level of education) on the individual personality types, findings revealed that only R (Realistic) and I (Investigative) yielded a statistically significant adjusted R2, as for A (Artistic), S (Social), E (Enterprising), and C (Conventional), the analysis revealed no significant individual predictors (Tables 3 and 4). Gender was a significant individual predictor of R (Realistic), and ability of independent movement was close to significant (β = .213, p = .053). So, there is a tendency for individuals who can move independently to demonstrate higher scores on R.
Significant individual predictors of I were vision status, ability of independent movement, and level of education. In addition, according to the results, individuals who were able to move independently demonstrated higher scores on R (Realistic) and I (Investigative), whereas individuals with a higher educational level demonstrated higher scores on I. However, women scored lower on R, and individuals with low vision scored lower on I.
Age and age at onset of visual impairment were not found to be significant individual predictors for any of the six letters (RIASEC). Although, according to Holland, Powell, and Fritzsche (1994), age appears to have an effect on individuals’ interest in occupations, as older sighted individuals do not show considerable interest in occupations that require physical energy or may be hiding some risk for their physical safety, the SDS summary scales were not found to be generally correlated with age (Holland, Fritzsche, & Powell, 1994). It is possible that in this study age had no significant correlation for any of the six letters, as the sample was strictly young adults and in this specified range of age significant differences are not expected to be found. In addition, there is no research about the age at onset of visual impairment having influence on the results of SDS, although in general, other findings support a connection between early onset of visual impairment and better employment possibilities for individuals with visual impairments (La Grow, 2004b).
In regard to gender, which appears to be a significant individual predictor of R (Realistic), women with visual impairments scored lower on the realistic category. According to Holland, Powell, and Fritzsche (1994), the realistic type is interested in lower status, lower paying, and lower education occupations, such as automobile mechanic, farmer, and electrician that include physical skills and the use of machines and tools. The increased required physical abilities may help explain the lower realistic scores of women on the SDS, as women with visual impairments may not perceive they have the skills and competencies to be employed in those fields.
Generally, the realistic category displays one of the largest differences in the mean SDS scale and code which appears to be related to gender, as the realistic occupational category is the only category with an item endorsement rate of less than 10% for women (Holland, Fritzsche, & Powell, 1994). This difference can be attributed to intense gender stereotypes and to the cultural and personal environment that treats men and women differently (Holland, Fritzsche, & Powell, 1994; Holland, Powell, & Fritzsche, 1994). That is probably the reason why women are often led to traditional occupational choices such as social occupations and do not choose traditionally male occupations such as realistic ones. This consideration can be verified by the frequency distributions of the scores of men and women on the realistic and social categories in the norms for SDS scales and codes (Holland, Powell, & Fritzsche, 1994). In addition, women with disabilities appear to face double discrimination in the labor sector not only due to their gender but also to their disability (Baldwin & Choe, 2014; Mondéjar-Jiménez et al., 2009; Myers & Sai, 2015; U.S. Department of Labor, Women’s Bureau, 2015). So, women with visual impairments who participated in this study may have scored lower on the realistic category as they could have been more discouraged by labor barriers or stereotypes they already have faced and/or confronted.
Moreover, level of education was found to be a significant individual predictor of I (Investigative), with individuals with a higher level of education scoring higher on I. In general, a person’s educational level and its degree of congruence with the level of education of the environment in which the person lives or works has been found to affect that person’s performance and satisfaction (Holland, 1997). When there are discrepancies (e.g., a person may have a high degree of education for an occupation that requires a college degree or vice versa), then the results are dissatisfaction and problematic performance (Holland, 1997). According to Holland, Powell, and Fritzsche (1994), the I category is correlated with high educational level and high intelligence. The investigative type is interested in occupations such as chemist, geologist, and biologist that require mathematical and scientific abilities (Holland, Powell, & Fritzsche, 1994). The increased required scientific abilities of the I category may help explain the participants’ higher investigative scores on the SDS, as the majority of participants (56.4%) had a higher education degree and may have perceived that they have the skills and competencies to be employed in more challenging and demanding fields. Generally, the investigative category displays one of the largest differences that appear to be related to education (Holland, Powell, & Fritzsche, 1994).
In addition, vision status was found to be a significant individual predictor of I (Investigative). It is noted that individuals with low vision scored lower on I as compared to those with blindness. This was an unexpected result and needs further research, as so far there has been no research specifically about the influence of the vision status on RIASEC.
With regard to the ability to move independently, which appears to be a significant individual predictor of R (Realistic), it is noted that participants who could move independently demonstrated higher scores on R. In general, the realistic type is interested in occupations such as electrician, farmer, and forester (Holland, 1994b; Holland, Powell, & Fritzsche, 1994). As it emerges, realistic occupations are mainly practical occupations. So independence in movement for the R category probably could be more important in comparison to the other five categories for young adults with visual impairments to be able to practice those occupations.
Moreover, the researcher calculated the distributions of high-point codes (first letter) according to the aforementioned variables. From that comparison emerged differences between sighted adults and adults with visual impairments with regard to the six categories. In particular, men with visual impairments showed higher percentages than sighted men on A (Artistic), S (Social), and C (Conventional) codes. Women with visual impairments showed higher percentages than sighted women on I (Investigative) and S (Social) codes (Table 6). These results show partial consistency with the norms for SDS categories and codes (Holland, Fritzsche, & Powell, 1994), where men are more likely to obtain R (Realistic), E (Enterprising), and S (Social) codes, and women are more likely to obtain S (Social), C (Conventional), and E (Enterprising) codes. These differences could be attributed to the comparison between adults with visual impairments from Greece and sighted adults from the United States (based on the normative data). The normative data summarize the way American culture has influenced the answers of the two genders (Holland, Fritzsche, & Powell, 1994) that could be far from the way the culture of Greece has influenced the answers of men and women from Greece.
A limitation of this study may be the previously cited comparison between adults with visual impairments from Greece and sighted adults from the United States (based on the normative data). Α comparative study between adults with visual impairments and sighted adults from Greece is suggested for future consideration. In addition, the administration of SDS through phone could be considered a limitation, as the participants might have wanted to give a good impression by exaggerating their skills and competencies, as this is not a registered way of applying SDS Questionnaire. This specific way of administration, however, was a requirement of the participants to participate in the research, as they were professionally active and had little time at their disposal. There are a number of studies on different topics, where questionnaires and interviews are administered over the phone. According to Ahles et al. (2004), the administration of questionnaires over the phone has been shown to increase data collection levels. Wu and Wang (2005) in their research have also administered interviews either on-site or by phone with no further implications for the validity of their results. Implications are not mentioned even within the same sample some participants are interviewed in-person and some over the phone, as in the study of Van Orden et al. (2012). Another possible limitation is the application of multiple regression analyses on a sample of 55 individuals, using 6 predictors. Harrell (2001) suggested that 10 individuals per predictor was the minimum required size for samples used on linear regression models. A larger number of participants also would allow to draw more tangible conclusions.
The preliminary findings of this study suggest that occupational possibilities resembling to the personality of young adults with visual impairments derive from each of the six categories, showing that no categories are excluded regarding career choices. Vocational counselors and rehabilitation specialists could use this important finding when providing their services. Of equal importance is the finding that shows the dominance of the social category to occupational possibilities. This could be a result revealing the skills, interests, and capabilities of young adults with visual impairments, but it also could be a result affected by prejudices and stereotypes regarding these skills and capabilities, consisting of a “safe” occupational option for them. Moreover, the results of the questionnaire of Holland that reveal the most suitable occupations for individuals with visual impairments may be an important step in shaping vocational guidance for these individuals in the direction of making vocational choices that match their interests and personality.
A trigger for thought for vocational counselors and rehabilitation specialists who, based on the findings of this study, could focus more on practices that could encourage young adults with visual impairments, as well as adolescents with visual impairments during their transition stages, to explore and exploit their strengths. The message, as shown by the results of SDS, should be that no vocational categories are excluded due to their impairment. Rehabilitation specialists and vocational counselors should consider how to approach youth with visual impairments that are likely to be affected by stereotypes in regard to their vocational choices. In addition, they should develop policies and practices to encourage youth with visual impairments to activate their strengths despite these stereotypes, based on youth’s own appraisal of their skills, capabilities, and interests. To that direction, the findings on the influence of the characteristics of individuals with visual impairments on their occupational possibilities, as well as the differences between them and sighted adults regarding the SDS scores, provide data on the parameters that vocational experts could consider when providing assistance. As a result, a successful career path can be ensured by meeting labor market needs and also simultaneously exploiting individuals’ potentials (Erin, 2010).
Footnotes
Declaration of conflicting interests
The author(s) declared no potential conflicts of interest with respect to the research, authorship, and/or publication of this article.
Funding
The author(s) received no financial support for the research, authorship, and/or publication of this article.
